Abstract
This paper addressed the problem of oil diagnostics lubricants applied to the predictive maintenance of industrial gearboxes, proposing the integration of an artificial intelligence (AI) system into the process analysis. The main objective was to overcome the critical issues of the traditional method, characterized by long analysis times and a marked dependence on the subjective interpretation of operators. The method includes a detailed statistical analysis of the common ways to assess the condition of lubricants, such as optical emission spectroscopy, particle counting, measuring viscosity and density, and Fourier-transform infrared spectroscopy (FT-IR). These methods are then combined with an artificial intelligence model. Tested on commercial gearbox data, the proposed approach demonstrates agreement between IA and expert evaluation. The application has shown that it can effectively support diagnoses, reduce processing time by 60%, and minimize human errors. It also improves knowledge sharing through an increase in the stability and repetitiveness of diagnoses and promotes consistency and clarity in reporting.
1. Introduction
The reliability and efficiency of industrial mechanical systems depend to a large extent on the maintenance strategies adopted. In recent years, predictive maintenance has taken on a key role in plant management, helping to reduce downtime, optimize resource allocations, and improve operational safety and continuity [1,2]. Lubricating oils play a key role in this context, as they perform many fundamental functions, such as friction reduction, heat dissipation, contamination control, and corrosion protection [3,4,5]. Their condition is often indicative of the health status of equipment: through a targeted analysis, it is possible to identify and potentially prevent anomalies related to wear, overheating, or contamination, which could compromise the performance and safety of machinery.
Condition monitoring techniques, as defined by ISO standards [6], involve the continuous or periodic assessment of equipment or systems to identify potential issues or predict failures. As mentioned by Wakiru et al. [2], among the main condition monitoring techniques are vibration analysis, acoustic emission thermography and ultrasound and lubricant analysis.
Lubricating oil analysis is a key element of condition-based maintenance, an approach that involves performing interventions on the basis of the actual state of equipment rather than on fixed maintenance intervals [7]. Oil analysis can provide information about machine wear conditions, lubricant contamination and lubricant status. The presence and quantity of debris and particles from worn components and contamination can provide valuable information on useful service life consumption and issues affecting performance and reliability. By analyzing and monitoring data over time, it could be possible to schedule maintenance before a critical failure occurs.
In the recent literature, lubricating oil has been increasingly recognized not only as a consumer product but also as a diagnostic medium capable of capturing transient phenomena within gearboxes and other critical components. As reported by Mobley [8], oil analysis can be considered one of the most powerful techniques for the early detection of faults in mechanical systems, offering the possibility to detect problems well before traditional vibration or acoustic techniques become effective. In addition, research by Asadi et al. [9] highlighted how the systematic monitoring of physical and chemical properties of oil such as viscosity, particle number, and additive depletion can significantly increase the accuracy of health assessments in industrial gear units.
Integrating oil analysis into structured diagnostic workflows allows for a broader understanding of system behavior. Through historical trend analysis and cross-referencing with other condition monitoring data, lubricating oil analysis can serve as a keystone for data-driven maintenance decision frameworks. In this context, the standardization of report formats, interpretation guidelines and data acquisition protocols remains a critical area of interest to ensure consistency and comparability across systems and industries. The development of artificial intelligence systems that can learn from these structured workflows could further improve diagnostic capabilities, especially in environments with a limited availability of experts or high need to provide reports.
Currently, this analysis is usually performed using semi-automatic methods that need experienced operators to evaluate the results and data collected from laboratory measurements. This method is well defined but is characterized by the long time needed to make diagnoses, the possibility of human error, strong dependence on the experience of the operator, and limitations in complex connections detectable. These limitations can lead to insufficient capability in the number of analyses that can be performed and consequently to limited coverage on the equipment installed, usually driven by the presence of specific risk factors or failure detection. This makes the large-scale deployment of condition-based maintenance approaches expensive and difficult and the diagnostic process less effective overall [10]. The limitation in condition-based maintenance can be overcome by automating analysis and improving diagnostic reliability in line with what is happening with the introduction of AI in some fields [11,12,13]. It has been shown that artificial intelligence can be used to analyze large amounts of data from different instruments and heterogeneous sources, which historically have been extremely complex to sustain in real industrial applications [14,15]. AI is, in particular, interesting regarding its ability to provide diagnoses that can be comparable to experienced expert evaluations and is an open and highly focused issue in the current scientific literature [16,17,18,19,20].
In recent years, numerous studies have highlighted the potential of AI for predictive maintenance, with applications ranging from vibration analysis to machine learning model-based diagnostics [21,22,23,24,25].
However, the use of AI for lubricating oil analysis is still an evolving field of research, with some open challenges, such as the need for reliable datasets, the definition of precise diagnostic thresholds and its integration with existing maintenance management systems.
In this scenario, the present study aims to develop an innovative AI-based approach for the predictive analysis of lubricating oils in industrial gearboxes. The aim is to provide reliable and timely diagnostics, improving the ability to detect wear-related anomalies and the contamination and degradation of the lubricant.
2. Materials and Methods
The framework adopted for the development of this study is illustrated in Figure 1. It was constructed starting from real-world datasets derived from condition monitoring reports of industrial gearboxes. These datasets include oil sample analyses encompassing physical and chemical properties—such as viscosity and density—as well as elemental concentrations expressed in parts per million (ppm). Each record is associated with relevant metadata, including lubricant type, total operating hours of both lubricant and machinery, and a corresponding diagnosis provided by an industry expert.
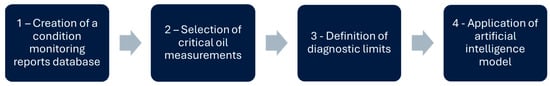
Figure 1.
Analytical framework.
In particular, Step 1 focused on the identification of critical parameters for the evaluation of oil conditions, in alignment with current diagnostic methodologies. This was followed by Step 2, which entailed the definition of threshold limits to support diagnostic classification.
These limits were determined using the international standards ASTM D7720-11 [26] and further refined through statistical and change-based approaches, including boxplot analysis for outlier detection and normality testing via probability plots.
In Step 3, efforts were directed towards the creation of a unified database capable of integrating laboratory measurements with user analysis requests.
Finally, Step 4 involved the development of an artificial intelligence (AI) model to automate the diagnosis of oil samples. The model was trained on historical data validated by domain experts and was designed to detect patterns related to normal behavior, early warnings, and failure scenarios. The ultimate objective was to replicate expert-level diagnostic assessments and enhance predictive maintenance strategies with robust, data-driven insights. The following subsections analyze in depth the steps used to develop the case study.
2.1. Creation of Condition Monitoring Report Database
The initial and essential phase in the data processing process is pre-processing. In order to make raw data compatible with later analysis algorithms, it is first of all gathered, cleaned, integrated, and normalized. Proper pre-processing reduces errors, removes anomalies, and unifies information from different sources, thus creating a reliable and structured database [27].
In the context of our study, pre-processing has taken on particular importance as the historical data useful for diagnosis comes from two different databases. The integration of the two databases is generally considered to be a component of pre-processing data, specifically in the data integration phase. In other words, while pre-processing includes all the cleaning, transformation, normalization, and integration operations necessary to prepare data for analysis, data integration focuses in particular on combining information from heterogeneous sources to create a coherent and comprehensive database [28,29].
The analysis of lubricant condition requires combining data from two databases: a Laboratory Information Management System (LIMS) and a Customer Portal (with application info). These sources provide essential information, such as analytical parameters, sampling information, and operational data. The integration of these sources is necessary to obtain a comprehensive overview of the lubricant’s operating and maintenance conditions. Power Query in Excel is used to effectively merge the information, allowing for import and transformation, error and duplication removal, and the merging of datasets using a common key (such as the encoding of the analysis). The coding of the analysis serves as a unique identifier for each analysis performed. Using this key, it was possible to merge the data, linking the information extracted from the two databases. In this way, each record was enriched with all the relevant information, guaranteeing coherence and completeness, which are indispensable for the successive stages of elaboration and diagnostics. One key aspect of the pre-processing phase is the continuous updating of the database.
2.2. Selection of Critical Oil Measurements
The analysis of a lubricating oil is structured around three main categories (Figure 2) [13]: fluid properties analysis, contamination analysis, and wear analysis.
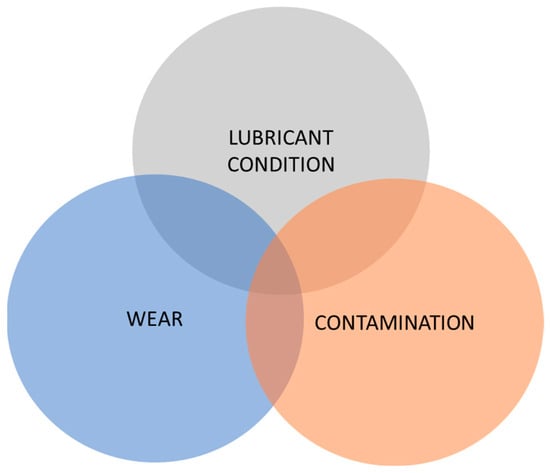
Figure 2.
Areas of study in oil analysis.
Fluid properties analysis focuses on the evaluation of chemical–physical properties and additives in the lubricant. Its main objectives are to estimate the remaining lubricant’s service life and verify that the correct lubricant has been used. It can also detect mixtures with different oils. In this case, the data we have selected relate to the presence or quantity of phosphorus, zinc, calcium, boron, and magnesium, which represent the typical elements present in additives for reducing lubricating oils and can be detected by Rotating Disk Electrode (RDE) spectrometry. The density at 15 °C and viscosity at 40 °C and 100 °C, which are the most important properties of a lubricating oil, were also considered [30].
The contamination analysis evaluates the presence and level of contaminants of foreign substances that can enter the lubricant and machine from the environment. As largely described in the literature [31,32], contamination compromises the reliability of the machine and accelerates lubricant degradation. The indicators selected were silicon, sodium, and vanadium.
The wear analysis evaluates the debris in the form of microscopic particles generated by machine components that become worn. The lubricant, being inserted between the friction surfaces, is the first to collect this debris. Monitoring and analyzing these particles allow for the detection of ongoing wear, facilitating timely maintenance decisions. It is well known in the literature that the evaluation of wear in gearbox applications deals with extremely complex phenomena also related to effective contact surface and nonlinear dynamic effects [33,34]. This paper does not directly consider these issues because the approach to evaluating wear in internal gear components relies on measuring several basic parameters, including the presence of copper, iron, and chromium [30], which are related to the consequences of wear dynamics. Another indicator considered is the total amount of ferrous material FeC (ferrocheck) [35,36].
In addition, to obtain an accurate analysis, it is essential to correctly consider the technical data related to the oil and machine in a traceable way, including essential information such as the following:
- Analysis ID: This is required to identify each sample analyzed uniquely. Its function is essential to ensuring the traceability and correct association of data with the respective machines and operating conditions.
- Gearbox series: This identifies the series to which the reducer belongs. This information is particularly important because reducers from different series can be made of different materials and lead, at the time of analysis, to misinterpretations when, for example, wear is analyzed.
- Gearbox serial number: The serial number identifies the gearbox. Making an analogy with the world of medicine, we can say that it represents the name and surname of the reducer.
- The date of sampling in which the oil was removed from the reducer: This is one of the most important pieces of information because it allows us to study the history of gearboxes. In fact, oil analyses are often based on comparisons with historical data. An incorrect date can alter the trend of parameters over time, leading to wrong assessments on oil degradation or machine wear.
- The type of oil: Each lubricant has different chemical–physical characteristics that affect the performance of the oil itself and therefore of the machine. Without knowing the type of oil, it is difficult to determine whether the values are normal or if the correct oil has been used.
- Hours of oil usage: This indicates the time of use of the oil since the last significant change or top-up. This is crucial for assessing lubricant degradation and component wear. In fact, an abnormal increase in contaminants or wear metals compared to operating hours may indicate an imminent mechanical problem.
- Machine hours: This parameter indicates the total operating time of the machine.
- Refueling: This refers to the addition of oil in the system to compensate for leakage, evaporation, or natural consumption during operation. This parameter is important because it impacts oil quality and machinery condition diagnosis.
Once the data are collected and selected, the statistical analysis is carried out.
2.3. Definition of Diagnostic Limits
Limits, as well as alarms, play a key role in monitoring and managing the operating conditions of equipment and lubricants. First, they define operational standards, establishing acceptable values for critical parameters such as those seen in the previous paragraph. They also allow the early identification of anomalies by detecting when a parameter exceeds the maximum value or falls below the minimum, so that potentially critical situations can be identified at an early stage. This ability to detect deviations is particularly useful because it provides important support for maintenance decisions. When the data approach or exceed the set limits, it is possible to plan preventive interventions, thus preventing minor problems from evolving into costly failures. In parallel, the use of limits contributes to performance optimization: by keeping key parameters under control, you reduce stress on components and prolong the operating life of your systems, ensuring greater efficiency. An additional benefit is the reduction in costs and risks, as accurate monitoring enables timely intervention, minimizing major damage, machine downtime, and potential safety problems.
Figure 3 presents an illustrative diagram related to the study of threshold values. As the first step, the dataset was divided into three areas of interest—wear, lubricant, and contamination—following the approach outlined in the previous paragraph.
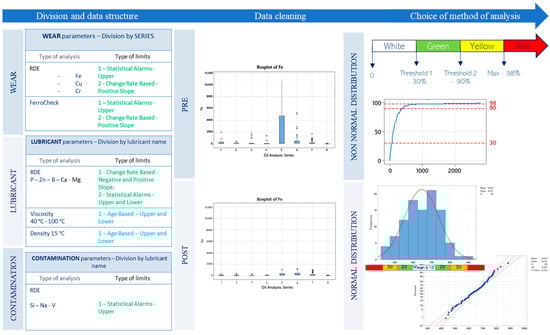
Figure 3.
The framework used to identify the limits.
In particular, the statistical analysis on wear was carried out by grouping the gearboxes by series to obtain a population composed exclusively of elements with the same mechanical behavior and made of the same materials (e.g., series made of steel rather than series with bronze crowns). The analysis was carried out on a total of 290 reducers, coming from 8 different gearbox series, each containing a minimum of 15 and a maximum of 150 elements.
Unlike wear metals, which result directly from machine operation, additives and contamination are intrinsic to the lubricant, and their concentration depends solely on the product formulation. For this reason, we have chosen to stratify the data by type of lubricant, ensuring a more meaningful comparison.
Simultaneously, the type of diagnostic limit was selected based on the nature of each analysis, in accordance with the methodology outlined by Fitch et al. [3]. Two main alarm strategies are employed: proactive alarms and predictive alarms. Predictive alarms signal abnormal machine conditions or the beginning of wear and failure. They are in line with the objectives of predictive maintenance, which is the early detection of symptoms of machine failure rather than root causes (proactive maintenance). Within the predictive domain, the following alarm techniques are used in oil analysis:
- Change rate-based: Rate-of-change alarms are generally set up to measure properties that vary as the oil is used. The rate is typically calculated as a function of machine hours or oil hours and corresponds to the slope of the line of ppm with respect to hours. For example, in the case of wear elements, the total ppm value will be divided by machine hours to give an indication of how many ppm/hour were generated by the system during its operation, while in the case of additives, the values will be divided by oil hours. This consideration is fundamental because some parameters may be below absolute levels yet still exceed the rate of increase, which could lead to early wear.
- Statistical alarms: Statistical limits are the most important and simple. This provides a sufficient amount of data to be representative of the machine and oil. The approach involves generating a standard mean and distribution from the available data and comparing these with the values from the sample under analysis. The ASTM D7720 standard [26] provides guidelines on how to set limits and their level of attention. In particular, there are four levels of attention: white, green, yellow, and red. The document describes two main methods for establishing and updating alarm limits: statistical process control (SPC) and cumulative technique. SPC is based on statistics to assess control limits in data that follow a normal distribution. Limits are calculated based on standard deviation from the population average of the data: if the value is within a standard deviation from the average, it is considered normal (white). If it falls outside of a standard deviation from the mean but is within two deviation standards, is considered a warning (green). If the result exceeds two standard deviations, the value is considered in a critical alarm because it is higher or lower, depending on the cases, to 95% of the population. If the value exceeds three standard deviations, the situation is really critical, as the value exceeds about 99% percentile of the population. However, this approach is applicable to a normal distribution. In case of non-normal distribution, the standards propose to use the technique of cumulative distribution. Unlike SPC, cumulative distribution is not based on an assumed statistical model but sorts the data according to actual observed values, creating a percentage distribution. The resulting curve represents the cumulative probability, which indicates the percentage of data below a given value. This technique is suitable for data with non-Gaussian distributions, such as oil contamination, wear and chemical degradation. ASTM D7720 describes different types of cumulative distributions, depending on the nature of the data.
In contrast, the main goal of proactive alarms is to establish optimal benchmarks and keep the lubricant within these values to ensure proper machine operation. Proactive alarms are set to improve performance compared to the past, for example, by keeping the lubricant cleaner, drier, or at a lower temperature and ensuring stable operating conditions, preventing the lubricant from exceeding limits that have been previously identified as optimal for system operation. Within the proactive domain, the following types of alarms and limits are used:
- Goal-based limits: Targets apply to the control of parameters such as contamination, viscosity, and density. A goal-based limit is set with a specific objective, not necessarily related to the aging of the oil, but rather to maintaining optimal conditions to improve machine performance. In summary, the goal-based limit is an ideal value to maintain to maximize the performance and reliability of the machine.
- Aging limits: Another type of limit or proactive alarm concerns the progressive aging of a lubricant [3]. In fact, all lubricants are subject to aging, and therefore, the chemical–physical characteristics can deteriorate more or less slowly. For example, imagine having a lubricant for an industrial gearbox with a nominal viscosity of 320 cSt at 40 °C. To ensure optimal performance and reduce the risk of wear or malfunction, an acceptability range of about 10% around the nominal value is established. The objective of aging limits is to keep the lubricant in ideal conditions, intervening when significant variations occur that could compromise the protection and efficiency of the machinery. If the values are close to the limits, corrective actions such as an oil change, filtration, or more in-depth analysis can be taken to identify the causes of the change.
As the second step of the methodology, boxplots were generated to identify potential outliers—data points that deviate significantly from the rest of the dataset. The removal of these outliers had a substantial impact on the subsequent analysis.
Prior to data cleaning, the presence of extreme and anomalous values negatively affected the statistical representativeness of the parameters under examination, introducing distortions and reducing the reliability of alarm threshold identification. Retaining such anomalies could have compromised the definition of effective diagnostic limits, making them either too restrictive or excessively permissive depending on the outlier distribution.
At this point in Step three, we have chosen the method of analysis following what is described in ASTM D 7720, both for normal and non-normal distributions of data. In particular, the methodology used for the normally distributed data calculates the thresholds using means and standard deviations. For the non-normally distributed data, the methodology employs percentile-based evaluation.
2.4. Application of Artificial Intelligence Model
In this work, the AI system used for diagnostic purposes is based on the ChatGPT version o1 language model, in particular version o1, developed by OpenAI [37,38,39]. This model belongs to the family of Large Language Models (LLMs) and has been trained on a vast corpus of textual data, allowing human-like responses to be understood and generated in a wide range of technical and contextual areas. The diagnostic workflow implemented in this study uses natural language understanding and model generation capabilities and is described in Figure 4 and will be described in detail in Section 2.4.1, Section 2.4.2 and Section 2.4.3.
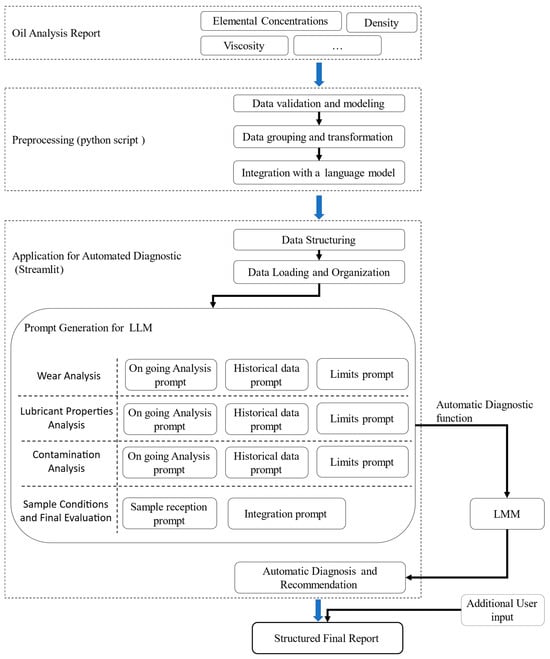
Figure 4.
Diagnostic workflow.
The process begins with the structured input of technical data derived from oil analysis reports (e.g., elemental concentrations, viscosity, density, and other key parameters). These data are formatted as descriptive prompts and sent to the AI model, which is responsible for producing a diagnostic interpretation in natural language. The output generated is then compared with expert assessments provided by a human operator. The degree of agreement between AI-generated and expert diagnoses is used to assess model performance and consistency in different diagnostic sections. This approach does not involve training or fine-tuning the AI model to specific domain data; instead, it evaluates the diagnostic capabilities of a generic LLM when guided through prompts accurately tailored to the lubrication domain.
2.4.1. Pre-Processing
To automate the organization and preprocessing of raw oil analysis data, a Python 3.11.3 script was developed with the objective of ensuring data consistency, structure, and readiness for subsequent analysis and model training. The process is composed of three components: data validation and modeling, data grouping and transformation, and integration with a language model.
Data validation and modeling employs the Pydantic library to define strongly typed data models that validate the structure and format of each data entry. This validation step transforms rows from a raw DataFrame into structured Python objects, enhancing reliability and facilitating further processing. Three primary data classes were implemented:
- Result: Represents a single oil analysis entry, including fields such as ID, sampling date, lubricant and machine hours, diagnosis, and elemental concentrations.
- GearboxInfo: Encapsulates information specific to the gearbox, such as the serial number.
- GearboxResult: Aggregates analysis results for a given gearbox, linking a GearboxInfo instance to a chronologically ordered list of Result entries.
Data grouping and transformation has two core functions responsible for transforming raw datasets into a structured format. The first function groups analysis entries by gearbox and chronologically orders them. For each gearbox, a dictionary containing its structured analysis history is generated.
The second function (“get_relevant_data”) enables filtering by lubricant series and, optionally, by gearbox serial number. This allows the comparison of an individual gearbox against the rest of its series or the extraction of series-wide data excluding a specific gearbox. This approach supports both focused case studies and broader comparative evaluations across similar units.
The last component is focused on the integration with a language model and connects to the OpenAI-powered large language model (LLM), configured with a temperature parameter set to 1.0 (to obtain broader and more discursive diagnoses).
2.4.2. The Development of the Application for Automated Diagnostics
The application developed using the Streamlit framework enables interactive analysis of data related to wear, lubrication, and contamination of mechanical components. The system integrates several key functionalities, from managing and filtering complex datasets to automatically generating diagnostics through an LLM. The functions developed are data structuring, data loading and organization, prompt generation for the LLM, and automatic diagnostics and final output. In addition to this, an appropriate user interface was also developed.
Data Structuring is based on the use of three distinct lists of columns, each corresponding to a specific type of analysis, as follows:
- columns_wear: includes parameters related to component wear (e.g., operating hours, metal concentrations, machine ID, date, and diagnosis).
- columns_oil: contains characteristics of the lubricant, such as oil type, density, viscosity, and other chemical–physical properties.
- columns_contamination: collects data on the presence of contaminants (e.g., silicon, sodium, vanadium, etc.).
These lists allow for consistent and modular data selection, facilitating the merging of heterogeneous sources and ensuring complete information for subsequent analyses.
Data Loading and Organization is a function dedicated to handling the loading of the main dataset—containing complete analysis records—using pandas and the read_excel method. Simultaneously, reference limits are imported from separate Excel files, categorized as follows:
- Wear: absolute limits and normalized limits per operating hour (PPM/h);
- Lubrication: thresholds for additives, density, and viscosity—both absolute and normalized;
- Contamination: acceptable thresholds for external elements.
The data are organized into a dictionary that allows centralized and efficient access during the later processing stages.
Prompt generation for the LLM consists of a dedicated function that processes the data and generates the prompt to be submitted to the LMM for each analysis area (wear, oil, and contamination). Consequently, the following three functions have been developed:
- Wear analysis: The function filters only entries related to operating gearboxes, excluding new oil samples. The gearbox series is then identified, and using the get_relevant_data function, historical data (from other gearboxes of the same series) are separated from the current data. These are then formatted in Markdown and incorporated into the prompt alongside the relevant reference limits.
- Oil analysis: The system selects the row corresponding to the gearbox under examination and identifies the type of lubricant used. It then accesses a folder containing PDF files with technical specifications and new oil samples. These documents are read using the PyMuPDF library and integrated into the prompt together with current and historical data, as well as applicable limits.
- Contamination analysis: Similarly, the function selects data related to contamination and accesses the relevant PDF files. The data are enriched with the gearbox series and oil type, which are critical for an accurate evaluation.
In each case, the final prompt is built by concatenating all input text blocks with current data, historical trends, and corresponding thresholds.
With the automatic diagnostics and final output function, the prompt is submitted to the LLM, which returns an automatic assessment (diagnosis or recommendation). The results are stored in the Streamlit session state and can subsequently be combined with additional user input (e.g., the condition of the sample upon arrival, etc.) to generate a structured final report.
All the information is divided into thematic tabs (Wear, Oil, Contamination, and Final), each of which allows text input and the execution of the corresponding analysis function through an appropriate user interface developed in Streamlit.
2.4.3. Prompt Engineering
Prompt engineering is a crucial aspect in the interaction with advanced language models. It is the process of formulating optimized textual requests to obtain accurate and relevant answers from artificial intelligence models. A well-structured prompt allows the model to be guided towards a more precise understanding of the context, thus improving the quality of the output generated [40,41,42].
In the context of the predictive analysis of lubricating oils, prompt engineering plays a key role in automated diagnostics. Through accurate prompt definition, it is possible to extract meaningful information, correlate historical and current data, identify anomalies, and make reliable assessments of the operating conditions of gearboxes and lubricants.
In order to ensure a detailed and structured analysis, multiple prompts were defined for each of the areas of investigation: wear, oil, contamination, and sample condition and final evaluation. Detailed prompt descriptions for each area are the following.
- 1.
- Wear analysis
For the wear analysis, three prompts were defined:
- Ongoing Analysis Prompt: This prompt instructs the model to generate a diagnosis on the presence of wear particles in the lubricant under analysis, using the chemical data available in the database. Specifically, the model must fill in the Diagnosis column by focusing solely on parameters related to wear debris, excluding all other lubricant aspects. To do so, it analyzes the concentrations of elements such as iron (Fe), aluminum (Al), and chromium (Cr), comparing them with historical data. After generating the diagnosis, the model must also provide an explanation for the observed wear level. In summary, this prompt explains how to read the data and how to produce a focused analysis.
- Historical Data Prompt: This prompt guides the model in formulating a diagnosis by analyzing similar gear units, with a particular focus on wear. The model must consider diagnoses previously made by an expert on reducers from the same group, reviewing historical analysis values to identify recurring trends or anomalies. However, it must ignore any parts of the historical diagnoses that are unrelated to the data available in the current analysis.
- Limit Prompt: This prompt instructs the model on how to interpret wear thresholds, both in terms of absolute values (ppm) and in terms of time-based variation (ppm/hour), to assess the condition of the gear unit.
- 2.
- Lubricant property analysis
Three prompts were also defined for lubricant characterization:
- Ongoing Analysis Prompt: This prompt guides the model in completing the Diagnosis column based on current database values. The focus is exclusively on additives, viscosity, and density. The chemical elements phosphorus (P), zinc (Zn), boron (B), calcium (Ca), and magnesium (Mg) represent the concentrations of additives in the lubricant. In addition to generating a diagnosis, the model must provide an explanation for the observed additive values.
- Historical Data Prompt: As in the previous section, this prompt helps the model build the diagnosis by leveraging historical expert evaluations of similar oils. Each dataset represents the oil test history of a specific gear unit. The model must analyze these series to identify trends and significant variations. It must also compare the chemical and physical properties in the technical specifications with those observed in new oil analyses. The model should ensure consistency with the lubricant’s evolution over time.
- Limit Prompt: This prompt instructs the model to interpret both absolute and incremental limits for additives. For viscosity and density, it only needs to evaluate whether values fall within defined acceptable ranges. If the oil name is not found in the limits database, the model should not produce any assessment related to limits, thus avoiding misleading or inaccurate evaluations.
- 3.
- Contamination analysis
Three prompts were defined for contamination as well:
- Ongoing Analysis Prompt: This prompt instructs the model to assess oil contamination. It must evaluate the presence of elements such as silicon (Si), sodium (Na), and vanadium (V) and suggest potential causes for contamination.
- Historical Data Prompt: The model must focus on three key aspects: oil contamination, viscosity, and density. It should compare the oil composition with the analysis of fresh oil, as well as evaluate viscosity and density values against the specifications provided by the manufacturer.
- Limit Prompt: This prompt explains how the model should interpret values of silicon, sodium, and vanadium in the analysis, comparing them against reference thresholds. If the lubricant under analysis is not listed in the predefined limits, the model must refrain from drawing any conclusions based on those thresholds.
- 4.
- Sample conditions and final evaluation
The final section uses two additional prompts with specific functions:
- Sample Reception Prompt: This is written manually for each sample as reception conditions vary. It provides the model with details about the sample’s arrival state.
- Integration Prompt: This prompt instructs the model to integrate the results obtained from the previous sections and propose any additional analyses that may help further clarify the equipment’s condition.
3. Results and Discussion
In the field of artificial intelligence, testing is a fundamental tool for validating the quality and reliability of developed models. The primary objective is to verify whether the AI system is capable of producing results that align with expected standards, both in terms of performance (such as diagnostic accuracy and correctness) and usability, i.e., the actual applicability of the results in decision-making processes.
In other words, testing aims to determine the extent to which the model can replicate or even improve upon human expert evaluations while also identifying potential limitations and areas for improvement.
In the specific case of an AI system dedicated to lubricant analysis and predictive maintenance, testing plays a particularly critical role. It is essential to ensure that the diagnoses provided are not misleading, incomplete, or inconsistent with established professional expertise. Unlike other fields where standard metrics such as accuracy, precision, recall, or F1-score are typically used, the descriptive and interpretative nature of this type of output requires more qualitative evaluation methods.
For instance, if the model produces diagnostic comments rather than simple labels, it becomes necessary to assess not only the correctness of the numerical data but also the relevance, internal consistency, and completeness of the explanations provided.
In light of these considerations, the evaluation system is based on a common scale applied across all sections (wear, oil properties, contamination, and sample reception). This scale classifies diagnostic comments into four main categories and allows for the assessment of the reliability and accuracy of the diagnoses generated.
Numerical scores were assigned based on the degree of similarity between the AI-generated diagnoses and those written by the human expert, using a scale that ranges from a minimum to a maximum value—where higher scores indicate a greater alignment between the diagnoses.
The level chosen for the similarity analysis is the following:
- Class 1—Irrelevant Comments (points 0): Includes all diagnoses in which the model generates content completely unrelated to the topic. These comments are considered unusable and excluded from operational evaluation.
- Class 2—Partially Incorrect Comments (points 1–3): Includes diagnoses that contain significant inaccuracies, such as the misinterpretation of limit values or inconsistent assessments. While occasionally partially useful, these comments require thorough revision.
- Class 3—Usable but Incomplete Comments (points 4–6): Refers to diagnoses that are generally correct but lack completeness. The comments often omit important aspects that a human expert would consider, but they still remain usable as a basis for analysis.
- Class 4—Fully Usable Comments (points 7–9): Includes diagnoses that are fully consistent with the expert-validated master version, both in terms of content and argumentation. These comments can be directly used in the decision-making process.
Table 1 provides a summary table of the subdivisions, grades, and meanings of the classes. The scoring system’s classification is based on identifying elements that are considered discriminating for evaluating the diagnosis’s goodness. First of all, we considered the plausibility of the diagnosis in relation to the physical scenario of the system, meaning its consistency with reality. If this feature is not present in the diagnosis, it is rated inadequate with a score value of zero. The partial consistency leads to the second class; full consistency but a partially exhaustive analysis and the necessity of some clarification belong to the third class; and finally, ready-to-use diagnoses are collected in the fourth class. Within the three main classes of goodness-of-diagnosis assessment, three internal levels were identified to provide within-class granularity in the assessment of the individual diagnosis while still within the key characteristics of the class.

Table 1.
Numerical scores for the evaluation of similarity between the AI-generated vs. expert diagnoses.
To validate the diagnostic capability of AI, thirty analyses are randomly extracted from the original database as a partition. The remaining database is used for the limit definitions described in Section 2. Random selection was carried out without applying specific filters or stratification criteria in order to ensure an impartial and representative assessment of the model’s performance under different operating conditions. Scores were assigned to each analysis based on a comparison between the diagnoses provided by the model and the diagnoses developed by the expert used as master measures.
In Table 2, some examples of diagnoses are listed. The diagnoses selected are all within the range between 7 and 9 in the provided by the model compared to the master diagnosis.
Table 2.
Examples of one of the diagnoses used for the evaluation of the AI diagnosis vs. master diagnosis.
The qualitative comparison between the diagnoses generated by the artificial intelligence and those formulated by the expert analyst highlights both similarities and differences in the interpretation of lubricant oil data, particularly across the three categories analyzed: wear, lubricant, and contamination.
In diagnosis number 1, both assessments acknowledge the presence of ferromagnetic particles (Fe and Cu) and the need to monitor their trend. However, while the AI quantifies the phenomenon by referencing numerical thresholds, the expert simply indicates the presence of particles without specifying any threshold values.
In diagnosis number 2, both the AI and the analyst agree on the acceptability of the viscosity, but the AI detects an anomaly in the additive levels compared to the fresh lubricant.
In diagnosis number 3, both diagnoses identify a potential contamination with another lubricant, but the AI provides a more detailed analysis, highlighting abnormal levels of magnesium, barium, sodium, and vanadium.
Finally, for diagnosis 4, the AI and expert agree that the sampling method used is noncompliant and may have affected the sample’s representativeness. Additionally, the AI suggests further analyses, such as FT-IR, that could be useful for the diagnosis.
In Table 3, the detailed scores assigned to the thirty analyses used for the assessment of AI vs. master diagnoses are listed.
Table 3.
AI diagnosis vs. master diagnosis agreement.
Figure 5 summarizes the level of agreement between IA and master diagnoses and shows that the majority of diagnostic assessments (more than 70 percent) from IA are consistent with the experienced operator at an operationally usable level. On the other hand, there are about a quarter of assessments that, while sufficiently consistent, require revision by the practitioner to be usable because they are partial or incomplete. Instead, the frequency of analysis that is unusable and inconsistent with the IA is slightly greater than 5 percent.
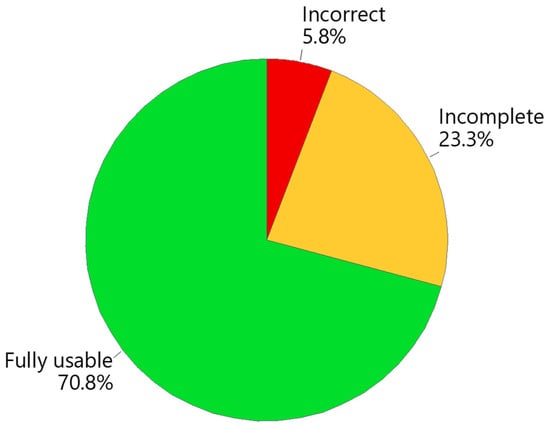
Figure 5.
Overall summary of IA assessments without breakdown by sections analyzed.
The boxplots showing the degree of agreement between the assessments made by the AI model and those of the human operator for each of the four sections are shown in Figure 6. The figure illustrates the dispersion and consistency of the agreement within each section in addition to the average alignment. The average scores of agreements were calculated for each of the four analyzed sections and provide a measure of the model’s performance in that specific area, allowing for the identification of potential areas for improvement.
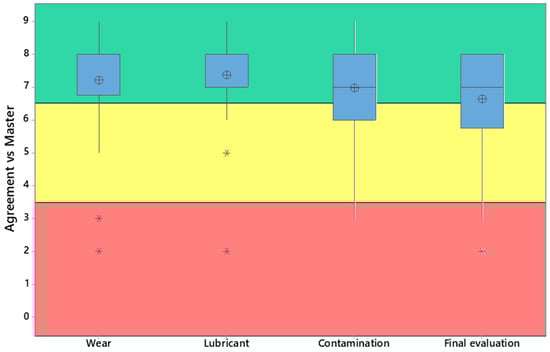
Figure 6.
Boxplot of scores of the agreement level (AI diagnosis vs. master): wear section median value: 8, lubricant section median value: 8, contamination section median value: 7, final evaluation section median value: 7.
These values serve as indicators of the diagnostic accuracy of the AI; however, a closer examination reveals performance variability across the different domains.
Specifically, the sections related to wear and lubricant yielded higher average scores compared to those concerning contamination and reception conditions, suggesting that the AI exhibited more robust performance in certain diagnostic areas. The lubricant section, with an average score of 7.3, most closely aligned with the evaluations of the human expert, indicating the model’s strong capability in identifying and interpreting lubricant-related phenomena. A comparable performance was observed in the wear section, highlighting the AI’s reliability in detecting signs of mechanical degradation within gear units.
In contrast, the contamination section showed a moderate decline in diagnostic accuracy, though it remained broadly consistent with expert assessments. The reception condition section recorded the lowest average score, potentially pointing to the need for the further optimization of the model in that specific area.
These findings suggest that while the AI system is capable of producing diagnostically sound outputs, targeted improvements may be required, particularly in the areas of contamination detection and the assessment of sampling conditions.
An essential component of the evaluation framework is the systematic integration of expert feedback, which plays a pivotal role in maintaining the model’s diagnostic reliability. To support continuous improvement, the protocol includes the regular insertion of expert-generated reports in place of AI-generated ones. This practice not only enriches the training corpus with high-quality, domain-specific inputs but also mitigates the risk of diagnostic stagnation—a potential consequence of the AI’s reliance on pre-trained knowledge, historical data, predefined thresholds, and technical specifications.
Incorporating expert diagnoses on a routine basis allows the model to expand its diagnostic repertoire and ensures ongoing alignment with operational needs and real-world complexities.
Finally, the adoption of the AI system has demonstrated several advantages. It has accelerated the diagnostic process, enabling more daily diagnostics. Additionally, it has improved operational resources, leading to better plant utilization and potential cost reduction in maintenance. The study of diagnostic thresholds has also contributed to the definition of more reliable diagnostic limits, allowing for a more precise assessment of lubricant health and gearbox operating conditions. Furthermore, the system provides advanced decision-making support, enabling the identification of emerging critical issues and facilitating the planning of targeted interventions based on historical trends. A key result of this study was a comparative analysis between the AI-generated responses and those provided by experts. This comparison confirmed the system’s effectiveness, as the AI consistently produced results in alignment with expert’s diagnoses. The results highlights the reliability and predictive capabilities of the AI-based approach, underscoring its potential to enhance maintenance strategies.
The last consideration comes from a time consumption perspective. AI enables faster analysis, which can increase the production capacity of experienced operators and reduce human errors and oversights.
In conclusion, the implementation of AI in diagnostic processes significantly enhances efficiency by reducing both diagnosis time consumption (considering an estimated 60% lower time between the time taken by the operator to make a diagnosis and write reports and that of the AI-based system) and associated costs, as it minimizes the need for extensive involvement from specialized experts during initial evaluations. Furthermore, the stability and repetitiveness of diagnoses can be progressively improved by increasing the dimensions of diagnostic databases, as AI systems base their outputs on established parameters, eliminating errors in limit assessments. Additionally, the integration of AI facilitates a standardized approach to writing reports by leveraging existing documentation, thereby promoting consistency and clarity in diagnostic reporting and knowledge sharing.
4. Conclusions
This paper presents an innovative AI-based approach for the diagnostics of lubricating oil that can be used for predictive analysis in industrial gearboxes with the ability to detect the wear-related anomalies, contamination, and degradation of the lubricant. The effectiveness of the approach proposed for the predictive diagnosis and analysis of lubricants, comparing AI-generated diagnoses, was evaluated by comparing them with the diagnoses of human experts. The aspects evaluated were wear, lubricant properties, contamination, and sample conditions. AI diagnoses showed good consistency with those of the experts, especially in the wear and lubricant sections (median value 8). The contamination and final evaluation sections show instead a lower median of 7, but, in any case, the large majority of the diagnoses (more than 75%) result in sufficient accuracy but with the described difference between the four analyzed diagnostic aspects. The use of AI permits the reduction in diagnostic time by ~60%, increasing throughput and efficiency, and can enable scalable diagnostics without a proportional increase in expert personnel. AI, in this context, can act as a diagnostic assistant, handling standard cases and flagging complex ones for expert review. Its function is to be a screening tool and decision support system, enhancing expert productivity. Furthermore, the approach can support standardization and traceability in maintenance reporting and knowledge management. Future works should deal with an increase in diagnostic databases to obtain fully reliable results from AI and deepen the role of the human expert to prevent stagnation and maintain alignment with real-world complexities, to identify the approach for updates of diagnostic thresholds and datasets, for the integration of new types of diagnoses and for the supervision of AI diagnostic capability.
Author Contributions
Conceptualization, D.R., L.P., M.M., V.L.B. and A.G.; methodology, D.R., L.P., M.M., M.V., V.L.B. and A.G.; software, M.V. and A.G.; validation, L.P. and M.M.; formal analysis, D.R. and V.L.B.; investigation, D.R. and V.L.B.; resources, L.P.; data curation, D.R., V.L.B. and A.G.; writing—original draft preparation, D.R., L.P., M.M., M.V., V.L.B. and A.G.; writing—review and editing, D.R., L.P., M.M., M.V., V.L.B. and A.G.; visualization, D.R., V.L.B. and A.G.; supervision, M.M. and A.G.; project administration, L.P. and M.M.; funding acquisition, M.M. All authors have read and agreed to the published version of the manuscript.
Funding
This research received no external funding.
Data Availability Statement
The data presented in this study are available on request from the corresponding author. Parts of the data are not publicly available due to privacy and industrial property restrictions.
Conflicts of Interest
Authors Lorenzo Pompei, Massimo Manfredini and Massimiliano Vignoli were employed by the company Bonfiglioli Spa. The remaining authors declare that this research was conducted in the absence of any commercial or financial relationships that could be construed as potential conflicts of interest.
References
- Bhat, J.S.; Sonawane, B.U. Condition Monitoring of Worm Gearbox through Oil Analysis. In Recent Trends in Engineering Design; Parey, A., Kumar, R., Singh, M., Eds.; Lecture Notes in Mechanical Engineering; Springer: Singapore, 2021. [Google Scholar] [CrossRef]
- Wakiru, J.M.; Pintelon, L.; Muchiri, P.N.; Chemweno, P.K. A review on lubricant condition monitoring information analysis for maintenance decision support. Mech. Syst. Signal Process. 2019, 118, 108–132. [Google Scholar] [CrossRef]
- Fitch, J.; Troyer, D. Oil Analysis Basics, 2nd ed.; Noria Corporation: Tulsa, OK, USA, 2010. [Google Scholar]
- del Álamo, J.R.; Duran, M.J.; Muñoz, F.J. Analysis of the Gearbox Oil Maintenance Procedures in Wind Energy. Energies 2020, 13, 3414. [Google Scholar] [CrossRef]
- Yan, S.; Kong, Z.; Liu, H.; Li, B.; Fan, M.; Zhang, X. Oil Change Interval Evaluation of Gearbox Used in Heavy-Duty Truck E-Axle with Oil Analysis Data. Lubricants 2022, 10, 252. [Google Scholar] [CrossRef]
- ISO 17359:2018; Condition Monitoring and Diagnostics of Machines—General Guidelines. ISO: Geneva, Switzerland, 2018.
- Abbasi, T.; Lim, K.H.; Soomro, T.A.; Ismail, I.; Ali, A. Condition Based Maintenance of Oil and Gas Equipment: A Review. In Proceedings of the 2020 3rd International Conference on Computing, Mathematics and Engineering Technologies (iCoMET), Sukkur, Pakistan, 29–30 January 2020; pp. 1–9. [Google Scholar] [CrossRef]
- Mobley, R.K. An Introduction to Predictive Maintenance, 2nd ed.; Butterworth-Heinemann: Oxford, UK, 2002. [Google Scholar]
- Asadi, S.Y.; Schenck, T.; May, G. Integrated Oil Condition Monitoring and Predictive Maintenance Using Lubricant Analysis in Industrial Gearboxes. J. Mach. Eng. 2021, 21, 60–74. [Google Scholar]
- Achouch, M.; Dimitrova, M.; Ziane, K.; Sattarpanah Karganroudi, S.; Dhouib, R.; Ibrahim, H.; Adda, M. On Predictive Maintenance in Industry 4.0: Overview, Models, and Challenges. Appl. Sci. 2022, 12, 8081. [Google Scholar] [CrossRef]
- Bindra, S.; Jain, R. Artificial Intelligence in Medical Science: A Review. Ir. J. Med. Sci. (1971-) 2023, 193, 1419–1429. [Google Scholar] [CrossRef] [PubMed]
- Weng, Y.; Wu, J.; Kelly, T.; Johnson, W. Comprehensive Overview of Artificial Intelligence Applications in Modern Industries. arXiv 2024, arXiv:2409.13059. [Google Scholar] [CrossRef]
- Singh, V.; Gangsar, P.; Porwal, R.; Atulkar, A. Artificial Intelligence Application in Fault Diagnostics of Rotating Industrial Machines: A State-of-the-Art Review. J. Intell. Manuf. 2021, 34, 931–960. [Google Scholar] [CrossRef]
- Giorgetti, A.; Arcidiacono, G.; Ciappi, A.; Barbieri, R.; Citti, P. HNCR model following robust approach. Qual. Reliab. Eng. Int. 2018, 34, 1271–1288. [Google Scholar] [CrossRef]
- Giorgetti, A.; Rolli, F.; La Battaglia, V.; Marini, S.; Arcidiacono, G. Axiomatic Design Using Multi-criteria Decision Making for Material Selection in Mechanical Design: Application in Different Scenarios. In Proceedings of the 15th International Conference on Axiomatic Design 2023, Eindhoven, The Netherlands, 31 May–2 June 2023. [Google Scholar] [CrossRef]
- Aliyu, R.; Mokhtar, A.A.; Hussin, H. Prognostic Health Management of Pumps Using Artificial Intelligence in the Oil and Gas Sector: A Review. Appl. Sci. 2022, 12, 11691. [Google Scholar] [CrossRef]
- Habbal, A.; Ali, M.K.; Abuzaraida, M.A. Artificial Intelligence Trust, Risk and Security Management (AI TRiSM): Frameworks, Applications, Challenges and Future Research Directions. Expert Syst. Appl. 2023, 240, 122442. [Google Scholar] [CrossRef]
- Sounderajah, V.; Ashrafian, H.; Rose, S.; Shah, N.H.; Ghassemi, M.; Golub, R.; Kahn, C.E.; Esteva, A.; Karthikesalingam, A.; Mateen, B.; et al. A Quality Assessment Tool for Artificial Intelligence-Centered Diagnostic Test Accuracy Studies: QUADAS-AI. Nat. Med. 2021, 27, 1663–1665. [Google Scholar] [CrossRef]
- Hanna, M.; Pantanowitz, L.; Jackson, B.; Palmer, O.; Visweswaran, S.; Pantanowitz, J.; Deebajah, M.; Rashidi, H. Ethical and Bias Considerations in Artificial Intelligence (AI)/Machine Learning. Mod. Pathol. 2025, 38, 100686. [Google Scholar] [CrossRef]
- Abdelwanis, M.; Alarafati, H.K.; Tammam, M.M.S.; Simsekler, M.C.E. Exploring the Risks of Automation Bias in Healthcare Artificial Intelligence Applications: A Bowtie Analysis. J. Saf. Sci. Resil. 2024, 5, 460–469. [Google Scholar] [CrossRef]
- Cunha, B.Z.; Droz, C.; Zine, A.-M.; Foulard, S.; Ichchou, M. A Review of Machine Learning Methods Applied to Structural Dynamics and Vibroacoustic. Mech. Syst. Signal Process. 2023, 200, 110535. [Google Scholar] [CrossRef]
- Mey, O.; Neudeck, W.; Schneider, A.; Enge-Rosenblatt, O. Machine Learning-Based Unbalance Detection of a Rotating Shaft Using Vibration Data. In Proceedings of the International Conference on Emerging Technologies and Factory Automation (ETFA), Vienna, Austria, 8–11 September 2020. [Google Scholar] [CrossRef]
- Brito, L.C.; Susto, G.A.; Brito, J.N.; Duarte, M.A.V. Fault Diagnosis Using eXplainable AI: A Transfer Learning-Based Approach for Rotating Machinery Exploiting Augmented Synthetic Data. Expert Syst. Appl. 2023, 232, 120860. [Google Scholar] [CrossRef]
- Cardoso, D.; Ferreira, L. Application of Predictive Maintenance Concepts Using Artificial Intelligence Tools. Appl. Sci. 2020, 11, 18. [Google Scholar] [CrossRef]
- Scaife, A.D. Improve Predictive Maintenance through the Application of Artificial Intelligence: A Systematic Review. Results Eng. 2023, 21, 101645. [Google Scholar] [CrossRef]
- ASTM D7720-11; Standard Guide for Statistically Evaluating Measurand Alarm Limits. ASTM International: West Conshohocken, PA, USA, 2011.
- Han, M.K.; Jian, J.P. Data Mining: Concepts and Techniques, 3rd ed.; Morgan Kaufmann: Waltham, MA, USA, 2011. [Google Scholar]
- Dasu, T.; Johnson, T. Exploratory Data Mining and Data Cleaning; John Wiley & Sons: Hoboken, NJ, USA, 2003. [Google Scholar]
- Pyle, D. Data Preparation for Data Mining; Morgan Kaufmann: Waltham, MA, USA, 1999. [Google Scholar]
- Fernández-Feal, M.; Fernández-Feal, M.; Sánchez-Fernández, L.; Pérez-Prado, J. Study of Metal Concentration in Lubricating Oil with Predictive Purposes. Curr. J. Appl. Sci. Technol. 2018, 27, 1–12. [Google Scholar] [CrossRef]
- Mathura, S. Lubrication Degradation Mechanisms; CRC Press eBooks: Boca Raton, FL, USA, 2020. [Google Scholar] [CrossRef]
- La Battaglia, V.; Mussi, V.; Marini, S.; Giorgetti, A. Investigation of Damage Caused by Chlorine-Contaminated Fuel in Standard Vehicle Components. Eng. Proc. 2025, 85, 8. [Google Scholar] [CrossRef]
- Shi, J.; Han, C.; Chen, L.; Jin, W. Investigating wear-induced health-instability dynamics in spur gear systems with installation error. Nonlinear Dyn. 2025, 1–22. [Google Scholar] [CrossRef]
- Mao, Y.; Tong, J.; Chin, Z.Y.; Borghesani, P.; Peng, Z. Transmission-error- and vibration-based condition monitoring of gear wear with contaminated lubricant. Wear 2023, 523, 204760. [Google Scholar] [CrossRef]
- Wang, Z.; Xue, X.; Yin, H.; Jiang, Z.; Li, Y. Research Progress on Monitoring and Separating Suspension Particles for Lubricating Oil. Complexity 2018, 2018, 9356451. [Google Scholar] [CrossRef]
- Sondhiya, O.P.; Gupta, A.K. Wear Debris Analysis of Automotive Engine Lubricating Oil Using by Ferrography. Int. J. Eng. Innov. Technol. 2012, 2, 46–47. [Google Scholar]
- Jaech, A.; Kalai, A.; Lerer, A.; Richardson, A.; El-Kishky, A.; Low, A.; Helyar, A.; Madry, A.; Beutel, A.; Carney, A. Openai o1 system card. arXiv 2024, arXiv:2412.16720. [Google Scholar] [CrossRef]
- Jegham, N.; Abdelatti, M.; Hendawi, A. Visual Reasoning Evaluation of Grok, Deepseek Janus, Gemini, Qwen, Mistral, and ChatGPT. arXiv 2025, arXiv:2502.16428. [Google Scholar] [CrossRef]
- Bagnato, S.; Boccagni, C.; Bonavita, J. Assessing the Accuracy of ChatGPT in Answering Questions About Prolonged Disorders of Consciousness. Brain Sci. 2025, 15, 392. [Google Scholar] [CrossRef]
- Chen, B.; Zhang, Z.; Langrené, N.; Zhu, S. Unleashing the Potential of Prompt Engineering for Large Language Models. Patterns 2025, 6, 101260. [Google Scholar] [CrossRef]
- Ye, Q.; Axmed, M.; Pryzant, R.; Khani, F. Prompt Engineering A Prompt Engineer. arXiv 2023, arXiv:2311.05661. [Google Scholar] [CrossRef]
- Oppenlaender, J.; Linder, R.; Silvennoinen, J. Prompting AI Art: An Investigation into the Creative Skill of Prompt Engineering. Int. J. Hum.-Comput. Interact. 2024, 1–23. [Google Scholar] [CrossRef]


Disclaimer/Publisher’s Note: The statements, opinions and data contained in all publications are solely those of the individual author(s) and contributor(s) and not of MDPI and/or the editor(s). MDPI and/or the editor(s) disclaim responsibility for any injury to people or property resulting from any ideas, methods, instructions or products referred to in the content. |
© 2025 by the authors. Licensee MDPI, Basel, Switzerland. This article is an open access article distributed under the terms and conditions of the Creative Commons Attribution (CC BY) license (https://creativecommons.org/licenses/by/4.0/).