Abstract
The frame of the six-row self-propelled packaging cotton picker serves as the primary load-bearing structure. During operation, the frame is subjected to multiple vibration signals, which are further intensified by coupling effects. These vibrations negatively impact the machine’s operational stability and overall performance. In this study, vibration source tests were designed to collect dynamic response data, enabling systematic analysis of excitation mechanisms and vibration characteristics. Furthermore, a comprehensive analytical approach integrating finite element simulation with experimental analysis was employed to optimize the layout of the vibration sources on the frame. Finally, the frame was validated through modal testing, with multiple measurement points arranged at the interfaces between the frame and the vibration source for vibration tests and time–frequency domain analysis. The results indicate that the final optimized dimensional parameters of the frame were determined as follows: X1 = 1575 mm, X2 = 805 mm, and X3 = 275 mm. Furthermore, time–frequency domain analysis reveals that the natural frequency of the rack designed in this study is effectively separated from the dominant excitation frequency band. This design feature successfully mitigates the risk of resonance, thereby fulfilling the intended performance objectives.
1. Introduction
The cotton picker serves as the core equipment for mechanized cotton harvesting, capable of directly baling picked cotton into bundles, thereby enabling integrated picking and baling []. As the primary load-bearing component in cotton pickers, the frame is directly or indirectly connected to several key structural systems, including the picking head, engine, pneumatic conveying system, and transmission system [,,,]. The frame’s performance is a critical determinant of the cotton picker’s operational stability. With the development of cotton-picker technology, the six-row self-propelled picker has become a vital machine in the field, owing to its integrated harvesting–baling method and high efficiency. During operation, the frame is exposed to complex vibration sources generated by other subsystems. Consequently, the frame is prone to resonance when the excitation frequency matches its natural frequency. Under high-intensity and heavy-load conditions, continuous strong vibration can cause structural fatigue damage. Statistics show that approximately 80% of structural failures are caused by fatigue [], which significantly compromises both operational reliability and overall machine performance [,].
The dynamic response of the frame across diverse operating regimes can be understood through comprehensive vibration analysis of both the excitation sources and the frame structure, thereby providing a foundation for subsequent machine configuration design and structural optimization. Hou et al. [] designed a multi-crop harvester header and conducted vibration and field tests. The results indicated that header vibrations were mainly due to the harvester’s resonance at a low engine speed of 1800 r/min. However, at a higher speed of 2600 r/min, vibrations were primarily influenced by external excitation sources, with the cutter’s reciprocating motion identified as the primary contributor. Chen et al. [] developed a dynamic model of the combined harvester frame under multi-source excitation, employing modal testing and finite element simulations to analyze the frame’s modal frequencies and mode shapes. Zhou [] established dynamic models for the main branch and the harvester assembly, as well as a vibration model for the fruit stem and fruit and identified key factors influencing the excitation force and vibrational energy consumption. Shen [] investigated the excitation characteristics of various sources under working conditions and their effects on header frame vibrations using modal analysis methods. Yuan [] conducted a stability analysis of a high-clearance corn harvester using principles of multibody dynamics and performed both static and modal analyses of its chassis. The study revealed significant material redundancy in the chassis structure. It highlighted the substantial impact of the frame on the overall structural vibration modes and modal frequencies, potentially leading to resonance. Consequently, an optimized chassis design was carried out. The axle housing was lightweighted using an adaptive simulated annealing algorithm, while the frame was optimized through a combination of topology and dimensional optimization. As a result, the frame weight was reduced by 17 kg, and its modal frequencies were increased, ensuring that the optimized chassis structure met the design requirements.
The overall machine layout refers to the rational design and arrangement of component positions and connection methods, aiming to achieve a compact structure, the lowest possible center of gravity, stable operation, and fulfillment of all functional performance requirements []. Zeng [] and Fan [] conducted kinematic and dynamic analyses of a small sugarcane harvester. In addition, the layout of onboard vibration sources was optimized to determine the optimal overall configuration. Ma et al. [,] performed a theoretical analysis of vibration sources at different positions and developed a dynamic model of the entire machine. This study investigates the effects of vibration source configuration on the dynamic response characteristics of cutting discs. The optimization, which included installing the cutter using a supported beam, centralizing the engine, and mounting the defoliation system on the rear axle, significantly improved the dynamic performance of the cutting disc. Hu [] optimized the machine layout of the electric micro-tiller by systematically investigating the interrelationships among handlebar force, vibration, and center of gravity position. Zhang [] established multiple overall layout schemes for a large-scale buckwheat harvester through a systematic study of its key components.
Computational simulations conducted in ADAMS and Workbench demonstrated that Layout Scheme III exhibited optimal overall performance characteristics. Lai et al. [] investigated the influence of component installation positions, including hydraulic cylinders, the engine, and the logistics rack, on the axial vibration of the cutting system. They identified the optimal installation locations for axial vibration sources in the cutting system to minimize vibration. Compared with the worst installation layout, the optimal configuration reduced the axial vibration amplitude of the cutting disc by 40.8% and decreased the comprehensive cutting quality evaluation value (R0) by 16.9%. Zhou et al. [] designed a crawler-type ratoon rice harvester to minimize soil compaction during operation. They designed three different layouts for the diesel fuel tank and the hydraulic oil tank. Finally, comparative analysis revealed that the optimal layout configuration for the harvester is achieved by positioning the hydraulic tank at the front and the diesel tank at the rear.
The vibrational behavior and structural optimization of the frame are essential for ensuring the operational reliability of cotton pickers. Recent research on the structural dynamics of frames for small- and medium-sized pickers has shown promising advancements. For instance, Wang et al. [] conducted a modal analysis and optimized a five-row box-type picker frame. Validation tests indicated that the optimization was effective, serving as an important reference for the current work. Dong et al. [] performed experimental vibration testing on the primary vibration sources mounted on the frame of a three-row cotton picker. Fourier analysis was employed to extract both the fundamental excitation frequency and the coupled excitation frequency generated by these sources. The results reveal that the natural frequencies associated with the third, fourth, and sixth modal orders of the frame align with the coupled excitation frequency.
Current research primarily examines three-row and box-type cotton pickers, which typically have fewer picking heads and smaller workloads. In contrast, the six-row self-propelled cotton picker is equipped with six picking heads and features complex mechanical and hydraulic systems. Consequently, its overall structure and operational processes are more intricate than those of the previously mentioned machines, leading to greater demands on the frame. In this study, dynamic excitation forces serve as inputs for simulating the frame, and we optimize the structural parameters related to various vibration sources. To satisfy design requirements, we conducted static and modal analyses of the frame using the finite element method. Ultimately, vibration tests on the optimized frame were performed to evaluate its vibration behavior. This work aims to establish a more robust theoretical foundation for the frame design of six-row self-propelled cotton pickers.
2. Analysis of Vibration Sources Acting on the Frame of the Cotton Picker
An external excitation frequency analysis was performed on the frame of the six-row self-propelled cotton picker to prevent resonance by ensuring sufficient separation between the structural natural frequencies and the operational excitation spectra [,]. The primary vibration sources of the cotton picker include the engine, fan, picking head, baling system, and random terrain excitations. The excitation frequencies of all sources will be analyzed.
2.1. Design of Vibration Tests for Excitation Sources
To evaluate the excitation vibration characteristics of the cotton picker’s vibration sources, the INV9822 accelerometer (Beijing Oriental Institute of Vibration and Noise Technology, Beijing, China) was used for signal acquisition, featuring a measurement range of 100 g, sensitivity of 100 mV·g1, and a frequency response range of 0.5–8 kHz. A 16-channel, 24-bit INV3062V data acquisition and analysis instrument (Beijing Oriental Institute of Vibration and Noise Technology, Beijing, China) with antialiasing filtering capabilities was employed to process the measured data and obtain time- and frequency-domain signals for each excitation source. The equipment used for the modal tests of the cotton picker’s vibration sources is shown in Figure 1.
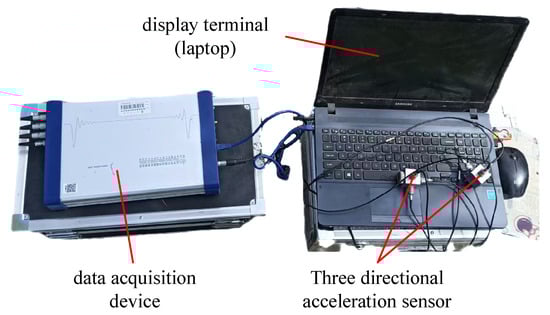
Figure 1.
Vibration-data-acquisition system.
To investigate the vibration characteristics of the primary excitation sources of the cotton picker, modal tests were conducted in the X, Y, and Z directions under three working conditions (first gear:700 r/min, second gear:1200 r/min, and third gear:1900 r/min). By adjusting the engine gear, each excitation source was individually tested. A stochastic continuous-sampling methodology was employed to acquire vibration signals, which were then transmitted to the Dynamic Signal Analysis System (DASP) via the data acquisition instrument. The sampling frequency was set to 2560 Hz, the analysis frequency to 1000 Hz, the number of time-domain analysis points to 4096, the number of spectral lines to 1600, and the frequency resolution to 2.5 Hz. In the test, the coordinate system was defined as follows: the forward direction of the six-row self-propelled packaging cotton picker was designated as the positive X direction, the lateral direction as the positive Y direction, and the direction perpendicular to the ground as the positive Z direction. The collected vibration data were analyzed to obtain the maximum amplitudes and root-mean-square (RMS) values of the time-domain signals. Additionally, the time-domain signals were processed using a linear averaging method and converted to the frequency domain via the Fourier transform. The first four amplitude peaks and their corresponding frequencies were extracted.
2.2. Analysis of Engine Excitation Characteristics
The engine, which acts as the power source for cotton pickers, generates vibrations that arise principally from the periodic fluctuation in cylinder gas pressure due to combustion and the inertial forces produced by the crank-slider mechanism [,]. Figure 2a shows the on-site engine test setup. The tested cotton picker is equipped with an inline six-cylinder four-stroke diesel engine. A symmetric crank arrangement is employed to partially balance the reciprocating inertial forces, centrifugal forces, and the resulting moments. The primary excitation frequency is the second-order firing frequency. The excitation frequency can be calculated using the following Equation:
where f1 is the excitation frequency (Hz), n1 represents the engine rotational speed (r/min), z denotes the number of engine cylinders, and τ is the number of strokes of the engine.
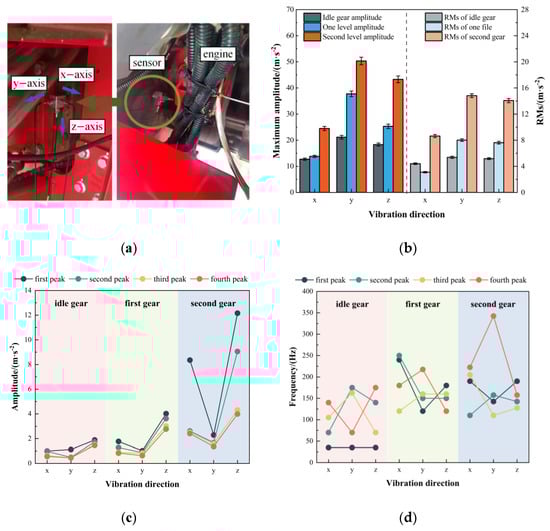
Figure 2.
(a) On-site engine test setup; (b) Time-domain characteristics of engine vibration; (c) Peak features of engine vibration in the frequency domain; (d) Frequency-domain characteristics of engine vibration.
The engine rotational speeds of the cotton picker under idle, first-gear, and second-gear conditions are 700 r/min, 1200 r/min, and 1900 r/min, respectively. According to Equation (1), the corresponding dominant excitation frequencies are 35 Hz, 60 Hz, and 95 Hz. During the vibration tests, data were collected at each operating condition (idle, first gear, and second gear) after the engine reached a stable operating state. In the time domain analysis, the maximum amplitude and root-mean-square (RMS) values of the engine vibration signals were extracted. In the frequency-domain analysis, the four highest peak amplitudes and their corresponding frequencies were identified from the frequency spectra of the engine vibration signals. The vibration characteristics of the engine under different gear conditions are illustrated in Figure 2b,c,d, respectively.
As can be seen in Figure 2b–d, the maximum amplitude and root mean square values of the time-domain signal along the x-, y-, and z-axes increase with an increase in the gear level of the engine. Among the three directions, the amplitude and root mean square values follow the order: y > z > x. The excitation exerted by the engine on the frame is y-axis > z-axis > x-axis. From the analysis of the frequency-domain signals, it is observed that under idle conditions, the engine vibration is mainly driven by its excitation. In addition, the dominant frequencies are the fundamental frequency (35 Hz) and its harmonics (70, 105, 140, 17,500 Hz) of the engine, and the influence of coupling frequencies is minimal in this state. Even in first gear, the engine vibration is still predominantly caused by self-excitation. The main vibration frequencies are characterized by harmonic frequencies (120, 180, and 240 Hz), while the frame is also significantly affected by coupling excitations (150 and 160 Hz). At second gear, the engine vibration is dominated by strong self-excitation (190 Hz), which is a harmonic frequency of the engine. Moreover, the frame vibration is primarily governed by coupling excitation frequencies (142.5, 110, and 157.5 Hz).
As mentioned above, the frame excitation is predominantly driven by engine self-excitation at low rotational speeds, whereas coupled excitations become increasingly significant at elevated speeds. However, with increasing speed, the effect of coupling excitations on the engine becomes more pronounced. Therefore, when analyzing the excitations acting on the frame, it is essential to consider both the engine’s self-excitation and the vibration coupling phenomena resulting from the drivetrain and other operational components during engine operation.
2.3. Analysis of Fan Excitation Characteristics
The fan’s excitation characteristics are transmitted to the frame and the entire cotton picker via the suspension bracket. The excitation frequency is doubled due to the use of dual fans. To investigate the fan’s excitation characteristics, a three-axis accelerometer was installed at the fan shaft end for vibration testing. The on-site test setup is shown in Figure 3a.
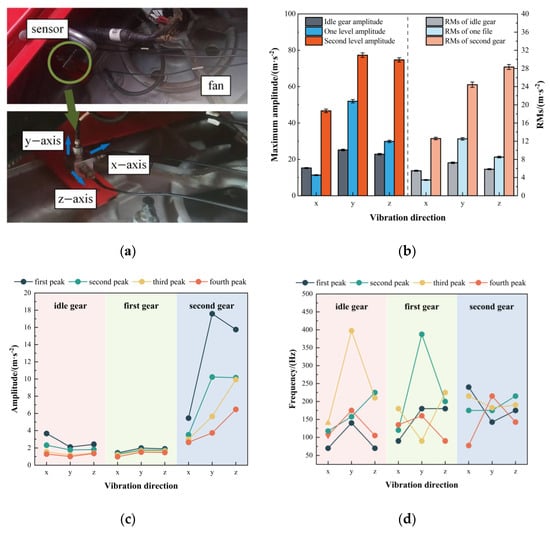
Figure 3.
(a) On-site fan test setup; (b) Time-domain characteristics of fan vibration; (c) Peak features of fan vibration in the frequency domain; (d) Frequency-domain characteristics of fan vibration.
The fan can be considered the primary source of vibration in the pneumatic conveying system, as the cotton conveying pipeline does not actively generate vibration. The fan’s excitation originates from the rotation of its internal rotor. Therefore, the fan frequency can be calculated using the following formula:
where f2 is the frequency (Hz), and n2 is the rotational speed (r/min).
The rotational speeds of the fan under idle, first-gear, and second-gear conditions are 1600, 2700, and 4275 r/min, respectively. According to Equation (2), the corresponding excitation frequencies are 53.4 Hz, 90 Hz, and 142.5 Hz. Vibration tests were conducted under all operating conditions, and the data were collected and processed. The maximum amplitude and root-mean-square values of the fan vibration signals were extracted. In the frequency domain, the four dominant peak values and their corresponding frequencies were obtained. The vibration signal data of the fan under different gear conditions are shown in Figure 3b–d.
The analysis reveals that during fan operation, the time-domain vibration signal along the y-axis exhibits the highest amplitude, followed by the z-axis, and the x-axis shows the lowest. As the gear level increases, the maximum amplitude and root mean square values of the time-domain signals along the x-, y-, and z-axes also increase. The most significant increase was observed for the second gear. Frequency-domain analysis under different operating conditions indicates that the fan vibration frequencies are mainly driven by the engine excitation at idle, and the dominant vibration frequencies correspond to the harmonics of the engine (70, 105, 140, 210 Hz). Moreover, the frame is also significantly influenced by coupling excitations (117.5, 157.5, and 225 Hz), and the amplitude at the fan’s self-excitation frequency of 53.4 Hz is minimal. Under first-gear conditions, the fan is influenced by both engine excitation (120, 180 Hz) and self-excitation (90 Hz).
In contrast, the peak amplitude at the fan’s self-excitation frequency remains relatively low at 1.64 m·s2. In addition, the frame is notably influenced by coupling excitations (200, 225, 387.5 Hz). At second gear, the fan is strongly affected by self-excitation (142.5 Hz), with a peak amplitude of 17.59 m·s2, which is considerably higher than the excitation amplitudes of other components. However, the overall excitation frequencies acting on the fan are still dominated by coupling excitation frequencies (175, 215, 240 Hz), while the influence of engine excitation (190 Hz) on fan vibration becomes relatively minor.
In summary, the engine’s excitation frequencies are transmitted to the fan via the belt drive, resulting in resonance. At low speeds, the fan’s frequency-domain response is primarily influenced by engine excitation, with dominant vibration frequencies corresponding to engine-induced and coupling excitations. The influence of the fan’s self-excitation is relatively minor. As the engine speed increases, the excitation acting on the fan is primarily dominated by coupling excitations, along with a significant contribution from the fan’s self-excitation.
2.4. Analysis of Picking Head Excitation Characteristics
The picking head is the core component of the cotton picker and is primarily composed of the picking drum, spindles, spindle sleeves, doffing plate, and transmission system. During harvesting, the rotation of internal components within the picking head generates multiple excitation forces. Due to differences in rotational speed, these excitations interact with one another. This results in complex excitation behavior in the picking head, making it difficult to calculate the exact excitation frequencies. Therefore, this study analyzes the overall vibration characteristics of the picking head, and the on-site data acquisition setup is shown in Figure 4a. The excitation frequency conditions of the picking head are complex. To enable a more comprehensive analysis of the frequency signals, the frequency analysis range was extended from 0–400 Hz to 0–1000 Hz. The frequency analysis focuses on the primary excitation frequency range, and the results from data processing are presented in Figure 4b,c and Table 1.
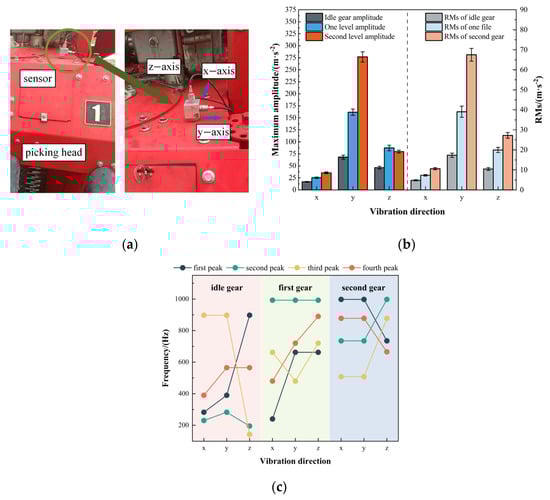
Figure 4.
(a) On-site picking head test setup; (b) Time-domain characteristics of picking head vibration; (c) Frequency-domain characteristics of picking head vibration.

Table 1.
Vibration signal of the picking head of the cotton picker.
As presented in Figure 4b,c and Table 1, time-domain analysis of the picking head vibration signals reveals that the y-axis exhibits the highest amplitude, followed by the z-axis, while the x-axis displays the lowest. As the gear level of the picking head increases, both the maximum amplitude and root mean square values of the time-domain signals along the x-, y-, and z-axes increase accordingly. Under idle conditions, the dominant excitation frequencies along the y-axis are concentrated around 390 Hz, 282.5 Hz, and within the range of 860–920 Hz. For the z-axis, the main excitation frequencies are observed near 142.5 Hz and 195 Hz, as well as within 860–920 Hz. The x-axis shows prominent excitations around 230 Hz, 282.5 Hz, and in the 860–20 Hz range. Within the 0–400 Hz frequency range, the main excitation frequencies of the picking head are concentrated around 282.5 Hz and 390 Hz.
Under first-gear conditions, the y-axis exhibits dominant excitation frequencies around 480 Hz, within 630–690 Hz, and 960–1000 Hz. The z-axis shows major excitations near 720 Hz, within 630–690 Hz, and 960–1000 Hz. The x-axis is primarily excited around 240 Hz, within 640–680 Hz, and 960–1000 Hz. In the 0–400 Hz range, the dominant excitation frequencies of the picking head are centered around 240 Hz and 340 Hz. Under second-gear conditions, the y-axis exhibits dominant excitation frequencies near 507.5 Hz, within 720–760 Hz, and 980–1000 Hz. The z-axis shows strong excitations at approximately 735 Hz, within 830–920 Hz, and 980–1000 Hz. The x-axis shows the main excitations at 500–540 Hz, 720–760 Hz, and 980–1000 Hz. Within the 0–400 Hz frequency range, the excitation frequency is concentrated around 380 Hz.
In summary, the excitation effect of the picking head on the frame is most substantial along the y-axis, followed by the z-axis, and weakest along the x-axis. Vibration frequency analysis of the picking head reveals that its excitation behavior exhibits no apparent regularity. This irregularity is likely due to multiple rotating components within the picking head, including the picking drum, spindle seat tube, doffing disc, and spindles. During operation, interactions among these rotating components generate complex vibration coupling, resulting in an irregular vibration response of the overall picking head.
2.5. Analysis of Other Excitation Characteristics
During cotton picking machine operation, additional vibrations are generated by the packing system and by road-induced excitations. Therefore, further analysis was conducted on the excitations induced by the packing system and road surface:
(1) The cotton picker’s packing unit consists of the packing chamber, film feeding mechanism, film roll box, and hydraulic system. The excitation frequency generated by rotating components can be calculated using Formula (3). The excitation of the packing system components can be derived from their respective rotational speeds. The primary excitation sources of the packing system components are listed in Table 2.
where f3 is the frequency (Hz), and n3 is the rotational speed (r/min).
Table 2.
Cotton picker packing device component speed.
(2) The unevenness of the road surface affects the vibration characteristics of the frame. Since the cotton picker operates in the field, studies have shown that the excitation frequencies induced by the terrain on harvesting machinery generally remain below 3 Hz [].
3. Static Analysis of the Frame
3.1. Frame Structure Design and Model Development
The weight distribution and dynamic and static characteristics of the frame directly influence the overall steering, ridge crossing, and field-passing performance of the cotton picker. The frame structure is fabricated by welding together thin plates of varying thicknesses and rectangular tubes of different specifications to ensure adequate strength and stiffness. Given the cotton cultivation patterns in Xinjiang and the operational conditions of the cotton picker, Q345 alloy steel, with its high strength, was selected as the frame material. The frame designed in this study was fabricated by welding together rectangular tubes with dimensions of 200 mm × 100 mm × 10 mm and 100 mm × 80 mm × 5 mm, along with five mm thick steel plates. The front section of the frame features a V-shaped arrangement formed by the front and rear diagonal support rectangular tubes. The middle section is primarily composed of longitudinal beams and reinforced rectangular tubes, while the rear section of the frame is made up of inclined longitudinal tubes and steel plates. A schematic diagram of the frame structure is shown in Figure 5a.
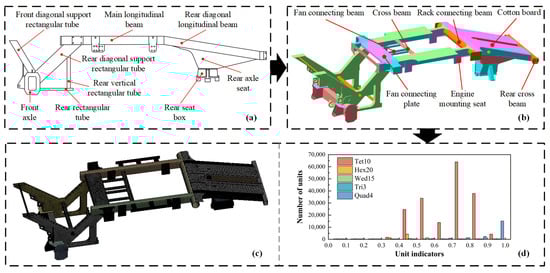
Figure 5.
(a) Schematic diagram of the frame structure; (b) Three-dimensional model of the frame. (c) Meshing diagram of the frame; (d) Diagram of element composition in the frame mesh.
The frame of the cotton picker is primarily composed of longitudinal beams, transverse beams, and reinforcing ribs. After determining the dimensions and material of the frame, a 3D model of the chassis frame was created in SolidWorks 2018. The frame measures 6200 mm in length (along the forward direction), 2150 mm in width, and 1300 mm in height. It is mainly fabricated by welding sheet steel and tubular steel components of various specifications, all made from Q345 low-alloy high-strength steel. The 3D model of the frame is shown in Figure 5b. In the parametric modeling of the cotton picker frame, the solid model must be simplified to enhance the computational efficiency of the modal analysis [,]. Several aspects need to be considered. First, the effect of welding on the frame’s vibration characteristics was neglected. Second, all chamfers and fillets were simplified to sharp right angles. Third, process holes and small structures on the frame were ignored. Before conducting the finite element modal simulation, the frame material parameters were defined. The material used is Q345 structural steel with an elastic modulus of 210 GPa, a density of 7850 kg/m3, and a Poisson’s ratio of 0.3. The element type was set as CTRIA4 with an element size of 30 mm. The model was meshed regionally, resulting in 558,367 nodes and 354,012 elements, with an average mass of 0.71. The mesh generation results are shown in Figure 5c,d.
3.2. Frame Layout and Structural Optimization
To determine the optimal frame configuration for the cotton picker, multiple experimental schemes were developed by adjusting the installation positions of the fan, engine, and the relative position between the front support plate and the central longitudinal beam. The lateral positions of the frame were not adjusted due to its bilateral symmetry and the symmetrical distribution of all components along the central axis (left–right). Instead, longitudinal adjustments were employed to reduce load concentration and lower the center of gravity. The picking head, engine, and fan are the main working components of the cotton picker, whereas the layout optimization was achieved by adjusting their relative positions on the frame. Due to the significant weight of the picking head and its fixed mounting on the front support plate, this study adjusts the position of the front support plate relative to the front section of the central longitudinal beam to reposition the picking head. The operating conditions of the cotton picker were simulated in ANSYS 2021 R2. This simulation aims to optimize the frame layout by varying the relative load-bearing positions of the power and transmission systems, the fan, and the front support plate.
The maximum deformation and maximum stress of the frame were selected as evaluation indicators. The distance from the center of the power and transmission system to the front section of the central longitudinal beam is denoted as X1. X1 is defined at three levels: 1500 mm, 1575 mm, and 1650 mm. The distance from the center of the fan mounting plate to the front section of the central longitudinal beam, denoted X2, has three levels: 725 mm, 805 mm, and 885 mm. The distance from the center of the welding point between the front support plate and the central longitudinal beam to the front section of the main longitudinal beam is denoted X3 and has three levels: 275 mm, 335 mm, and 435 mm. An orthogonal experiment with three factors and three levels was used, yielding nine test groups. ANSYS finite element simulation software was used to evaluate the frame’s stress and strain under normal operating conditions. The results show that both stress and strain remained within the design range. The cotton picker exhibits more pronounced vibration in the second gear. Therefore, the vibration frequencies and amplitudes of the engine, fan, and picking head at this operating state were used as random vibration parameters and input to the model for response-spectrum analysis of the frame, as shown in Table 3.
Table 3.
Design scheme for response-spectrum test under second-gear operating conditions.
Analysis of variance was performed using Design-Expert 12.0 software based on the data in Table 3. The effects of the layout of vibration sources, including the engine, fan, and front support plate, on the frame’s response spectrum were investigated. The relationships between the influencing factors and the evaluating indicators are presented in Table 4 and illustrated in Figure 6.
Table 4.
Experimental design and results.
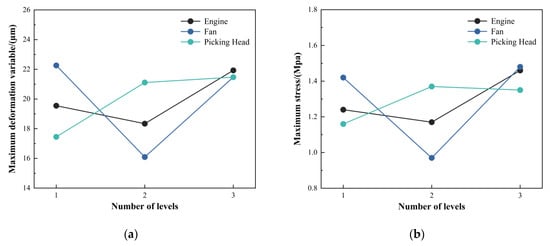
Figure 6.
(a) Results of maximum deformation; (b) Results of maximum stress.
As shown in Figure 6, the deformation (Y1) and maximum stress (Y2) of the engine initially increase and then decrease with the increase of X1 and X2. The Y1 and Y2 of the fan rise initially, then decline as X1 and X2 increase. In contrast, for the front support plate, both Y1 and Y2 consistently increase with increasing X1 and X2. In summary, the rate of change of the engine, fan, and front support plate decreases in sequence. This indicates that the engine has the most significant impact on the frame’s maximum deformation and stress, followed by the fan, while the front support plate exhibits relatively stable behavior. The optimal layout configuration for the cotton picker frame is determined as follows: the engine is positioned 1575 mm from the front end of the central longitudinal beam, the fan is positioned 805 mm from the front end of the central longitudinal beam, and the front support plate is positioned 275 mm from the front end of the central longitudinal beam. This optimal configuration was applied to the frame model for further structural and stress–strain analysis. The results showed that the frame exhibited a maximum stress of 215.65 Mpa and a maximum deformation of 2.42 mm.
Since the cotton picker frame is subjected to various loads during actual operation, including static component loads, it is necessary to optimize regions experiencing high stress and deformation. Reinforcing plates and stiffeners were added at critical locations with high stress and deformation to optimize the frame structure, as shown in Figure 7. A comparison of the frame optimization results showed that the maximum stress decreased from 215.65 Mpa to 95.3 Mpa. The maximum deformation was reduced from 2.42 mm to 0.715 mm, indicating a significant improvement in the frame’s structural performance.
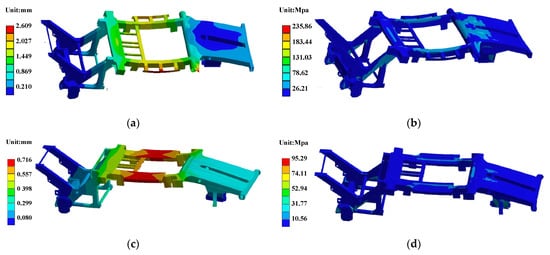
Figure 7.
(a) Deformation cloud diagram before optimization; (b) Stress cloud diagram before optimization; (c) Deformation cloud diagram after optimization; (d) Stress cloud diagram after optimization.
3.3. Static Verification of the Frame
The cotton picker frame may experience both bending and torsional deformations under various loads. Based on the cotton picker’s working conditions and the frame’s load characteristics, the frame’s working conditions can be categorized into four types: full-load bending, partial-load bending, full-load obstacle-crossing, and unloading.
Different loading strategies were adopted for different conditions. Under the full-load bending condition, all degrees of freedom at the frame and rear axle bracket were constrained. Since the picking head is mounted via a linkage, the load was applied using the force components method, while the other components’ loads were applied vertically. In the partial-load bending condition, the frame was considered to be tilted by 20°, with all degrees of freedom constrained at the right side of the front axle and the rear axle bracket. Therefore, the machine operating on a slope was simulated under partial load, with the load applied as in the full-load condition. For the full-load obstacle-crossing condition, the right side of the front axle and the rear axle bracket were fully constrained. An upward displacement constraint of 5 mm was applied to the left front axle to simulate full-load conditions, in which the left front wheel encounters an obstacle and is lifted, inducing torsion in the frame. Under the unloading condition, the rear section of the baling mechanism is lifted by hydraulic rods, allowing the cotton bale to drop onto the cotton-receiving plate. In this case, all degrees of freedom at the frame and rear axle bracket were constrained, and the bale load was applied to the cotton-receiving plate. The resulting stress and deformation contour plots for each condition are shown in Figure 8.
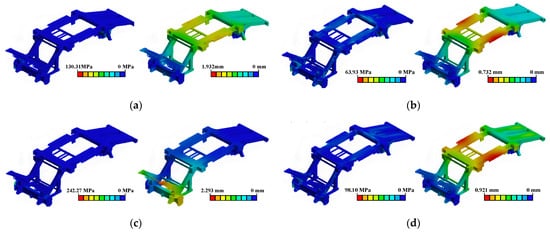
Figure 8.
(a) Stress and deformation nephograms of the full-load bending condition; (b) Stress and deformation nephograms of the partial-load bending condition; (c) Stress and deformation nephograms of the full-load obstacle-crossing condition; (d) Stress and deformation nephograms of the unloading condition.
Under full-load conditions, the maximum deformation of the frame occurs at the left- and right-side plates in the middle section, with a maximum value of 1.932 mm, as shown in Figure 8a. This is mainly due to the heavy load imposed by the cotton box and packaging device on the side plates, making them more susceptible to deformation under pressure. The allowable deformation for the entire machine is in the range of 0.003 LO1–0.005 LO1, in which LO1 is defined relative to the front-to-rear axle distance of 4318 mm. These results indicate that the observed deformation falls within the acceptable range and the frame stiffness meets the design requirements. The maximum stress occurs at the rear axle bracket, reaching 130.3 MPa, due to load concentration in the middle and rear parts of the frame caused by the cotton package. This value is below the allowable stress of the Q345 material, indicating sufficient structural strength. Under partial-load conditions, the maximum deformation occurs at the upper side plates of the frame(Figure 8b), with a maximum value of 0.73 mm, confirming that the frame stiffness meets the requirements. The maximum stress appears at the rear axle bracket, reaching 63.927 Mpa, confirming that the structural strength is adequate. As can be seen in Figure 8c, under the full-load obstacle crossing condition, the maximum deformation occurs at the frame support plate, with a value of 2.29 mm, which indicates the frame has sufficient stiffness. The maximum stress occurs on the left side of the front axle, reaching 242.27 Mpa, confirming that the frame strength remains within the material’s allowable limit. As shown in Figure 8d, under the unloading condition, the maximum deformation occurs at the left and right side plates in the middle of the frame, with a value of 0.92 mm, indicating that the frame stiffness is satisfactory. The maximum stress occurs at the rear axle bracket of the frame, reaching 98.1 Mpa, indicating that the strength requirement is also met.
4. Modal Analysis of the Frame
4.1. Natural Frequencies of the Frame
Modal analysis of the frame structure is a key component in the structural assessment of agricultural machinery during product development. These parameters of a modal analysis not only reflect the overall stiffness performance of the frame but also serve as critical indicators for controlling the entire machine’s vibration characteristics. Considering the actual working conditions of the cotton picker, the first six non-zero mode frequencies and shapes were extracted for analysis []. Based on the NX Nastran simulation module and the Lanczos method, dynamic analysis and frame calculation are performed. The first six natural frequencies and vibration modes of the cotton picker frame are obtained as shown in Figure 9.
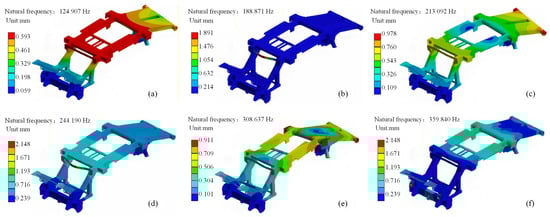
Figure 9.
Natural frequencies and corresponding mode shape contour plots: (a) First-order mode shape; (b) Second-order mode shape; (c) Third-order mode shape; (d) Fourth-order mode shape; (e) Fifth-order mode shape; (f) Sixth-order mode shape.
4.2. Modal Test of the Frame
Modal testing is an effective method to validate the accuracy of the finite element model of the frame. Numerous simplifications in the computational modal analysis result in significant deviations between experimentally measured and calculated modes. The fundamental schematic diagram of the modal test is shown in Figure 10a.
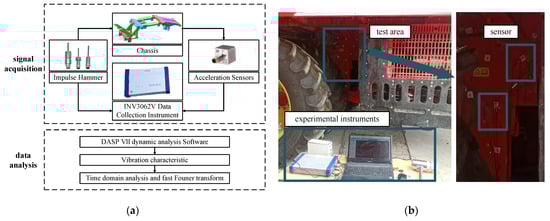
Figure 10.
(a) Basic principle diagram of the modal test; (b) On-site test diagram.
The on-site experimental setup is shown in Figure 10b. The test employed an INV3062V signal acquisition and analysis instrument with 16 channels, 24-bit resolution, and antialiasing filtering. Excitation of the frame was performed using a DFC-2 high-elasticity polyurethane hammer (Manufacturer: Beijing Oriental Institute of Vibration and Noise Technology, Beijing, China). A charge amplifier amplified the charge signal. The signal acquisition was conducted using an INV9822 accelerometer (Manufacturer: Beijing Oriental Institute of Vibration and Noise Technology, Beijing, China) with a measurement range of 100 g, a sensitivity of 100 mV·g1, and a frequency response of 0.5–8 kHz. During the modal test, the sampling frequency was set to 2560 Hz, and the analysis frequency was set to 1000 Hz. A signal-triggered method was adopted, and the average value from multiple triggers was used as the sampling approach.
The excitation and response of the frame were measured using the Multiple-Input Multiple-Output (MIMO) method, which falls under the single-point excitation and multi-point response category, using a fixed-force hammer and moving sensors. To ensure a high signal-to-noise ratio and accurate modal identification during the arrangement of measurement points, the locations were carefully selected to avoid the nodal points of the modal shapes. Instead, the application points of the external force, the structural junctions, and the key response locations on the frame were chosen as measurement points. A total of 114 measurement points were arranged on the frame. Additionally, a region of the frame with significantly high structural stiffness was selected as the excitation point, which was struck with a hammer to excite the entire frame.
During the modal test, the cotton picker frame was first constrained to its original configuration to ensure consistency between the simulation constraints and the actual working state. Sensors were mounted at measurement points on the cotton-picking machine frame. The force hammer was used to apply excitation at designated locations. At the same time, the data acquisition system simultaneously recorded the excitation force signal (via the hammer’s integrated force sensor) and the structural-response signals (via the accelerometers). Analysis of the experimentally obtained frequency-response functions enabled the identification of the frame’s fundamental natural frequencies and corresponding vibrational mode shapes.
After acquiring vibration signals from the frame structure using accelerometers, parameter identification was performed on the signals. The identified modal parameters were then mapped to the established experimental model to extract the structure’s inherent dynamic properties []. The first six modal frequencies, damping ratios, and mode shapes of the frame were extracted from the experimental modal analysis within the frequency range of 0–400 Hz. The results are shown in Figure 11.
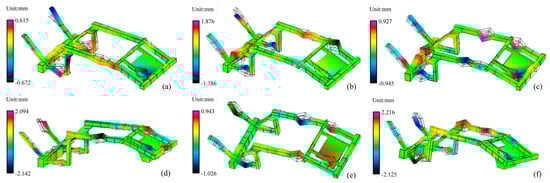
Figure 11.
Modal natural frequency and vibration mode diagram of the frame test. (a) First-order modal diagram; (b) Second-order modal diagram; (c) Third-order modal diagram; (d) Fourth-order modal diagram; (e) Fifth-order modal diagram; (f) Sixth-order modal diagram.
Table 5 presents a comparative analysis of the simulation results and the experimental modal test results. The finite element analysis is generally consistent with those obtained from the experimental modal test. The maximum deviation in natural frequency is 4.3%, which verifies the accuracy of the finite element model. The mode shapes are primarily characterized by bending and torsion.
Table 5.
Comparison of modal test and finite element calculation result.
5. Vibration Testing of the Cotton Picker Frame
As a machine with multiple excitation sources, the six-row cotton picker is primarily subjected to vibrations from the engine, the fan, and the picking heads. During operation, these excitations induce unbalanced dynamic forces that interact and propagate throughout the frame and the entire machine structure, thereby subjecting the frame to coupled vibrational excitation. To investigate these multi-excitation coupling behaviors, we designed experimental scenarios. The machine was stationary while the engine and working components operated at different gear settings. Vibration signals acquired from the frame were analyzed in both the time and frequency domains. Time-domain analysis was used to assess the overall vibration intensity and to elucidate the structural response mechanisms under multi-source excitation. Frequency-domain analysis was performed to examine the contribution of individual excitation sources to the frame’s vibrational characteristics.
5.1. Design of Frame Vibration Test
The vibration test system for the frame primarily consists of a triaxial accelerometer, a data acquisition unit, and a display terminal (laptop). The test adopts a continuous sampling method to collect vibration signals. The sampling frequency was set to 2560 Hz, the analysis frequency to 1000 Hz, the number of time-domain analysis points to 4096, the number of spectral lines to 1600, and the frequency resolution to 2.5 Hz.
The measurement points in this test were selected at the connections between primary vibration sources and the frame, as well as at key structural locations of the frame. The test conditions included stationary no-load and working conditions of the engine and operating components. The engine’s operating states were simulated by varying its speed, and vibration tests of the cotton picker frame were conducted. The coordinate system was defined as follows: the forward direction of the self-propelled cotton picker was set as the positive x-axis, the lateral direction as the positive y-axis, and the direction perpendicular to the ground as the positive z-axis.
During the vibration test, to investigate the frame’s vibration characteristics, the structure was divided into several main components: the front axle, the picker header welded frame, the welded frame connecting plate, the central longitudinal beam, and the rear diagonal beam. A total of 19 representative measurement points were selected at these critical structural locations for testing. The selection of measurement points was intended to fully capture the global, local, and structural deformation properties of the cotton picker frame. Since the frame exhibits symmetry about its central axis, an asymmetrical distribution of the measurement points was adopted to enhance the accuracy and diversity of the test. Figure 12 presents the layout of the measurement points.
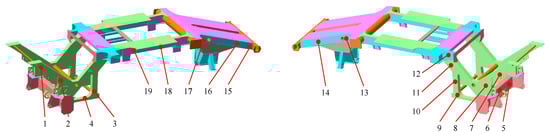
Figure 12.
Frame measuring points distribution diagram.
5.2. Time-Domain Analysis of Frame Vibration
Under static conditions of the cotton picker, with the engine and working components operating, the amplitude distribution characteristics of the frame in three directions were measured under different gear conditions. Sampling was performed for 6 s after the vibration signal stabilized. Figure 13 depicts the time-domain vibrational signal.
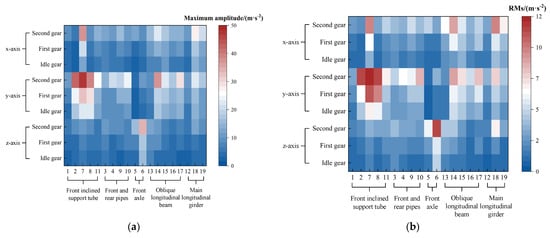
Figure 13.
(a) Statistical chart of the maximum vibration amplitudes at all measurement points; (b) Statistical chart of the RMS value at all measurement points.
The vibration characteristics of the rectangular tube used as the front diagonal support were analyzed. As shown in Figure 13a,b, the dominant vibration direction of the front diagonal rectangular support tube is the y-axis. In the x-direction, the smallest vibration amplitude occurred at the upper region of the front side of the front diagonal rectangular support tube (Point 1). However, the maximum amplitude was observed at the middle region of the front side of the same tube (Point 7). In the y-direction, the smallest amplitude also occurred at Point 1, while the maximum amplitude was observed at Point 7. In the Z direction, the smallest amplitude was recorded at the lower region of the front diagonal rectangular support tube (Point 2), while the maximum amplitude was observed at Point 7. Points 2, 7, and 8 are located near the operating region of the picking heading, which results in relatively large vibration amplitudes. Point 1, located at the connection between the front support bracket and the operator platform, exhibited a lower amplitude. Points 2 and 8 were located near the junction between the front axle and the welded frame, where the vibration amplitude of the excitation from the picking head in the z-direction experienced significant attenuation during transmission.
The vibration characteristics of the rear rectangular tube in the frame’s frontal regions were analyzed. As shown in Figure 13a,b, the dominant vibration direction of the rear rectangular tube is along the y-axis. In the x direction, the smallest vibration amplitude was observed at the lower regions of the rear vertical rectangular tube (Point 10). In contrast, the largest vibration amplitude occurred at the lower-middle regions of the rear vertical rectangular tube (Point 3). In the y direction, the minimum vibration amplitude also appeared at Point 3, whereas the maximum vibration amplitude was found at Point 10. In the z direction, the smallest vibration amplitude occurred at the middle regions of the rear rectangular tube (Point 4), and the maximum vibration amplitude was recorded at the rear regions of the rear rectangular tube (Point 9).
The vibration characteristics of the frame’s front axle were analyzed. As shown in Figure 13a,b, the dominant vibration direction of the front axle is along the x-axis. The minimum vibration amplitudes in all three directions were observed at the left regions of the front axle (Point 5). In contrast, the maximum vibration amplitudes occurred at the middle regions of the front axle (Point 6). The y-axis vibration amplitude and RMS value at Point 5 were the lowest among all measurement points, whereas the x-axis vibration amplitude and RMS value at Point 6 were the highest.
The vibration characteristics of the rear diagonal longitudinal beam of the frame were analyzed. As shown in Figure 13a,b, the dominant vibration direction of the rear diagonal longitudinal beam is along the y-axis. The vibration amplitudes and RMS values in the y-axis direction at the five measurement points on the rear diagonal longitudinal beam were all relatively high compared to other locations. In the x direction, the minimum vibration amplitude was observed at the lower-middle regions of the rear diagonal longitudinal beam (Point 16). The maximum vibration amplitude occurred at the upper-middle regions of the rear diagonal longitudinal beam (Point 13). In the Y direction, the minimum vibration amplitude was recorded at Point 13, and the maximum vibration amplitude at the central regions of the beam (Point 14). In the z direction, the minimum vibration amplitude also occurred at Point 16, and the maximum vibration amplitude was observed at Point 14.
Point 13 is located at the junction of the cotton unloading crossbeam and the rear diagonal longitudinal beam, which was influenced by the vibrations of the central longitudinal beam.
As shown in Figure 13a,b, the vibration analysis shows that the central longitudinal beam vibrates predominantly in the Y and Z directions. The minimum vibration amplitudes in the X, Y, and Z directions were observed at the front regions of the central longitudinal beam (Point 12). In contrast, the peak vibration amplitude was located at the middle of the central longitudinal beam (Point 18). The relatively low vibration amplitude at Point 12 is attributed to its location at the structural junction between the central longitudinal beam and the front support plate.
In summary, the maximum vibration amplitudes and RMS values of the cotton picker frame in the X, Y, and Z directions increased with the rise in engine gear level. The vibration amplitude at first-gear was not significantly different from that at idle, while a more pronounced difference was observed from first gear to second gear. The vibration of the rear diagonal longitudinal beam of the frame was predominantly along the y-axis, and the central longitudinal beam exhibited dominant vibrations in both the Y and Z directions. The front axle was mainly excited along the x-axis, and the front support plate primarily vibrated in the Y direction. The severity of vibration was ranked as follows: front support plate > front axle > rear diagonal longitudinal beam > main longitudinal beam. In the X direction, the smallest vibration amplitude occurred at the front regions of the front diagonal support rectangular tube of the front support plate (Point 1), and the largest vibration amplitude occurred at the middle regions of the front axle (Point 6). In the Y direction, the smallest vibration amplitude was found at both sides of the front axle (Point 5), while the largest vibration amplitude was at the middle regions of the front diagonal support rectangular tube of the front support plate (Point 7). In the Z direction, the smallest vibration amplitude appeared at the bottom regions of the front support plate (Point 2), and the largest vibration amplitude was observed at the middle regions of the front diagonal support rectangular tube of the front support bracket (Point 7). The points with the smallest vibration amplitudes were generally located at structural joints of the frame, whereas the largest amplitudes occurred at locations where excitation forces from vibration sources were directly transmitted to the frame.
5.3. Frequency-Domain Analysis of Frame Vibration
In engineering practice, low-order system frequencies are more likely to induce global structural vibrations with relatively large amplitudes. However, higher-order frequencies are generally far from the structure’s natural frequencies, resulting in relatively small vibration amplitudes. The vibration frequency range was set to 0–400 Hz based on the engine’s rated speed of 1900 r/min. A Fourier transform of the frame’s time-domain vibration signals was performed using the linear averaging method to obtain the first four vibration frequencies and their corresponding peak amplitudes. The frequency-domain signal data are presented in Figure 14, where the values above the table indicate the peak frequencies, and the values in parentheses represent the corresponding amplitudes.
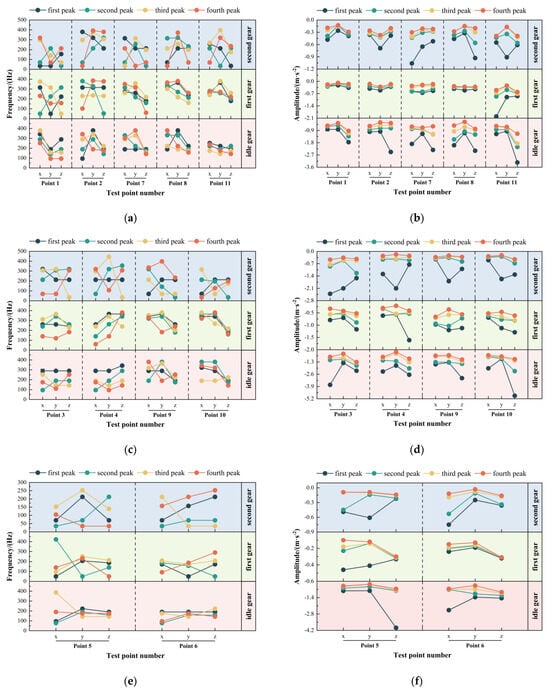
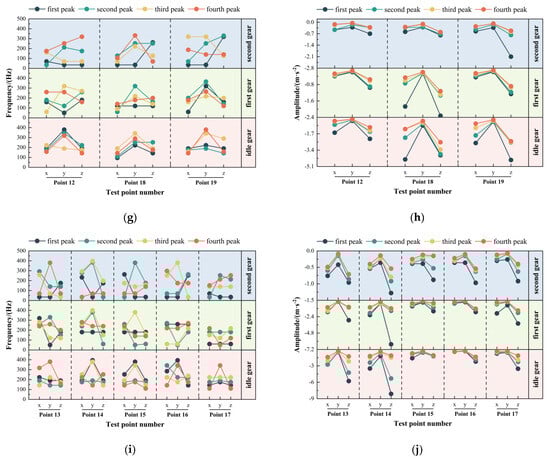
Figure 14.
Frequency-domain characteristics of each measuring point. (a) Frequency-domain signal frequency statistical diagram of the diagonal support rectangular tube of the frame; (b) Frequency-domain signal peak statistical diagram of the diagonal support rectangular tube of the frame; (c) Frequency-domain signal frequency statistical diagram of the rear rectangular tube in the front regions of the frame; (d) Frequency-domain signal peak statistical diagram of the rear rectangular tube in the front regions of the frame; (e) Frequency-domain signal frequency statistical diagram of the frame’s front axle; (f) Frequency-domain signal peak statistical diagram of the frame’s front axle; (g) Frequency-domain signal frequency statistical diagram of the main longitudinal beam; (h) Frequency-domain signal peak statistical diagram of the main longitudinal beam; (i) Frequency-domain signal frequency statistical diagram of the rear diagonal longitudinal beam; (j) Frequency-domain signal peak statistical diagram of the rear diagonal longitudinal beam.
The vibration characteristics of the rectangular tube diagonal support of the frame were analyzed. As shown in Figure 14a,b, at idle speed, the main vibration frequencies of the diagonal support rectangular tube correspond to engine harmonics (35 Hz, 70 Hz) and coupled excitation from the engine (212.5 Hz). In addition, the coupled frequency (212.5 Hz) had a pronounced effect on the tube’s vibration. Under first-gear conditions, the dominant vibration frequencies of the front diagonal support rectangular tube of the frame shifted to coupled excitations (260 Hz, 315 Hz) and to fan excitation (50 Hz). In contrast, the influence of engine and fan-excitation frequencies was relatively minor. Under second-gear conditions, the main vibration frequencies of the front diagonal rectangular support tube are engine harmonics (95 Hz, 190 Hz), coupled excitations (175 Hz, 260 Hz, 290 Hz), and picking head excitation (380 Hz), where the coupled frequencies (175 Hz, 260 Hz, and 290 Hz) were identified as the primary vibration frequencies. Overall, in the front region of the frame, the engine had the most significant influence on vibration, followed by the picking head, then the fan.
Analysis of the vibration behavior of the rear rectangular tube in the front regions of the frame was conducted based on Figure 14c,d. Under idle conditions, the dominant vibration frequencies of the rear rectangular tube were harmonics (35, 70 Hz) and coupled excitations of the engine (212.5, 320 Hz). The coupled excitation frequencies dominated the vibration response, while the engine’s intrinsic excitation had a secondary influence. Under first-gear conditions, the primary vibration sources were the picking head excitations (240, 340 Hz) and coupled excitations (260, 365 Hz). The influence of engine excitation on the vibration was minor, while the picking head excitation had a relatively significant impact. Under second-gear conditions, the dominant vibration frequencies included engine harmonics (95, 190 Hz), coupled excitations (175, 290 Hz), and picking-head excitations (380 Hz). Coupled excitation frequencies dominated the vibration response, whereas the engine’s intrinsic excitation frequencies had a lesser effect. The vibration of the rear rectangular tube in the front regions of the frame was mainly influenced by the engine, followed by the picking head, with minimal contribution from the fan.
As illustrated in Figure 14e,f, vibration analysis of the frame’s front axle revealed that its dominant vibration frequencies consist of engine harmonics (35, 70 Hz) and coupled excitation frequencies (212.5 Hz) under idle conditions. Under first-gear conditions, the primary vibration frequencies shift to those induced by the fan (50 Hz) and coupled excitations (172.5, 187.5 Hz). Under second-gear conditions, the main vibration frequencies included engine harmonics (95, 190 Hz), fan-excitation frequencies (77.5 Hz), and coupled excitations (142.5, 157.5 Hz). In summary, the vibration of the front axle is primarily influenced by the engine’s intrinsic excitation frequencies at idle, by the fan and coupled excitation frequencies under first gear, and by the engine harmonics and coupled excitations under second gear.
As shown in Figure 14g,h, an analysis of the vibration characteristics of the central longitudinal beam of the frame revealed that the dominant vibration frequencies are engine harmonics (35, 70 Hz) and coupled excitations under idle conditions (252.5 Hz). Under first-gear conditions, the primary vibration frequencies include engine harmonics (60, 120, 180 Hz), coupled excitations (160, 320 Hz), and fan-excitation frequencies (50 Hz). Under second-gear conditions, the dominant frequencies shift to engine harmonics (95, 190 Hz), coupled excitations (142.5, 175, 222.5 Hz), and excitations (380 Hz) from the picking head. In summary, as engine speed increases, the influence of coupled excitations becomes more pronounced. For the left and right longitudinal beams of the frame, the vibration is primarily dominated by the engine’s intrinsic excitation frequencies at idle. Under first-gear conditions, the dominant influences are engine-intrinsic excitations and coupled frequencies, with additional effects from fan excitation. Under second-gear conditions, vibrations are mainly influenced by the engine’s intrinsic excitation and coupled frequencies, and coupled excitations have a significant influence on the vibration response. Among the three sources, the influence of the engine, fan, and picking head on the main longitudinal beams in the middle regions of the frame decreases in sequence.
An analysis of the vibration characteristics of the rear diagonal longitudinal beam of the cotton picker frame was performed. Figure 14i,j reveal that the dominant vibration frequencies of the rear diagonal longitudinal beam are primarily engine harmonics (35, 70 Hz) and coupled excitation frequencies (140, 175, 252.5 Hz) under idle conditions. Under first-gear conditions, the main vibration frequencies of the rear diagonal longitudinal beam transitioned to include engine harmonics (60, 120, 180 Hz), coupled excitations (260 Hz), and fan-excitation frequencies (50 Hz). Under second-gear conditions, the primary vibration frequencies comprised engine harmonics (190 Hz), coupled excitations (142.5, 175, 222.5 Hz), and excitations originating (380 Hz) from the picking head. In summary, the influence of coupled excitations becomes progressively more pronounced as engine speed increases. Under idle conditions, vibration of the rear diagonal longitudinal beam is predominantly governed by the engine’s intrinsic excitation frequencies. During first-gear operation, both engine and coupled excitation frequencies become dominant vibration sources, and the coupled excitations exert greater influence on the vibration. Under second-gear conditions, engine harmonics and coupled excitations remain the dominant influences on vibration. At the same time, fan excitation also exerts a considerable impact on the vibration of the rear diagonal longitudinal beam. Among all excitation sources, the influence of the engine, fan, and picking head on the main longitudinal beam located in the central region of the frame decreases in sequence.
6. Conclusions
This article describes the carefully designed installation positions of various components on the frame. The frame structure was optimized through an integrated approach combining experimental analysis and simulation. Our research leads to the following conclusions:
- (1)
- The engine excitation is primarily characterized by its intrinsic frequencies. As the gear increases, coupled excitation frequencies become more prominent due to the increasing influence of other components. Under idle and first-gear conditions, the fan’s vibration frequency is strongly influenced by the engine’s dominant excitation frequency, as the fan is belt-driven by the engine. Therefore, coupled excitations dominate, while the fan’s intrinsic excitation amplitudes remain low. During second-gear operation, the fan demonstrates more pronounced intrinsic excitation characteristics, while coupled excitations originating from both the fan and engine remain dominant. The picking head exhibits complex vibration-coupling behavior. Its dominant vibration frequencies are centered at 282.5 Hz and 240 Hz under idle and first-gear conditions, respectively. However, the dominant frequencies are concentrated at 507.5 Hz, 735 Hz, and 877.5 Hz under second-gear conditions. Furthermore, the operation of the picking head generates significant vibration noise.
- (2)
- The maximum deformation and maximum stress of the different frame models were calculated using the finite element simulation with ANSYS. Response surface analysis was then used to identify the optimal frame layout. The engine is positioned 1575 mm from the front edge of the central longitudinal beam. In comparison, the fan and front support bracket are located 805 mm and 275 mm from the front edge of the central longitudinal beam, respectively.
- (3)
- Experimental analysis was performed on the prototype. The first six natural frequencies of the cotton picker’s frame ranged from 130 Hz to 367.5 Hz, with the dominant mode shapes identified as bending and torsion. The finite element analysis results showed good agreement with the experimental modal data in both natural frequencies and mode shapes. The maximum deviation in natural frequency was 4.3%, indicating that the prototype frame meets the design requirements.
- (4)
- The vibration conditions of the frame’s key structures were obtained. At idle, the vibrations of the rear diagonal beam and longitudinal beam were primarily dominated by the engine’s inherent excitation frequency. In first gear, both the engine’s inherent frequency and coupled excitation frequencies were predominant, with the coupled components having a greater influence. In second gear, the inherent and coupled frequencies remained dominant. For the frame’s front axle, the engine’s inherent frequency dominated at idle, whereas coupled excitation frequencies prevailed in first gear. In second gear, both the inherent and coupled frequencies were dominant. The front section of the frame’s front support plate was strongly excited by the picking heads, with coupled excitation being dominant (212.5 Hz at idle; 260 Hz, 340 Hz, and 365 Hz in first gear; and 175 Hz and 290 Hz in second gear). The rear section of the front support plate was primarily subjected to a combination of engine excitation and coupled excitation.
Future work will focus on three key directions. First, an electrodynamic shaker will be used as the excitation source when investigating the frame’s inherent properties. In addition, the frame will be suspended with elastic ropes to simulate a free–free boundary condition, thereby improving the accuracy of the modal analysis. Second, the influence of different road conditions on the frame’s vibrational characteristics during operation will be examined. Third, a more in-depth analysis will be conducted on the mechanisms, causes, and transmission paths of vibration, as well as the coupling effects among different vibrational subsystems. These efforts will further strengthen the theoretical basis for the structural design of six-row self-propelled cotton picker frames.
Author Contributions
Conceptualization, H.J., P.Z., X.B., T.P., J.D., J.Y. and J.S.; methodology, H.J., P.Z., X.B. and T.P.; software, H.J., T.P. and X.B.; validation, H.J., P.Z. and T.P.; formal analysis, H.J., T.P. and J.D.; investigation, H.J., P.Z., T.P., J.D. and Y.B., resources, H.J., P.Z., X.B. and T.P.; data curation, H.J., P.Z., T.P. and Y.B.; writing—original draft preparation, H.J., T.P. and X.B.; writing—review and editing, H.J., T.P., X.B. and J.D.; visualization, P.Z., J.D., J.Y. and J.S.; supervision, J.Y. and J.S.; project administration, X.B.; funding acquisition, X.B. All authors have read and agreed to the published version of the manuscript.
Funding
This study was funded by the Wujiaqu Science and Technology Plan Project of the Sixth Division of Xinjiang Production and Construction Corps (2512), the Integrated Project of Agricultural Machinery Research and Development, Manufacturing, Promotion and Application of Xinjiang Production and Construction Corps (NY240612-01) and the Xinjiang Production and Construction Corps Characteristic Industry Talent Support Project (CY2025012).
Institutional Review Board Statement
Not applicable.
Data Availability Statement
All relevant data presented in this paper are according to institutional requirements and, as such, are not available online. However, all data used in this manuscript are available from the authors upon reasonable request.
Conflicts of Interest
Authors Pengda Zhao, Jianning Yang and Yuxin Bao were employed by the company Shandong Swan Modernization Agricultural Machinery Equipment Co., Ltd. The remaining authors declare that the research was conducted in the absence of any commercial or financial relationships that could be construed as a potential conflict of interest.
References
- Lin, H. Significant achievements in innovative research and development have led to the trend of domestic cotton picking machines replacing imports. Agric. Mach. Qual. Superv. 2022, 11, 34–35. [Google Scholar]
- Tang, Z.; Zhang, H.T.; Zhou, Y.P. Mutual Interference and Coupling Response of Multicylinder Vibration among Combine Harvester Co-Frame. Shock. Vib. 2019, 1, 1584391. [Google Scholar] [CrossRef]
- Shao, W.; Feng, J.; Zhang, F.; Wang, S.; Li, Y.; Lv, J. Aerodynamic Performance Optimization of Centrifugal Fan Blade for Air System of Self-Propelled Cotton-Picking Machine. Agriculture 2023, 13, 1579. [Google Scholar] [CrossRef]
- Wang, G.H.; Liu, H.; Wang, Y.G.; Bi, X.S.; Pei, T.W.; Zhao, P.D. Modal analysis and optimization of cotton picking machine frame. China Agric. Mach. Chem. Rep. 2024, 45, 63–71. [Google Scholar]
- Shi, M.L.; Gao, X.Y.; Zhang, W.D.; Ran, K.L.; Zhong, L.Y.; Xu, L.Z. Research status and prospects of key technologies for cotton picking machines. Trans. Chin. Soc. Agric. Mach. 2025, 56, 167–183. [Google Scholar]
- An, X.; Li, Z.G.; Manuela, Z.S.; Fideline, T.M.; Yang, Y.G. Characterization of textural failure mechanics of strawberry fruit. J. Food Eng. 2020, 282, 110016. [Google Scholar] [CrossRef]
- Li, Y.W. Vibration Analysis and Structural Parameter Optimization of the Joint Harvester Cutting Platform frame; Jiangsu University: Zhenjiang, China, 2015. [Google Scholar]
- Liu, Y.M.; Li, Y.W.; Xu, L.Z.; Hu, B.Y.; Wang, R. Optimization of structural parameters of the joint harvester cutting platform frame. J. Agric. Eng. 2014, 30, 30–37. [Google Scholar]
- Hou, J.; Xie, F.P.; Wang, X.S.; Liu, D.W.; Ji, B. Design and Testing of Multi Crop Harvester Cutting Platform. J. Hunan Agric. Univ. (Nat. Sci. Ed.) 2023, 49, 223–230. [Google Scholar]
- Chen, S.R.; Zhou, Y.P.; Tang, Z.; Lu, S.N. Modal vibration response of rice combine harvester frame under multi-source excitation. Biosyst. Eng. 2020, 194, 177–195. [Google Scholar] [CrossRef]
- Zhou, J.F. Research on the Transmission Characteristics of Tree Building Vibration Based on the Main Branch Vibration Method; Anhui Agricultural University: Anhui, China, 2023. [Google Scholar]
- Shen, Y.F. Vibration Analysis and Structural Optimization of the Main Frame of the Cutting Table of the Tracked Rapeseed Sun Cutting Machine; Huazhong Agricultural University: Hubei, China, 2023. [Google Scholar]
- Yuan, S.L. Design and Performance Study of High Gap Corn Harvester Chassis Structure; Sichuan Agricultural University: Sichuan, China, 2023. [Google Scholar]
- Szykman, S.; Cagan, J. Constrained three-dimensional componet layout using simulate annealing. ASME J. Mech. Des. 1997, 119, 28–35. [Google Scholar] [CrossRef]
- Zeng, Z.Q. Overall Research and Design Analysis of the Frame of a Small Wheeled Sugarcane Harvester; Guangxi University: Guangxi, China, 2007. [Google Scholar]
- Fan, Z.D. Research on Layout Optimization of Small Sugarcane Harvester Based on Dynamic Rigidity of Cutter; Guangxi University: Guangxi, China, 2012. [Google Scholar]
- Ma, L.F.; Wang, L.L.; Yang, B.X.; Fan, Z.D.; Xue, B.; Zhou, J.Y. Design and simulation of sugarcane harvester based on blade rigidity. China Agric. Mach. Chem. Rep. 2015, 36, 54–58. [Google Scholar]
- Ma, L.F.; Cai, L.; Yang, D.Y.; Fan, Z.D.; Zhao, J.; Zhong, J.Q.; Ye, C.F. Experimental study on the layout of sugarcane harvester based on the dynamic rigidity of the cutter head. J. Agric. Mech. Res. 2016, 38, 213–218+223. [Google Scholar]
- Hu, C.J. Optimization Design and Vibration Analysis of the Whole Structure of Electric Micro Tiller; Southwest University: Chongqing, China, 2018. [Google Scholar]
- Zhang, K.K. Research on the Overall Layout and Dynamic Simulation of Buckwheat Picking and Harvesting Machine; Northwest A&F University: Shanxi, China, 2019. [Google Scholar]
- Lai, X.; He, G.Q.; Li, X.P.; Zeng, B.; Mo, H.N.; Teng, X.; Cao, B.X. Experimental study on axial vibration of sugarcane harvester cutting system. J. Agric. Eng. 2021, 37, 12–20. [Google Scholar]
- Zhou, Z.Y.; Tu, Q.L.; Zeng, L.; Zeng, S. Design and Performance Testing of Track type Regenerated Rice Harvester. Mod. Agric. Equip. 2022, 43, 35–40. [Google Scholar]
- Wang, G.; Lin, H.; Wang, Y.; Bi, X.; Pei, T.; Zhao, P. Modal analysis and optimization of cotton picker frame. J. Chin. Agric. Mech. 2024, 45, 63–71. [Google Scholar] [CrossRef]
- Dong, J.; Wang, G.; Lin, H.; Bi, X.; Li, Z.; Zhao, P.; Pei, T.; Tan, F. Vibration Characteristic Analysis and Structural Optimization of the Frame of a Triplex Row-Baling Cotton Picker. Agriculture 2023, 13, 1440. [Google Scholar] [CrossRef]
- Wen, D.J.; Zhang, L.; Zhang, H. Modal test analysis of polymer based composite engine body. J. Agric. Eng. 2005, 21, 22–24. [Google Scholar]
- Yang, H.X.; Tang, W.C. Static strength and modal finite element analysis of locomotive frame. Machinery 2006, 33, 14–16. [Google Scholar]
- Wang, Y.; Cheng, Y. Analysis and research on vibration signals of cylinder head surface during in cylinder combustion process. Vib. Shock. 2021, 40, 210–215+254. [Google Scholar]
- Yao, Y.C.; Song, Z.H.; Du, Y.F.; Zhao, X.Y.; Mao, E.R.; Liu, F. Analysis of Vibration Characteristics and Main Influencing Factors of Corn Harvester Cutting Platform. J. Agric. Eng. 2017, 33, 40–49. [Google Scholar]
- Zhang, K.P.; Shao, L.; Lyu, J.C.; Deng, C. Modal analysis of tractor frame. Pract. Automot. Technol. 2012, 1, 35–39. [Google Scholar]
- Si, J.P.; Han, L.; Ren, Q.S. Modal analysis of dump truck subframe structure based on ANSYS. J. Inn. Mong. Univ. Technol. 2011, 3, 329–333. [Google Scholar]
- Wang, X.D.; Hu, D.F.; Du, Y.P. Finite element analysis and testing of corn harvester chassis frame. China Agric. Mach. Chem. Rep. 2014, 35, 213–215+234. [Google Scholar]
- Fan, H.P.; Zhang, K.P.; Sun, B.G.; Cai, Q. Modal analysis and structural optimization of wheat harvester frame under corn/wheat intercropping mode. China Agric. Mach. Chem. Rep. 2018, 39, 15–20. [Google Scholar]
- Maciejewski, I.; Krzyzynski, T.; Meyer, H. Modeling and vibration control of an active horizontal seat suspension with pneumatic muscles. J. Vib. Control. 2018, 24, 5938–5950. [Google Scholar] [CrossRef]
Disclaimer/Publisher’s Note: The statements, opinions and data contained in all publications are solely those of the individual author(s) and contributor(s) and not of MDPI and/or the editor(s). MDPI and/or the editor(s) disclaim responsibility for any injury to people or property resulting from any ideas, methods, instructions or products referred to in the content. |
© 2025 by the authors. Licensee MDPI, Basel, Switzerland. This article is an open access article distributed under the terms and conditions of the Creative Commons Attribution (CC BY) license (https://creativecommons.org/licenses/by/4.0/).