Abstract
Predictive maintenance (PdM) combines the Internet of Things (IoT) technologies with machine learning (ML) to predict probable failures, which leads to the necessity of maintenance for manufacturing equipment, providing the opportunity to solve the related problems and thus make adaptive decisions in a timely manner. However, a standard ML algorithm cannot be directly applied to a PdM dataset, which is highly imbalanced since, in most cases, signals correspond to normal rather than critical conditions. To deal with data imbalance, in this paper, a novel explainable ML method entitled “Balanced K-Star” based on the K-Star classification algorithm is proposed for PdM in an IoT-based manufacturing environment. Experiments conducted on a PdM dataset showed that the proposed Balanced K-Star method outperformed the standard K-Star method in terms of classification accuracy. The results also showed that the proposed method (98.75%) achieved higher accuracy than the state-of-the-art methods (91.74%) on the same data.
1. Introduction
In communication and information technology-related fields, the Internet of Things (IoT), as an emerging technology for smart interconnections, has been represented in recent years to link any object from anywhere at any time. It has been widely used in various areas such as manufacturing [1], agriculture [2], health [3], retail [4], military [5], and transportation [6]. IoT overcomes challenges in data mobility by the means of auspicious technologies such as cloud computing for different tasks, real-time applications, smart devices, and functional platforms to enable the availability of information/services and to improve the quality of human life as a facilitator and flourishing concept, especially in healthcare [7], energy systems [8], business development [9], and industrial performance [10].
With the emergence of IoT, industrial systems have experienced a revolution from various standpoints. However, regarding a wide variety of industrial IoT frameworks, some challenges are revealed, such as as cyber security and privacy, scalability, interoperability, dependability, massive deployment, energy efficiency, decentralization, and reconfigurability [11,12,13,14]. Nowadays, manufacturing systems are able to monitor and control their surroundings, enable communication between machines and humans, protect industrial machines from failure, and make intelligent decisions, thereby contributing to thriving intelligent manufacturing phenomena, particularly on the basis of machine learning models [15]. A recent application of such technologies is predictive maintenance. Although combining industrial IoT and predictive maintenance is associated with some challenges, together, they are widely utilized in various industries [16,17,18,19] as a leading strategy to promote uncertainty reduction in environments.
The main objective of predictive maintenance (PdM) is to control the status of machines to prevent the occurrence of expensive failures and perform maintenance when it is essential. PdM has long history, from the visual investigation of machines [20] to recently proposed intelligent approaches that automate the processing of received signals from machines [21]. IoT-enabled PdM systems generally comprise the following main steps: data collection, data preprocessing, model construction for fault diagnostics and prognostics, and, finally, making supportive decisions for maintainence of industrial machines.
Nowadays, there is an essential requirement for the implementation of predictive maintenance models in industry [22]. PdM, with the ability to decrease industrial costs by predicting machine failures as a prognosis approach before they happen, thereby prolonging the life cycle of machinery, encourages different plants to monitor their systems under working conditions [23]. Diagnosis methods have the ability to determine the type of faults by investigating the current status of machines [24]. PdM is also needed to improve accuracy in alignment with prediction explicitness for users to achieve higher efficiency in industry-based applications [25]. Industries are currently becoming more acquainted with different machine learning techniques to attain accurate predictions for the maintainence of industrial assets with sustainable considerations [26].
Machine learning (ML) enables a computer application to make predictions by learning from historical data [27]. It is possible to categorize the learning process into four groups: supervised, unsupervised, semisupervised, and reinforcement learning [28]. As a supervised learning method, the K-Star algorithm [29] uses entropy to compute the distances between training samples during the classification process. Although K-Star usually provides a strong generalization ability and high classification performance on balanced data [30,31,32,33,34], it has difficulty in handling imbalanced data. However, predictive maintenance datasets are usually imbalanced since there are few machine failures relative to the number of normal conditions. Therefore, in this study, we propose an improved method called Balanced K-Star, which can make correct predictions on imbalanced data.
Machines are getting smarter and wiser through ML models, and people are getting less and less visibility to know how to automate predictions. For many, an ML model is like a black box, which leads to questions about how people can be part of the feedback loop in this process and how to promoted a two-way conversation with predictive models. The recently provided answer to such questions is explainable artificial intelligence (XAI) models. Various types of machine learning models, namely explainable, human-centered, complying, ethical, explicit, secure, and interpretable ML models, can be termed reasonable ML, which leads to the opening of the ML black box by providing more understandable predictions, transparency in ML processes, insights for results, and the sharing of learning with users through explanatory interfaces [35]. The underlying reason behind this is to enable humans to trust a model’s result by understanding how it works [36]. Based on this motivation, in this study, we focus on the K-Star method, which can be considered an explainable ML method relative to complex ML models such as deep learning methods.
The main contributions and novelty of this paper can be summarized as follows.
- (i)
- This paper proposes an improved method called “Balanced K-Star”. This is an effective attempt to enable the K-Star algorithm to deal with imbalanced data;
- (ii)
- Our work is also original in that it contributes to representing an explainable artificial intelligence model based on the K-Star algorithm with efficient prediction on predictive maintenance datasets in industrial IoT environments;
- (iii)
- The results of the experiments showed that the proposed Balanced K-Star method outperformed the standard K-Star method on the same dataset;
- (iv)
- The proposed method achieved higher classification accuracy (98.75%) than the state-of-the-art methods (91.74%) [37,38,39,40,41,42,43,44,45,46,47,48,49,50,51,52]. Therefore, our method demonstrated its superiority over the others with an average of 7% improvement.
2. Related Works
As one of the major application domains of IoT, the notion of the Industrial Internet of Things (IIoT) has been presented, which is related to applications in manufacturing and production to make possible coherent communications between machines. Such IoT-enabled systems can monitor industrial machines, provide real-time production data, distinguish the occurrence of wear-and-tear damage to avoid machine failures, and assure continuity of production [53]. Rhe extensive use of wearable devices [54], sensors [55], robots, and unmanned vehicles [56] in the IIoTs is inevitable and facilitated by rapid developments of software and hardware. Therefore, the number of these connected devices is rapidly growing, leading to an increase in big data produced by the IoT and considered in terms of location, time, and data quality. Moreover, smart processing and analysis of such real-world big data contribute to the development of intelligent IoT applications [57]. As a result, utilizing the mentioned technologies in real-time applications and combining them with machine learning approaches can improve the predictive maintenance of production lines and machinery in industrial environments.
An IIoT method for edge artificial intelligence and knowledge graphs is essential to control the condition of operating environments of industrial plants by predictive maintenance and condition monitoring approaches, which can contribute to supporting workers in the production supervision and decision-making process. In [58,59], the application of predictive maintenance in the decision-making process was investigated. In [58], the authors studied the use of knowledge graphs to obtain the necessary knowledge by connecting an edge device to different sensors on an asset. In addition, semantic artificial intelligence techniques were used in the PdM processes for the estimation of the remaining useful life (RUL) of industrial machines. In the another work [59], a novel decision support system was discussed that guides the decision-making process of PdM implementation based on machine learning models. The system was provided by decision trees considering various parameters of industrial environments. The authors also analyzed the huge amount of data from machinery sensors with the aim of increasing efficiency, reliability, and detection of probable machine failures.
In a previous study [60], two important aspects were reported to increase production quality and efficiency in industrial manufacturing. The first is to proactively detect and eliminate expected defects in machine tools, and the second is to establish a supply network with remote monitoring and maintenance methods when a malfunction occurs. In another article [61], a comprehensive study was presented on ultraprecision machining (UPM) processeses in terms of prediction and monitoring. Since UPM can provide considerably high accuracy, it is necessary to understand machinery systems thoroughly in terms of different parameters and tool features that can influence the efficiency of machining, tooling components, and working environments. The future perspective of UPM as the ultimate capability in the industrial processing of materials at their atomic scale is discussed via artificial intelligence models in real-time applications for prediction and monitoring procedures.
As artificial intelligence is one of the critical supporters of Industry 4.0, machine learning models in environments with a high rate of data generation, such as IIoT applications, will be necessary to meet time requirements and support big data platforms. In [62,63,64,65,66,67,68], the application of various ML models in predictive maintenance was investigated. In [62], an Industry 4.0 platform was presented in which a PdM service was constructed and installed on the cloud. Various techniques were discussed to apply the predictor, and the k-nearest neighbor algorithm was selected to construct a predictor since it produces answers at high speed and accuracy. In another study [63], the precise time for maintenance of manufacturing equipment was forecasted by investigating a PdM system that combines machine learning models with industrial IoT technologies to apply an adaptive decision-making process. A real-world milling dataset was chosen to implement a PdM structure to monitor the wear level of machinery, preventing the breakdown of industrial tools, refining the interaction between humans and machines, and optimizing the production process. A smart manufacturing method was presented in [64] for the predictive maintenance of intelligent transportation systems such as railways. In this method, the collaboration among digital twins as a representation of real-world physical objects was improved by considering the main requirements, namely real-time predictive analysis, intelligent digitial twin technologies, and blockchain integration. In another study [65], a novel PdM system was proposed using different metrics and key performance indicators (KPIs) for effective condition monitoring in industrial manufacturing processes. This system was applied to both autonomous transfer vehicles and electric motors to detect early faults and anomalous situations. The data collection and fault classification of the system was enhanced by the use of automated machine learning (AutoML) models and workflow automation techniques. In another work [66], the authors presented an interpretable machine learning method for engineering change management (ECM) decision support based on real-world data from the automotive industry. Stacking and community detection algorithms were applied to construct more reliable models, which led to high efficiency, quality, and transparency of the process. In [67], the authors reported that using supervised machine learning as a state-of-the-art technology on product state data of the industrial environment was a helpful approach to control quality in the manufacturing process. In another study [68], a novel method was introduced to predict the electrical impedance of rolling bearings via ML techniques that determine the health of bearings as a critical part of all machinery. The applied ML-based method achieved a nearly constant difference between the measured and calculated impedance of rolling bearings through the PdM process. Different ML algorithms were compared and investigated considering the prediction accuracy of the results. The rotational speed of bearings was also predicted based on the impedance values by order analysis methods, which could lead to the omission of speed sensors in machinery and high prediction quality.
In computer science, the domain knowledge of a specific field is necessary to simultaneously achieve explainability and improve the scientific consistency of machine learning models. Therefore, XAI attempts to represent ML models with an explanation that is understandable by humans through explanatory interfaces. Local interpretable model-agnostic explanations (LIMEs) and Shapley additive explanation (SHAP) are widely used techniques related to XAI. In the LIME technique, a surrogate model is trained to learn how a global black box model makes predictions. As a game-theoretic approach, SHAP was developed to explain machine learning predictions via reasoning with respect to the contributions of various features [69]. In another study [70], different applications of explainable machine learning in natural science were discussed by considering three main elements, namely interpretability, explainability, and transparency. The authors used XAI in combination with domain knowledge from the various application areas. In another work [71], a novel XAI model for credit risk management was presented. This model applies a correlation network to Shapley values in order to group the predictions of artificial intelligence considering similarity in the explanation. The analysis of various companies revealed that similar financial characteristics of borrowers lead to efficient prediction of their future behaviors.
It is possible to combine the concept of XAI with PdM to achieve more efficient results through explicit predictions, as considered in [72,73]. In [72], semisupervised, data-driven models were built to implement a predictive maintenance system by learning from the historic data of assets. Nevertheless, the major issues for the authors were finding new failures, achieving improved accuracy in inconsistency recognition, and flexibility in altering the environmental and operational conditions (EOCs). The authors conquered these challenges by using principal component analysis (PCA), one-class support vector machine (OC-SVM), and extreme learning machines (ELMs). Additionally, XAI techniques were used to detect abnormal signals to encourage the utilization of PdM systems in intelligent plants. In the another work [73], a new data investigation framework for predictive maintenance (PredMaX) was presented that suggests automatic periodic clustering and identifies sensitive parts of industrial machines. PredMaX also applis an explainable deep convolutional autoencoder to data with PCA to reduce data dimensionality. A case study was presented within the PredMaX framework to identify the most important signals used for the prediction of oil degradation in an industrial gearbox with minimum human aid and without initial knowledge of the machine.
Predictive maintenance datasets are usually imbalanced, including a small proportion of machine failures and a large proportion of normal cases that dominates the learning accuracy. In the literature, different methods have been presented to deal with imbalanced data, such as by artificially increasing minority class instances or removing some majority class instances. The use of generative adversarial networks (GANs) is a prominent technique used to handle data imbalance. In a previous study [74], a GAN model was trained, and new synthetic image samples were generated. Vakharia et al. [75] also used the GAN technique as a potential synthetic data generation method based on images.
Recent advances in artificial intelligence contribute to the processing of an enormous amount of data to attain more accurate PdM models in manufacturing and other industries. Here, machine learning methods play an important role. K-Star is an effective machine learning algorithm that is based on the lazy learning concept. K-Star has been applied to different fields, e.g., transportation [76], health [31], and agriculture [30], proving its superiority in terms of accuracy. In [31], the K-Star algorithm achieved the best results compared to random forest (RF) and radial basis function networks according to the different validation metrics. In [76], the K-Star method was determined as the most successful method amongst its counterparts, such as support vector machines, decision trees (DT), RF, k-nearest neighbors (KNN), artificial neural network (ANN), and naive Bayes. In another study [77], K-Star also achieved higher accuracy than other lazy learning algorithms, including locally weighted learning (LWL) and KNN, when classifying gearbox faults. In [78], K-Star was reported as the best-performing method among others, including ANN and DT. Therefore, our study focuses on the K-Star method, given its effectiveness. K-Star has several advantages, including ease of implementation, as well as the ability to manage noisy data and handle missing values; it is considered an XAI method that uses both prediction and classification to address various types of attributes and manipulate smoothness problems [79].
Despite the advantages of K-Star, it is limited in handling imbalanced data. In this study, we improved K-Star to enable it to deal with data imbalance problems. Our study differs from existing studies in several aspects. First, we propose a novel improved method called “Balanced K-Star”. Second, this study contributes the representation of an explainable artificial intelligence model based on the K-Star method with high-accuracy prediction on a predictive maintenance dataset Industrial IoT environments.
3. Material and Methods
3.1. The Proposed Model
The main aim of this study is to propose an explainable machine learning model that considers machine failure modes for predictive maintenance in an IoT-enabled environment. In other words, the main objective is to develop an intelligent model that controls the status of machines to prevent the occurrence of expensive failures and perform maintenance when it is essential.
Figure 1 shows a general overview of the proposed predictive model. In the first step, values are collected from sensors on industrial equipment by the IoT system. These sensors have the ability to convert real-world phenomena (e.g., vibration, movement, temperature, or force) to current signals or voltages through analog-to-digital converters (ADCs). The collected data are transferred and stored in data storage devices. In the data preparation step, raw data are transformed into processed data by handling missing values, correcting inconsistent data, applying normalization, encoding certain values, dropping outliers, removing irrelevant features, and performing feature engineering techniques to make them suitable for further analysis. Visualization and statistical analysis of data are also implemented in this step to better identify and understand the characteristics of data attributes and their values. Here, data are prepared for the application of the Balanced K-Star learning algorithm. In the training phase, this method computes the classification probability for each instance in the majority class using the Bayes theorem. The classification probability is the value of a data object assigned to a class label (i.e., failure or normal). The method then selects objects with probability values that exceed a threshold. Therefore, the method builds a classifier based on observations to predict factors that depend on the classification probability. In the testing step, the effectiveness of the developed model is evaluated on a test set by using several measures, such as accuracy, precision, recall, F-measure, and the area under the receiver operating characteristic curve (AUC-ROC). Here, it is always recommended to use the ten-fold cross-validation technique. If data are randomly split between a training and testing set (i.e., 70% and 30%, respectively), the prediction results are biased. In the prediction step, an output is produced by using the model for a previously unseen test instance. Then, the predicted result is presented to the user via an application to provide feedback about the status of the industrial equipment. Finally, in the maintenance actions phase, various types of operations based on the technical attributes of the machinery can be applied, including inspection, measurement, replacement, and repair. The output of the model is taken into consideration by a worker for decision making, providing significant benefits, such as decreased repair costs, reduced machine downtime, increased safety, and improved efficiency.
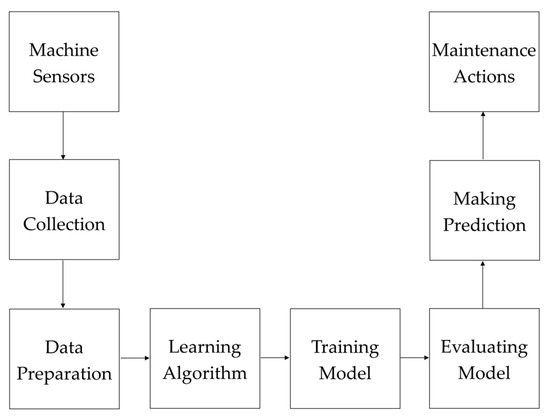
Figure 1.
The general structure of the proposed predictive model.
3.2. The Proposed Method: Balanced K-Star
In this study, a new explainable machine learning method, entitled “Balanced K-Star (BKS)”, is proposed based on the K-Star classification algorithm. The aim of the study is to address the data imbalance problem in predictive maintenance applications. Data imbalance is a situation in which the number of instances in one class is significantly smaller than that in another class. The class with fewer data samples is called the minority class, whereas the class with a large number of data samples is called the majority class. The class distribution can be balanced either by increasing minority class instances by oversampling or by removing majority class instances via undersampling. The oversampling approach can increase the possibility of overfitting since it duplicates samples. Moreover, adding synthetic samples to the minority class increases the data size, which obviously increases the training time. For these reasons, the proposed BKS method was designed based on the undersampling approach.
Let be a dataset with data objects such that . A data object () comprises an input vector () and its corresponding class label () such that . Each input vector () consists of features such as Thus, can be represented as , where is the value of the -th attribute of the -th data object. The correct output () is a value of a variable described in a set of distinct class labels such as . In other words, means that data object belongs to the -th class in the label set. Here, the objects in one class () (majority class) far outnumber those in the other class () (minority class) such that . For example, in a binary classification for a predictive maintenance application, the labels of the objects are = normal and = failure. In multiclass classification, the labels of the instances can be expressed as = heat dissipation failure, = tool wear failure, = overstrain failure, = power failure, = random failure, and = normal (non-failure). The aim of the BKS method is to balance the dataset by considering the classification probabilities of instances and then learn a mapping function () between the input and output spaces by minimizing the prediction error.
The BKS method selects strong objects from the majority class to balance the data using the Bayes theorem.
Definition 1.
(Strong Object) A strong object is an observation that can be assigned to a class with a high probability.
Definition 2.
(Probability-Based Selection) Given a collection of observations, probability-based selection is the choice of data objects that can be classified by a classifier with a high probability.
For each data instance () in the dataset, the algorithm calculates the probability distribution over all the classes using the Bayes theorem and then identifies maximum instance, as given in Equation (1).
where is the maximum posterior probability of a class for a given data instance (), is the prior probability of class , and is the likelihood that a feature is assigned to a given class. The maximum probability values () are computed for the objects in the dataset. These values are then used in the selection of the samples. All data objects have a different probability of being selected as the sample, and the conclusion is a sample set involving strong objects.
The advantages of the Balanced K-Star method can be summarized as follows:
- Imbalanced data make the detection of patterns from a minority class more difficult and lead to unsatisfactory classification performance. The proposed method provides a way to alleviate class imbalance; therefore, the algorithm can successfully learn from samples belonging to all classes during the training process. It builds a robust model by eliminating the dominance of majority classes during training.
- The other advantage of the proposed method is that it can be used for both balanced and imbalanced data. However, many standard classification algorithms are only suitable for balanced data due to their limitations. Our method overcomes this limitation, thereby expanding the application field of standard classification algorithms.
- One of the key advantages of Balanced K-Star is its implementation simplicity. After determining and selecting strong objects by using the Bayes theorem in a straightforward manner, the classification task can be easily performed.
- Another advantage is that the proposed method was designed to process any type of dataset that is suitable for classification. The method can easily be applied to a dataset without background information about the data. Thus, it does not require any specific knowledge of the given data.
3.3. Formal Description
As an instance-based approach, the K-Star algorithm classifies the test instances through comparison with the training instances using a similarity function. Similar instances are assumed to have a class label in common. The algorithm uses entropic distance to determine the similarity between instances. It calculates the probability of transforming an instance into another instance by randomly selecting between all possible transformations.
The probability function P* calculates the probabilities of all paths from one instance to another instance. The probability of a test sample (x) belonging to category C is calculated by summing the probabilities (x) of each sample being a member of C.
The K-Star function (K*) is defined in terms of complexity units by applying a logarithm to P*, as given in Equation (3).
In the K* function, the relative probabilities are considered to estimate class distributions. First, the probability of classifying a test sample for each category is calculated; then, the test sample is assigned to the class with the maximum probability.
The pseudocode of the Balanced K-Star method is given in Algorithm 1, considering the input of the predictive maintenance dataset and the output of predicting failures in industrial machines. In the first step, based on the Bayes theorem, the algorithm calculates a set of probabilities by considering the frequencies and combinations of values for each attribute from a given dataset (). Here, the algorithm assumes that the attributes are independent of each other. Then, the classification probability () is determined separately for each instance in the majority class. If the probability of a sample being assigned to a respective class is higher than a threshold, it is referred to as a strong object and added to a special list (O). On the other hand, the instances of the minority class are directly inserted into the same list. In this way, the imbalanced data becomes relatively balanced through the use of an undersampling method to eliminate the impact of class imbalance. In the next step, the balanced data are trained using the K-Star algorithm, and a model is built. In the last loop of the algorithm, in each iteration, a previously unseen test instance is classified using the developed model. Finally, the predicted class labels are collected in an output list (C).
| Algorithm 1. Balanced K-Star |
| Inputs: |
| D: the dataset D = {(x1, y1), (x2, y2), …, (xn, yn)} |
| Threshold: the probability value determined to be selected as a strong object |
| T: test set that will be predicted |
| Output: |
| C: the predicted class labels |
| Begin: |
| H = Bayes(D) |
| O = Ø |
| for i = 1 to n do |
| if yi majority class |
| pi = ClassificationProbability(H, xi) |
| if pi > threshold |
| O.Add(xi, yi) |
| end if |
| else |
| O.Add(xi, yi) |
| end if |
| end for |
| C = Ø |
| Model = KStar(O) |
| foreach x in T |
| c = Model(x) |
| C = C ∪ c |
| end foreach |
| End Algorithm |
The complexity of the BKS algorithm is O(T + L(n)), where T refers to the time required for the probability-based selection process, and L(n) is the time needed for the execution of the K-Star algorithm on n objects.
3.4. Dataset Description
In this study, we used the AI4I 2020 predictive maintenance dataset [52] to demonstrate the effectiveness of the Balanced K-Star method. The abstract information of this dataset is described in Table 1. It is publicly available from the University of California Irvine (UCI) data repository, with a high number of web hits. It can be utilized for both regression and classification tasks. Missing data are not available in the dataset.

Table 1.
Dataset information.
The variables of the dataset are described in Table 2. The dataset involves 10,000 instances as rows and 14 features as columns, including a unique identifier (UID) in the range of 1 to 10,000; a product ID consisting of a letter (H (high), M (medium), or L (large)); a variant-specific serial number; type (quality of product); air temperature (in kelvin); process temperature (in kelvin); rotational speed (depicts the rotational speed of the tool inside the machine); torque (normally distributed around 40 Nm, with no negative values); tool wear (time in minutes); and machine failure based on different failure modes, including tool wear failure (TWF), heat dissipation failure (HDF), overstrain failure (OSF), power failure (PWF), and random failure (RNF). For the type attribute, “L”, “M”, and “H” denote low-quality, medium-quality, and high-quality products, which account for 50%, 30%, and 20% of all products, respectively.
Table 2.
Dataset variables.
In the data preprocessing step, the identification columns (UID and product ID) were removed because they had no effect on prediction. In this study, machine failure feature is taken as the target; the class label is set to 1 if a machine fails and 0 otherwise. In other words, if any of the failure modes (TWF, HDF, PWF, OSF, or RNF) occur, machine failure is reported as true. The statistical properties of continuous features (minimum, maximum, mean, and standard deviation) are given in Table 3.
Table 3.
Statistical properties of continuous variables.
In this explainable artificial intelligence model based on the Balanced K-Star method, a logical failure tree is generated by considering the mentioned failure types and their specific variables in each node. The explainable tree structure of main machine failures is given in Figure 2. It includes four main nodes referred to as HDF, OSF, PWF, and TWF. HDF leads to a machine failure if the difference between air and process temperature is considerable and the rotational speed is low. It is clear that the origin of HDF is related to air temperature, process temperature, and rotational speed. On the other hand, the occurrence of OSF has roots in tool wear, torque, and the quality type of the product. If tool wear and torque are above a threshold value for the L quality of the product, the machining process fails because of overstrain. PWF depends on rotational speed and tool torque, as it is related to the power required for the process. For example, if the power is above 9000 W or below 3500 W, the process leads to machine failure. In addition, TWF is related to the tool wear attribute, which refers to the replacement of the tool in a specific period of time. In the dataset, TWF occurs 51 times, and the tool is replaced 69 times. It is expected that each feature will have a value within its predefined range in this explainable tree. The false or true feedback of each node is based on the sensed data in the Industrial IoT for different types of failure. Then, the logical combination of these results leads to the final decision, reporting information about machine failure in the equipment. Various types of failure may cause the halting of production in a plant. Therefore, the presented tree structure makes the prediction process of machine learning more transparent by branching the specified features for each type of machine failure. It contributes to opening the traditional black box of machine learning models, which may not be sufficiently clear to illustrate the causes of target features.
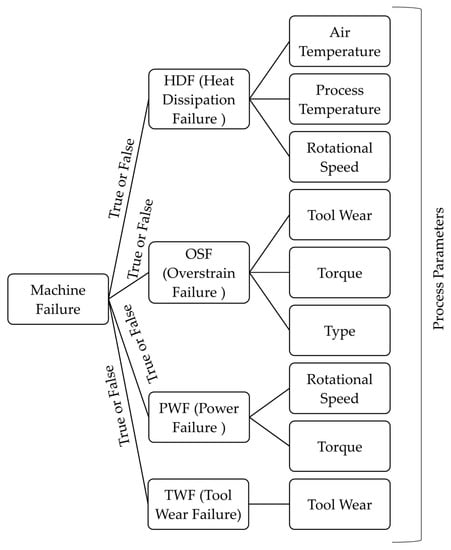
Figure 2.
The explainable tree structure of the main modes of machine failure.
4. Experimental Studies
In this study, the effectiveness of the proposed Balanced K-Star method was validated on a predictive maintenance dataset [52]. We implemented the method with C# programming language using the Weka machine learning library [80]. The implementations of both K-Star and Balanced K-Star methods are publicly available at the website https://github.com/BitaGhasemkhani/Balanced-K-Star (accessed on 15 February 2023).
In the experiments, we used 10-fold cross validation as a low-bias statistical method. Different types of evaluation metrics were used to measure the performance of the machine learning model based on the Balanced K-Star method. The formulas of the evaluation metrics, namely accuracy (ACC), precision (PR), recall (R), and F-measure (FM), are given in Equations (4) to (7), respectively.
where TP (true positives) is the number of cases that the classifier correctly predicts in the positive class, TN (true negatives) is the number of cases that the classifier correctly predicts in the negative class, FP (false positives) is the number of cases that the classifier misclassifies in the positive class, and FN (false negatives) is the number of cases that the classifier misclassifies in the negative class.
4.1. Results
The proposed Balanced K-Star method was compared with the standard K-Star method. Since we used the 10-fold cross-validation technique, the results of each fold are given in Table 4 separately in terms of the accuracy metric. It should be noted here that the final results were aggregated by averaging the results of these 10 folds. As can be seen in the table, our method outperformed the other method in terms of all metrics. Balanced K-Star (98.75%) achieved higher classification accuracy than K-Star (97.15%).
Table 4.
Comparison of standard K-Star and the proposed Balanced K-Star in terms of accuracy.
Figure 3 shows the results in terms of various metrics, including precision, recall, F-measure, and AUC-ROC. According to the results, the proposed method improved performance in terms of precision and recall because it provides a way to alleviate class imbalance; therefore, the algorithm can better learn the underlying structure for all classes during the training process. While the K-Star method is highly biased toward the majority class and has difficulty in minority class prediction, the Balanced K-Star method solves this problem with a probability-based selection technique. Therefore, the proposed method can build a robust model with high prediction accuracy for all classes.
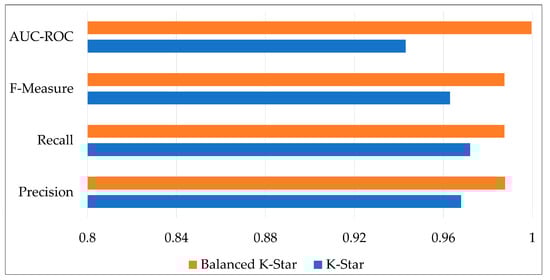
Figure 3.
Comparison of standard K-Star and the proposed Balanced K-Star in terms of the precision, recall, F-measure, and AUC-ROC metrics.
The K-Star algorithm has a parameter for blending, which can be set between 0% and 100%. It is a value regarding entropy calculation. Although the default value (20%) usually worked well in previous studies [77], varying it can produce better results in some cases. For this reason, in this study, we investigated different blending parameters in the range of 10% to 50% with an increment of 5%. Figure 4 shows the accuracy values obtained by the Balanced K-Star method with different parameter values. As shown in the figure, values of 15% and 20% for the blending parameter achieved the highest accuracy of 98.75% by the Balanced K-Star method.
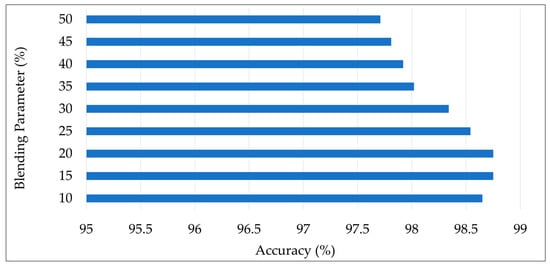
Figure 4.
The accuracy values obtained by Balanced K-Star with different parameter values.
To provide explainability, it is important to notify users about which feature has the greatest effect on the occurrence of failure in industrial machines so that necessary prerequisites can be considered. Since XAI aims to represent ML models with an understandable explanation, we explored the possibility of deducing the contribution of each feature to a decision by representing the importance scores of features. For this purpose, the chi-square technique was applied to the predictive maintenance dataset to determine the most important features in the occurrence of machine failures. The importance scores of features are shown in Figure 5. According to the results, the predictor importance of the torque feature for industrial machines is the highest, with a score of 395.66., followed by the five other features, namely rotational speed, tool wear, type, process temperature, and air temperature, with importance scores of 349.64, 139.24, 50.70, 16.39, and 6.88, respectively.
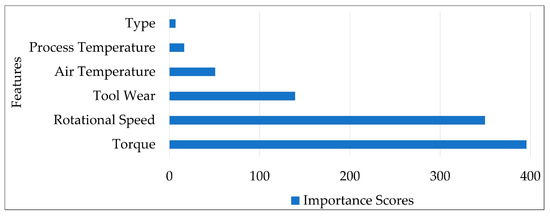
Figure 5.
Importance scores of features.
Table 5 illustrates the explanation of the predictions of the model on 10 sample records since XAI leads to opening of the ML black box by providing more understandable results. For example, for product ID L47643, the user is provided with an explanation such that “the classification result is a power failure (PWF) due to a high rotation speed of 2874 rpm and a low torque of 4.2 Nm”. As shown in the table, comparably high tool wear, low rotation speed, high or low torque, and high air temperature values are the best warning indicators for a machinery failure. The prediction probability is also provided to the users, with the aim of supporting trust in the model results.
Table 5.
Explanation of ML model predictions.
4.2. Comparison with the State-of-the-Art Methods
This section presents the comparison results, which show the superiority of our method over previously reported methods [37,38,39,40,41,42,43,44,45,46,47,48,49,50,51,52] on the same dataset [52]. Table 6 presents the results of classical machine learning methods such as decision trees, logistic regression (LR), neural networks (NNs), support vector machines, and k-nearest neighbors (KNN). Compared to these standard classification methods, the Balanced K-Star achieved higher accuracy on the same dataset. For example, our method (98.75%) performed better than NN (91.50%) [41], KNN (96.60%) [46], and LR [46] (97.07%) methods.
Table 6.
Comparison of Balanced K-Star with the state-of-the-art methods on the same dataset.
When we compared it with ensemble learning techniques such as bagged decision trees, extreme gradient boosting (XGBoost), random forest (RF), and categorical boosting (CatBoost), our method was found to outperform these models in terms of four metrics (accuracy, recall, precision, and F-measure). For example, Balanced K-Star (98.75%) demonstrated its superiority over XGBoost (95.74%) [40] and RF (95.10%) [40] on the same predictive maintenance dataset. Thus, the proposed method can be successfully used for the prediction of machine failures.
The accuracy of the Balanced K-Star method is also the highest in comparison with the state-of-the-art methods, e.g., DFPAIS (83.74%) [37], SDFIS (82.03%) [37], EFNC-Exp (97.30%) [38], SODA (96.80%) [38], RUSBoost (92.74%) [50], and Data-Blind ML (97.30%) [51]. These results were directly taken from related papers in which the authors used the same dataset [52] as that used in the present study. All measurements reveal the outperformance of the Balanced K-Star compared to the state-of-the-art methods.
In short, Balanced K-Star achieved an accuracy of 98.75%, whereas other models reached an average accuracy of 91.74%. Thus, our method outperformed the other models, with an average improvement of 7%. Consequently, the proposed method can be effectively used for IoT-based predictive maintenance in manufacturing.
5. Conclusions and Future Works
Predictive maintenance combines IoT technologies with machine learning to predict probable equipment failures before they happen, providing significant benefits such as decreased repair costs, reduced machine downtime, increased safety, and improved efficiency. However, a standard machine learning algorithm cannot be directly applied to a predictive maintenance dataset, which is usually imbalanced since there are few machine failures relative to the number of normal conditions. To deal with data imbalance, a novel explainable artificial intelligence method based on the K-Star classification algorithm, entitled “Balanced K-Star”, is proposed in this paper.
This study aims to predict the near-future machine state (failure or non-failure) by jointly considering the concepts of predictive maintenance (PdM), explainable artificial intelligence (XAI), machine learning (ML), and the Industrial Internet of things (IIoT). Experiments were conducted on a predictive maintenance dataset.
The main findings of this study can be summarized as follows:
- The Balanced K-Star method achieved a higher classification accuracy than the standard K-Star method on the same dataset;
- Our method (98.75%) outperformed the traditional machine learning methods, ensemble learning methods, and state-of-the-art methods (91.74%) on average;
- The proposed method demonstrated its superiority over previously reported methods [37,38,39,40,41,42,43,44,45,46,47,48,49,50,51,52], with an improvement of 7%;
- The performance of the method was evaluated with different parameter settings, achieving the highest accuracy with 15% and 20% values of the blend parameters;
- When the importance of the features was investigated by the chi-square technique, it was revealed that the torque feature had the highest score.
Future work based on the results of this study can include the development of software based on the Balanced K-Star approach that runs on different datasets in real time for industrial machines, the automatic insertion of transactional data in historical datasets, and periodic updating of the model knowledge. In this way, determining the machine failures and other essential information will improve the maintenance of machines in Industrial IoT-based environments. Workers with low-level knowledge of intelligent systems can use such explainable models more efficiently, supporting the capability of predicting probable failure-oriented machines so that prior preparations can be made to deal with them.
Author Contributions
Conceptualization, B.G. and O.A.; methodology, B.G., O.A. and D.B.; software, B.G.; validation, B.G.; formal analysis, O.A.; investigation, O.A. and D.B.; resources, B.G.; data curation, O.A.; writing—original draft preparation, B.G.; writing—review and editing, O.A. and D.B.; visualization, O.A.; supervision, D.B.; funding acquisition, O.A. All authors have read and agreed to the published version of the manuscript.
Funding
This research received no external funding.
Institutional Review Board Statement
Not applicable.
Informed Consent Statement
Not applicable.
Data Availability Statement
The “AI4I 2020 Predictive Maintenance” dataset [52] is publicly available in the UCI (University of California Irvine) machine learning repository (https://archive.ics.uci.edu/ml/datasets/AI4I+2020+Predictive+Maintenance+Dataset, accessed on 22 January 2023).
Conflicts of Interest
The authors declare no conflict of interest.
Abbreviations
The following abbreviations are used in this paper.
| AE | Autoencoder |
| ANN | Artificial neural network |
| BKS | Balanced K-Star |
| BLR | Binary logistic regression |
| CatBoost | Categorical boosting |
| CML | Conventional machine learning |
| ctGAN | Conditional tabular generative adversarial network |
| DFPAIS | Data-filling approach based on probability analysis in incomplete soft sets |
| DT | Decision tree |
| ECM | Engineering change management |
| EFNC-Exp | Evolving fuzzy neural classifier with expert rules |
| ELM | Extreme learning machine |
| EOC | Environmental and operational conditions |
| GANs | Generative adversarial networks |
| GB | Gradient boosting |
| HDF | Heat dissipation failure |
| HUS-ML | Hybrid unsupervised and supervised machine learning |
| IIoT | Industrial Internet of Things |
| IoT | Internet of Things |
| KNN | K-nearest neighbors |
| LIME | Local interpretable model-agnostic explanations |
| LR | Logistic regression |
| LWL | Locally weighted learning |
| ML | Machine learning |
| MLP | Multilayer perceptron |
| NN | Neural network |
| OC-SVM | One-class support vector machine |
| OSF | Overstrain failure |
| PCA | Principal component analysis |
| PdM | Predictive maintenance |
| PWF | Power failure |
| RF | Random forest |
| RNF | Random failure |
| RUL | Remaining useful life |
| RUSBoost | Random undersampling boosting |
| SHAP | Shapley additive explanation |
| SDFIS | Simplified approach for data filling in incomplete soft sets |
| SmoteNC | Synthetic minority oversampling technique for nominal and continuous |
| SODA | Self-organized direction-aware data partitioning |
| SVM | Support vector machine |
| TTML | Tensor train-based machine learning |
| TWF | Tool wear failure |
| UPM | Ultraprecision machining |
| XAI | Explainable artificial intelligence |
| XGBoost | Extreme gradient boosting |
References
- Resende, C.; Folgado, D.; Oliveira, J.; Franco, B.; Moreira, W.; Oliveira-Jr, A.; Cavaleiro, A.; Carvalho, R. TIP4.0: Industrial Internet of Things Platform for Predictive Maintenance. Sensors 2021, 21, 4676. [Google Scholar] [CrossRef] [PubMed]
- Palomar-Cosín, E.; García-Valls, M. Flexible IoT Agriculture Systems for Irrigation Control Based on Software Services. Sensors 2022, 22, 9999. [Google Scholar] [CrossRef] [PubMed]
- Wassan, S.; Suhail, B.; Mubeen, R.; Raj, B.; Agarwal, U.; Khatri, E.; Gopinathan, S.; Dhiman, G. Gradient Boosting for Health IoT Federated Learning. Sustainability 2022, 14, 16842. [Google Scholar] [CrossRef]
- Kaur, J.; Santhoshkumar, N.; Nomani, M.Z.M.; Sharma, D.K.; Maroor, J.P.; Dhiman, V. Impact of Internets of Things (IOT) in Retail Sector. Mater. Today Proc. 2021, 51, 26–30. [Google Scholar] [CrossRef]
- Madhiarasan, M. Design and development of IoT based solar powered versatile moving robot for military application. Int. J. Syst. Assur. Eng. Manag. 2021, 12, 437–450. [Google Scholar] [CrossRef]
- Mahmoud, H.H.; Alghawli, A.S.; Al-shammari, M.K.M.; Amran, G.A.; Mutmbak, K.H.; Al-harbi, K.H.; Al-qaness, M.A.A. IoT-Based Motorbike Ambulance: Secure and Efficient Transportation. Electron. 2022, 11, 2878. [Google Scholar] [CrossRef]
- Dang, L.M.; Piran, M.J.; Han, D.; Min, K.; Moon, H. A Survey on Internet of Things and Cloud Computing for Healthcare. Electronics 2019, 8, 768. [Google Scholar] [CrossRef]
- Motlagh, N.H.; Mohammadrezaei, M.; Hunt, J.; Zakeri, B. Internet of Things (IoT) and the Energy Sector. Energies 2020, 13, 494. [Google Scholar] [CrossRef]
- Liu, Y.; Ni, Z.; Karlsson, M.; Gong, S. Methodology for Digital Transformation with Internet of Things and Cloud Computing: A Practical Guideline for Innovation in Small- and Medium-Sized Enterprises. Sensors 2021, 21, 5355. [Google Scholar] [CrossRef]
- Zikria, Y.B.; Ali, R.; Afzal, M.K.; Kim, S.W. Next-Generation Internet of Things (IoT): Opportunities, Challenges, and Solutions. Sensors 2021, 21, 1174. [Google Scholar] [CrossRef]
- Fraga-Lamas, P.; Fernández-Caramés, T.M.; Castedo, L. Towards the Internet of Smart Trains: A Review on Industrial IoT-Connected Railways. Sensors 2017, 17, 1457. [Google Scholar] [CrossRef] [PubMed]
- Raposo, D.; Rodrigues, A.; Sinche, S.; Sá Silva, J.; Boavida, F. Industrial IoT Monitoring: Technologies and Architecture Proposal. Sensors 2018, 18, 3568. [Google Scholar] [CrossRef] [PubMed]
- Varga, P.; Peto, J.; Franko, A.; Balla, D.; Haja, D.; Janky, F.; Soos, G.; Ficzere, D.; Maliosz, M.; Toka, L. 5G support for Industrial IoT Applications— Challenges, Solutions, and Research gaps. Sensors 2020, 20, 828. [Google Scholar] [CrossRef] [PubMed]
- Pech, M.; Vrchota, J.; Bednář, J. Predictive Maintenance and Intelligent Sensors in Smart Factory: Review. Sensors 2021, 21, 1470. [Google Scholar] [CrossRef]
- Sheuly, S.S.; Ahmed, M.U.; Begum, S. Machine-Learning-Based Digital Twin in Manufacturing: A Bibliometric Analysis and Evolutionary Overview. Appl. Sci. 2022, 12, 6512. [Google Scholar] [CrossRef]
- Calabrese, M.; Cimmino, M.; Fiume, F.; Manfrin, M.; Romeo, L.; Ceccacci, S.; Paolanti, M.; Toscano, G.; Ciandrini, G.; Carrotta, A.; et al. SOPHIA: An Event-Based IoT and Machine Learning Architecture for Predictive Maintenance in Industry 4.0. Information 2020, 11, 202. [Google Scholar] [CrossRef]
- Yakhni, M.F.; Hosni, H.; Cauet, S.; Sakout, A.; Etien, E.; Rambault, L.; Assoum, H.; El-Gohary, M. Design of a Digital Twin for an Industrial Vacuum Process: A Predictive Maintenance Approach. Machines 2022, 10, 686. [Google Scholar] [CrossRef]
- Hung, Y.-H. Improved Ensemble-Learning Algorithm for Predictive Maintenance in the Manufacturing Process. Appl. Sci. 2021, 11, 6832. [Google Scholar] [CrossRef]
- Niyonambaza, I.; Zennaro, M.; Uwitonze, A. Predictive Maintenance (PdM) Structure Using Internet of Things (IoT) for Mechanical Equipment Used into Hospitals in Rwanda. Future Internet 2020, 12, 224. [Google Scholar] [CrossRef]
- Kerboua, A.; Metatla, A.; Kelailia, R.; Batouche, M. Fault Diagnosis in Induction Motor using Pattern Recognition and Neural Networks. In Proceedings of the International Conference on Signal, Image, Vision and their Applications, Guelma, Algeria, 26–27 November 2018; pp. 1–7. [Google Scholar]
- Dolatabadi, S.H.; Budinska, I. Systematic Literature Review Predictive Maintenance Solutions for SMEs from the Last Decade. Machines 2021, 9, 191. [Google Scholar] [CrossRef]
- Calabrese, F.; Regattieri, A.; Botti, L.; Mora, C.; Galizia, F.G. Unsupervised Fault Detection and Prediction of Remaining Useful Life for Online Prognostic Health Management of Mechanical Systems. Appl. Sci. 2020, 10, 4120. [Google Scholar] [CrossRef]
- Ullah, I.; Yang, F.; Khan, R.; Liu, L.; Yang, H.; Gao, B.; Sun, K. Predictive Maintenance of Power Substation Equipment by Infrared Thermography Using a Machine-Learning Approach. Energies 2017, 10, 1987. [Google Scholar] [CrossRef]
- Wang, L.; Zhang, C.; Zhu, J.; Xu, F. Fault Diagnosis of Motor Vibration Signals by Fusion of Spatiotemporal Features. Machines 2022, 10, 246. [Google Scholar] [CrossRef]
- Abidi, M.H.; Mohammed, M.K.; Alkhalefah, H. Predictive Maintenance Planning for Industry 4.0 Using Machine Learning for Sustainable Manufacturing. Sustainability 2022, 14, 3387. [Google Scholar] [CrossRef]
- Çınar, Z.M.; Abdussalam Nuhu, A.; Zeeshan, Q.; Korhan, O.; Asmael, M.; Safaei, B. Machine Learning in Predictive Maintenance towards Sustainable Smart Manufacturing in Industry 4.0. Sustainability 2020, 12, 8211. [Google Scholar] [CrossRef]
- Von Hahn, T.; Mechefske, C.K. Machine Learning in CNC Machining: Best Practices. Machines 2022, 10, 1233. [Google Scholar] [CrossRef]
- Kang, Z.; Catal, C.; Tekinerdogan, B. Machine Learning Applications in Production Lines: A Systematic Literature Review. Comput. Ind. Eng. 2020, 149, 106773. [Google Scholar] [CrossRef]
- Cleary, J.G.; Trigg, L.E. K*: An instance-based learner using an entropic distance measure. In Proceedings of the 12th International Conference on Machine Learning, Tahoe City, CA, USA, 9–12 July 1995; pp. 108–114. [Google Scholar]
- Ropelewska, E.; Cai, X.; Zhang, Z.; Sabanci, K.; Aslan, M.F. Benchmarking machine learning approaches to evaluate the cultivar differentiation of plum (Prunus domestica L.) kernels. Agriculture 2022, 12, 285. [Google Scholar] [CrossRef]
- Perez-Escamirosa, E.; Alarcon-Paredes, A.; Alonso-Silveri, G.A.; Oropesa, I.; Camacho-Nieto, O.; Lorias-Espinoza, D.; Minor-Martinez, A. Objective classification of psychomotor laparoscopic skills of surgeons based on three different approaches. Int. J. Comput. Assisted Radiol. Surg. 2020, 15, 27–40. [Google Scholar] [CrossRef]
- Chen, C.-W.; Chang, K.-P.; Ho, C.-W.; Chang, H.-P.; Chu, Y.-W. KStable: A computational method for predicting protein thermal stability changes by k-star with regular-mRMR feature selection. Entropy 2018, 20, 988. [Google Scholar] [CrossRef]
- Ghosh, S.R.; Waheed, S. Analysis of classification algorithms for liver disease diagnosis. J. Sci. Tech. Environ. Inf. 2017, 5, 361–370. [Google Scholar] [CrossRef]
- Kumar, S.; Hiwarkar, T. Comparative analysis to predicting student’s performance using k-star algorithm. Int. J. Res. Anal. Rev. 2019, 6, 204–210. [Google Scholar]
- Rai, A. Explainable AI: From Black Box to Glass Box. J. Acad. Mark. Sci. 2019, 48, 137–141. [Google Scholar] [CrossRef]
- Gunning, D.; Stefik, M.; Choi, J.; Miller, T.; Stumpf, S.; Yang, G.-Z. XAI—Explainable Artificial Intelligence. Sci. Rob. 2019, 4, 7120. [Google Scholar] [CrossRef] [PubMed]
- Kong, Z.; Lu, Q.; Wang, L.; Guo, G. A Simplified Approach for Data Filling in Incomplete Soft Sets. Expert Syst. Appl. 2023, 213, 119248. [Google Scholar] [CrossRef]
- Souza, P.V.C.; Lughofer, E. EFNC-Exp: An evolving fuzzy neural classifier integrating expert rules and uncertainty. Fuzzy Sets Syst. 2022, in press. [Google Scholar]
- Chen, C.-H.; Tsung, C.-K.; Yu, S.-S. Designing a Hybrid Equipment-Failure Diagnosis Mechanism under Mixed-Type Data with Limited Failure Samples. Appl. Sci. 2022, 12, 9286. [Google Scholar] [CrossRef]
- Vandereycken, B.; Voorhaar, R. TTML: Tensor trains for general supervised machine learning. arXiv 2016, arXiv:2203.04352. [Google Scholar]
- Falla, B.F.; Ortega, D.A. Evaluación De Algoritmos De Inteligencia Artificial Aplicados Al Mantenimiento Predictivo. Ph.D. Thesis, Corporación Universitaria Autónoma de Nariño (AUNAR), Villavicencio, Colombia, 3 June 2022. [Google Scholar]
- Iantovics, L.B.; Enachescu, C. Method for Data Quality Assessment of Synthetic Industrial Data. Sensors 2022, 22, 1608. [Google Scholar] [CrossRef]
- Sharma, N.; Sidana, T.; Singhal, S.; Jindal, S. Predictive Maintenance: Comparative Study of Machine Learning Algorithms for Fault Diagnosis. Social Sci. Res. Network (SSRN) 2022. [Google Scholar] [CrossRef]
- Harichandran, A.; Raphael, B.; Mukherjee, A. Equipment Activity Recognition and Early Fault Detection in Automated Construction through a Hybrid Machine Learning Framework. Computer-Aided Civ. Infrastruct. Eng. 2022, 38, 253–268. [Google Scholar] [CrossRef]
- Kamel, H. Artificial Intelligence for Predictive Maintenance. J. Physics: Conf. Ser. 2022, 2299, 012001. [Google Scholar] [CrossRef]
- Jo, H.; Jun, C.-H. A Personalized Classification Model Using Similarity Learning via Supervised Autoencoder. Appl. Soft Comput. 2022, 131, 109773. [Google Scholar] [CrossRef]
- Vuttipittayamongkol, P.; Arreeras, T. Data-driven Industrial Machine Failure Detection in Imbalanced Environments. In Proceedings of the IEEE International Conference on Industrial Engineering and Engineering Management, Kuala Lumpur, Malaysia, 7–10 December 2022; pp. 1224–1227. [Google Scholar]
- Mota, B.; Faria, P.; Ramos, C. Predictive Maintenance for Maintenance-Effective Manufacturing Using Machine Learning Approaches. In Proceedings of the 17th International Conference on Soft Computing Models in Industrial and Environmental Applications, Salamanca, Spain, 5–7 September 2022; Lecture Notes in Networks and Systems. Volume 531, pp. 13–22. [Google Scholar]
- Diao, L.; Deng, M.; Gao, J. Clustering by Constructing Hyper-Planes. IEEE Access 2021, 9, 70167–70181. [Google Scholar] [CrossRef]
- Torcianti, A.; Matzka, S. Explainable Artificial Intelligence for Predictive Maintenance Applications using a Local Surrogate Model. In Proceedings of the 4th International Conference on Artificial Intelligence for Industries, Laguna Hills, CA, USA, 20–22 September 2021; pp. 86–88. [Google Scholar]
- Pastorino, J.; Biswas, A.K. Data-Blind ML: Building privacy-aware machine learning models without direct data access. In Proceedings of the IEEE Fourth International Conference on Artificial Intelligence and Knowledge Engineering, Laguna Hills, CA, USA, 1–3 December 2021; pp. 95–98. [Google Scholar]
- Matzka, S. Explainable artificial intelligence for predictive maintenance applications. In Proceedings of the Third International Conference on Artificial Intelligence for Industries, Irvine, CA, USA, 21–23 September 2020; pp. 69–74. [Google Scholar]
- Schiller, E.; Aidoo, A.; Fuhrer, J.; Stahl, J.; Ziörjen, M.; Stiller, B. Landscape of IoT Security. Compt. Sci. Rev. 2022, 44, 100467. [Google Scholar] [CrossRef]
- Poongodi, T.; Krishnamurthi, R.; Indrakumari, R.; Suresh, P.; Balusamy, B. Wearable Devices and IoT. In A Handbook of Internet of Things in Biomedical and Cyber Physical System; Springer: Berlin/Heidelberg, Germany, 2019; Volume 165, pp. 245–273. [Google Scholar]
- Urbina, M.; Acosta, T.; Lázaro, J.; Astarloa, A.; Bidarte, U. Smart Sensor: SoC Architecture for the Industrial Internet of Things. IEEE Internet Things J. 2019, 6, 6567–6577. [Google Scholar] [CrossRef]
- Dragulinescu, A.-M.; Halunga, S.; Zamfirescu, C. Unmanned Vehicles’ Placement Optimisation for Internet of Things and Internet of Unmanned Vehicles. Sensors 2021, 21, 6984. [Google Scholar] [CrossRef]
- Junior, F.R.; Bianchi, R.; Prati, R.; Kolehmainen, K.; Soininen, J.; Kamienski, C. Data reduction based on machine learning algorithms for fog computing in IoT smart agriculture. Biosyst. Eng. 2022, 223, 142–158. [Google Scholar] [CrossRef]
- Siaterlis, G.; Franke, M.; Klein, K.; Hribernik, K.; Papapanagiotakis, G.; Palaiologos, S.; Antypas, G.; Nikolakis, N.; Alexopoulos, K. An IIoT approach for edge intelligence in production environments using machine learning and knowledge graphs. Procedia CIRP 2022, 106, 282–287. [Google Scholar] [CrossRef]
- Arena, S.; Florian, E.; Zennaro, I.; Orrù, P.F.; Sgarbossa, F. A Novel Decision Support System for Managing Predictive Maintenance Strategies Based on Machine Learning Approaches. Saf. Sci. 2022, 146, 105529. [Google Scholar] [CrossRef]
- Hoffmann Souza, M.L.; da Costa, C.A.; de Oliveira Ramos, G.; da Rosa Righi, R. A Survey on Decision-Making Based on System Reliability in the Context of Industry 4.0. J. Manuf. Syst. 2020, 56, 133–156. [Google Scholar] [CrossRef]
- Manjunath, K.; Tewary, S.; Khatri, N.; Cheng, K. Monitoring and Predicting the Surface Generation and Surface Roughness in Ultraprecision Machining: A Critical Review. Machines 2021, 9, 369. [Google Scholar] [CrossRef]
- Herrero, R.D.; Zorrilla, M. An I4.0 Data Intensive Platform Suitable for the Deployment of Machine Learning Models: A Pre-dictive Maintenance Service Case Study. Procedia Comput. Sci. 2022, 200, 1014–1023. [Google Scholar] [CrossRef]
- Traini, E.; Bruno, G.; D’Antonio, G.; Lombardi, F. Machine Learning Framework for Predictive Maintenance in Milling. IFAC PapersOnLine 2019, 52, 177–182. [Google Scholar] [CrossRef]
- Sahal, R.; Alsamhi, S.H.; Brown, K.N.; O’Shea, D.; McCarthy, C.; Guizani, M. Blockchain-Empowered Digital Twins Collaboration: Smart Transportation Use Case. Machines 2021, 9, 193. [Google Scholar] [CrossRef]
- Cinar, E.; Kalay, S.; Saricicek, I. A Predictive Maintenance System Design and Implementation for Intelligent Manufacturing. Machines 2022, 10, 1006. [Google Scholar] [CrossRef]
- Pan, Y.; Stark, R. An Interpretable Machine Learning Approach for Engineering Change Management Decision Support in Automotive Industry. Comput. Ind. 2022, 138, 103633. [Google Scholar] [CrossRef]
- Wuest, T.; Irgens, C.; Thoben, K.-D. An Approach to Monitoring Quality in Manufacturing Using Supervised Machine Learning on Product State Data. J. Intell. Manuf. 2013, 25, 1167–1180. [Google Scholar] [CrossRef]
- Kirchner, E.; Bienefeld, C.; Schirra, T.; Moltschanov, A. Predicting the Electrical Impedance of Rolling Bearings Using Machine Learning Methods. Machines 2022, 10, 156. [Google Scholar] [CrossRef]
- Angelov, P.P.; Soares, E.A.; Jiang, R.; Arnold, N.I.; Atkinson, P.M. Explainable Artificial Intelligence: An Analytical Review. WIREs Data Min. Knowl. Discov. 2021, 11, e1424. [Google Scholar] [CrossRef]
- Roscher, R.; Bohn, B.; Duarte, M.F.; Garcke, J. Explainable Machine Learning for Scientific Insights and Discoveries. IEEE Access 2020, 8, 42200–42216. [Google Scholar] [CrossRef]
- Bussmann, N.; Giudici, P.; Marinelli, D.; Papenbrock, J. Explainable Machine Learning in Credit Risk Management. Comput. Econ. 2020, 57, 203–216. [Google Scholar] [CrossRef]
- Serradilla, O.; Zugasti, E.; de Okariz, J.R.; Rodriguez, J.; Zurutuza, U. Adaptable and Explainable Predictive Maintenance: Semi-Supervised Deep Learning for Anomaly Detection and Diagnosis in Press Machine Data. Appl. Sci. 2021, 11, 7376. [Google Scholar] [CrossRef]
- Hajgató, G.; Wéber, R.; Szilágyi, B.; Tóthpál, B.; Gyires-Tóth, B.; Hős, C. PredMaX: Predictive Maintenance with Explainable Deep Convolutional Autoencoders. Adv. Eng. Inf. 2022, 54, 101778. [Google Scholar] [CrossRef]
- Sampath, V.; Maurtua, I.; Martín, J.J.A.; Iriondo, A.; Lluvia, I.; Aizpurua, G. Intraclass Image Augmentation for Defect Detection Using Generative Adversarial Neural Networks. Sensors 2023, 23, 1861. [Google Scholar] [CrossRef]
- Vakharia, V.; Vora, J.; Khanna, S.; Chaudhari, R.; Shah, M.; Pimenov, D.Y.; Giasin, K.; Prajapati, P.; Wojciechowski, S. Experimental Investigations and Prediction of WEDMed Surface of Nitinol SMA Using SinGAN and DenseNet Deep Learning Model. J. Mater. Res. Technol. 2022, 18, 325–337. [Google Scholar] [CrossRef]
- Yuksel, A.S.; Atmaca, S. Driver’s black box: A system for driver risk assessment using machine learning and fuzzy logic. J. Intell. Transp. Syst. 2021, 25, 482–500. [Google Scholar] [CrossRef]
- Ravikumar, K.N.; Madhusudana, C.K.; Kumar, H.; Gangadharan, K.V. Classification of gear faults in internal combustion (IC) engine gearbox using discrete wavelet transform features and K star algorithm. Int. J. Eng. Sci. Technol. 2022, 30, 101048. [Google Scholar] [CrossRef]
- Raja, M.N.A.; Shukla, S.K.; Khan, M.U.A. An intelligent approach for predicting the strength of geosynthetic-reinforced subgrade soil. Int. J. Pavement Eng. 2022, 23, 3505–3521. [Google Scholar] [CrossRef]
- Birant, K.U. Semi-Supervised k-Star (SSS): A Machine Learning Method with a Novel Holo-Training Approach. Entropy 2023, 25, 149. [Google Scholar] [CrossRef]
- Witten, I.H.; Frank, E.; Hall, M.A.; Pal, C.J. Data Mining: Practical Machine Learning Tools and Techniques, 4th ed.; Morgan Kaufmann: Cambridge, MA, USA, 2016; pp. 1–664. [Google Scholar]
Disclaimer/Publisher’s Note: The statements, opinions and data contained in all publications are solely those of the individual author(s) and contributor(s) and not of MDPI and/or the editor(s). MDPI and/or the editor(s) disclaim responsibility for any injury to people or property resulting from any ideas, methods, instructions or products referred to in the content. |
© 2023 by the authors. Licensee MDPI, Basel, Switzerland. This article is an open access article distributed under the terms and conditions of the Creative Commons Attribution (CC BY) license (https://creativecommons.org/licenses/by/4.0/).