Abstract
In this paper, an SEAI epidemic model with asymptomatic infection is studied under the background of mass transmission of COVID-19. First, we use the next-generation matrix method to obtain the basic reproductive number and calculate the equilibrium point. Secondly, when , the local asymptotic stability of the disease-free equilibrium is proved by Hurwitz criterion, and the global asymptotic stability of the disease-free equilibrium is proved by constructing the Lyapunov function. When , the system has a unique endemic equilibrium point and is locally asymptotically stable, and it is also proved that the system is uniformly persistent. Then, the application of optimal control theory is carried out, and the expression of the optimal control solution is obtained. Finally, in order to verify the correctness of the theory, the stability of the equilibrium point is numerically simulated and the sensitivity of the parameters of is analyzed. We also simulated the comparison of the number of asymptomatic infected people and symptomatic infected people before and after adopting the optimal control strategy. This shows that the infection of asymptomatic people cannot be underestimated in the spread of COVID-19 virus, and an isolation strategy should be adopted to control the spread speed of the disease.
Keywords:
asymptomatic infection; stability; consistent persistence; optimal control; numerical simulation; sensitivity analysis MSC:
34A34; 34A37
1. Introduction
Infectious diseases [1,2] are one of the biggest threats to human survival. The frequent outbreaks and epidemics of infectious diseases not only affect people’s health and hinder economic development, but also threaten social stability and damage social interests to a greater extent. Therefore, experts in the field of epidemiology and related biology are deeply studying infectious diseases, and their goal is to expose the spread dynamics and patterns of diseases and predict the future development trend by analyzing and understanding various infectious disease models [3,4,5].
Since the end of 2019, COVID-19 [6], caused by severe acute respiratory syndrome coronavirus 2 (SARS-CoV-2), has spread all over China and the world. This virus shows symptoms such as dry cough, fever and fatigue, and may further develop into pneumonia and renal failure, which may lead to death in severe cases [7,8,9,10]. The disease is mainly spread by bodily contact and sneezing and coughing droplets [11], and more and more evidence shows that asymptomatic infected people play an important driving role in its rapid spread [12]. Therefore, in order to prevent the rapid spread of COVID-19, many researchers in the field of biology aimed to understand it, and wanted to expose the epidemic law of diseases through the study of models, so as to provide theoretical basis and strategies for the detection, prevention and management of disease outbreaks. For example, Zhang et al. [13] combined the transmission mechanism of COVID-19 with preventive measures, put forward a new stochastic dynamic model, and estimated and predicted the epidemic trend and control opportunity abroad. In addition, Tang et al. [14] considered medical follow-up quarantine, hospital isolation, treatment and other control and management measures, and evaluated the impact of public health interventions on the spread of COVID-19.
Asymptomatic infected people are contagious, but have no clinical symptoms. They are hidden in the crowd and are not easy to find found. Therefore, this group plays a great role in the spread of COVID-19. This characteristic of asymptomatic infected people is the main reason why COVID-19 has become a pandemic. Several studies have found that asymptomatic infection accounts for about of patients in COVID-19, and individuals with asymptomatic infection are more likely to cause a larger epidemic than imported cases [15,16,17]. In order to understand more deeply how asymptomatic infected people promote the rapid spread of new pneumonia, many experts and scholars have established relevant infectious disease models. For example, Khan et al. [18] studied the dynamics of a stochastic SAIR mathematical model. Tan et al. [19] estimated the spread of symptomatic and asymptomatic COVID-19 with contact information. Dobrovolny [20] researched the role of asymptomatic individuals in the spread of infection. This study shows that even if asymptomatic infection does not necessarily account for a large proportion of infections, it can still change the scale and lethality of epidemics. Sun et al. [21] established an SCIRA model to estimate the impact of asymptomatic infected people. Their research shows that the potential impact of these hidden cases greatly promoted the outbreak of COVID-19 because asymptomatic infected people are contagious.
As an important method to study the transmission mechanism of infectious diseases, dynamic modeling has always been one of the hot issues in the field of infectious diseases. At present, the spread theory and modeling of infectious diseases have been extensively studied [22,23]. Scholars have established an infectious disease model based on the characteristics of COVID-19 to predict the epidemic spread trend, but there are still some limitations. In order to make up for the deficiency of the existing research, this paper used the actual transmission characteristics of COVID-19 to improve the classic SEAI infectious disease model, so as to accurately reveal the transmission mechanism of asymptomatic infected people in COVID-19, explore how asymptomatic infected people affect the outbreak of COVID-19 epidemic, and put forward some strategies to control the spread of COVID-19.
In this paper, we establish an SEAI model of COVID-19 with asymptomatic infection, and make a dynamic analysis to determine the influence of asymptomatic infection in the spread of COVID-19. The rest is organized as follows: Section 1 introduces the research background of COVID-19. Section 2 establishes the model. Section 3 and Section 4 calculate the basic reproduction number and the equilibrium point of the model and prove the stability of the equilibrium point. In Section 5, the optimal control theory is put forward and the optimal control solution is obtained. In Section 6, the stability of the equilibrium point is numerically simulated, the sensitivity of the parameters affecting is analyzed, and the number of asymptomatic infected people and symptomatic infected people before and after adopting the optimal control strategy is further simulated. Section 7 gives the conclusion of this paper.
2. Model Formulation
At present, scholars at home and abroad have begun to study the influence of limited resources on the spread of diseases. For example, Zhou et al. [24] proposed a continuously differentiable treatment function
to describe the “saturation” phenomenon of limited treatment. r represents the maximum cure rate, describes the effect of the delayed treatment of the infected person. Obviously, represents the maximum supply of therapeutic resources, while describes the supply efficiency of medical resources, which has an important impact on the spread and control of diseases.
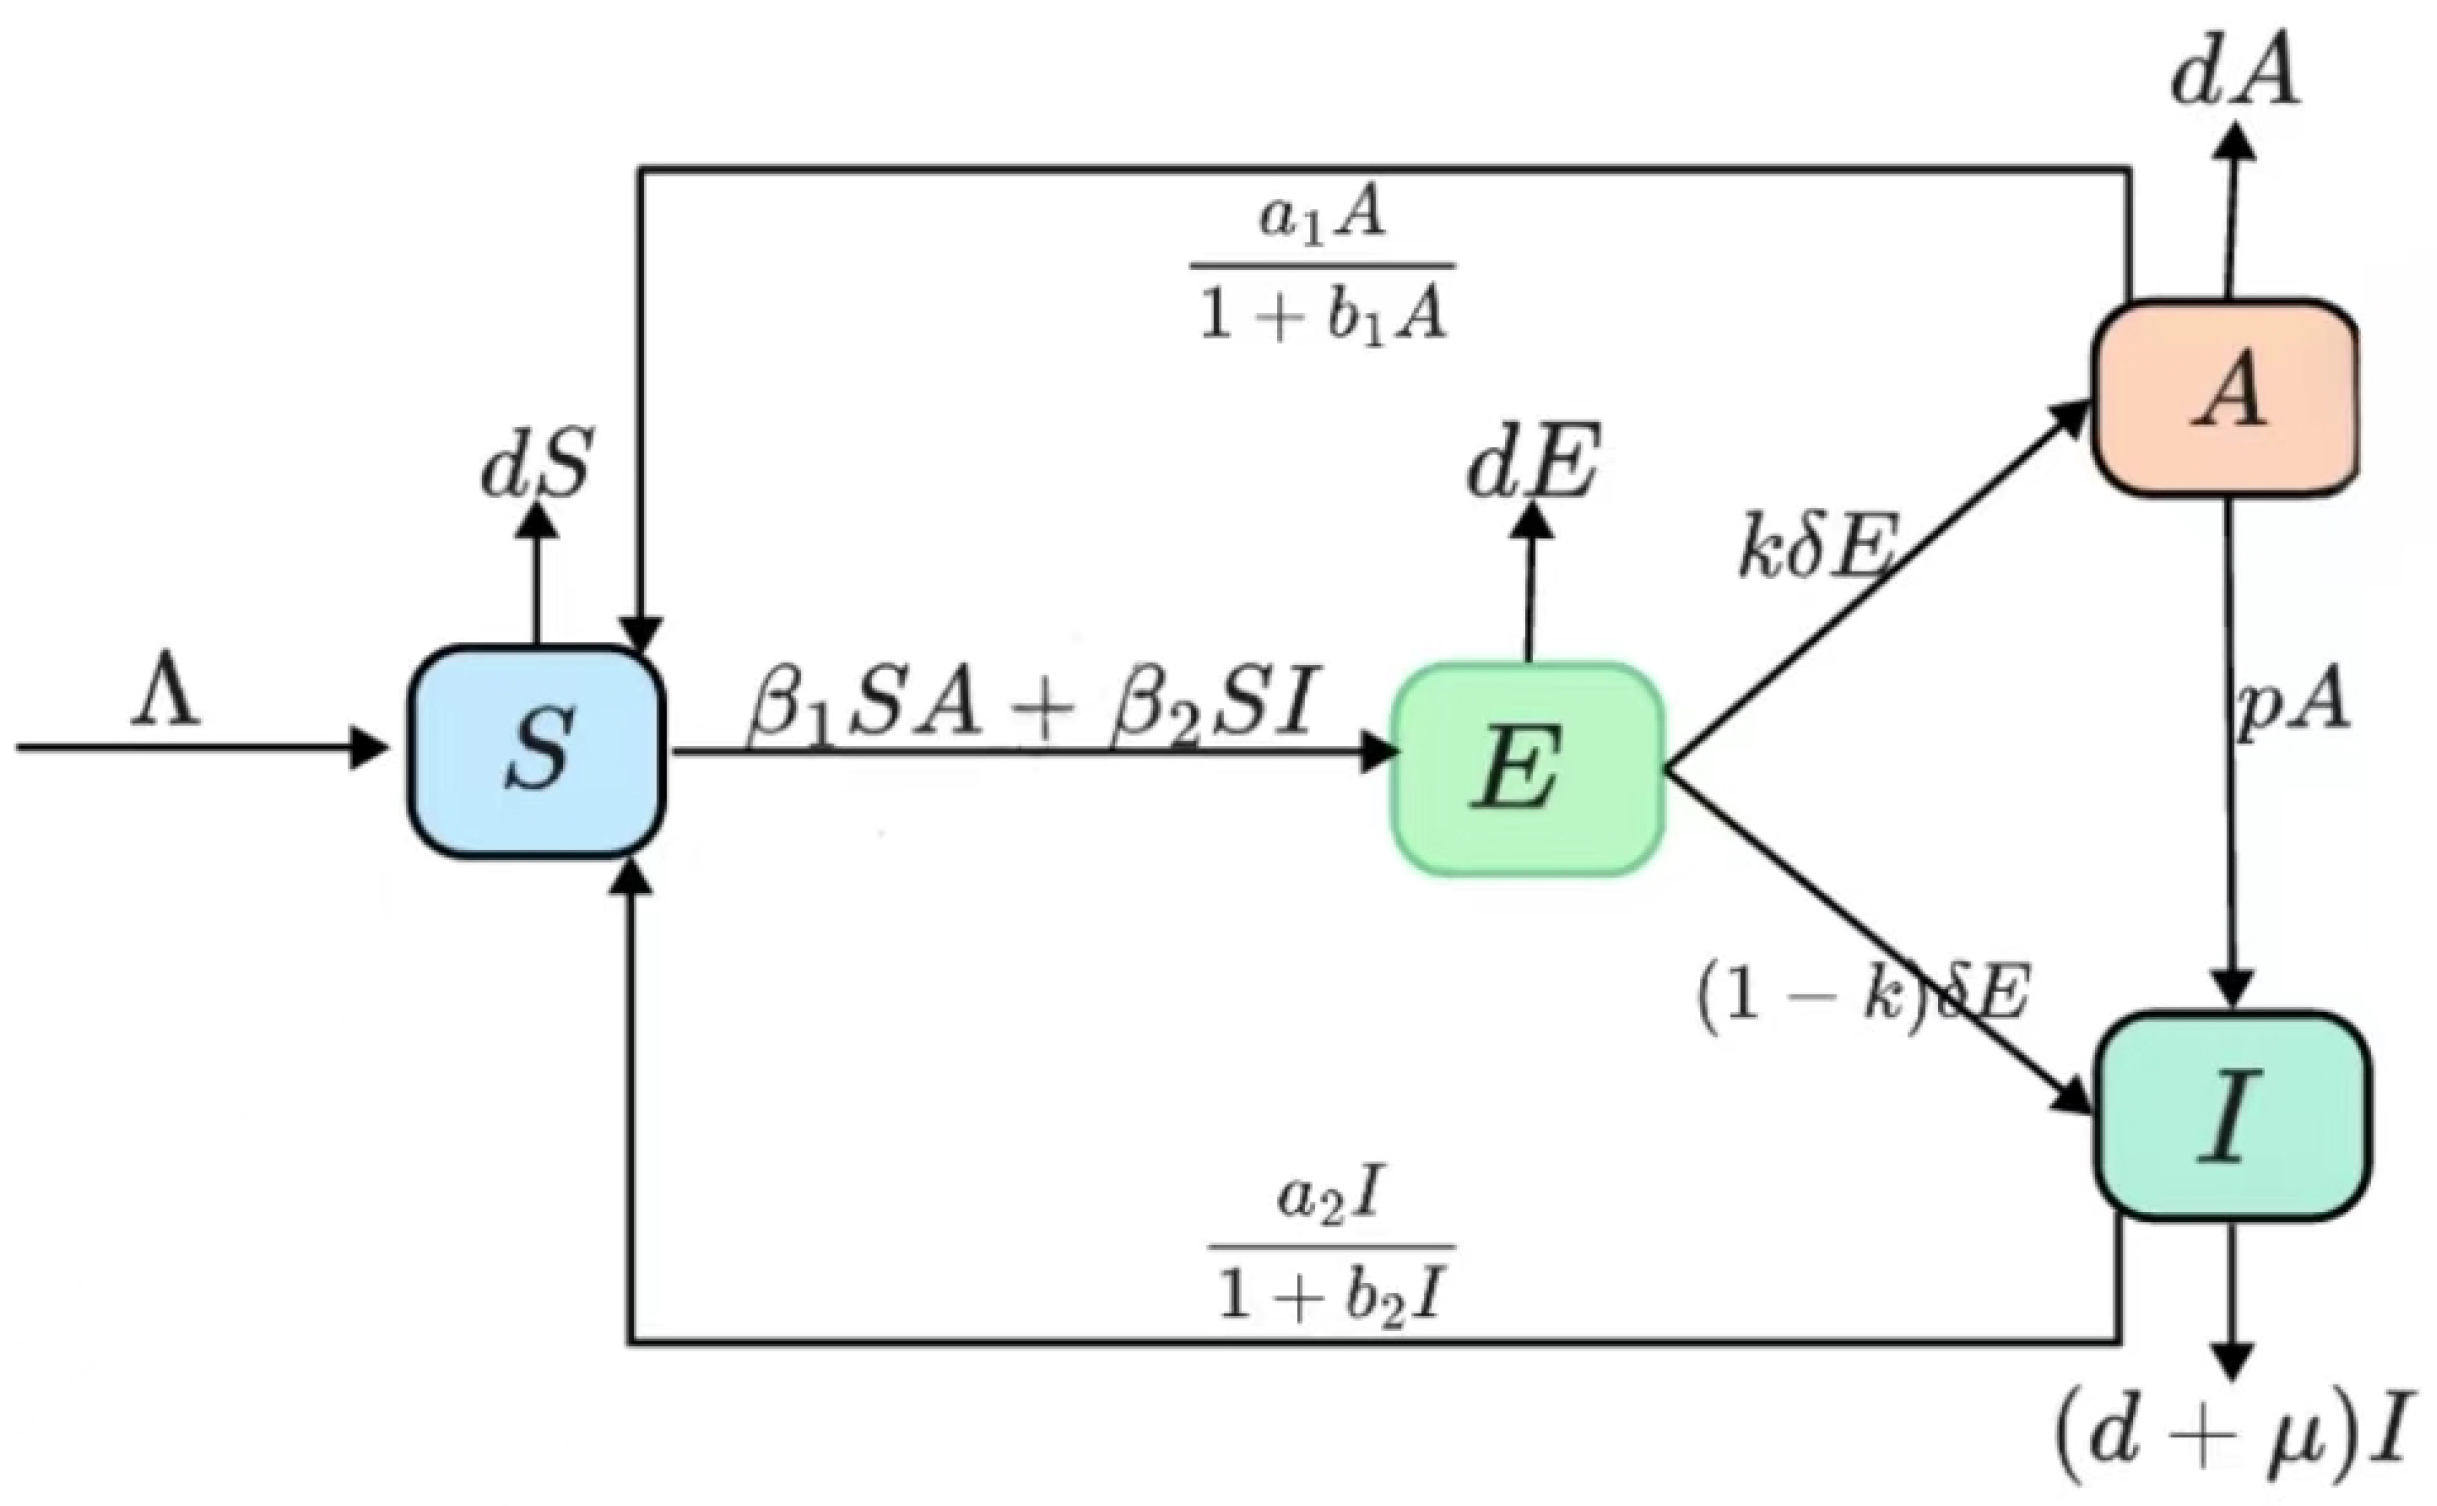
In this paper, the total population N is divided into four different parts: S stands for susceptible person, E stands for the infiltrator, A stands for asymptomatic infected person, I stands for symptomatic infected person. Considering that the treatment of COVID-19 is saturated, the saturated treatment function is introduced into the classical infectious disease model, and the SEAI model is established. A flow chart of the model is shown in Figure 1.

Figure 1.
Flow chart of SEAI transmission.
The propagation dynamics model corresponding to the flow chart is as follows:
Assuming that all the parameters and variables involved in the above model are non-negative, please refer to Table 1 for the dynamic significance of infectious diseases of the corresponding parameters. Note that the expressions and represent limited medical resources.

Table 1.
Parameter definitions for model (1).
It follows from model (1) that and . When approaches infinity, such that , for the sake of generality, the feasible domain is
3. Basic Regeneration Number and Equilibrium
By simple calculation, the only disease-free equilibrium of system (1) is , where .
By the next generation matrix method [25,26], we will derive the basic regeneration number of model (1). Let
be the input rate of newly infected individuals and the rate of transfer of individuals, where
Respectively, then we obtain
Thus, we have
Therefore, the basic regeneration number is
where
The endemic equilibrium of system (1) is denoted as . To solve the endemic equilibrium, we set the right side of model (1) to 0, that is
where
and .
If , then is positive, and satisfies the following equation
where
So there is only root . When , are positive and system (1) has a unique endemic equilibrium .
3.1. Stability of Disease-Free Equilibrium
Theorem 1.
When , the disease-free equilibrium of system (1) is locally asymptotically stable in X; When , the disease-free equilibrium is unstable.
Proof of Theorem 1.
The Jacobian matrix of system (1) at is
The characteristic equation of matrix is
Obviously, is a negative real root of equation, and
Then, we obtain
Therefore, according to the Hurwitz criterion [27,28], when , system (1) is locally asymptotically stable at the disease-free equilibrium point . When , the disease-free equilibrium point is unstable. The proof is complete. □
Theorem 2.
When , the disease-free equilibrium point of system (1) is globally asymptotically stable in X, where
Proof of Theorem 2.
Construction of Lyapunov function
When ,
Let , within , when , there is . Therefore, is the maximal w-invariant set of . According to LaSalle’s invariant set principle [29], any trajectory within X converges to , where is the disease-free equilibrium and is globally asymptotically stable within X. The proof is complete. □
3.2. Stability of the Endemic Equilibrium
Theorem 3.
When , if and , then the endemic equilibrium of system (1) is locally asymptotically stable in X. Among them,
and have
where
Proof of Theorem 3.
If , it can be determined that
then we have
The proofs of (6) and (7) are given in Appendix A and Appendix B, respectively. Therefore, according to Hurwitz criterion [30], the equilibrium of system (1) is locally asymptotically stable. The proof is complete. □
4. Persistence
Theorem 4.
When , the system (1) is uniformly persistent.
Proof of Theorem 4.
To prove persistence, we first give the following notation and definition
We obtain from system (1)
Therefore, X and are positively invariant sets, where is a relatively closed set of X. Next, we will prove that system (1) is uniformly persistent. Let
Now we prove
we clearly have
and now we just need proof
Let be a statement. We need to prove that for statement , have , there exists the statement . By using proof by contradiction, let us assume that the conclusion is not true. In that case, there exists the statement such that one of the following equations holds:
For case , solving Equation (8) for all yields statement . Furthermore, from system (1), we have . Hence, we have statement , which leads to a contradiction. For case , a similar approach leads to a contradiction with statement . In the case of , that is , when holds, we can obtain
Clearly, when , for have holds. Similarly, by applying the same method, the formal solutions for can be obtained. When , we have . Therefore, statement leads to a contradiction. Thus, it is concluded that holds. The system (1) has a globally asymptotically stable disease-free equilibrium , and there is only one equilibrium in .
The following will prove that is weakly repulsive with respect to the set , that is, proving is sufficient by demonstrating . Using proof by contradiction, let us assume this conclusion is not true. Then there exists a positive solution for system (1) such that
Define . Due to , therefore . For a small enough value of , there exists , where
There exists such that for any , have . Thus, the following differential equation inequality can be obtained:
Auxiliary system
Because of , when , . This contradicts the assumption that when , . Thus, it is proved that holds. In summary, it can be concluded that the system (1) with respect to is uniformly persistent. The proof is complete. □
5. Optimal Control Strategy
The maximum principle proposed by Pontryagin is one of the three cornerstones of optimal control theory. It can be applied to solve interdisciplinary problems, formulate rational and effective control strategies in mathematical models, and effectively prevent the spread of COVID-19. Given the complexity of infectious disease modeling, which typically involves numerous parameters, the use of optimal control measures to analyze the dynamics of diseases is crucial. The application of optimal control theory contributes to improving the predictive accuracy of models and designing the most effective strategies to reduce the impact of diseases on populations [31].
In this section, the Pontryagin maximum principle is employed to identify optimal control strategies for addressing COVID-19, with the aim of minimizing the number of infected individuals and minimizing the associated control costs. Applying the Pontryagin maximum principle from optimal control theory allows for the identification of rational and effective strategies for controlling infectious diseases, necessitating the exploration of optimal control conditions within the model.
Rewrite system (1) as the following set of nonlinear differential equations:
where signifies the strategy of isolating to reduce interaction between susceptible and asymptomatic infected individuals, indicates the strategy of isolating to lessen contact between susceptible and symptomatic infected individuals, denotes the approach to enhance treatment and recovery of asymptomatic infected individuals, and corresponds to the strategy of improving treatment and recovery of symptomatic infected individuals.
Define the control set
and is Lebesgue measurable at .
By applying the method of Ahmad et al. [32] to construct the objective function, we have completed additional research on the basis of their work and constructed the following objective function
where: and , respectively, represent the weight coefficients of asymptomatic infected persons and symptomatic infected persons; respectively represent the weight coefficients corresponding to each control strategy; respectively indicate the cost required for the corresponding control policy.
The optimal control strategy problem is now described as
5.1. Existence of Optimal Control Solutions
Theorem 5.
System (10) has optimal control , such that
Proof of Theorem 5.
where , , .
According to the theory of optimal existence [33], it is established that
- (1)
- For any control variable , the initial values of system (10) are all negative;
- (2)
- The control set is a closed and convex set;
- (3)
- The right-hand linear function of system (10) satisfies the initial conditions, ensuring boundedness on the control set U;
- (4)
- The integrand of the objective function (11) is convex on the control set U, and there exist constants and , such that
Therefore, the optimal control solution for system (10) exists. The proof is complete. □
5.2. Optimal Control Solution
Next, the Pontryagin’s Maximum Principle is employed to determine the solution for optimal control [34]. For , the Hamiltonian function H is defined as
where represent the adjoint variables corresponding to each state. And there is the following:
- : control system satisfaction
- : adjoint system satisfaction
- : minimum condition
In addition, the following cross-sectional conditions also hold true.
Theorem 6.
There exists an optimal control , suppose is the optimal control solution for the system (11), where is the adjoint function. According to Pontryagin’s Maximum Principle, the derivative of the adjoint variables is obtained as
and there is a cross-sectional condition . Additionally, the optimal control must satisfy
Furthermore, the optimal control solution is expressed in the following form:
6. Numerical Simulation
6.1. Stability of Balance Point
Assuming , , , , , , , , , , , , we obtain , as shown in Figure 2, which verifies that the disease-free equilibrium point is globally asymptotically stable.
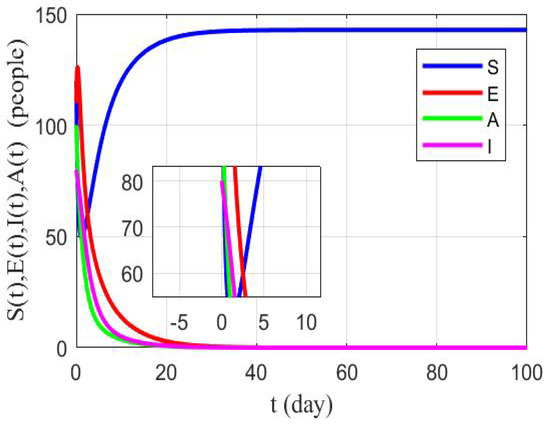
Figure 2.
Time series of .
Assuming , , , , , , , , , , , , we obtain , as shown in Figure 3, the endemic equilibrium point is globally asymptotically stable.
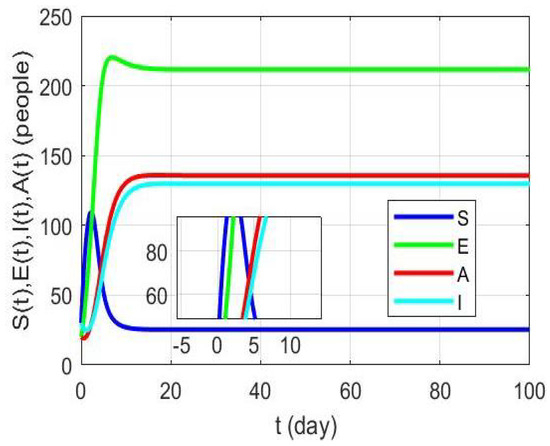
Figure 3.
Time series of .
6.2. Sensitivity Analysis
Sensitivity analysis [35] is a method to evaluate the influence of various input parameters on the output. Simply put, it is a technique for determining which input parameters have a significant impact on the results of the model. Through sensitivity analysis, we can find out the most important factors, which can help to optimize model design, improve model precision and provide a more reliable basis for decision making.
Specific methods and applications of sensitivity analysis may vary in different fields and applications, but the core objective is to better understand the behavior and predictive results of models. Sensitivity analysis is a common tool for model verification, risk assessment and decision support in the fields of statistics, engineering, economics, and environmental science. One of the most important methods is the Partial Rank Correlation Coefficient method, which is a very useful statistical sampling technique and has been widely used in the analysis of infectious disease models [36,37].
This method first generates a large number of parameter combinations through Latin Hypercube Sample (LHS), and then calculates the model output corresponding to these parameter combinations (e.g., base generation ). Finally, the influence of each parameter on the model output is evaluated by calculating the partial correlation coefficient between each parameter and the model output. This method can reveal the key parameters that affect the output of the model and provide important information for the further study and application of the model.
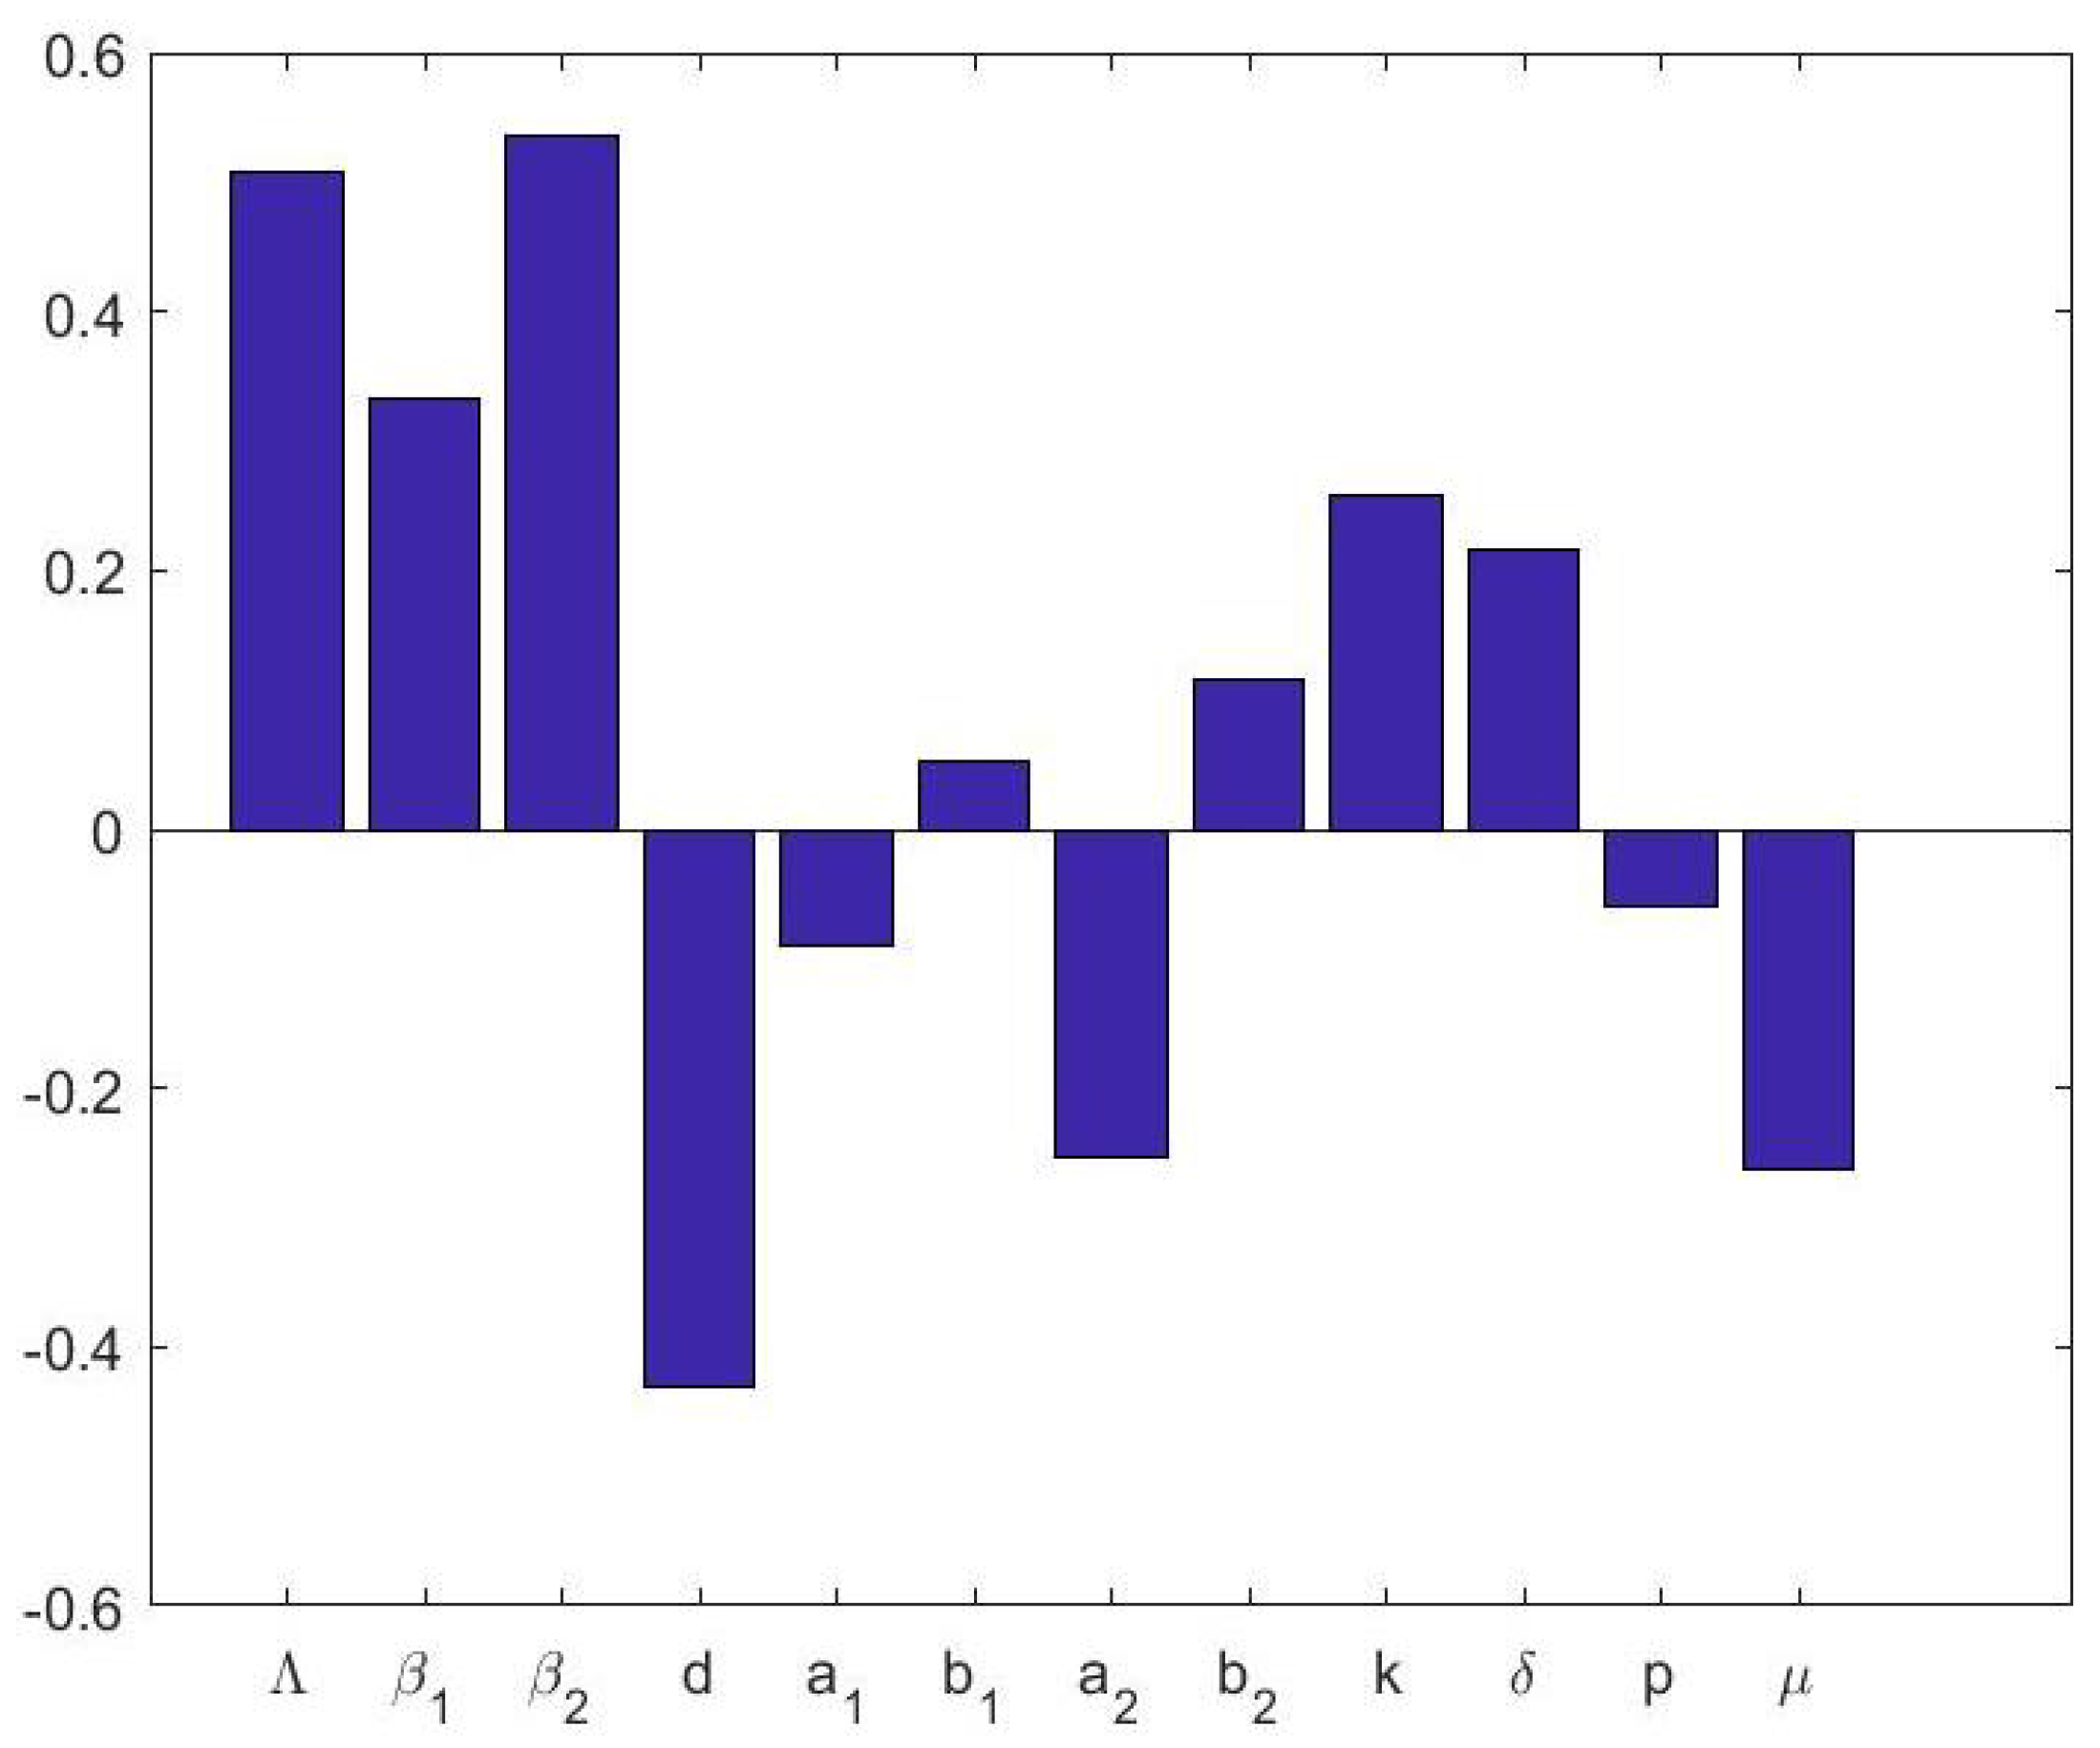
This article employs Latin hypercube sampling to conduct sensitivity analysis on various parameters affecting the basic reproduction number of the system (1), thereby determining the degree of influence of each parameter on . Through the analysis, it is found that among the selected parameters, and are significantly negatively correlated with , while , and are significantly positively correlated with .
As can be seen from Figure 4, among these parameters that have different degrees of influence on the outbreak of COVID-19, the infection rate of asymptomatic infected people to susceptible people is . It has a significant effect on . Therefore, it can be reduced by reducing to reduce and control the spread of COVID-19; one can also increase the maximum cure coefficients and of asymptomatic infected persons and symptomatic infected persons can shorten the cure cycle of COVID-19; or, the constant input of the reduced population can reduce the population mobility, thus reducing the spread speed of COVID-19.
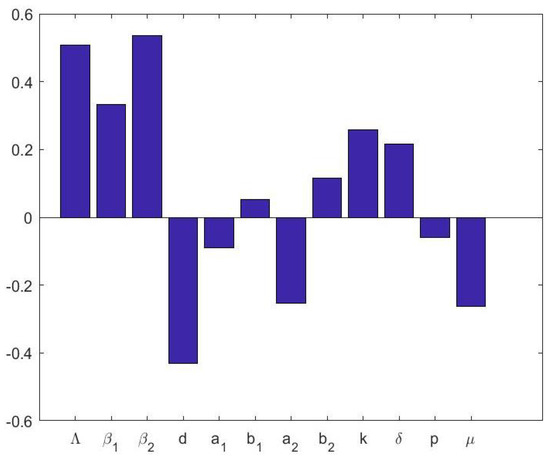
Figure 4.
Correlation between and parameters. The units of each parameter are shown in Table 1.
6.3. Optimal Control
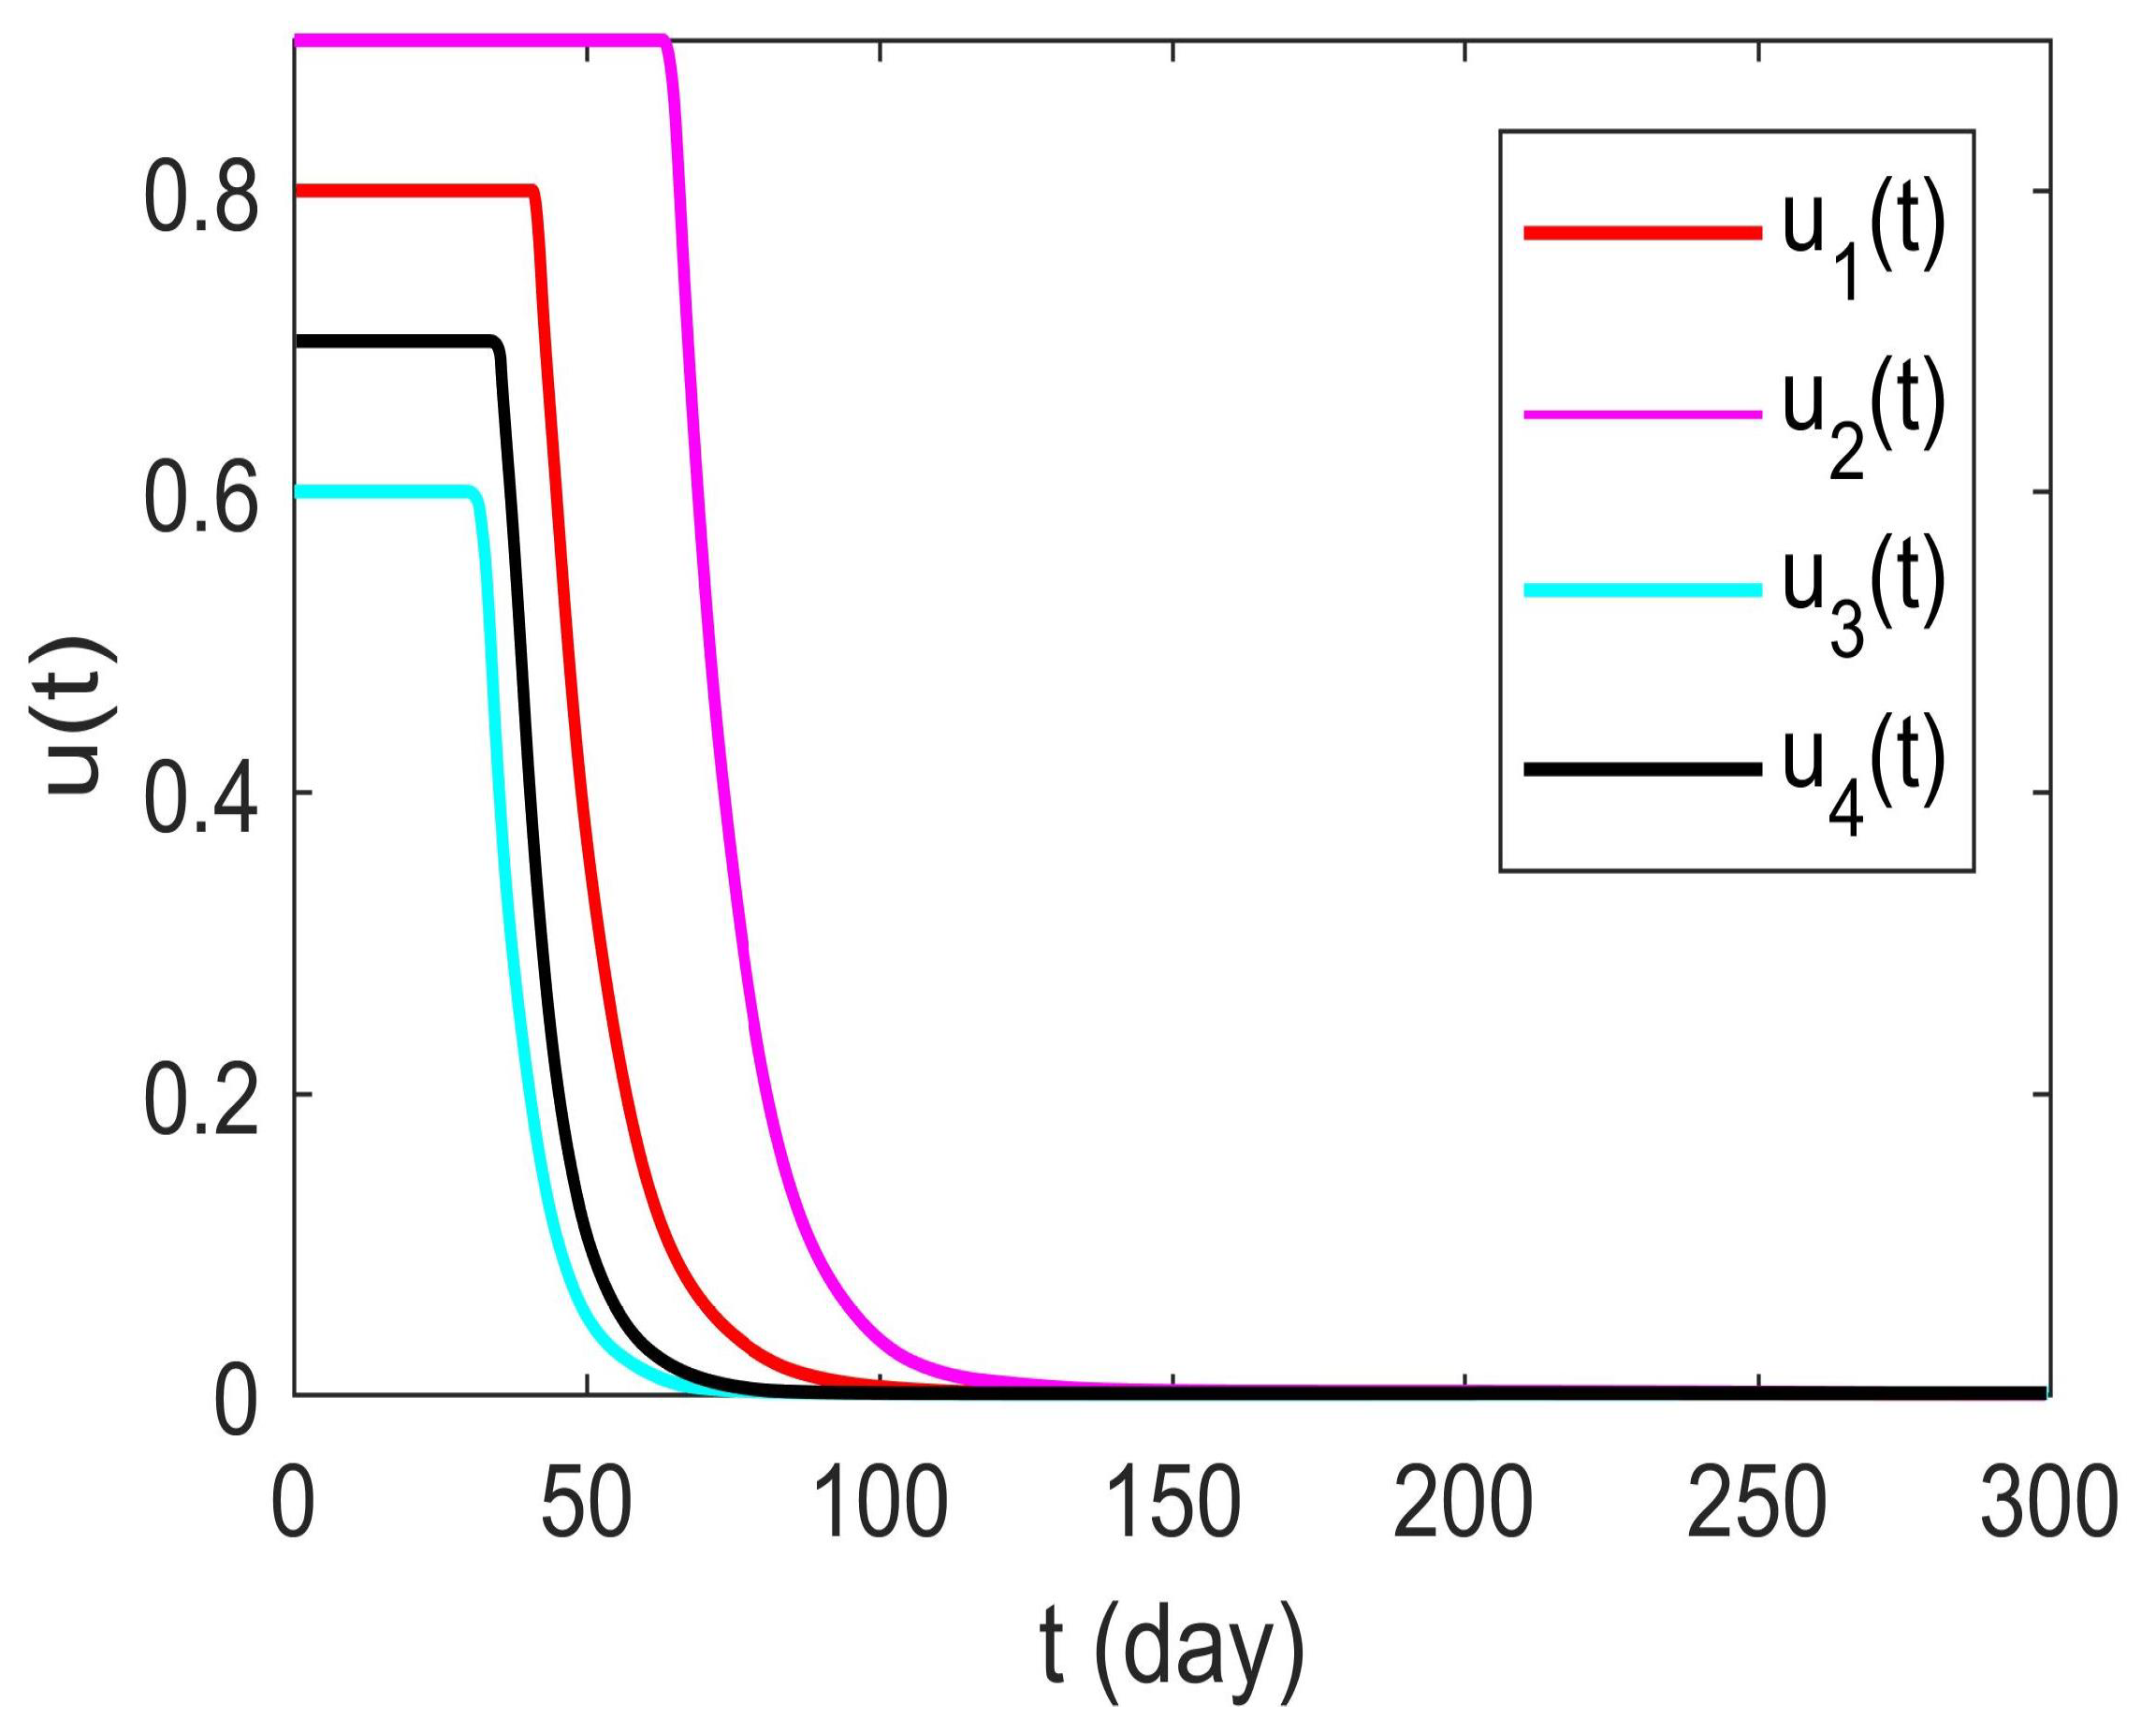
Suppose , , , , , , , , , , . Each control strategy has its limitations, so the maximum values of , , and are and respectively. As shown in Figure 5, and all control strategies will gradually decrease with the change of time. In Figure 6 and Figure 7, we obtain the comparison of the number of asymptomatic infected people and symptomatic infected people before and after adopting the optimal control strategy. Obviously, due to adopting the control strategy, the number of infected people quickly approaches zero. This shows that the control strategy studied can play a very good role in controlling the spread of COVID-19, which proves the effectiveness of the control strategy. This practice keeps both asymptomatic and symptomatic infected people in COVID-19 at a relatively low level.
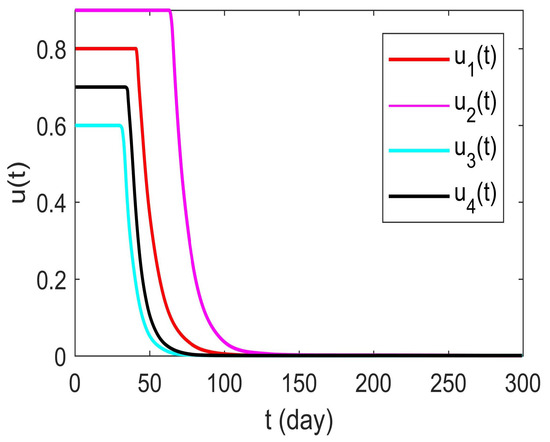
Figure 5.
The functional relationship between the control variable and time t.
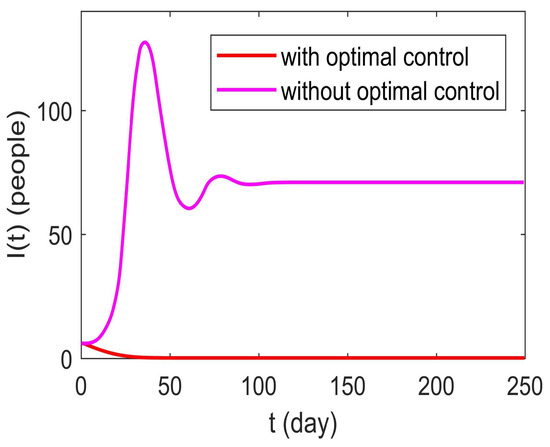
Figure 6.
Comparing the number of asymptomatic infectives before and after implementing the control measures.
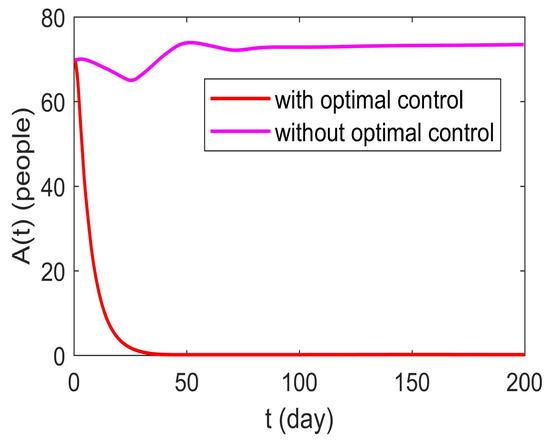
Figure 7.
Comparing the number of symptomatic infectives before and after implementing the control measures.
7. Conclusions
This paper proposes an SEAI model of COVID-19 with asymptomatic infection. This paper mainly studies the influence of asymptomatic infected people on the rapid spread of novel coronavirus. Firstly, the basic regeneration number and equilibrium point of the model are calculated. Then, the local asymptotic stability of disease-free equilibrium and endemic equilibrium is proved by Hurwitz criterion, and the stability of disease-free equilibrium is proved by constructing Laplace function, and the uniform persistence of the system is proved. Then, the Pontryagin maximum principle is applied to solve the optimal control problem. Finally, the theoretical results are verified by numerical simulation, and the sensitivity of parameters is analyzed by PRCC technology, which shows that the influence of asymptomatic infected people on the spread of COVID-19 should not be underestimated.
In the current COVID-19 epidemic, isolation and keeping social distance are the main measures to control the spread of the virus. The state can start with this aim and implement a perfect isolation policy by taking appropriate measures. For asymptomatic infected people, the state can use advanced technology to identify them and then isolate them to prevent the outbreak of diseases. In addition, the state can also reduce the mobility of the population by raising people’s awareness of COVID-19, including prevention measures such as washing hands frequently, wearing masks when going out, avoiding gatherings of crowds, reducing the contact between susceptible people and infected people, and reducing the constant input of population, so as to slow down and eventually control the spread of this disease.
Author Contributions
Idea, L.H.; writing—original draft, Y.X.; writing—review, editing and funding acquisition, W.Q., L.H. and Y.X. are co-first authors, W.Q. is the corresponding author. All authors have read and agreed to the published version of the manuscript.
Funding
This work is supported by National Natural Science Foundation of China (Nos. 12261104, 12361104), and the Youth Talent Program of Xingdian Talent Support Plan (No. XDYC-QNRC-2022-0708), the Yunnan Provincial Basic Research Program Project (Nos. 202401AT070036, 202301AT070016).
Informed Consent Statement
The authors would like to thank the editor and the anonymous reviewers for their constructive comments and suggestions to improve the quality of this paper.
Data Availability Statement
No data were used for the research described in the article.
Acknowledgments
The authors would like to thank the editor and the anonymous reviewers for their constructive comments and suggestions to improve the quality of the paper.
Conflicts of Interest
The authors declare that they have no known competing financial interests or personal relationships that could have appeared to influence the work reported in this paper.
Appendix A
Proof of Equation (6).
It follows from the Theorem 3 that we have the following expressions of and
Since , , the parameters are all positive integers, and are all greater than 0, so the expressions , , , , are all greater than 0, then we have , , . Meanwhile, the expression as . The proof is complete. □
Appendix B
Proof of Equation (7).
Similar to the proof of Appendix A, we first derive the following expressions
Noting that all the parameters and variables are non-negative, then , so we can easily deduce .
Furthermore,
Therefore, we prove that . The proof is complete. □
References
- Kemp, M.; Nielsen, X.C.; Batels, M.D.; Hasman, H.; Nielsen, E.M. Whole genome sequencing for surveillance of bacterial infectious illnesses. Ugeskr. Laeger 2023, 185, V11220690. [Google Scholar] [PubMed]
- Muhitdinovna, D.M.; Usmanovna, R.R. Infectious diseases during Covid 19 and the issues of proper treatment. ACADEMICIA Int. Multidiscip. Res. J. 2020, 12, 195–197. [Google Scholar] [CrossRef]
- Das, M.; Samanta, G.; De la Sen, M. A fractional ordered covid-19 model incorporating comorbidity and vaccination. Mathematics 2021, 9, 2806. [Google Scholar] [CrossRef]
- Das, M.; Samanta, G. Stability analysis of a fractional ordered COVID-19 model. Comput. Math. Biophys. 2021, 9, 22–45. [Google Scholar] [CrossRef]
- Aakash, M.; Gunasundari, C.; Qasem, M. Mathematical modeling and simulation of SEIR model for COVID-19 outbreak: A case study of trivandrum. Front. Appl. Math. Stat. 2023, 9, 1124897. [Google Scholar]
- Hao, Z.; Liu, Y.; Guan, W.; Juan Pan Li, M.; Wu, J.; Liu, Y.; Kuang, H.; Yang, B. Syringa reticulata potently inhibits the activity of SARS-CoV-2 3CL protease. Biochem. Biophys. Rep. 2024, 37, 101626. [Google Scholar] [CrossRef]
- Yao, S.W.; Farman, M.; Amin, M.; Inc, M.; Akgul, A.; Ahmad, A. Fractional order COVID 19 model with transmission rout infected through environment. AIMS Math. 2022, 7, 5156–5174. [Google Scholar] [CrossRef]
- Li, X.; Wang, Y.; Khan, M.; Alshahrani, M.; Muhammad, T. A dynamical study of SARS-COV-2: A study of third wave. Results Phys. 2021, 29, 104705. [Google Scholar] [CrossRef]
- Kronbichler, A.; Kresse, D.; Yoon, S.; Yoon, S.; Lee, K.; Effenberger, M.; Shin, J. Asymptomatic patients as a source of COVID-19 infections: A systematic review and meta-analysis. Int. J. Infect. Dis. 2020, 98, 180–186. [Google Scholar] [CrossRef]
- Uzunova, G.; Pallanti, S.; Hollander, E. Presentation and management of anxiety in individuals with acute symptomatic or asymptomatic covid-19 infection, and in the post-covid-19 recovery phase. Int. J. Psychiatry Clin. Pract. 2021, 25, 115–131. [Google Scholar] [CrossRef]
- Stilianakis, N.; Drossinos, Y. Dynamics of infectious disease transmission by inhalable respiratory droplets. J. R. Soc. Interface 2010, 7, 1355–1366. [Google Scholar] [CrossRef]
- Zhai, Y.; Liu, Y.; Ding, N.; Fan, Z.; Fang, G. Improved SEIR model based on asymptomatic infection of COVID-19. In Proceedings of the 2021 4th International Conference on Advanced Electronic Materials. Computers and Software Engineering (AEMCSE), Changsha, China, 26–28 March 2021; pp. 652–655. [Google Scholar]
- Zhang, Y.; You, C.; Cai, Z.; Sun, J.; Zhou, X. Prediction of the COVID-19 outbreak based on a realistic stochastic model. MedRxiv 2020, 10, 21522. [Google Scholar]
- Tang, B.; Wang, X.; Li, Q.; Bragazzi, N.; Tang, S.; Xiao, Y.; Wu, J. Estimation of the transmission risk of the 2019-ncov and its implication for public health interventions. J. Clin. Med. 2020, 9, 462. [Google Scholar] [CrossRef] [PubMed]
- Sun, T.; Weng, D. Estimating the effects of asymptomatic and imported patients on covid-19 epidemic using mathematical modeling. J. Med. Virol. 2020, 92, 1995–2003. [Google Scholar] [CrossRef] [PubMed]
- Lee, C.; Apio, C.; Park, T. Estimation of undetected asymptomatic covid-19 cases in south korea using a probabilistic model. Int. J. Environ. Res. Public Health 2021, 18, 4946. [Google Scholar] [CrossRef] [PubMed]
- Syangtan, G.; Bista, S.; Dawadi, P.; Rayamajhee, B.; Joshi, D. Asymptomatic SARS-CoV-2 carriers: A systematic review and meta-analysis. Front. Public Health 2021, 8, 587374. [Google Scholar] [CrossRef]
- Khan, T.; Ullah, R.; Zaman, G.; Khatib, Y. Modeling the dynamics of the SARS-CoV-2 virus in a population with asymptomatic and symptomatic infected individuals and vaccination. Phys. Scr. 2021, 96, 104009. [Google Scholar] [CrossRef]
- Tan, J.; Ge, Y.; Martinez, L.; Shen, Y. Transmission roles of symptomatic and asymptomatic COVID-19 cases: A modeling study. Epidemiol. Infect. 2022, 150, e171. [Google Scholar] [CrossRef] [PubMed]
- Dobrovolny, H.M. Modeling the role of asymptomatics in infection spread with application to SARS-CoV-2. PLoS ONE 2020, 15, e0236976. [Google Scholar] [CrossRef]
- Sun, T.; Wang, Y. Modeling COVID-19 epidemic in Heilongjiang province, China. Chaos Solitons Fractals 2020, 138, 109949. [Google Scholar] [CrossRef]
- Stehlé, J.; Voirin, N.; Barrat, A.; Cattuto, C.; Colizza, V.; Isella, L.; Régis, C.; Pinton, J.F.; Khanafer, N.; Van den Broeck, W.; et al. Simulation of an SEIR infectious disease model on the dynamic contact network of conference attendees. BMC Med. 2011, 9, 87. [Google Scholar] [CrossRef] [PubMed]
- Xu, C.; Qin, K. Analysis of epidemic situation in novel coronavirus based on SEIR model. Comput. Appl. Softw. 2021, 38, 87–90. [Google Scholar]
- Zhou, L. Dynamic Model Analysis of Infectious Diseases with Limited Medical Resources. Ph.D. Thesis, Northeast Normal University, Changchun, China, 2012. [Google Scholar]
- Driessche, P.; Watmough, J. Reproduction numbers and sub-threshold endemic equilibria for compartmental models of disease transmission. Math. Biosci. 2002, 180, 29–48. [Google Scholar] [CrossRef]
- Avram, F.; Adenane, R.; Basnarkov, L.; Johnston, M.D. Algorithmic approach for a unique definition of the next-generation matrix. Mathematics 2023, 12, 27. [Google Scholar] [CrossRef]
- Patil, A. Routh-hurwitz criterion for stability: An overview and its implementation on characteristic equation vectors using matlab. In Emerging Technologies in Data Mining and Information Security: Proceedings of IEMIS; Advances in Intelligent Systems and Computing; Springer: Singapore, 2020; Volume 1286, pp. 319–329. [Google Scholar]
- Bodson, M. Explaining the routh–hurwitz criterion. IEEE Control. Syst. Mag. 2020, 40, 45–51. [Google Scholar] [CrossRef]
- Gerbet, D.; Benack, K.R. Application of lasalle’s invariance principle on polynomial differential equations using quantifier elimination. IEEE Trans. Autom. Control 2021, 67, 3590–3597. [Google Scholar] [CrossRef]
- Anagnost, J.J.; Desoer, C.A. An elementary proof of the Routh-Hurwitz stability criterion. Circuits Syst. Signal Process. 1991, 10, 101–114. [Google Scholar] [CrossRef]
- Qin, W.; Xia, Y.; Yang, Y. An eco-epidemic model for assessing the application of integrated pest management strategies. Math. Biosci. Eng. 2023, 20, 16506–16527. [Google Scholar] [CrossRef]
- Ahmad, M.D.; Usman, M.; Khan, A.; Imran, M. Optimal control analysis of Ebola disease with control strategies of quarantine and vaccination. Infect. Dis. Poverty 2016, 5, 72. [Google Scholar] [CrossRef]
- Rogers, C. Deterministic Stochastic Optimal Control; Department of Statistics: Cambridge, UK, 2006; Volume 71, pp. 1–18. [Google Scholar]
- Li, K.; Zhu, G.; Ma, Z.; Chen, L. Dynamic stability of an siqs epidemic network and its optimal control. Commun. Nonlinear Sci. Numer. Simul. 2019, 66, 84–95. [Google Scholar] [CrossRef]
- Oshima, M.; Yamaguchi, Y.; Muramatsu, W.; Amano, H.; Bi, C.; Seto, H.; Bamba, S.; Morimoto, T. Study of charged particle activation analysis (I): Determination sensitivity for single element samples. J. Radioanal. Nucl. Chem. 2016, 308, 711–719. [Google Scholar] [CrossRef]
- Kuddus, M.; Rahman, A. Analysis of covid-19 using a modified slir model with nonlinear incidence. Results Phys. 2021, 27, 104478. [Google Scholar] [CrossRef] [PubMed]
- Fu, X.; Wang, J.R. Fractional dynamic analysis and optimal control problem for an SEIQR model on complex networks. Chaos Interdiscip. J. Nonlinear Sci. 2022, 32, 123123. [Google Scholar] [CrossRef] [PubMed]


Disclaimer/Publisher’s Note: The statements, opinions and data contained in all publications are solely those of the individual author(s) and contributor(s) and not of MDPI and/or the editor(s). MDPI and/or the editor(s) disclaim responsibility for any injury to people or property resulting from any ideas, methods, instructions or products referred to in the content. |
© 2024 by the authors. Licensee MDPI, Basel, Switzerland. This article is an open access article distributed under the terms and conditions of the Creative Commons Attribution (CC BY) license (https://creativecommons.org/licenses/by/4.0/).