Abstract
The cemented phosphogypsum (PG) backfill technique provides a new method for massive consumption of PG, and therefore alleviating the environmental pollution of PG. This study considered the effects of slurry preparation on the performance of cemented PG backfill. A L16(44) orthogonal experiment was designed to analyze four factors, namely the solid content, phosphogypsum-to-binder ratio (PG/B ratio), stirring time and stirring speed, with each factor having four levels. According to the range analysis, the solid content played the dominant role in controlling the bleeding rate, while the setting times strongly depended on the PG/B ratio. In terms of strength development of the backfill, the PG/B ratio was shown to be the most significant factor determining the unconfined compressive strength (UCS), followed by the solid content, stirring time and stirring speed. Furthermore, the results showed that the slurry preparation affected the environmental behavior of impurities that originated in PG. By analyzing the concentrations of impurities in the bleeding water of the slurry as well as the leachates of the tank leaching test, the results showed that the release of F− and SO42− was aggravated clearly with the increase in the PG/B ratio, while the release of PO43− always remained at relatively low levels.
1. Introduction
In the phosphate industry, phosphoric acid is usually extracted from phosphate ore by using concentrated sulfuric acid, leaving a by-product of phosphogypsum (PG) which is mainly composed of CaSO4·2H2O. Approximately 4~5 t of PG is generated when 1 t of phosphoric acid is produced, resulting in the global production of PG being about 100 to 280 Mt every year [1,2,3]. Besides CaSO4·2H2O (>90%), PG also contains some impurities such as phosphate (PO43−), fluoride (F−), organic matters, heavy metals and radioactive components [4,5,6,7]. These minor compounds have not only caused serious environmental pollution at storage sites [8,9], but also hindered the reuse of PG, and thus only 15% of PG is recycled worldwide [10,11]. The local government of Guizhou, China recently launched a new policy stipulating that no new surface land would be allocated for PG storage. Therefore, it is extremely urgent to find an effective way to consume such a large amount of phosphogypsum. Alternatively, it has been estimated that about 60% of PG generated could be consumed by using PG as the aggregates in the backfill process [12]. In the cemented PG backfill process, the PG together with the hydraulic binder, water and some additives were mixed homogeneously to form a slurry on the land surface, and then the prepared slurry was transported to the underground stopes by gravity or pumping. In the stopes, the strength was developed by the hydration reaction of the binder, ensuring the stability of underground mine stopes and realizing the maximum recovery of ores. In addition, hardened backfill can well stabilize/solidify the minor compounds in PG, which is also a significant advantage for environment protection.
In the cemented PG backfill process, the first step is to prepare a qualified backfill slurry which could develop a desired strength after the placement. The effects of slurry preparation on the strength of cemented backfill have been investigated by some studies. For instance, Fall and Benzaazoua [13] demonstrated that an increase in the binder dosage could effectively improve the strength of cemented backfill samples. Ercikdi et al. [14] found that the solid content used for backfill process should be determined by the balance between the maximization of the strength and the effectiveness of pumping. Cao et al. studied the relations between strength performance of cemented tailings backfill and solid content, cemented-to-tailings ratio and curing time [15]. Furthermore, the stirring is also a crucial factor in the backfill preparation. Inhomogeneous stirring would lead to inconsistent distribution of solid and water, and thus reduce the strength of the backfill [16]. Although research on cemented PG backfill has been carried out for several years, the majority of the studies considered only a single factor for the optimization of backfill properties. Indeed, the slurry preparation contains multi-factors (such as solid content, aggregates-to-binder ratio and stirring), so it is important to determine which one is the most significant factor determining the slurry proprieties and the strength of the hardened backfill.
Furthermore, previous studies focused mainly on fluidity and/or strength of the backfill process, while relatively few studies paid attention to the environmental pollution related to the cemented backfill process. The potential pollution of backfill mainly stems from two aspects. First, when the slurry is placed into the stopes, the excess water used for improving the slurry fluidity will be secreted. Second, the backfill would suffer from the percolation of groundwater after forming the hardened backfill. Therefore, impurities in the bleeding water and the leachates would transfer into the groundwater, causing environmental pollution. Li et al. [12] showed that impurities in PG could be well solidified by comparing the concentrations of phosphate, sulfate and fluoride before and after the cementation. However, the question of whether the slurry preparation could affect the environmental behavior of cemented PG backfill has not been studied yet. In this case, this study will consider the influence of different preparing conditions on the bleeding water and the leachates in the backfill process.
An orthogonal experiment is usually designed to study multi-factor conditions for obtaining effective degree of each single factor on the results [17,18,19,20]. Therefore, the current study aims to optimize the slurry preparation by considering both the properties and environmental behaviors of cemented PG backfill. After discussions with the operators in mines, four factors related to the slurry preparation are considered in this study, namely phosphogypsum/binder (PG/B) ratio, solid content, stirring speed and stirring time. According to the orthogonal experimental design, the cemented PG backfill samples were reconstituted in the laboratory. The slurry properties were measured, including bleeding rate and setting times. The strength of hardened backfill was analyzed by measuring the unconfined compressive strength (UCS). The concentrations of phosphate (PO43−), fluoride (F−) and sulfate (SO42−) in the bleeding water and leachates of tank leaching test (TLT) were also determined. Then, the range analysis was applied to calculate the effective degree of each single factor, and therefore figuring out the effects of preparation conditions of the process of cemented PG backfill.
2. Materials and Methods
2.1. Raw Materials
Phosphogypsum and a composite binder (the mix proportion of binder is yellow phosphorous slag: fly ash: cement clinker = 4:1:1, and 16–20% lime of the yellow phosphorus slag mass ratio is added) [21] were collected from Guizhou Kailin (Group) Co., Ltd., Guiyang, China. The particle sizes of the PG and binder were measured by a Malvern Mastersizer 2000 particle size analyzer, as shown in Figure 1 and Table 1. The main chemical compositions and physical characteristics of PG and binder used in this study are shown in Table 1. Coefficient of uniformity (Cu) and coefficient of curvature (Cc) are used to reflect the distribution of particle size.
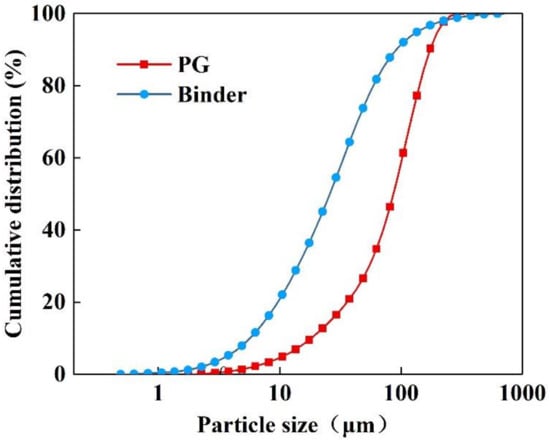
Figure 1.
Particle size distributions of phosphogypsum and binder.

Table 1.
Chemical compositions and physical characteristics of phosphogypsum and binder.
2.2. Orthogonal Experiment
In this study, the cemented PG backfill slurry was prepared based on an orthogonal array [L16(44) matrix]. The following four factors were studied: solid content (factor A), phosphogypsum-to-binder ratio (PG/B ratio, factor B), stirring time (factor C) and stirring speed (factor D). The solid content refers to the mass percentage of PG and binder in slurry. A total of 16 formulations of cemented PG backfill were prepared in this study. The designed levels and factors are listed in Table 2.
Table 2.
Factors and levels in the orthogonal experiment.
In order to figure out which factor is the most significant one, range analysis is essential. Two parameters kij and Rj were used for evaluation. kij is defined as the sum of the evaluation indexes of all levels (j, j = 1, 2, 3, 4) in each factor (i, i = A, B, C, D), and (mean value of kij) is used to determine the optimal level and combination of factors. When is the largest, it can be considered that this level is most optimal for this factor. Rj is defined as the range between the maximum and minimum value of , and it is used for evaluating the importance of the factors to each evaluation index. The larger Rj value, the greater importance of this factor [22,23]. M is described as the evaluation index. For this L16(44) matrix, the relevant calculations are as follows (factor B, for example):
Then, the range analyses applied the above method, and M is replaced by the index that needs to be evaluated, such as the bleeding rate, setting times, strength and concentrations of impurities.
2.3. Sample Preparation
The fresh slurry was prepared by mixing PG, binder and deionized water. After mixing for certain times according to the orthogonal design, the slurry was collected for the analysis of bleeding rate, initial setting time and final setting time.
Then, the prepared slurry was poured into a plastic mold with internal dimensions of 40 mm × 40 mm × 40 mm. There was a 2 mm hole at the bottom of each mold to allow the drainage of excess water. The bleeding water draining from the mold was collected and filtered through a 0.45 μm filter for further analysis to evaluate the environmental behavior. After the initial solidification, the samples were demolded and cured in a chamber at a constant temperature of 20 ± 2 °C and a humidity of 90 ± 5%.
2.4. Tank Leaching Test
The tank leaching test (TLT) is commonly used to study the release properties of minor compounds and to predict the number of released ions in the hardened backfill [24,25,26]. The potential hazards related to the leachable impurities from hardened backfill samples were measured by conducting compliance leaching test according to EA NEN 7375. The backfill samples cured for 28 days were placed in 500 mL plastic bottles and immersed in the bottle with plastic thin threads. The deionized water was used as leachate, and the liquid/solid ratio was 5 cm3 of solution per cm2 of exposed solid. The leachate was changed with the same volume of deionized water after a cumulative leaching time of 0.25, 1, 2.25, 4, 9, 16, 36 and 64 days. Then the leachate at each period was collected and filtered (0.45 μm) for the subsequent analysis. The measured leaching per fraction was calculated separately for each factor using the Equation (1), and the cumulative leaching quantity was calculated by Equation (2), as specified in the EA NEN 7375:2004 standard:
where is the measured leaching of a component in fraction i in mg/m2; is the concentration of the component in fraction i in ug/L; V is the volume of the leachate in l; A is the surface area of the test sample in m2; f is a conversion factor in 1000 μg/mg; Tn is the cumulative leaching quantity of component in fraction i in g.
2.5. Analytical Methods
2.5.1. Bleeding Rate and Setting Times
The bleeding rate was measured in accordance with the Chinese standard GB/T 50080-2016. The slurry was poured into a container with a lid, which was then shaken for 20 s on a shaking table. The bleeding water was drawn with a syringe at intervals until no more water was secreted. The initial slurry and slurry after bleeding in containers were weighed, and then the bleeding rate was calculated.
The initial setting time (IST) and final setting time (FST) were determined according to the Chinese standard GB/T1346-2001 using a Vicat apparatus. The slurry was poured into the Vicat round mold, and bleeding water was secreted over a period of time. The IST was considered as the time when initial Vicat needle penetrated the sample to 5 ± 1 mm from the bottom of the mold. The FST was defined as no visible mark being left when the final Vicat needle was on the surface of the sample [27]. Tests were carried out in triplicate and the reported values were the averages of these three tests.
2.5.2. Unconfined Compressive Strength of Cemented PG Backfill Samples
The minimum strength of backfill into the underground must meet the strength requirements in order to ensure the stability of underground mine stopes. Therefore, the strength development is one of the most important mechanical properties in the backfill system design [28]. According to the Chinese Standard JGJ/T 70-2009 [29], cemented backfill cured for 28 days was used for testing the UCS. UCS tests were conducted using a servo-hydraulic machine of 200 kN loading capability at a constant displacement rate of 0.1 mm/min. In order to avoid the randomness and contingency of the test data, three samples were prepared for each test, and the average values of UCS were calculated.
2.5.3. Microstructural Analysis
After UCS tests, the broken samples were immediately soaked in an ethanol solution to stop the hydration reaction. The samples were then dried at 50 °C in an oven. SEM analysis with the HELIOS NamoLab 600i (FEI, Lake Oswego, OR, USA). was used to find the micromorphologic development inside the cemented backfill samples [30]. Owing to the poor conducting performance of backfill, it was necessary to cover a layer of gold coating on samples to enhance the conductive properties of the samples in order to meet the inspection requirements.
2.5.4. Chemical Measurements
The pH of bleeding waters and leachates after TLT tests were measured by Ohaus TSARTR 300 pH meter (Ohaus, Parsippany, NJ, USA). The concentrations of F− were measured with the Leici PF-1-01 fluorine ion-selective electrode (Leici, Shanghai, China). The concentrations of SO42− and PO43− in bleeding waters and leachates of TLT tests were measured using baryta yellow spectrophotometric method and ammonium molybdate tetrahydrate spectrophotometric method, respectively, via a Shimadzu UV1800 spectrophotometric instrument (Shimadzu, Kyoto, Japan).
3. Results and Discussion
3.1. Differences of the Slurry Properties and Strength of Cemented PG Backfill
According to the L16(44) matrix, 16 batches were carried out, and the results are shown in Table 3. It can be seen that the bleeding rate ranged from 26.34~46.40%. The initial setting time (IST) and final setting time (FST) were in the ranges from 72 h to103 h and 85 h to 125 h, respectively. The unconfined compressive strength (UCS) of samples cured for 28 d ranged from 0.74 MPa to 2.26 MPa. These results indicate that the slurry preparation conditions have significant effects on the cemented PG backfill, including both properties of slurry and the strength of hardened backfill. Different mean values indexes at different levels of each factor are listed in Table 4. By comparing Rj of different factors of IST, FST, and UCS, the order of factor significance is as follows: the PG/B ratio > solid content > stirring time > stirring speed. However, the order of significant factors for bleeding rate is the solid content> stirring time>PG/B ratio > stirring speed.
Table 3.
Test data of evaluation indexes under different experimental conditions.
Table 4.
Range analysis data of mechanical and physical properties.
3.1.1. Effects of Slurry Preparation on Slurry Properties
The setting times (IST and FST),which are related to the time periods for slurry transportation, are important slurry properties to evaluate the performance of backfill [31]. As shown in Figure 2a,b, PG/B ratio was the most significant factor, and the IST and FST increased with the increase in PG/B ratio. It is well known that residual acid and other minor compounds in PG could retard the cementation process [32], leading to the extension of IST and FST with the high PG/B ratio. Furthermore, the IST and FST both reduced evidently with the increase in solid content. The increase in solid content meant a relatively higher binder to water ratio in the slurry, which would accelerate the hydration reactions, resulting in a reduction in IST and FST. In previous studies using cement as the binder, the setting times of the slurry were usually less than 1 day [27,33]. However, the setting times in this study ranged from 2 days to 5 days, which could be attributed to the retarding effect of PG. Some studies have found that sulfate significantly affected the setting time of cement [34]. As such, the sulfate in phosphogypsum might be one of the reasons for the increase of setting times. In this case, the smaller the IST and FST of cemented PG backfill, the better the filling efficiency. Hence, according to the above analysis, the optimal combination of slurry preparation conditions for shortening IST and FST is respectively, a solid content of 60% and a PG/B ratio of 2:1.
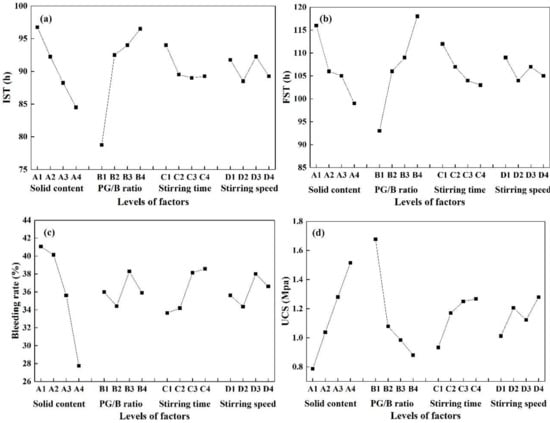
Figure 2.
Relationships between mean value of each factor under different evaluation index: (a) Initial setting time, (b) Final setting time, (c) Bleeding rate, (d) UCS.
As shown in Figure 2c, the bleeding rate is also affected by the slurry preparation. The bleeding rate decreased sharply with the increase in solid content, illustrating that the solid content was the key to determining how much water would be secreted into stopes after the placement of the slurry. With the increase in the solid content, more water would be consumed for the hydration reactions, and would thus lower the bleeding rate. Compared to the solid content as the most significant factor, variations of bleeding rate related to other factors (PG/B ratio, stirring time and stirring speed) were not significant. In the actual filling process, the excess water usually needs to be discharged from the mine by pumping machine, which would increase the cost. Meanwhile, impurities in the bleeding water would transfer into the groundwater. Therefore, considering from these aspects, a relatively low bleeding rate is recommended.
3.1.2. Effects of Slurry Preparation on Unconfined Compressive Strength
The strength of the backfill is one of the most important parameters that directly affect the safety performance of backfill [35]. According to the range analysis as shown in Table 4, four factors were all affecting the strength of cemented PG backfill samples. For the PG/B ratio, the UCS decreased from 1.68 MPa to 0.88 MPa (decreased by 48%) with the PG/B ratio increasing from 2:1 to 5:1. However, for the solid content increasing from 45% to 60%, the UCS increased from 0.79 MPa to 1.52 MPa (increased by 92%). For the stirring time increasing from 5 min to 120 min, the UCS increased from 0.93 MPa to 1.27 MPa (increased by 37%). For the stirring speed, the UCS increased from 1.01 MPa to 1.28 MPa (increased by 27%) with the stirring speed increasing from 300 rpm to 600 rpm.
It is clear that the PG/B ratio is the most significant factor affecting the strength of the backfill, as indicated by the Rj in Table 4 and the trend charts in Figure 2d. Previous studies showed that the strength development of the backfill was mainly ascribed to the formed cementitious products (such as C-S-H gel and ettringite) by hydration reactions [36,37]. A high PG/B ratio meant a low binder proportion in the mixture, resulting in less hydration products and therefore low strength. In this study, two backfill samples with the highest PG/B ratio (13# at a ratio of 2:1) and the lowest PG/B ratio (16# at a ratio of 5:1) were taken for SEM-EDS analysis. As shown in Figure 3a,b, the SEM images showed that the ettringite and C-S-H gel in sample 13#were much more than those in sample 16#, corresponding to the UCS of 2.26 MPa and 1.02 MPa, respectively. EDS analyses were done to identify CaSO4, ettringite and C-S-H gel in the backfill samples, as shown in Figure 3c–e. According to the EDS analysis, in sample 13# with PG/B ratio of 2:1, great amount of hydration products (C-S-H gel and ettringite) were wrapping around the PG, providing strength development for cemented PG backfill. In addition, it is notable that the PG/B ratio could also affect the physical properties of the backfill samples, which in turn influenced its mechanical properties. In this study, the wet unit weights of the backfill samples were measured, as shown in Table 3. Orthogonal range analysis and the trend charts of wet unit weight (provided in the Annex File) show that the PG/B ratio has the most significant effect on the wet unit. Kitazume et al. [38] has demonstrated that strength ratio increased with the wet unit weight ratio in soil and Portland cement mixture. Therefore, it seems that the PG/B ratio influences the mechanical performance of the backfill samples by affecting both the physical properties and the cementitious products. More binder could effectively improve the strength, which could benefit the stability of underground mine stopes. However, it is suggested that the binder accounts for over 75% of the total cost of backfill process [31], so high binder dosage might burden the backfill process [39]. Thus, considering both cost-effectiveness and strength requirements, a reasonable PG/B ratio must be decided according to the actual conditions of mines.
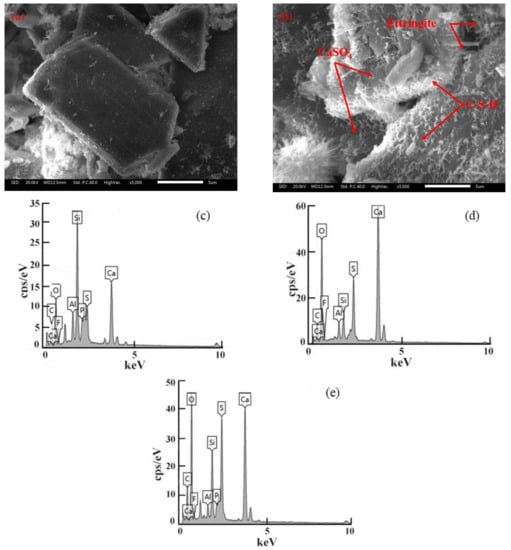
Figure 3.
Microstructure of cemented PG backfill samples: (a) SEM-Backfill sample 16# (PG/B ratio of 5:1), (b) SEM-Backfill sample 13# (PG/B ratio of 2:1), (c) EDS–CaSO4, (d) EDS–Ettringite, (e) EDS–C-S-H gel.
3.2. Impurities in Bleeding Water
The concentrations of impurities of the bleeding water were measured, as listed in Table 3. The concentrations of F−, SO42− and PO43− were in the ranges of 257–615 mg/L, 2149–3483 mg/L and 1.75–5.00 mg/L, respectively. Compared to the impurities in PG leachate (the concentrations of F−, SO42− and PO43− of PG were1355 mg/L, 23,842 mg/L and 315 mg/L, respectively), the majority of these ions were solidified/stabilized when the PG was cemented in the backfill. The average solidification rates were 73% for F−, 89% for SO42− and 99% for PO43−. These results indicate that cementation was an effective way to control PG pollution.
To understand the degrees of effects of slurry preparation on the quality of bleeding water, and Rj of four factors are listed in Table 5. As shown in Table 5 and Figure 4a,b, the concentrations of SO42− and F− in the bleeding water rose clearly with the increase in solid content and the PG/B ratio, but dropped slightly with the increase in stirring time and stirring speed. To be specific, for solid content, higher solid content meant more solids in the slurry system, leading to more dissolved ions in the bleeding water. The PG/B ratio was the most significant factor influencing the quality of the bleeding water, as shown in Figure 4a,b. The higher PG/B ratio, the higher concentrations of F− and SO42− that were detected in the bleeding water. The reason for this might be that the F− and SO42− were mainly sourced from PG, so higher PG dosage led to higher concentrations of F− and SO42− in the bleeding water. For stirring time, the impurities concentrations decreased within a certain small range with the increase in stirring time. This can be explained by the fact that the longer the stirring time, the longer the reaction time for hydration, resulting in more ions consolidated in the backfill and thus less free ions dissolved in the bleeding water [40]. Similarly, with the increase in the stirring speed of slurry, the contact frequency between the impurities and cementitious materials increased, leading to the enhancement of the cementation reactions, which would reduce the concentrations of F− and SO42− in the bleeding water.
Table 5.
Range analysis data of conductivity and impurities concentration in bleeding water.
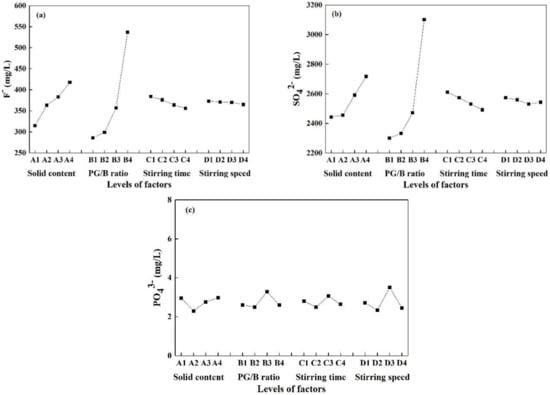
Figure 4.
Relationship between mean value of each factor under different evaluation index: (a) F−, (b) SO42−, (c) PO43−.
As opposed to the SO42− and F− varying with slurry preparation conditions, the concentrations of PO43− always kept at very low levels at all experimental batches, which was likely due to the different solidification mechanisms of these ions. It is reported in previous studies that the PO43− reacts rapidly with the large amounts of calcium in the alkaline environment, leading to the precipitation of dissolved PO43− and thus a low concentration of PO43− in the bleeding water [41,42]. At the same time, the EDS analysis revealed that the peaks of Ca, O and P were found, inferring the precipitation of calcium phosphate. Although cemented PG backfill technique has a strong capacity to consolidate impurities in backfill, there is still a certain amount of F− and SO42−, which might transfer into the groundwater. Therefore, in bleeding water, the concentrations of impurities should be kept as low as possible. Thus, the slurry preparation conditions with 45% of the solid content, 2:1 of PG/B ratio, 120 min of stirring time and 600 rpm of stirring speed was thought to be the optimal combination by considering impurities in the bleeding water.
3.3. Impurities in the Leachates of Tank Leaching Test (TLT)
After the initial bleeding water secretion, the backfill would harden and suffer from the underground water passing through, so it is significant to understand the leaching behavior of impurities in the long-time period. The tank leaching test (TLT) is commonly used to study the dynamic and static properties of impurities in the cement materials [43]. Therefore, in this study, the TLT test with eight leaching periods was adopted to study if the slurry preparation could affect the impurities performance in the long-term water immersion. The concentrations of impurities after TLT were measured as listed in Table 3.
3.3.1. pH Variation
pH values during total eight leaching periods are listed in Table 6. It can be seen that with the replacement of leachate, pH increased from the first leaching period to the sixth leaching period, which was likely due to the constant release of the hydroxide ions generated in the hydration process. The pH values reached the peak at the sixth leaching on 16 d, and then decreased from the sixth leaching period to the last leaching period. This indicates the finish of the hydration process on 16 d, and less hydroxide ions could be released into the leachates [44].
Table 6.
pH values in eight leaching periods.
To investigate if the slurry preparation conditions could affect the pH of the leachates in the long run, the pH values at the last leaching period were used to approximate the pH of the underground water after long-term immersion. Different evaluation indexes of four factors are shown in Table 7 and Figure 5a. The pH decreased sharply with the increase in PG/B ratio, and gradually increased with the increase in solid content, stirring time and stirring speed. Apparently, the PG/B ratio was the most significant factor influencing the pH of leachate. It is well known that the PG is usually acidic, while the binder is alkaline [45]. Therefore, a high PG/B ratio meant a high dosage of acid and a low dosage of alkali, leading to the low pH values of leachates. At the same time, the solid content is also a significant factor influencing the pH value of TLT. As shown in Figure 5a, the pH raised with the increase in solid content, which might be explained by more hydroxide ions being produced due to the higher solid content.
Table 7.
Range analysis of pH and cumulative leaching quantity of TLT.
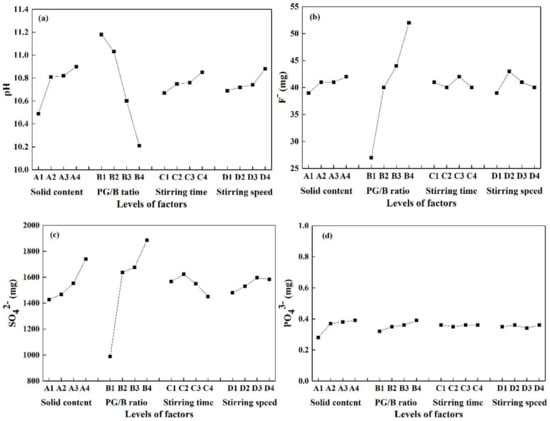
Figure 5.
Relationship between mean value of each factor under different evaluation indexes in tank leaching test. (a) pH, (b) F−, (c) SO42−, (d) PO43−.
3.3.2. Cumulative Effects of Impurities on the Environment
In order to evaluate the long-term environmental behavior of impurities in the backfill samples, the cumulative leaching quantities of impurities in the PG and those in the cemented PG backfill (taking sample 13# as an example) was used for comparison, as shown in Figure 6. It is clear that the total quantities of impurities in leachates of backfill samples were much less than those in the leachates of PG. The cumulative leaching quantity of SO42− in PG is 5 times as much as that in backfill, the cumulative leaching quantity of F− in PG is 81 times in backfill, and the cumulative leaching quantity of PO43− in PG is 1678 times in backfill. The reason for this is that, when PG formed a dense structure, the impurities were precipitated and/or incorporated in the hydration products, and thus impurities were less likely to escape from the cemented PG backfill [46].
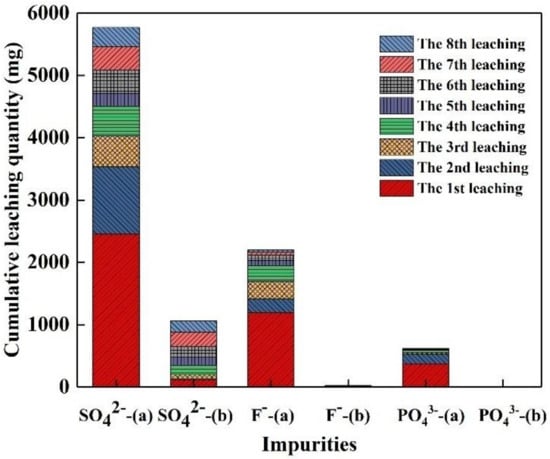
Figure 6.
The cumulative leaching quantity of impurities in (a) PG and (b) cemented PG backfill.
3.3.3. Effects of Slurry Preparation on Leaching Behavior of Impurities
According to the tank leaching test, the ranges of cumulative leaching quantities of F−, SO42− and PO43− were 25~60 mg, 876~2054 mg and 0.25~0.41 mg, respectively. The variation trends of four factors are shown in Figure 5. It is clear that the PG/B ratio was the most influential factor, and the cumulative leaching quantities of F− and SO42− increased with the increase in PG/B ratio. It is likely due to that the low strength of backfill related to the high PG/B ratio could not well solidify the impurities in PG [47], resulting in the increase in the cumulative leaching quantities of F− and SO42−. However, the cumulative quantity of PO43− was much less compared to those of F− and SO42− in the leachates, as shown in Figure 5. The hydration reactions would provide an alkaline environment and a great amount of calcium ions for the precipitation of F−, SO42− and PO43− [12]. However, the solubility product constant of calcium phosphate (2.0 × 10⁻²⁹) was several orders of magnitude lower than those of calcium fluoride (5.3 × 10⁻⁹) and calcium sulfate (9.1 × 10⁻⁶), resulting in a lower leaching quantity of PO43− in the leachate under long-term immersion (as shown in Figure 5d).
4. Conclusions
In this study, the orthogonal experiment was designed to understand the effect of slurry preparation conditions on the performance of cemented PG backfill. Four factors were examined: solid content, PG/B ratio, stirring time and stirring speed. The following conclusions can be made. Firstly, according to the range analysis, the most significant factor affecting the setting times and strength was the PG/B ratio, followed by the solid content. The solid content has the most significant effect on the bleeding rate. Considering both the slurry properties and strength development, it is determined the optimal condition is the slurry concentration of 60% and PG/B ratio of 2:1. Secondly, the lower the concentrations of impurities in bleeding water and TLT leachate, the friendlier the conditions are for the ground water. Considering environmental behaviors, it is determined that optimal combination is a solid concentration of 45%, PG/B ratio of 2:1, stirring time of 120 min and stirring speed of 600 rpm. Results showed that the differently optimal combinations exist for considering the slurry properties, mechanical strength and environmental behaviors of cemented PG backfill. Therefore, it is recommended that mines choose different optimization conditions according to their actual demands.
Author Contributions
X.L. and Y.S. conceived and designed the theoretical framework; Y.Z. performed the experiments and wrote the manuscript; Q.Z., S.Z. and C.M. corrected the tables and figures. All authors participated in the finalization of the written manuscript. X.L. acted as the supervisor of the project and acquired all necessary funding.
Funding
This work was supported by Project of Hunan Natural Science Foundation (Grant No. 2018JJ3664), Key Research Development Program of Hunan (Grant No. 2017SK2251) and Project of Natural Science Foundation of China (Grant No. 51608536).
Acknowledgments
We thank Modern Analysis and Testing Center of CSU for assistance with SEM analysis.
Conflicts of Interest
The authors declare no conflict of interest.
References
- Yang, J.K.; Liu, W.C.; Zhang, L.L.; Xiao, B. Preparation of load-bearing building materials from autoclaved phosphogypsum. Constr. Build. Mater. 2009, 23, 687–693. [Google Scholar] [CrossRef]
- Contreras, M.; Teixeira, S.R.; Santos, G.T.A.; Gázquez, M.J.; Romero, M.; Bolívar, J.P. Influence of the addition of phosphogypsum on some properties of ceramic tiles. Constr. Build. Mater. 2018, 175, 588–600. [Google Scholar] [CrossRef]
- Lopez, F.A.; Gazquez, M.; Alguacil, F.J.; Bolivar, J.P.; Garcia-Diaz, I.; Lopez-Coto, I. Microencapsulation of phosphogypsum into a sulfur polymer matrix: Physico-chemical and radiological characterization. J. Hazard. Mater. 2011, 192, 234–245. [Google Scholar] [PubMed]
- Szlauer, B.; Szwanenfeld, M.; Werblanjakubiec, H.; Kolasa, K. Hydrobiological characteristics of ponds collecting effluents from a phosphogypsum tip of the Police Chemical Works near Szczecin. Acta Hydroch. Hydrob. 1990, 32, 27–34. [Google Scholar]
- Degirmenci, N. Utilization of phosphogypsum as raw and calcined material in manufacturing of building products. Constr. Build. Mater. 2008, 22, 1857–1862. [Google Scholar] [CrossRef]
- Perez-Lopez, R.; Alvarez-Valero, A.M.; Nieto, J.M. Changes in mobility of toxic elements during the production of phosphoric acid in the fertilizer industry of Huelva (SW Spain) and environmental impact of phosphogypsum wastes. J. Hazard. Mater. 2007, 148, 745–750. [Google Scholar] [CrossRef] [PubMed]
- Tayibi, H.; Choura, M.; Lopez, F.A.; Alguacil, F.J.; Lopez-Delgado, A. Environmental impact and management of phosphogypsum. J. Environ. Manag. 2009, 90, 2377–2386. [Google Scholar] [CrossRef]
- Holanda, F.D.C.; Schmidt, H.; Quarcioni, V.A. Influence of phosphorus from phosphogypsum on the initial hydration of Portland cement in the presence of superplasticizers. Cem. Concr. Compos. 2017, 83, 384–393. [Google Scholar] [CrossRef]
- Degirmenci, N.; Okucu, A.; Turabi, A. Application of phosphogypsum in soil stabilization. Build. Environ. 2007, 42, 3393–3398. [Google Scholar] [CrossRef]
- Bensalah, H.; Bekheet, M.F.; Younssi, S.A.; Ouammou, M.; Gurlo, A. Hydrothermal synthesis of nanocrystalline hydroxyapatite from phosphogypsum waste. J. Environ. Chem. Eng. 2018, 6, 1347–1352. [Google Scholar] [CrossRef]
- Papastefanou, C.; Stoulos, S.; Ioannidou, A.; Manolopoulou, M. The application of phosphogypsum in agriculture and the radiological impact. J. Environ. Radioact. 2006, 89, 188–198. [Google Scholar] [CrossRef]
- Li, X.B.; Du, J.; Gao, L.; He, S.Y.; Gan, L.; Sun, C.; Shi, Y. Immobilization of phosphogypsum for cemented paste backfill and its environmental effect. J. Clean. Prod. 2017, 156, 137–146. [Google Scholar] [CrossRef]
- Fall, M.; Benzaazoua, M. Modeling the effect of sulphate on strength development of paste backfill and binder mixture optimization. Cem. Concr. Res. 2005, 35, 301–314. [Google Scholar] [CrossRef]
- Ercikdi, B.; Kesimal, A.; Cihangir, F.; Deveci, H.; Alp, İ. Cemented paste backfill of sulphide-rich tailings: Importance of binder type and dosage. Cem. Concr. Compos. 2009, 31, 268–274. [Google Scholar] [CrossRef]
- Cao, S.; Yilmaz, E.; Song, W.D. Evaluation of viscosity, strength and microstructural properties of cemented Tailings backfill. Minerals 2018, 8, 352. [Google Scholar] [CrossRef]
- Kermani, M.; Hassani, F.P.; Aflaki, E.; Benzaazoua, M.; Nokken, M. Evaluation of the effect of sodium silicate addition to mine backfill, Gelfill—Part 2: Effects of mixing time and curing temperature. J. Rock. Mech. Geotech. Eng. 2015, 7, 668–673. [Google Scholar] [CrossRef]
- Zou, G.L.; Xu, J.; Wu, C. Evaluation of factors that affect rutting resistance of asphalt mixes by orthogonal experiment design. Int. J. Pavement. Res. Tech. 2017, 10, 282–288. [Google Scholar] [CrossRef]
- Zheng, C.S.; Kizil, M.S.; Chen, Z.W.; Aminossadati, S.M. Effects of coal properties on ventilation air leakage into methane gas drainage boreholes: Application of the orthogonal design. J. Nat. Gas. Sci. Eng. 2017, 45, 88–95. [Google Scholar] [CrossRef]
- Su, L.S.; Zhang, J.B.; Wang, C.J.; Zhang, Y.K.; Li, Z.; Song, Y.; Jin, T.; Ma, Z. Identifying main factors of capacity fading in lithium ion cells using orthogonal design of experiments. Appl. Eng. 2016, 163, 201–210. [Google Scholar] [CrossRef]
- Zhai, Y.N.; Sun, S.D.; Wang, J.Q.; Niu, G.G. Job shop bottleneck detection based on orthogonal experiment. Comput. Ind. Eng. 2011, 61, 872–880. [Google Scholar] [CrossRef]
- Yao, Z.Q. Technoligical Study and Reliability Analysis of Yellow Phosphorus Slag and Phosphgysum Backfill in Kaiyang Mine. Master’s Thesis, Central South University, Changsha, China, 2009. [Google Scholar]
- Cui, C.W.; Shi, F.; Li, Y.G.; Wang, S.Y. Orthogonal analysis for perovskite structure microwave dielectric ceramic thin films fabricated by the RF magnetron-sputtering method. J. Mater. Sci. Mater. Electronics 2010, 21, 349–354. [Google Scholar]
- Wu, X.; Leung, D.Y.C. Optimization of biodiesel production from camelina oil using orthogonal experiment. Appl. Eng. 2011, 88, 3615–3624. [Google Scholar] [CrossRef]
- Yang, M.; Zhang, Y.; Shao, B.; Qi, R.; Myoga, H. Precipitative Removal of Fluoride from Electronics Wastewater. J. Environ. Eng. 2001, 127, 902–907. [Google Scholar] [CrossRef]
- Taha, Y.; Benzaazoua, M.; Edahbi, M.; Mansori, M.; Hakkou, R. Leaching and geochemical behavior of fired bricks containing coal wastes. J. Environ. Manag. 2018, 209, 227–235. [Google Scholar] [CrossRef]
- Chai, J.C.; Onitsuk, K.; Hayashi, S. Cr(VI) concentration from batch contact/tank leaching and column percolation test using fly ash with additives. J. Hazard Mater. 2009, 166, 67–73. [Google Scholar] [CrossRef]
- Ma, J.L.; Zhao, Y.C.; Wang, J.M.; Wang, L. Effect of magnesium oxychloride cement on stabilization/solidification of sewage sludge. Constr. Build. Mater. 2010, 24, 79–83. [Google Scholar]
- Wu, A.X.; Wang, Y.; Wang, H.J.; Yin, S.H.; Miao, X.X. Coupled effects of cement type and water quality on the properties of cemented paste backfill. Int. J. Miner. Process. 2015, 143, 65–71. [Google Scholar] [CrossRef]
- Standard for Test Method of Performance on Building Mortar; Chinses National Standard: JGJ/T70-2009; Ministry of Construction of PRC: Beijing, China, 2009.
- Chen, Q.S.; Zhang, Q.L.; Fourie, A.; Xin, C. Utilization of phosphogypsum and phosphate tailings for cemented paste backfill. J. Environ. Manag. 2017, 201, 19–27. [Google Scholar] [CrossRef]
- Fall, M.; Benzaazoua, M.; Saa, E.G. Mix proportioning of underground cemented tailings backfill. Tunn. Underg. Sp. Tech. 2008, 23, 80–90. [Google Scholar] [CrossRef]
- Rashad, A.M. Phosphogypsum as a construction material. J. Clean. Prod. 2017, 166, 732–743. [Google Scholar] [CrossRef]
- Yin, S.H.; Wu, A.X.; Hu, K.J.; Wang, Y.; Zhang, Y.K. The effect of solid components on the rheological and mechanical properties of cemented paste backfill. Miner Eng. 2012, 35, 61–66. [Google Scholar] [CrossRef]
- Kumer, S.; Kameswara Rao, C.V.S. Effect of sulfates on the setting time of cement and strength of concrete. Cem. Concr. Res. 1994, 24, 1237–1244. [Google Scholar] [CrossRef]
- Fall, M.; Adrien, D.; Célestin, J.C.; Pokharel, M.; Touré, M. Saturated hydraulic conductivity of cemented paste backfill. Miner Eng. 2009, 22, 1307–1317. [Google Scholar] [CrossRef]
- Wu, D.; Zhang, Y.L.; Liu, Y.C. Mechanical performance and ultrasonic properties of cemented gangue backfill with admixture of fly ash. Ultrasonics 2016, 64, 89–96. [Google Scholar] [CrossRef]
- Fall, M.; Pokharel, M. Coupled effects of sulphate and temperature on the strength development of cemented tailings backfills: Portland cement-paste backfill. Cem. Concr. Compos. 2010, 32, 819–828. [Google Scholar] [CrossRef]
- Kitazume, M.; Grisolia, M.; Leder, E.; Marzano, I.P.; Correia, A.A.S.; Venda Oliveira, P.J.; Ahnberg, H.; Andersson, M. Applicability of molding procedures in laboratory mix tests for quality control and assurance of the deep mixing method. Soils. Found. 2015, 55, 761–777. [Google Scholar] [CrossRef]
- Benzaazoua, M.; Fall, M.; Belem, T. A contribution to understanding the hardening process of cemented pastefill. Miner Eng. 2004, 17, 141–152. [Google Scholar] [CrossRef]
- Juez, J.M.; Cazacliu, B.; Cothenet, A.; Artoni, R.; Roquet, N. Recycled concrete aggregate attrition during mixing new concrete. Constr. Build. Mater. 2016, 116, 299–309. [Google Scholar] [CrossRef]
- Manjit, S. Treating waste phosphogypsum for cement and plaster manufacture. Cem. Concr. Res. 2002, 32, 1033–1038. [Google Scholar]
- Benzaazoua, M.; Fiset, J.F.; Bussière, B.; Villeneuve, M.; Plante, B. Sludge recycling within cemented paste backfill: Study of the mechanical and leachability properties. Miner Eng. 2006, 19, 420–432. [Google Scholar] [CrossRef]
- Hamberg, R.; Maurice, C.; Alakangas, L. The use of low binder proportions in cemented paste backfill—Effects on As-leaching. Miner Eng. 2015, 78, 74–82. [Google Scholar] [CrossRef]
- Sanchez, F.; Garrabrants, A.C.; Vandecasteele, C.; Moszkowicz, P.; Kosson, D.S. Environmental assessment of waste matrices contaminated with arsenic. J. Hazard. Mater. 2003, B96, 229–257. [Google Scholar] [CrossRef]
- Li, X.B.; Zhou, Z.L.; Zhao, G.Y.; Liu, Z.X. Utilization of phosphogypsum for backfilling, way to relieve its environmental impact. Gospod. Surowcami. Min. 2008, 24, 223–232. [Google Scholar]
- Shi, Y.; Gan, L.; Li, X.B.; He, S.Y.; Sun, C.; Gao, L. Dynamics of metals in backfill of a phosphate mine of guiyang, China using a three-step sequential extraction technique. Chemosphere 2018, 192, 354–361. [Google Scholar] [CrossRef]
- Coussy, S.; Benzaazoua, M.; Blanc, D.; Moszkowicz, P.; Bussiere, B. Assessment of arsenic immobilization in synthetically prepared cemented paste backfill specimens. J. Environ. Manag. 2012, 93, 10–21. [Google Scholar] [CrossRef] [PubMed]
© 2019 by the authors. Licensee MDPI, Basel, Switzerland. This article is an open access article distributed under the terms and conditions of the Creative Commons Attribution (CC BY) license (http://creativecommons.org/licenses/by/4.0/).