Abstract
The presence of loose medium backfill above the horizontal pillar will technically hinder the efficient recovery of the pillar since the improper design and preserved roof protection layer height will potentially lead to casualties and equipment damage caused by large area collapse of filled tailings as well as roof fall accidents. In this study, a safe and efficient technique for the recovery of isolated pillars under loose tailings backfill was carried out via field investigation, theoretical analysis, numerical simulation, and analytic hierarchy process using the isolated pillars in the 855 middle sublevel of Hongling Zinc-Lead Mine, Chifeng, Inner Mongolia, as a practical engineering background. Current studies have revealed that the optimal scheme for an isolated horizontal pillar recovered via the cut-and-fill stoping of a drift vertical to ore body strike involves preserving a 1.0-m roof protection layer above the crown pillar combined with a spaced mining extraction sequence. This design minimizes ore dilution and losses during the pillar extraction process under safe operation. Our research results provide theoretical and technical support for the safe and efficient recovery of isolated pillars under loose tailings backfill in similar mines.
1. Introduction
The vast majority of metal mine workings feature preserved pillars, the ore volumes of which account for approximately 20 to 40% of their workable reserves [,,]. Recovering remnant pillars can improve the utilization rate of mineral resources, extend mine life while shortening the underground operation line, aid in coordinating the sequence of operations, and improve mine management capacity. For example, Rybak [] discusses the possibility of reducing the loss of minerals left in the pillars due to the use of a system with backfill; simulates in sufficient detail the impact of mining operations on the undermined rock mass, the possibility of developing subvertical disturbance, violation of the water-protective strata and the formation of subsidence on the Earth’s surface. The technical conditions for mining remnant crowns and sill pillars are particularly complex, leading to more stringent safety and cost requirements [,].
There are two main upper load forms for horizontal isolated pillars: (1) in cases where the upper part of the pillar has been subjected to cut-and-fill stoping, the overlying uniform load is jointly produced by the gravitational loading of the overlying backfill and the ground pressure of the pit []; (2) when the ore body above the isolated horizontal pillar is extracted using either open stoping or caving, the overlying uniform load is primarily induced by the weight of the collapsed surrounding rock or residual ore body in the goaf []. Under the first condition, the presence of loose medium backfill above the horizontal pillar will technically hinder the efficient recovery of the pillar. The high permeability of filled tailings results in the deposition of significant quantities of water at the bottom of the pit. A resulting column collapse will result in tailing leakage and loss, potentially leading to blockage of the operational space and roadway and, in serious cases, surface subsidence. Thus, a sufficiently thick roof protection layer must be preserved in advance to prevent casualties and equipment damage caused by large area collapse and roof fall accidents involving loose tailings backfill. It is worth noting that preserving a roof protection layer that is too thick will not ensure the safety of the roof and will further waste mineral resources, increasing ore damage and dilution. It follows that determining a reasonable roof protection layer thickness and stability in the recovery of pit crown pillars is an important and complex scientific research task [,,]. The analysis and study of the mining stability of crown pillars under backfill in metal mines have significant theoretical and practical significance in improving the recovery rate of resources while achieving safe asnd efficient extraction.
It is clear from the relevant national and international literature that the size of the preserved roof protection layer of the isolated pillar is related to the technical conditions of mining (the reserve conditions; the size, occurrence, and stability of the crown and sill pillars; the grade and value of the ore; the dip of the ore body and the stability of the surrounding rock; the surface conditions; and the characteristics of the overlying uniform load distribution) and is inseparable from the main technical factors of crown pillar mining (the selected mining method and process parameters) [,]. For example, Liu [] analyzed the stope span on the roof stability in the Sanshandao gold mine and proposed the rational stope structure parameters when recovering the horizontal pillar under backfill. The technical conditions of mining vary significantly by mine and, therefore, so do the recovery schemes. This variety has led to gaps in the literature; for example, there is not much research on the appropriate recovery technology for cases in which both the upper and lower parts of an isolated pillar comprise loose tailings backfill. In addition, the empirical formulas used in past studies to calculate the thickness of the roof protection layer of isolated pillars are potentially inaccurate and of limited general applicability []. Zhao et al. [] calculated the size of the insulating pillar by using methods of limit span mechanism, the empirical equation method, and the limit equilibrium method. The results indicate the discreteness of the calculated pillar size is very large. With the rapid development of rock mechanics and computer science, numerical simulation methods have been increasingly used to analyze geotechnical engineering problems [,,]. The authors conducted several studies to investigate the failure behavior of surrounding rocks in the underground mine by using the FLAC3D (Finite Difference Method) and ELFEN (Finite/Discrete Element Method) software [,]. In addition, optimized fuzzy mathematics can be applied to transform various fuzzy or subjective factors involved in the preservation of the roof protection layer of an isolated pillar into a mathematical form to enable the quantification via evaluation indexing of individual schemes, allowing for more scientific, reasonable, and reliable scheme selection [,,]. Thus, using classical theory, numerical simulation and optimized fuzzy mathematics to study the safe and efficient recovery technology of isolated pillars under loose tailings filling body will greatly improve the rationality and accuracy of the calculation results. To date, however, only a few relevant studies have applied such a combined approach.
Analyzing the above, it can be noted that the safe and efficient recovery technique of isolated horizontal pillars under loose tailings backfill is a topical issue. To achieve this, it is necessary to solve the following tasks: (1) the proposal of a compatible middle sublevel crown pillar recovery scheme; (2) the determination of rational mining sequence when recovering a crown pillar; and (3) the calculation of preserved roof protection layer height. The present study demonstrates that the optimal design for an isolated horizontal pillar recovered via the cut-and-fill stoping of a drift vertical to the ore body strike involves preserving a 1.0-m roof protection layer above the crown pillar combined with a spaced mining extraction sequence. The research results are intended to provide theoretical support and scientific decision-making for the safe and efficient recovery of isolated pillars under loose tailings backfill in similar mines.
2. Engineering Background and Existing Problems
2.1. Basic Overview of the Mining Area
The Hongling Zinc-Lead Mine, Chifeng, is located at Haobugao Village, Wulandaba Township, Lindong Town, Bairin Left Banner, Chifeng City, Inner Mongolia Autonomous Region. The mining area has a total length of 5700 m. The ore body is reserved at an elevation range of 630–1110 m and has a maximum deepening of 480 m and an overall orientation of 59° N.E., with a tendency toward the northwest. The ore body has a dip of 60–80°, with an average dip of 75°, and a strike length of 1350 m. The ore zone is divided into five sublevels from east to west, with the main industrial ore body in the mining area located in Sublevel III. Sublevel III has a total length of 1350 m and a width of 100 m, tends toward the northwest, and has a dip of 80°. It circles three zinc ore bodies, namely 1, 1-1, and 2 and one iron ore body.
2.2. Existing Problems
In the mine, zinc and iron ores are recovered in the middle sublevel at 905 and 855 m from the south and west flanks using the shallow-hole shrinkage and sublevel open-stope methods. The surrounding rock of the hanging and footwall is marble and slate, respectively. The average thickness and dip of the ore body are 15 m and 75°, respectively. The pit has the following structural parameters: rib pillar of 18 m, stope room of 32 m, crown pillar of 10 m, and the width of the ore body between 10 and 40 m. The schematic of the mining method used in the 855 middle sublevel of the pit is shown in Figure 1.
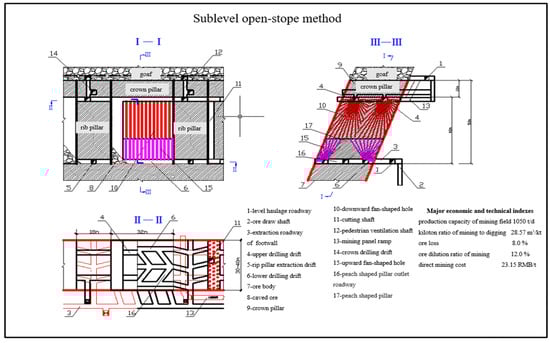
Figure 1.
Schematic of mining method used in the 855 middle sublevel of the pit. (Done by the authors).
At present, the 855 m middle sublevel 1# ore body goaf has been governed, and part of the goaf in the 905 m middle sublevel is backfilled with 1:10 graded tailings (height of approximately 20 m), as shown in Figure 2. To reduce ore loss and extract additional ore resources, the crown pillars of the 855 m middle sublevel (with a height of approximately 10 m, length along the strike direction of approximately 100 m, and containing approximately 30,000 tons of ore) are scheduled to be recovered; however, the rib pillars and the crown pillars corresponding to them will not be extracted for the time being, and the necessary support pillars will be preserved to maintain the stability of the pit in conjunction with the strength of the ore rock body itself. Full recovery of the crown pillars of the middle sublevel would cause a significant collapse of overlying loose tailings backfill and ore mixture, block the ore removal channel, and threaten the safety of downhole operators. To preserve the top protection ore, a solution to the technical problem of executing an economic and reasonable recovery scheme based on selecting a suitable roof protection layer thickness is urgently needed.
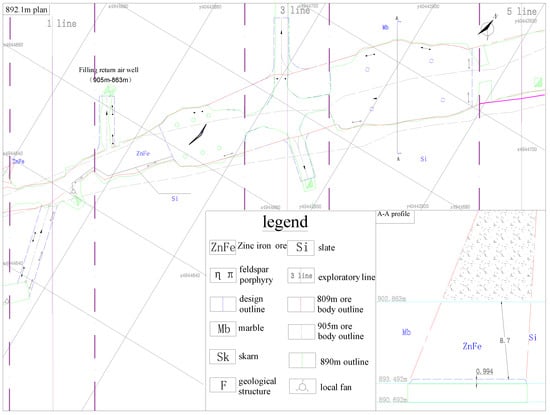
Figure 2.
Plan of Lines 1–3 of 890 horizontal in 855 m middle sublevel.
2.3. Methods
Based on the engineering background and existing problems, this study presents a crown pillar recovery scheme applicable to the actual technical conditions in the Hongling Zinc-Lead Mine, Chifeng, Inner Mongolia, using the isolated horizontal pillar of the mine’s 855 middle sublevel as the engineering background. Using the structure and size of the pit obtained through on-site research and the theoretical analysis, the uniform load value of the overlying backfill and the reasonable thickness range of the preserved roof protection layer of the crown pillar in the 855 middle sublevel were obtained. Numerical simulation and inversion analysis of different roof protection layer preservation and recovery schemes were then carried out using Fast Lagrangian Analysis of Continua (FLAC3D) numerical simulation technology to obtain the displacement of the roof protection layer and the distribution pattern of the plastic zone within the test pit. Finally, the evaluation indices of the respective extraction scheme were quantified and analyzed using an analytic hierarchy process.
3. Proposed Middle Sublevel Crown Pillar Recovery Schemes
Based on the existing mining technology conditions and the stress environment around the crown pillars of the 855 middle sublevel of Hongling Zinc-Lead Mine, Chifeng, three crown pillar recovery schemes were proposed. The advantages, disadvantages, and applicable conditions for each scheme are listed in Table 1. It is worth noting that the isolated pillar of the 855 middle sublevel has a total thickness of 10 m and that the 5-m-thick ore body under it remains in a relatively stable state during extraction; accordingly, we limited our recovery scheme comparison to the isolated pillars of the upper (close to the loose tailings backfill) 5-m-thick ore body. In all three schemes, the cut and fill stoping are used to recover the pillars, but the pit structure, stope preparation, cut, and extraction operation differ significantly by proposal.

Table 1.
Basic Characteristics and Advantages and Disadvantages of Three Crown Pillar Recovery Schemes.
In Scheme I, the pit features a simpler structure but longer drifts, resulting in a large, exposed area of extraction drifts; as a result, a thicker roof protection layer is required, and the ore loss rate is higher. Thus, Scheme I was excluded because of its poor performance in terms of residual deposit resource recovery. Under Scheme III, the pit has the smallest exposed area of drifts; however, the difference in this regard relative to Scheme II is minimal. In contrast, the pit under Scheme III has the disadvantages of a complex structure, a large workload for stope preparation and cutting, and a high strength required for transport roadway support, etc. Moreover, this scheme adopts non-spaced extraction, reducing extraction progress and work efficiency within the mining site. Scheme II features some of the advantages of Schemes I and III with a simple pit structure, small exposed area of drifts, and enhanced extraction efficiency. Therefore, following comprehensive comparison and analysis Scheme II was selected as the recovery scheme for the crown pillars of the 855 middle sublevel.
4. Theoretical Calculation of a Reasonable Size for the Preserved Roof Protection Layer of the Crown Pillars of the 855 Middle Sublevel
4.1. Calculation of the Overlying Uniform Load on the Roof Protection Layer
A site survey revealed that the surrounding rocks in the upper goaf would undergo failure and collapse under the double effects of mining-induced stress and excavation unloading, resulting in the deposition of waste rock at the bottom. Accordingly, the load on the upper part of the crown pillars in the 855 middle sublevel was determined to comprise two components: the loads from the loose tailings backfill and the waste rock falling from the surrounding rock caving from a height of 2–3 m, respectively. The load of the latter on the horizontal pillars is equivalent to the self-weight of the waste rock, that is, approximately 0.059 MPa. In calculating the overlying uniform load, the upper part of the roof protection layer was considered as the loose backfill, and according to Janssen’s loose mass pressure theory [,], the uniform load of the loose tailings acting on the roof protection layer was determined to be 0.221 MPa. Thus, the total overlying uniform load on the roof protection layer was approximately 0.28 MPa.
4.2. Theoretical Analysis of the Reasonable Size of Preserved Roof Protection Layer
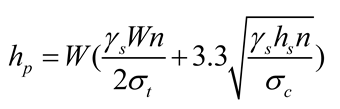
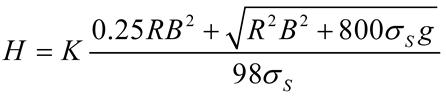
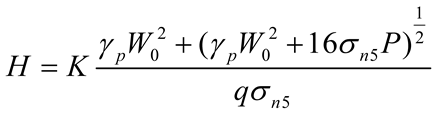
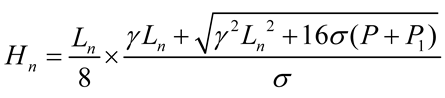
We calculated and analyzed the thickness of the roof protection layer using limit span theory, K.B. Rubeneita’s method, B.H. Bogorlyubov’s method, the length-to-width ratio plate-girder method, the load intersection line method, Protodyakonov’s arch method, and limit equilibrium theory [,,]. Given the limited space in this paper, the parameter definitions and the calculated top protection layer results obtained under each theory are summarized in Table 2.
Table 2.
Theoretical calculation methods and results.
Note: The physical and mechanical parameters of the ore rock are listed in Table 3. The calculations assume a drift width of 5 m, a drift length (thickness of the ore body) of 15 m, and a waste rock unit weight of γ1 = 26 KN/m3.
Table 3.
List of material parameters selected for the numerical simulation.
It was clear from the analysis results that the purely theoretical calculations produced highly discrete horizontal pillar thicknesses and, therefore, that subsequent numerical simulation was required to obtain a clearer roof protection layer thickness value. To this end, the theoretical results were categorized and summarized. For the convenience of grid division in the numerical simulation and to ensure operable field construction, the theoretical values in Table 1 were revised and summarized to obtain three schemes with different roof thicknesses for the preservation of the roof protection layer: Scheme I (0.5 m), Scheme II (1 m), and Scheme III (1.5 m). (It is noteworthy that the theoretical value derived from the load intersection line method had a large discrepancy from that derived from other theoretical calculations; therefore, its results were not considered for the time being).
5. Numerical Simulation and Inversion of Crown Pillar Extraction and Roof Protection Layer Schemes of the 855 Middle Sublevel
5.1. Numerical Modelling
The FLAC3D-based numerical simulation involved the static analysis of a model with a total length of 100 m, a width of 75 m, a height of 75 m, and bottom and top elevations of +880 and +955 m, respectively, in the Z- direction. To simplify the model, we set the dip of the ore body at 90°. We fixed the X- and Y-axis displacements on the planes at both ends of the X- and Y-axis directions, respectively, of the model and the X-, Y-, and Z-direction displacements at the bottom boundary of the model. Our preliminary measurement of in-situ stress revealed that the maximum horizontal principal stress increased with the buried depth and that the orientation of the maximum horizontal principal stress remained consistent at different buried depths, and the fitting equations of the three principal stresses are presented, respectively, as follows:
(1) According to the calculations, the vertical stress at +955 elevation was 4.19 MPa, the maximum horizontal principal stress was 14 MPa, and the minimum horizontal principal stress was 4.97 MPa. The models were divided into 25 groups, each featuring isolated pillars, roof protection layers, upper 20 m backfill of roof protection layer and lower 20 m backfill of isolated pillars, and surrounding rocks at the hanging and foot walls according to material characteristics, as shown in Figure 3.
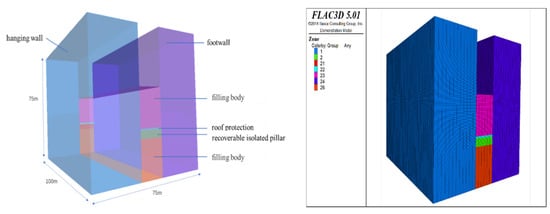
Figure 3.
3D numerical model of mine based on FLAC3D.
5.2. Selection of Model Material Parameters
Based on the basic mechanical parameters of the rock masses obtained from a large number of indoor rock mechanics tests in the early stage, the rock solidity can be graded in combination with the structural surface reserve in the field, and the mechanical parameters of the rocks can be discounted using the Hoek-Brown strength criterion [,]. The discounted material parameters more accurately reflect the mechanical properties of the rock mass in the field. The material parameters of the ore body and surrounding rock obtained from the relevant literature [,] are listed in Table 3. A backfill scheme with an ash-sand ratio of 1:10 was used in backfilling the isolated ore based on the backfill material parameters listed in Table 4.
Table 4.
Material parameters of backfills.
5.3. Numerical Simulation Schemes and Steps
A total of six extraction schemes involving different combinations of roof protection layer preservation and extraction sequence were considered (during extraction, the crown pillar had a total height of 10 m; considering that the lower 5 m has been mined, numerical simulation was confined to extraction schemes involving crown pillars within the upper 5 m), as listed in Table 5. To reflect an actual mining situation, two extraction sequences were considered: mining at an interval of one strip and strip-by-strip mining. In both cases, three drifts were simultaneously extracted following an overall extraction sequence proceeding from the west to the east wing.
Table 5.
Selection of numerical simulation schemes.
5.4. Analysis and Discussions of Numerical Calculation Results
5.4.1. Analysis of Displacement Field
Figure 4 shows Z-direction displacement cloud pictures (plan views) of the roof protection layer for different periods under two extraction sequences (Schemes A and B) when the thickness of the roof protection layer is 0.5 m. Given the space limitations of this paper, only some of the extraction and backfilling stages are shown. The analysis found that, under both Schemes A and B, the displacement value at the hanging wall near the ore body was generally larger than that at the footwall during the overall extraction process (the displacement value of the roof protection layer near the hanging wall was approximately 1.14 cm; that near the footwall was approximately 0.76 cm). Because the strength of the surrounding rock at the hanging wall was lower, it was less able to support the roof protection layer, resulting in a larger sedimentation value. Analysis of the evolution rule of the displacement field of the roof protection layer at different stages revealed that the extraction sequence has a significant influence on the sedimentation development trend in the roof protection layer. When Step 2 was completed (for Drifts 1, 8, and 15 of Scheme A and Drifts 1, 3, and 5 of Scheme B), only a small increase in the displacement of the roof protection layer occurred at the corresponding drifts; when Step 11 was completed (for Drifts 6, 13, and 20 of Scheme A and Drifts 8, 10, and 12 of Scheme B), more obvious sedimentation occurred on the left side, middle, and right side of the roof protection layer in Scheme A. In contrast, a larger range of sedimentation occurred on the right side of Scheme B. When the last step was completed (for Drifts 7 and 14 of Scheme A and Drift 20 of Scheme B), the basic area of the displacement field of the roof protection layer was the same in both schemes: the maximum displacements under Schemes A and B were approximately 1.62 and 1.6 cm, respectively, and the sedimentation value under Scheme B was slightly smaller than that under Scheme A.
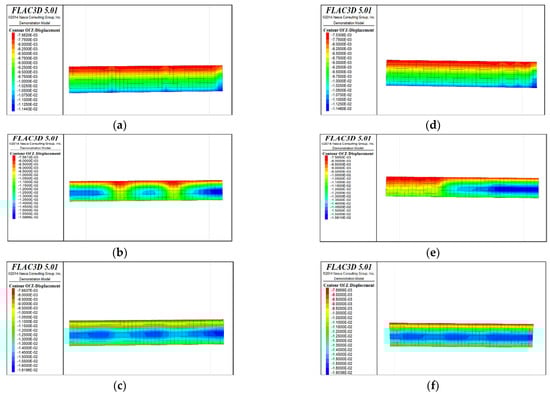
Figure 4.
Z-direction displacement cloud pictures (plan views) for different periods under Schemes A and B with a roof protection layer thickness of 0.5 m. (a) After extraction and backfill of Drifts 1, 8, and 15 (Step 2). (b) After extraction of Drifts 6, 13, and 20 (Step 11). (c) After extraction and backfilling of Drifts 7 and 14 (last step). (d) After extraction and backfill of Drifts 1, 3, and 5 (Step 2). (e) After extraction of Drifts 8, 10, and 12 (Step 11). (f) After extraction and backfilling of Drift 20 (last step).
Figure 5 shows displacement clouds after all extraction and backfill for models with spaced extraction under different roof protection layer thicknesses (as Figure 4 includes Scheme B, only Schemes D and F are shown). An analysis of Figure 4f and Figure 5a,b reveals that the maximum displacement sedimentation value generally occurs at the side of the roof protection layer near the footwall, regardless of the thickness of the roof protection layer. The maximum displacement sedimentation values under Schemes B, D, and F are 1.6, 1.38, and approximately 1.26 cm, respectively. It is seen that the maximum displacement sedimentation value monotonically decreases as the thickness of the roof protection layer increases, which indicates that increasing the thickness of this layer improves its stability. In addition, the displacement sedimentation value decreases by 0.22 cm when the thickness of the roof protection layer increases from 0.5 to 1 m, whereas increasing the thickness from 1 to 1.5 m decreases the displacement sedimentation value by only 0.12 cm, indicating that the decrease in amplitude of the displacement sedimentation value begins to decline when the thickness of the roof protection layer is increased to 1 m.
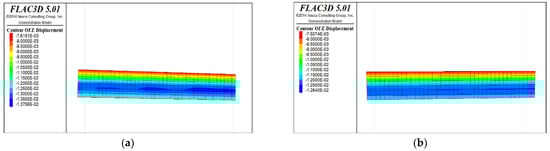
Figure 5.
Z-direction displacement cloud pictures (plan views) of the roof protection layer after the completion of extraction and backfilling under Schemes D and F. (a) Scheme D. (b) Scheme F.
5.4.2. Analysis of Plastic Zone
(1) Distribution characteristics of the plastic zones in the roof protection layer under different extraction sequences
Table 6, Table 7, Table 8 and Table 9 list the evolution rules of the plastic zones in the roof protection layer during different periods under Schemes C and D with a roof protection layer thickness of 1 m. Note that the green, red and light blue colors indicate the plastic zones in each figure.
Table 6.
Distributions of roof protection layer plastic zones under Schemes C and D (excavation stages 1 and 2).
Table 7.
Distributions of roof protection layer plastic zones under Schemes C and D (excavation stages 3 and 4).
Table 8.
Distributions of roof protection layer plastic zones under Schemes C and D (excavation stages 5 and 6).
Table 9.
Distributions of roof protection layer plastic zones under Schemes C and D (excavation stages 7 and 8).
① Analysis of the plastic zones in the roof protection layer at each stage of Scheme C revealed the following: because one side of the drift was an isolated pillar and the other side was loose tailings backfill during mining, there was a plastic zone at the beginning stage; as the excavation and backfill continued, the plastic zones accumulated, with the plastic zones of the roof protection layer following an overall trend of steady growth as the excavation and backfill proceeded. Eventually, the failure range of the plastic zones of the roof protection layer accounted for 9.8% of the overall roof protection layer.
② The changes in the plastic zones of the roof protection layer during each stage under Scheme D revealed that the roof protection layer did not undergo failure during the mining of the odd-numbered drifts; at the same time, the plastic zones of the roof protection layer began to increase during the extraction of the even-numbered drifts. Ultimately, the plastic zones of the roof protection layer under Scheme D accounted for 4.7% of the overall roof protection layer. These results can be explained as follows. The odd-numbered drifts were bordered on each side by harder isolated pillars featuring ore bodies that could effectively support the roof protection layer during mining through a reasonable choice of drift size. The even-numbered drifts, by contrast, were bordered by loose tailings backfill, leading to the growth of roof protection layer plastic zones during mining.
③ Comprehensive analysis of Schemes C and D revealed significant differences between the two in terms of the percentage of plastic zones, with the former producing a higher final percentage than the latter. Although both sides of the pillar comprised relatively loose tailings backfills during drifts extraction in the later period under Scheme D, the plastic zones in the roof protection layer could be effectively controlled in the early stage of extraction, enhancing the overall stability of the layer in the later stage. By contrast, even when the strip-by-strip extraction process was applied under Scheme A, some plastic zones still appeared in the early stage of mining, resulting in the accumulation of plastic zones in the later extraction process and reducing the overall protection of the roof protection layer.
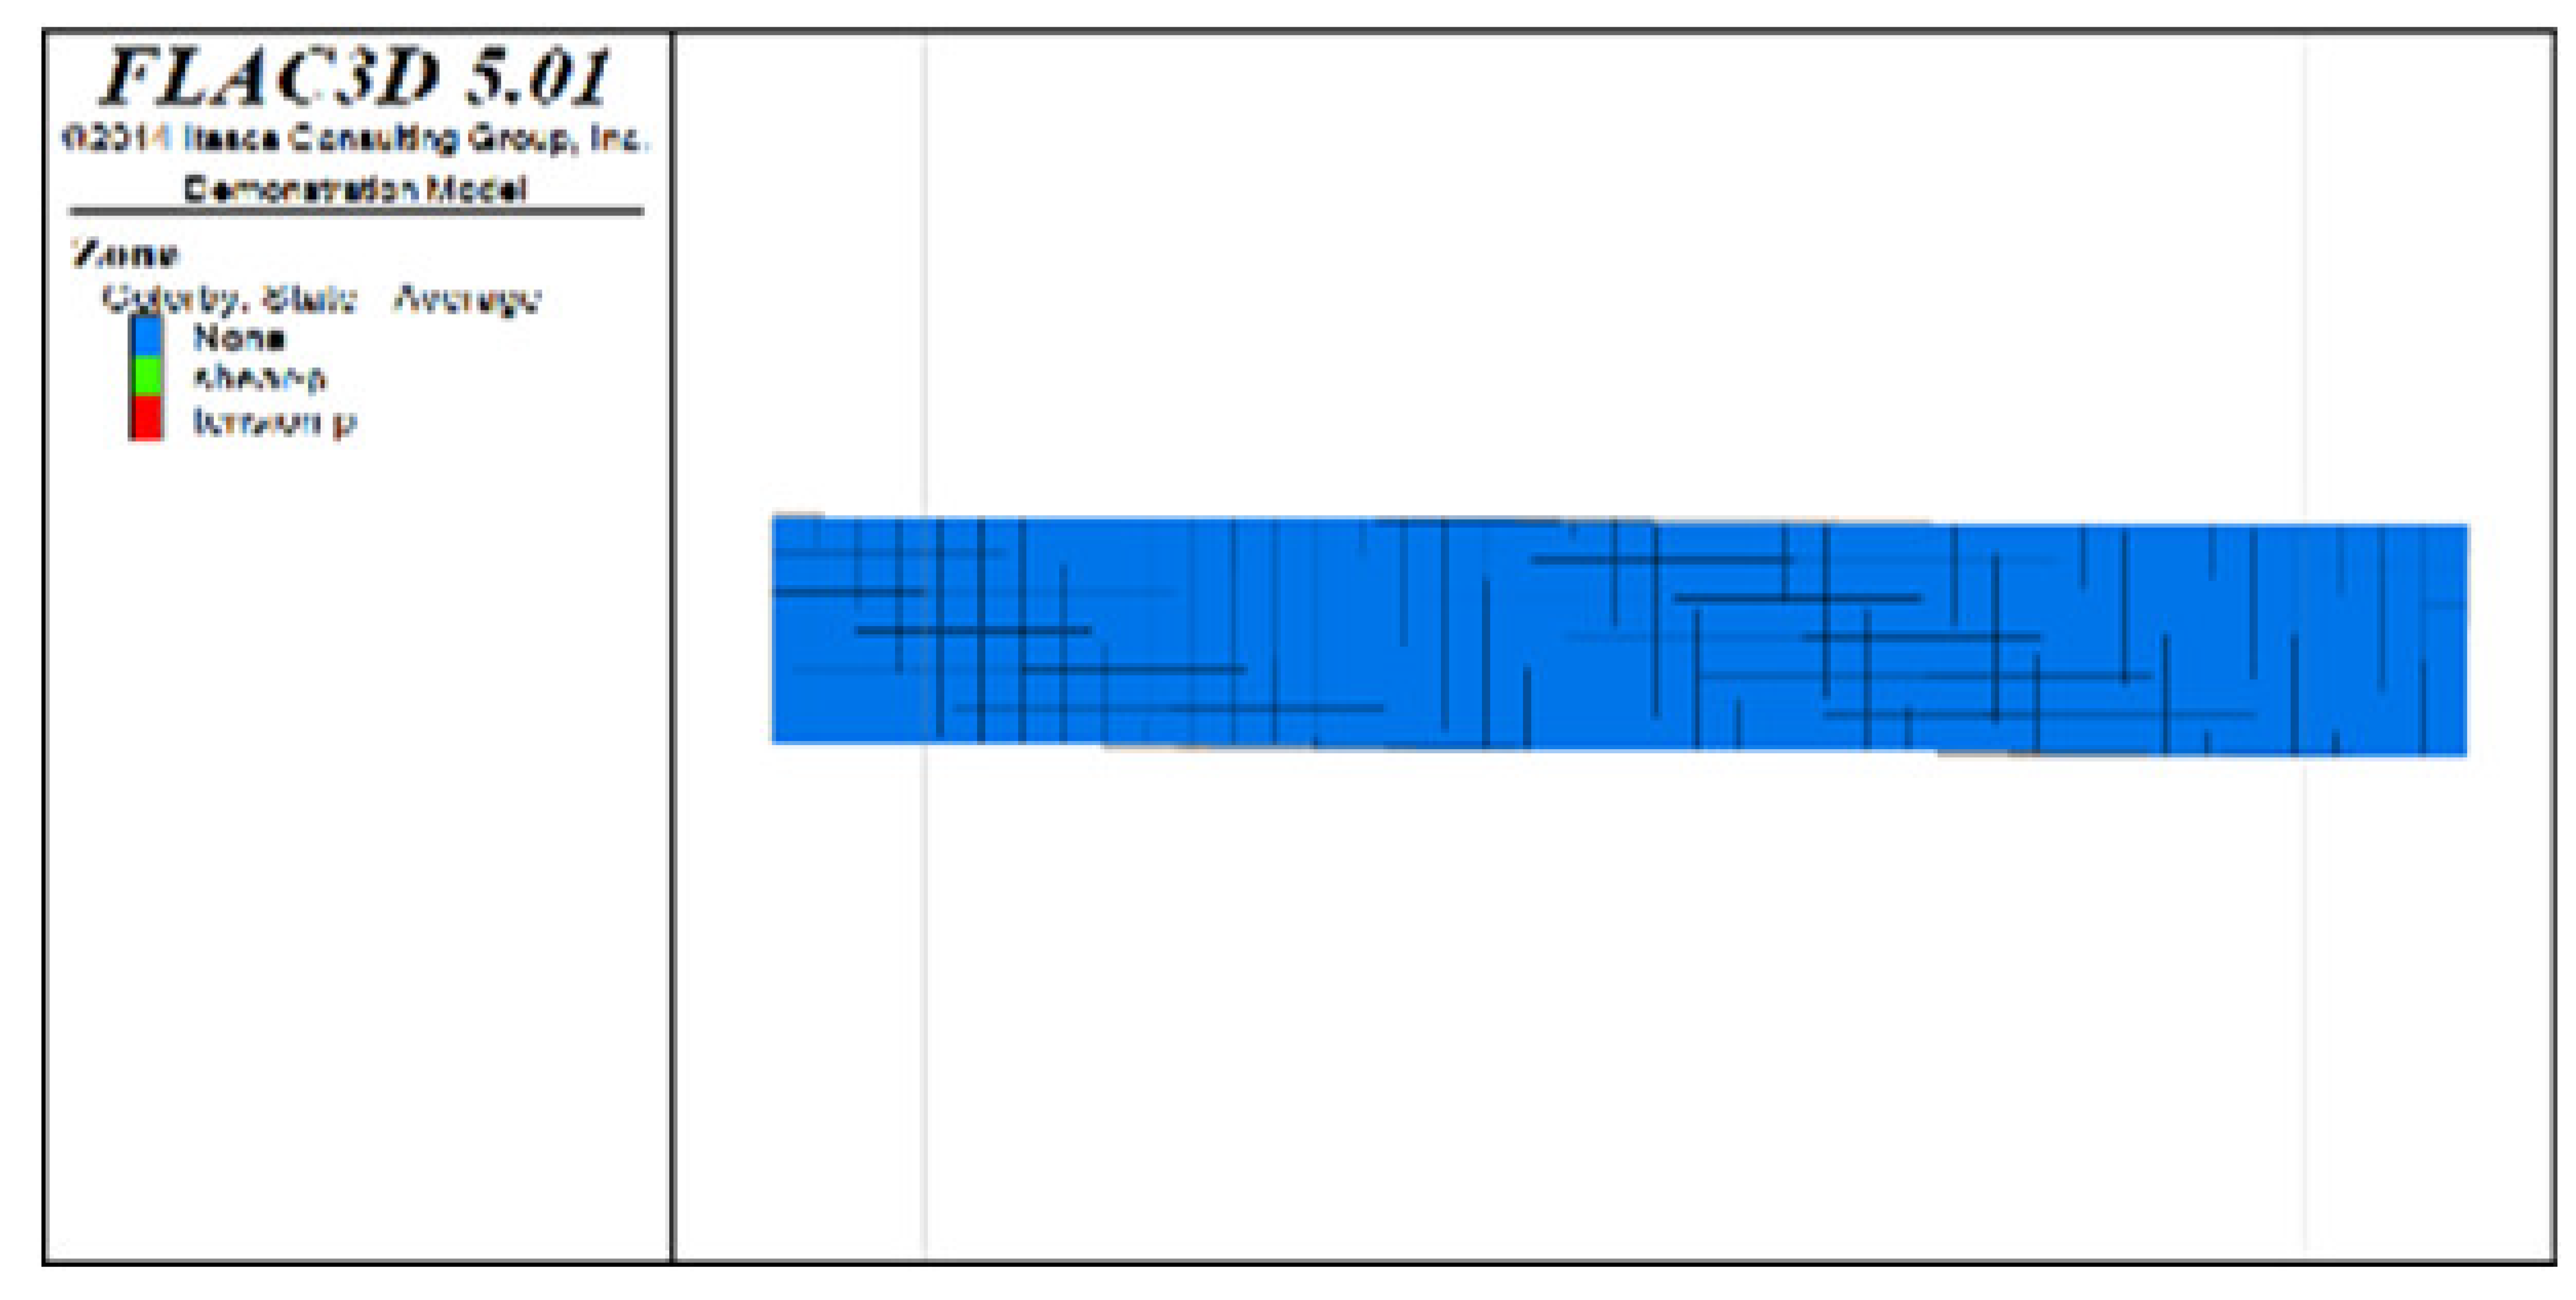
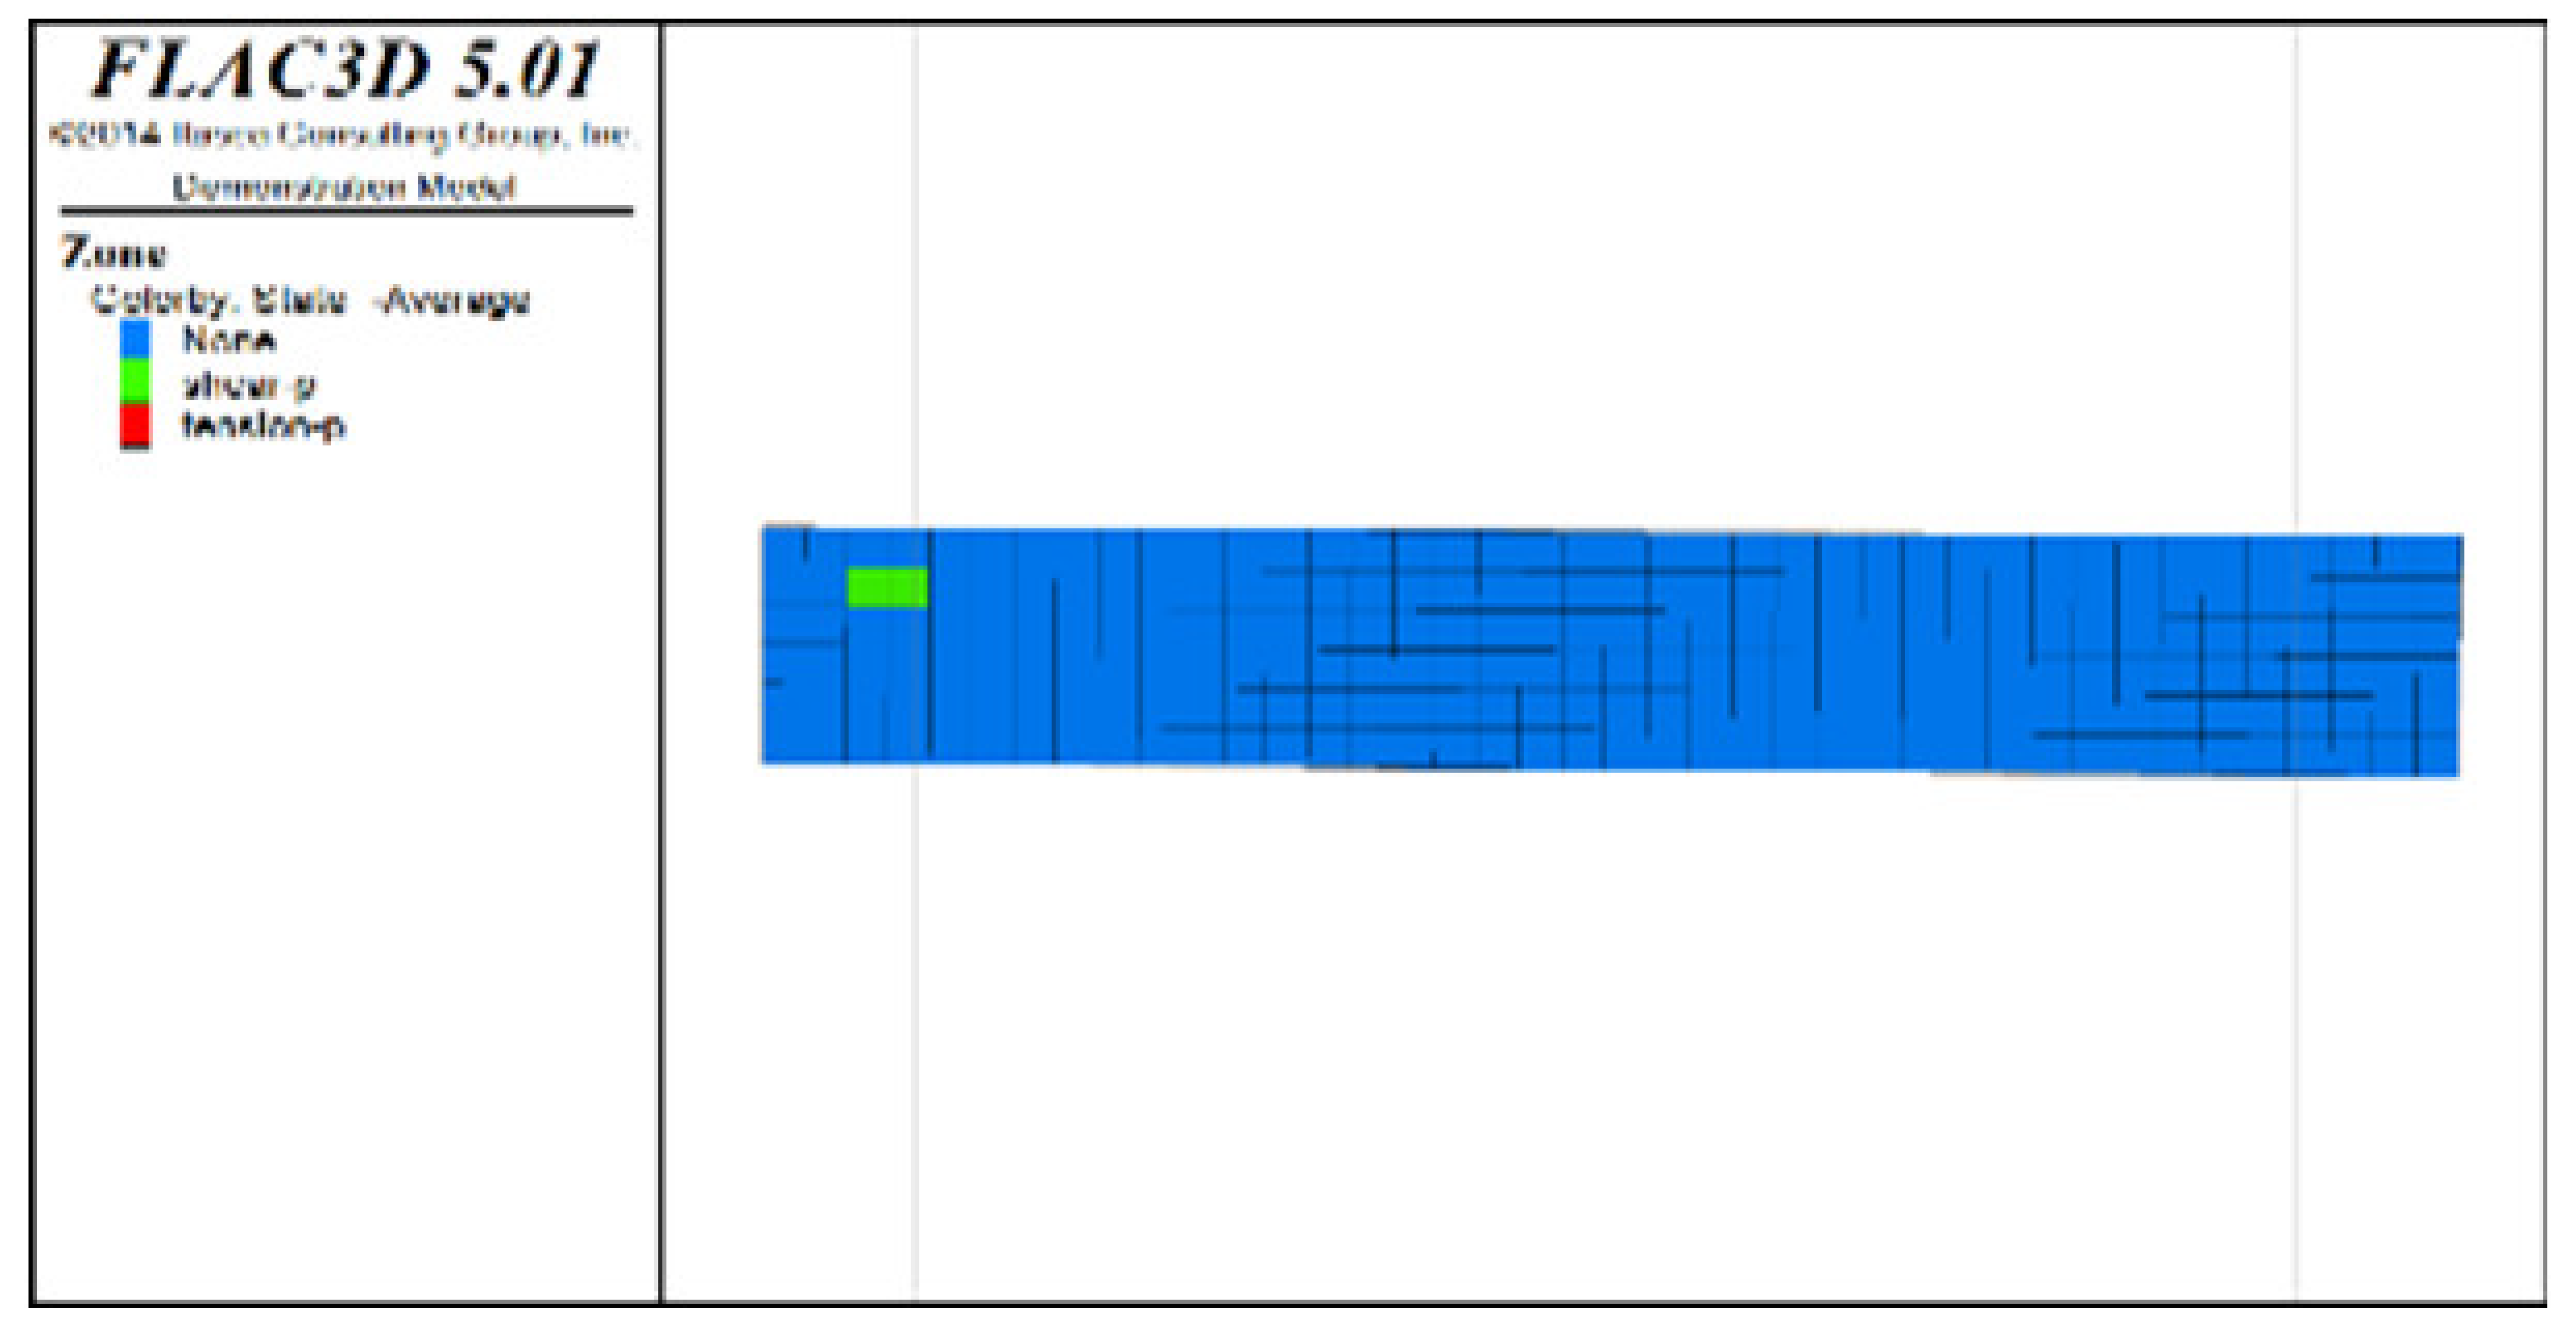
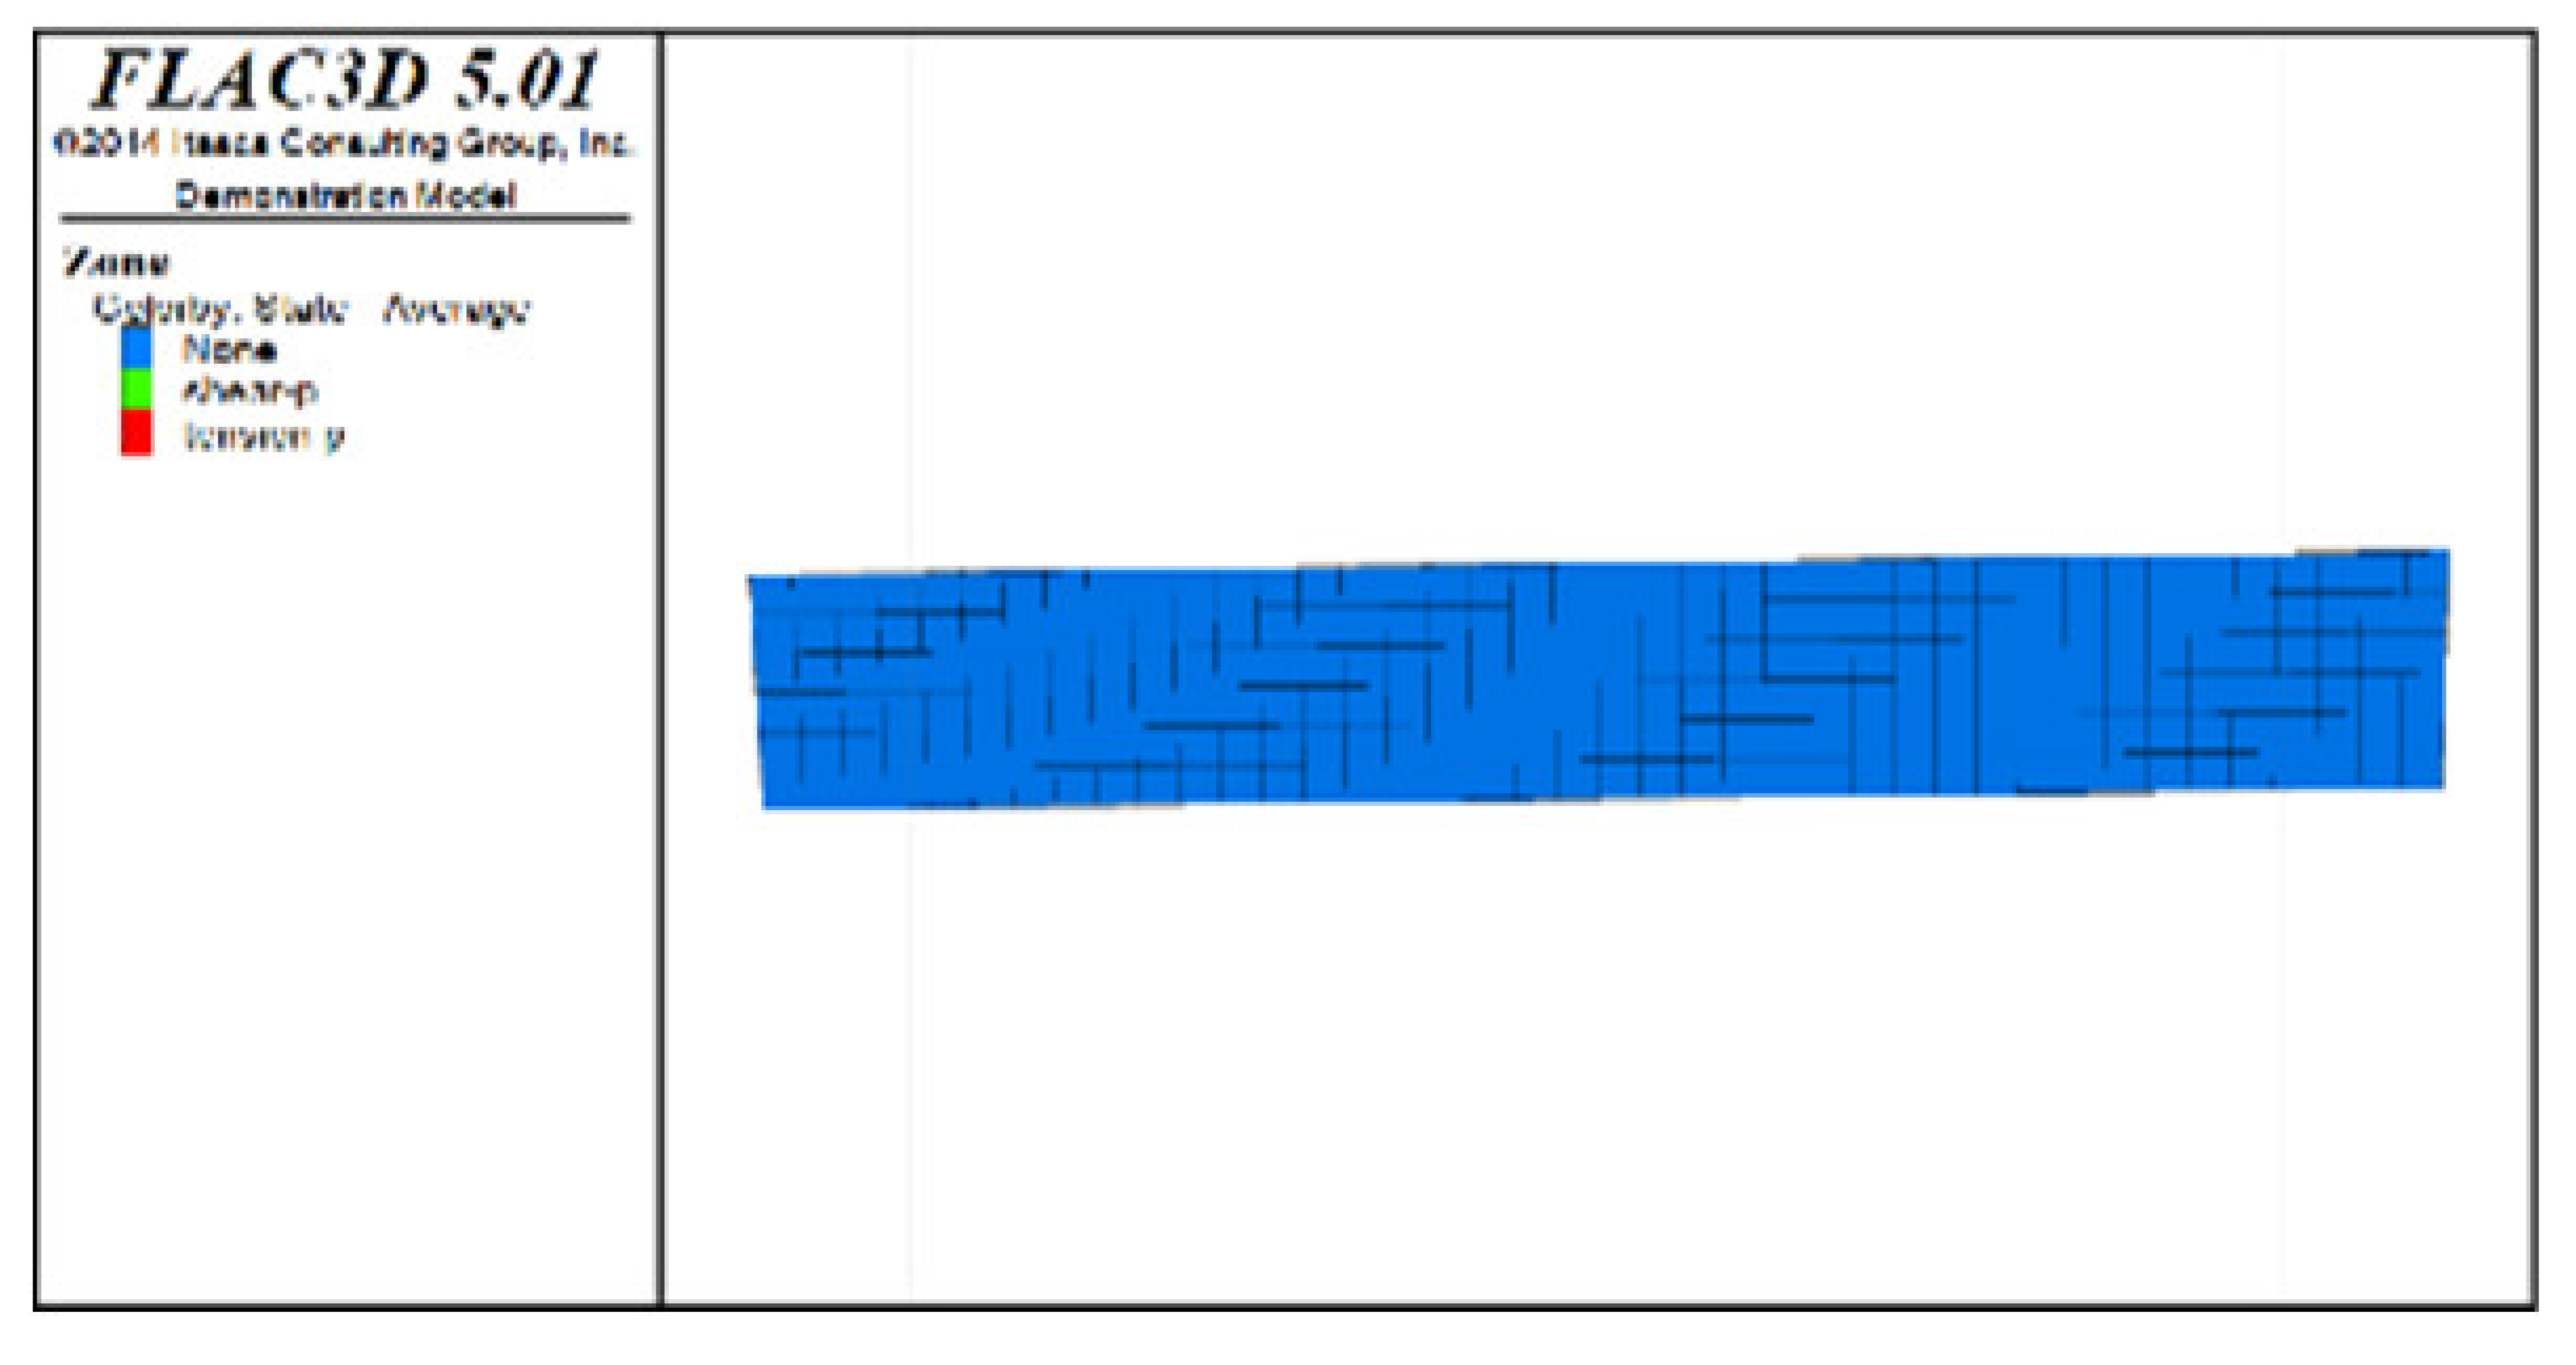
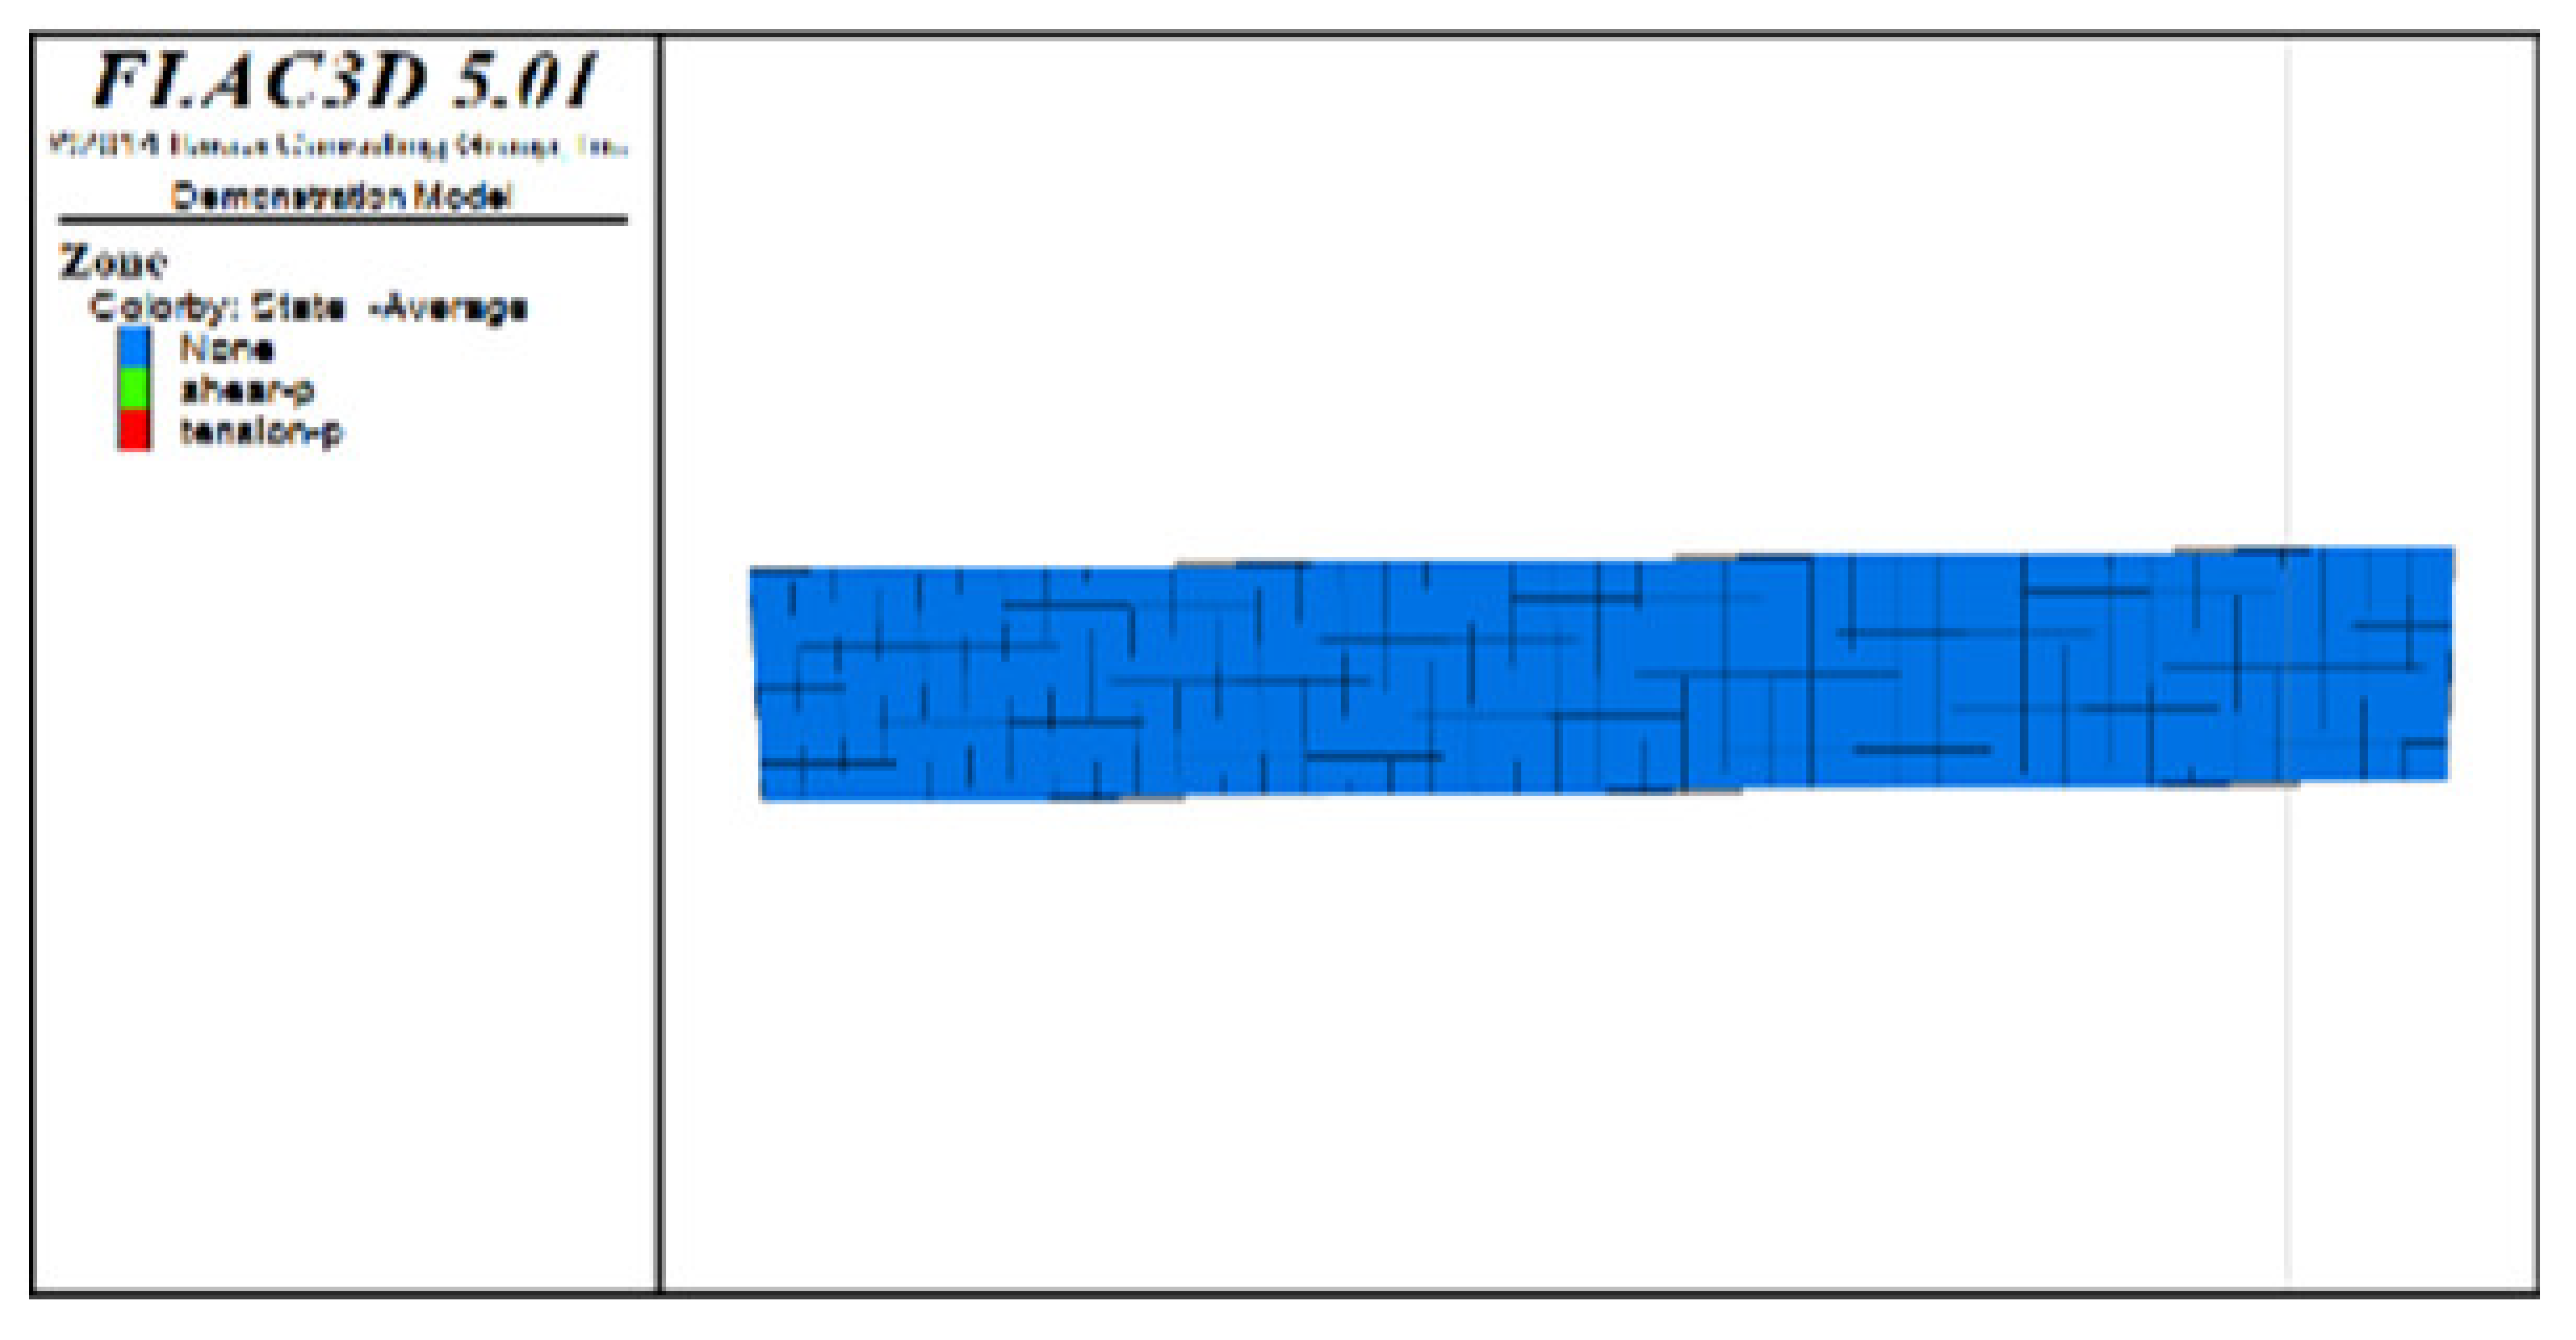
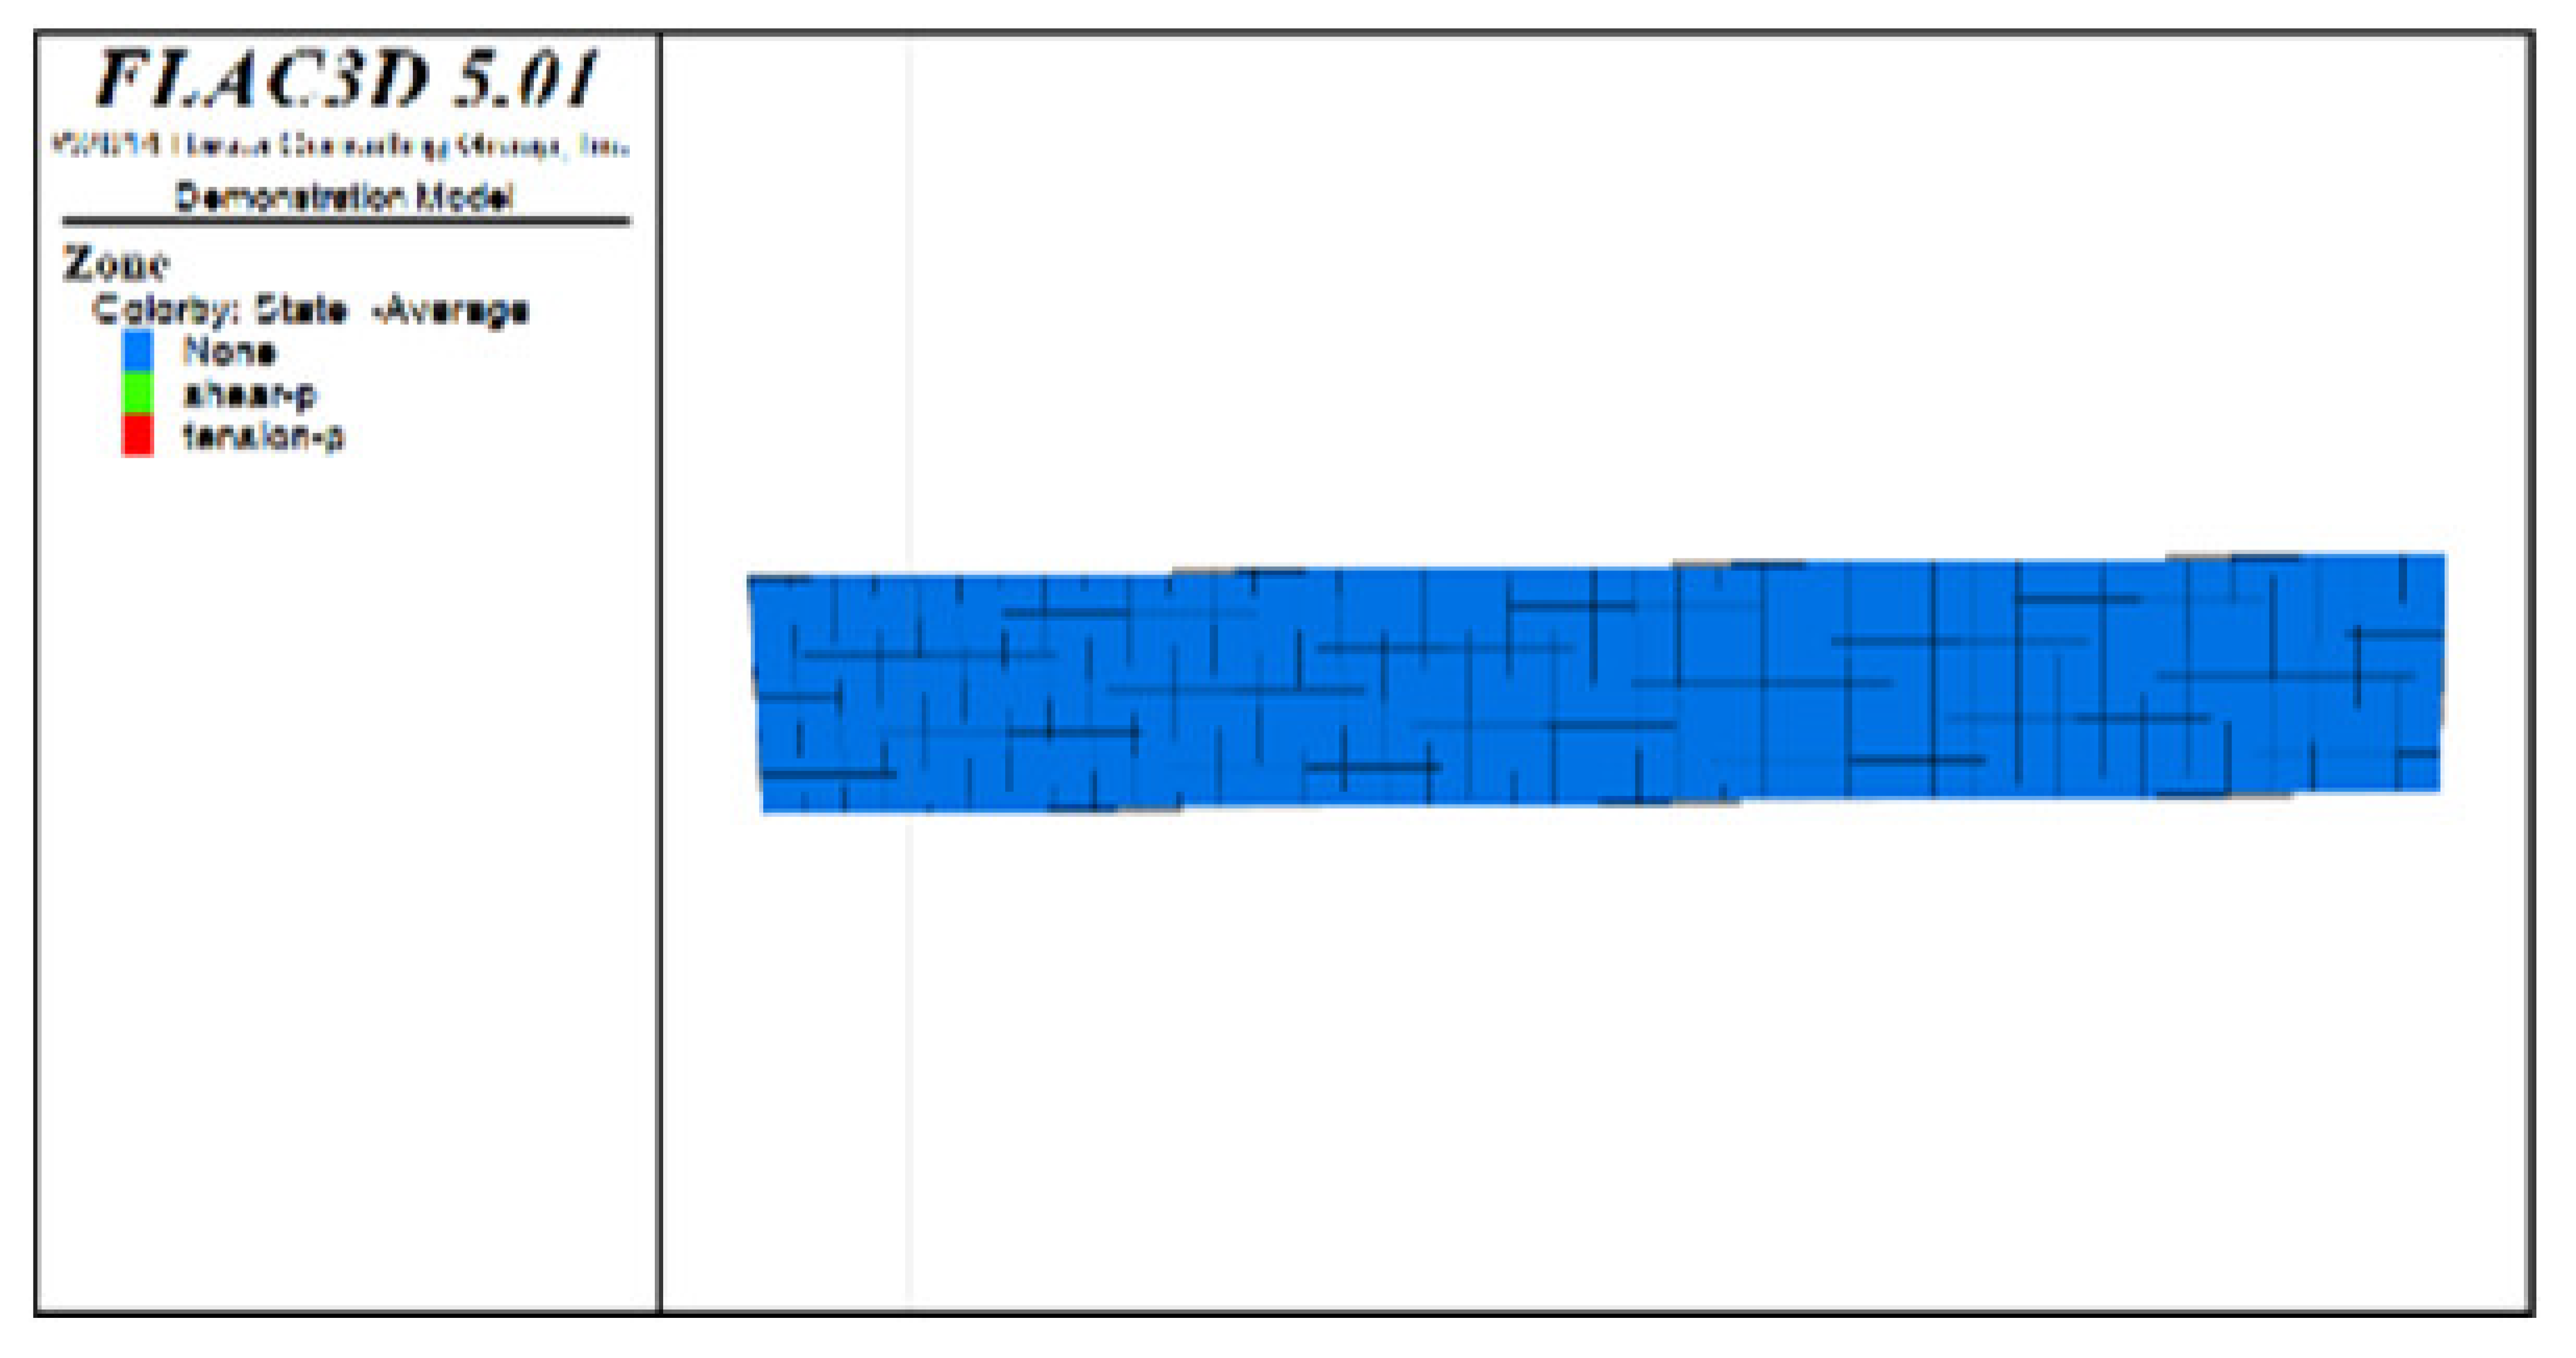
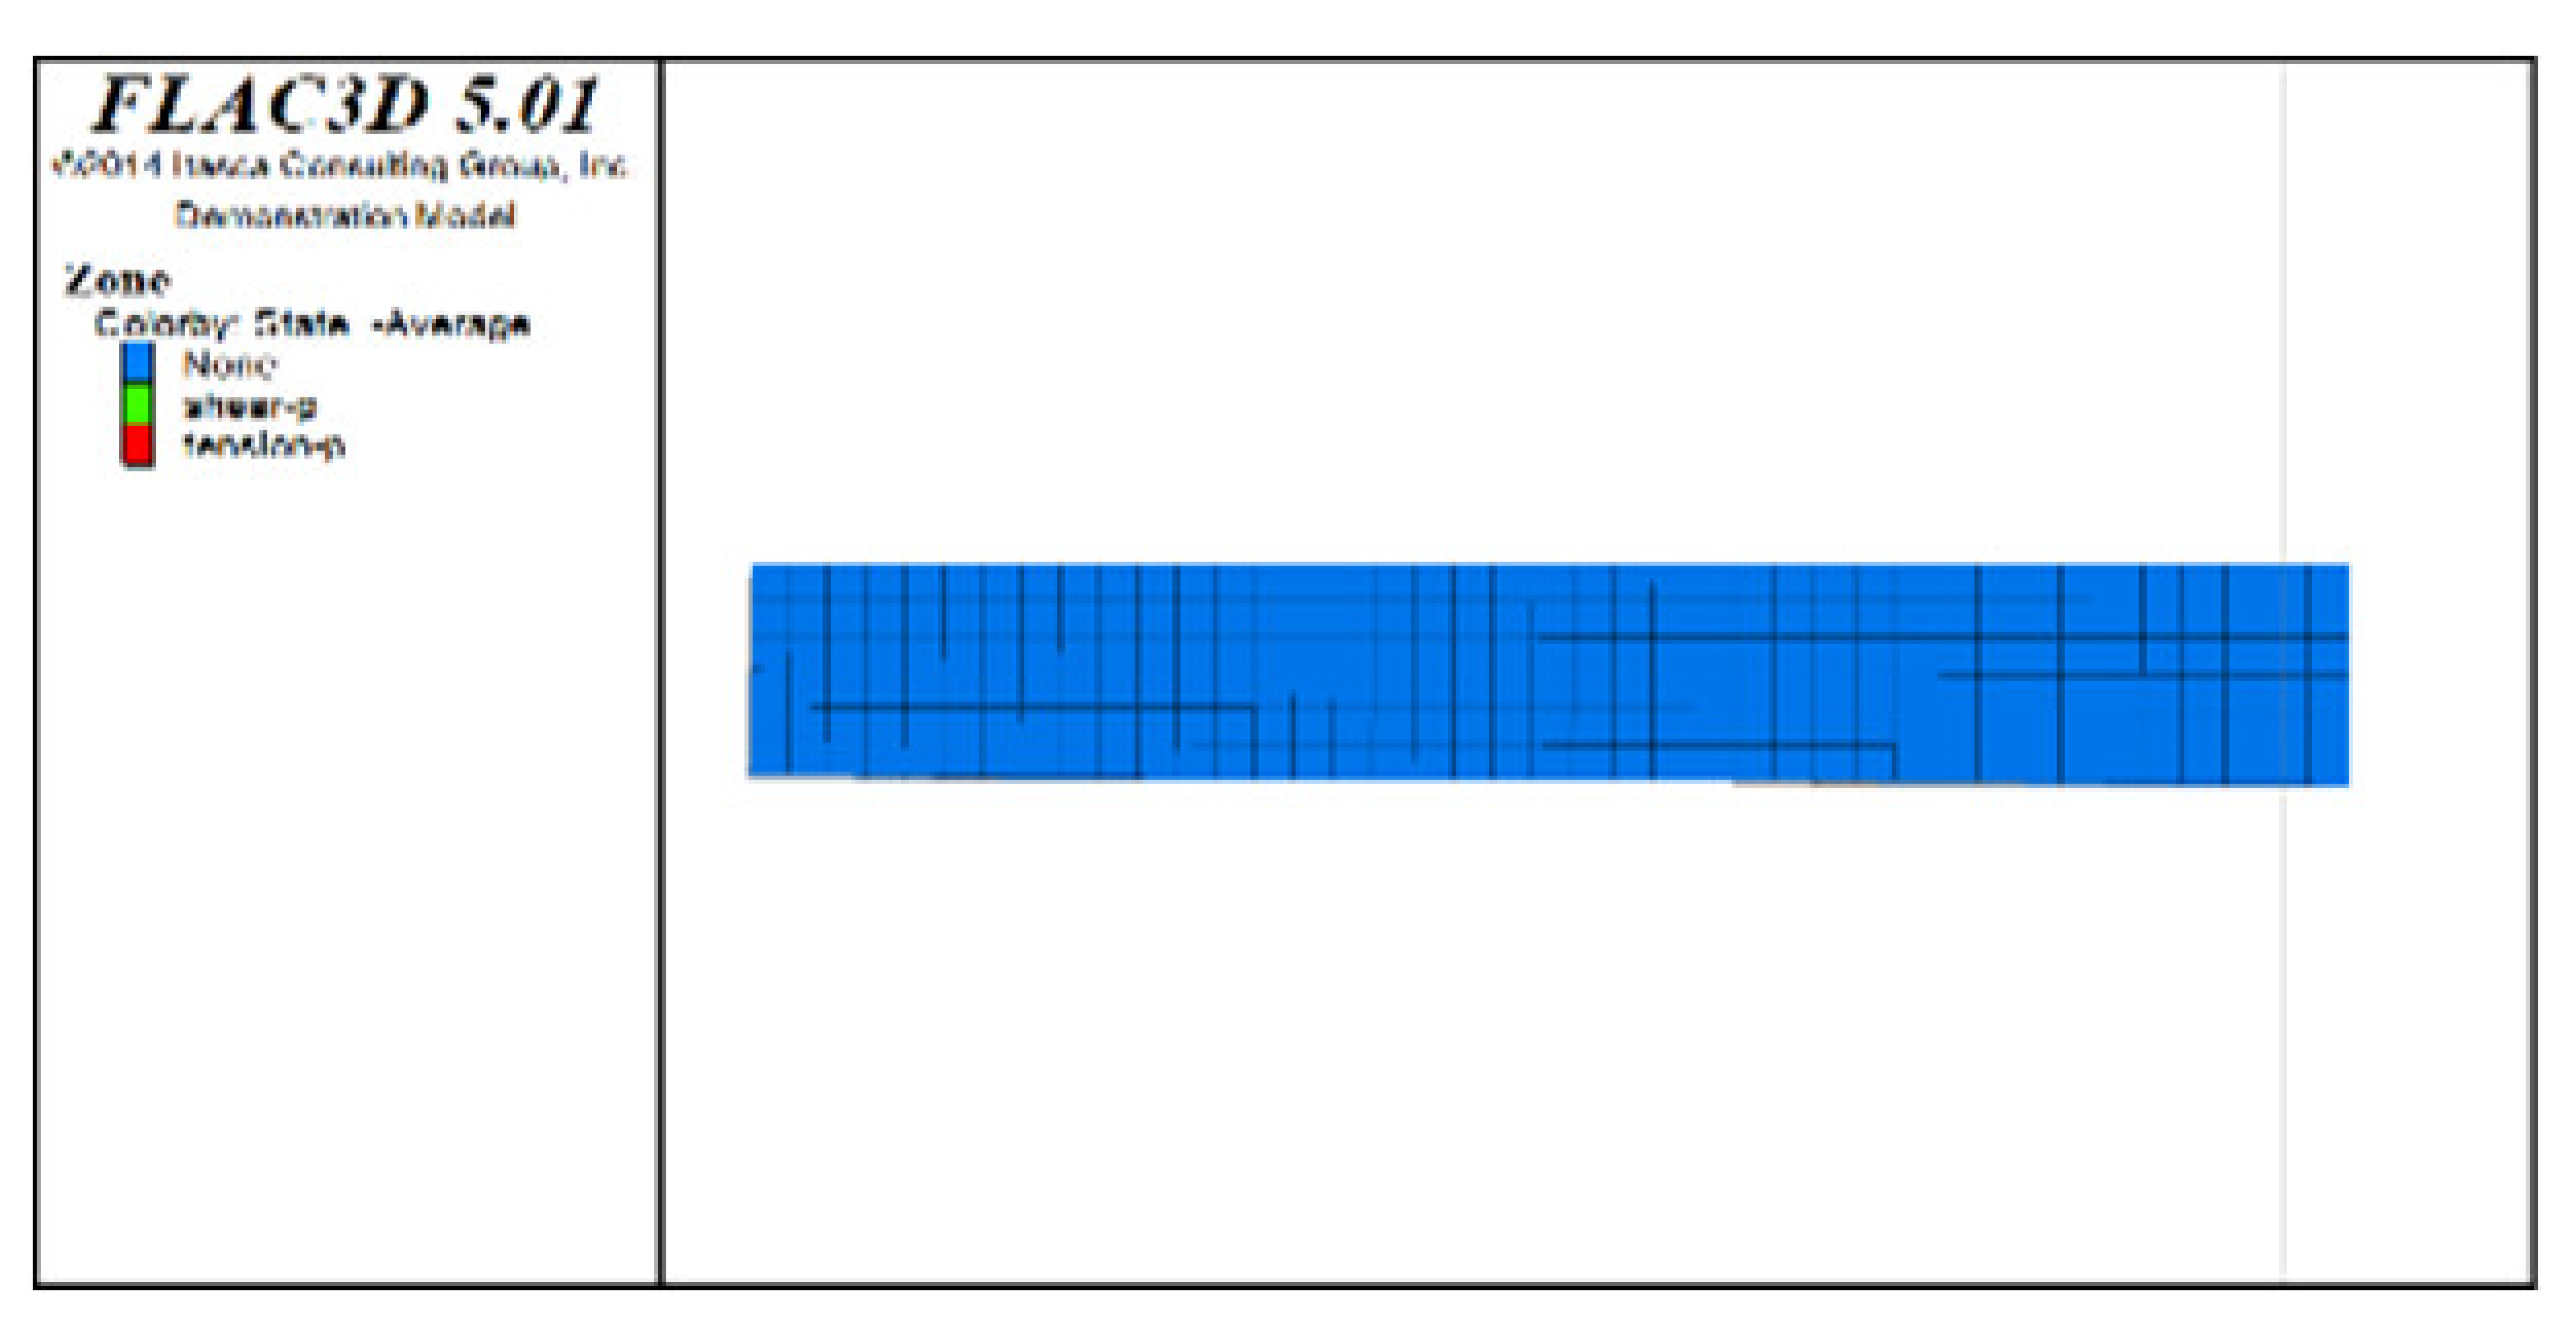
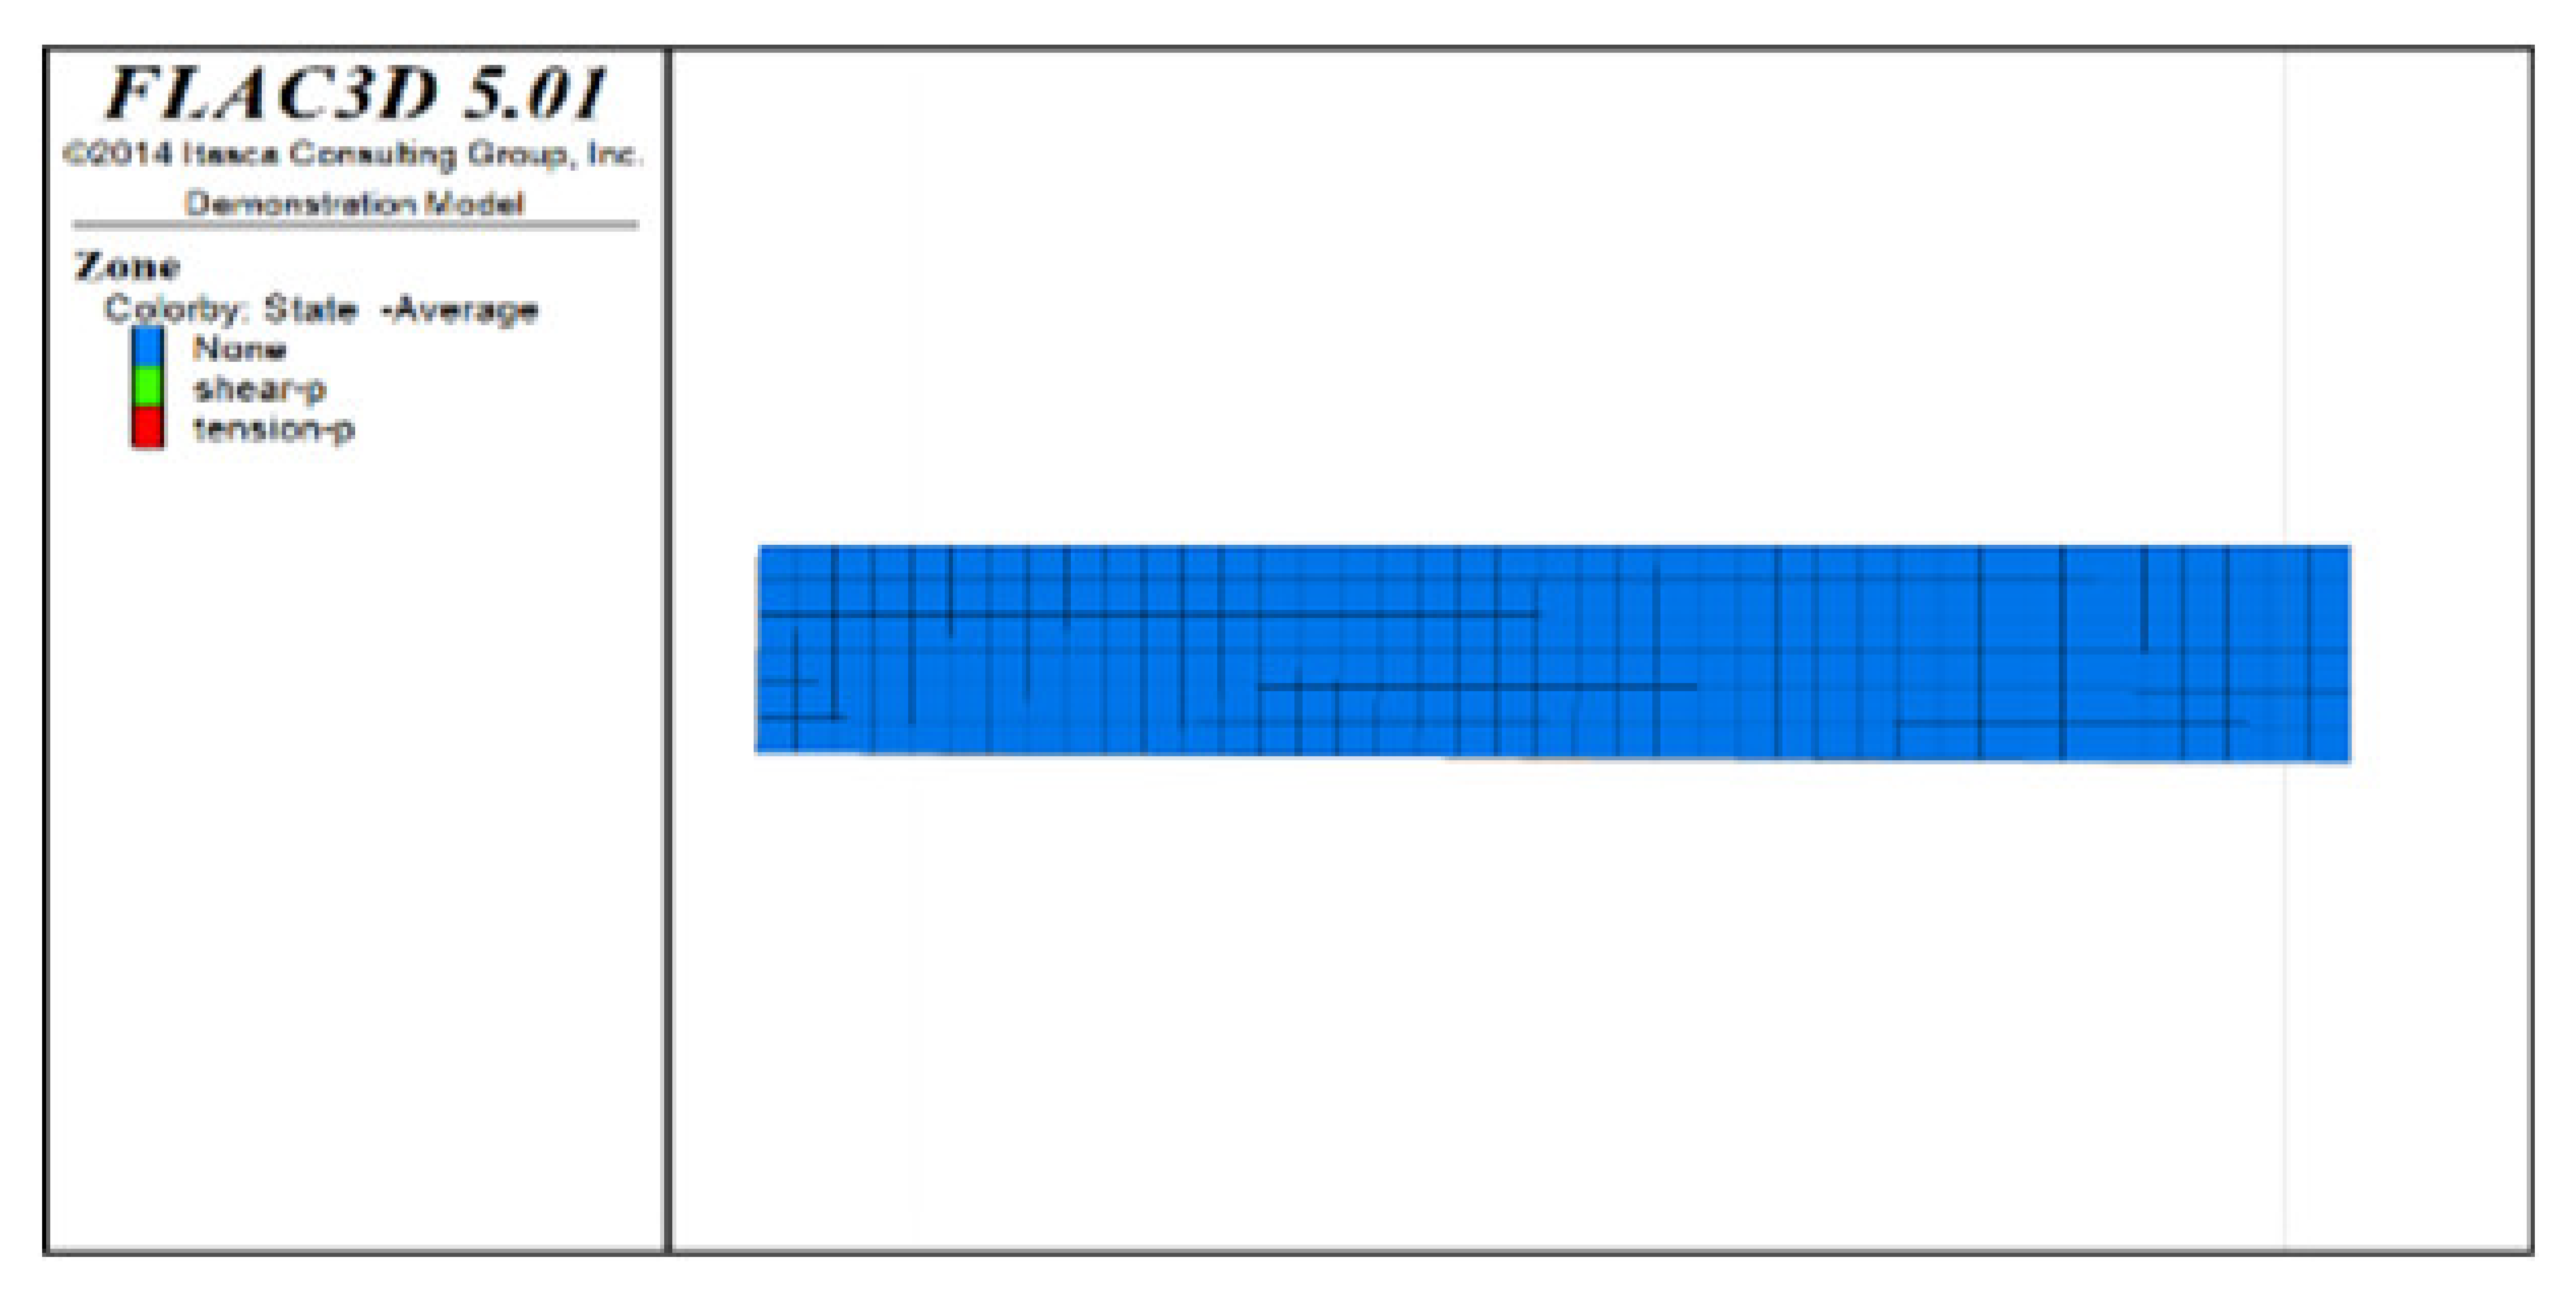
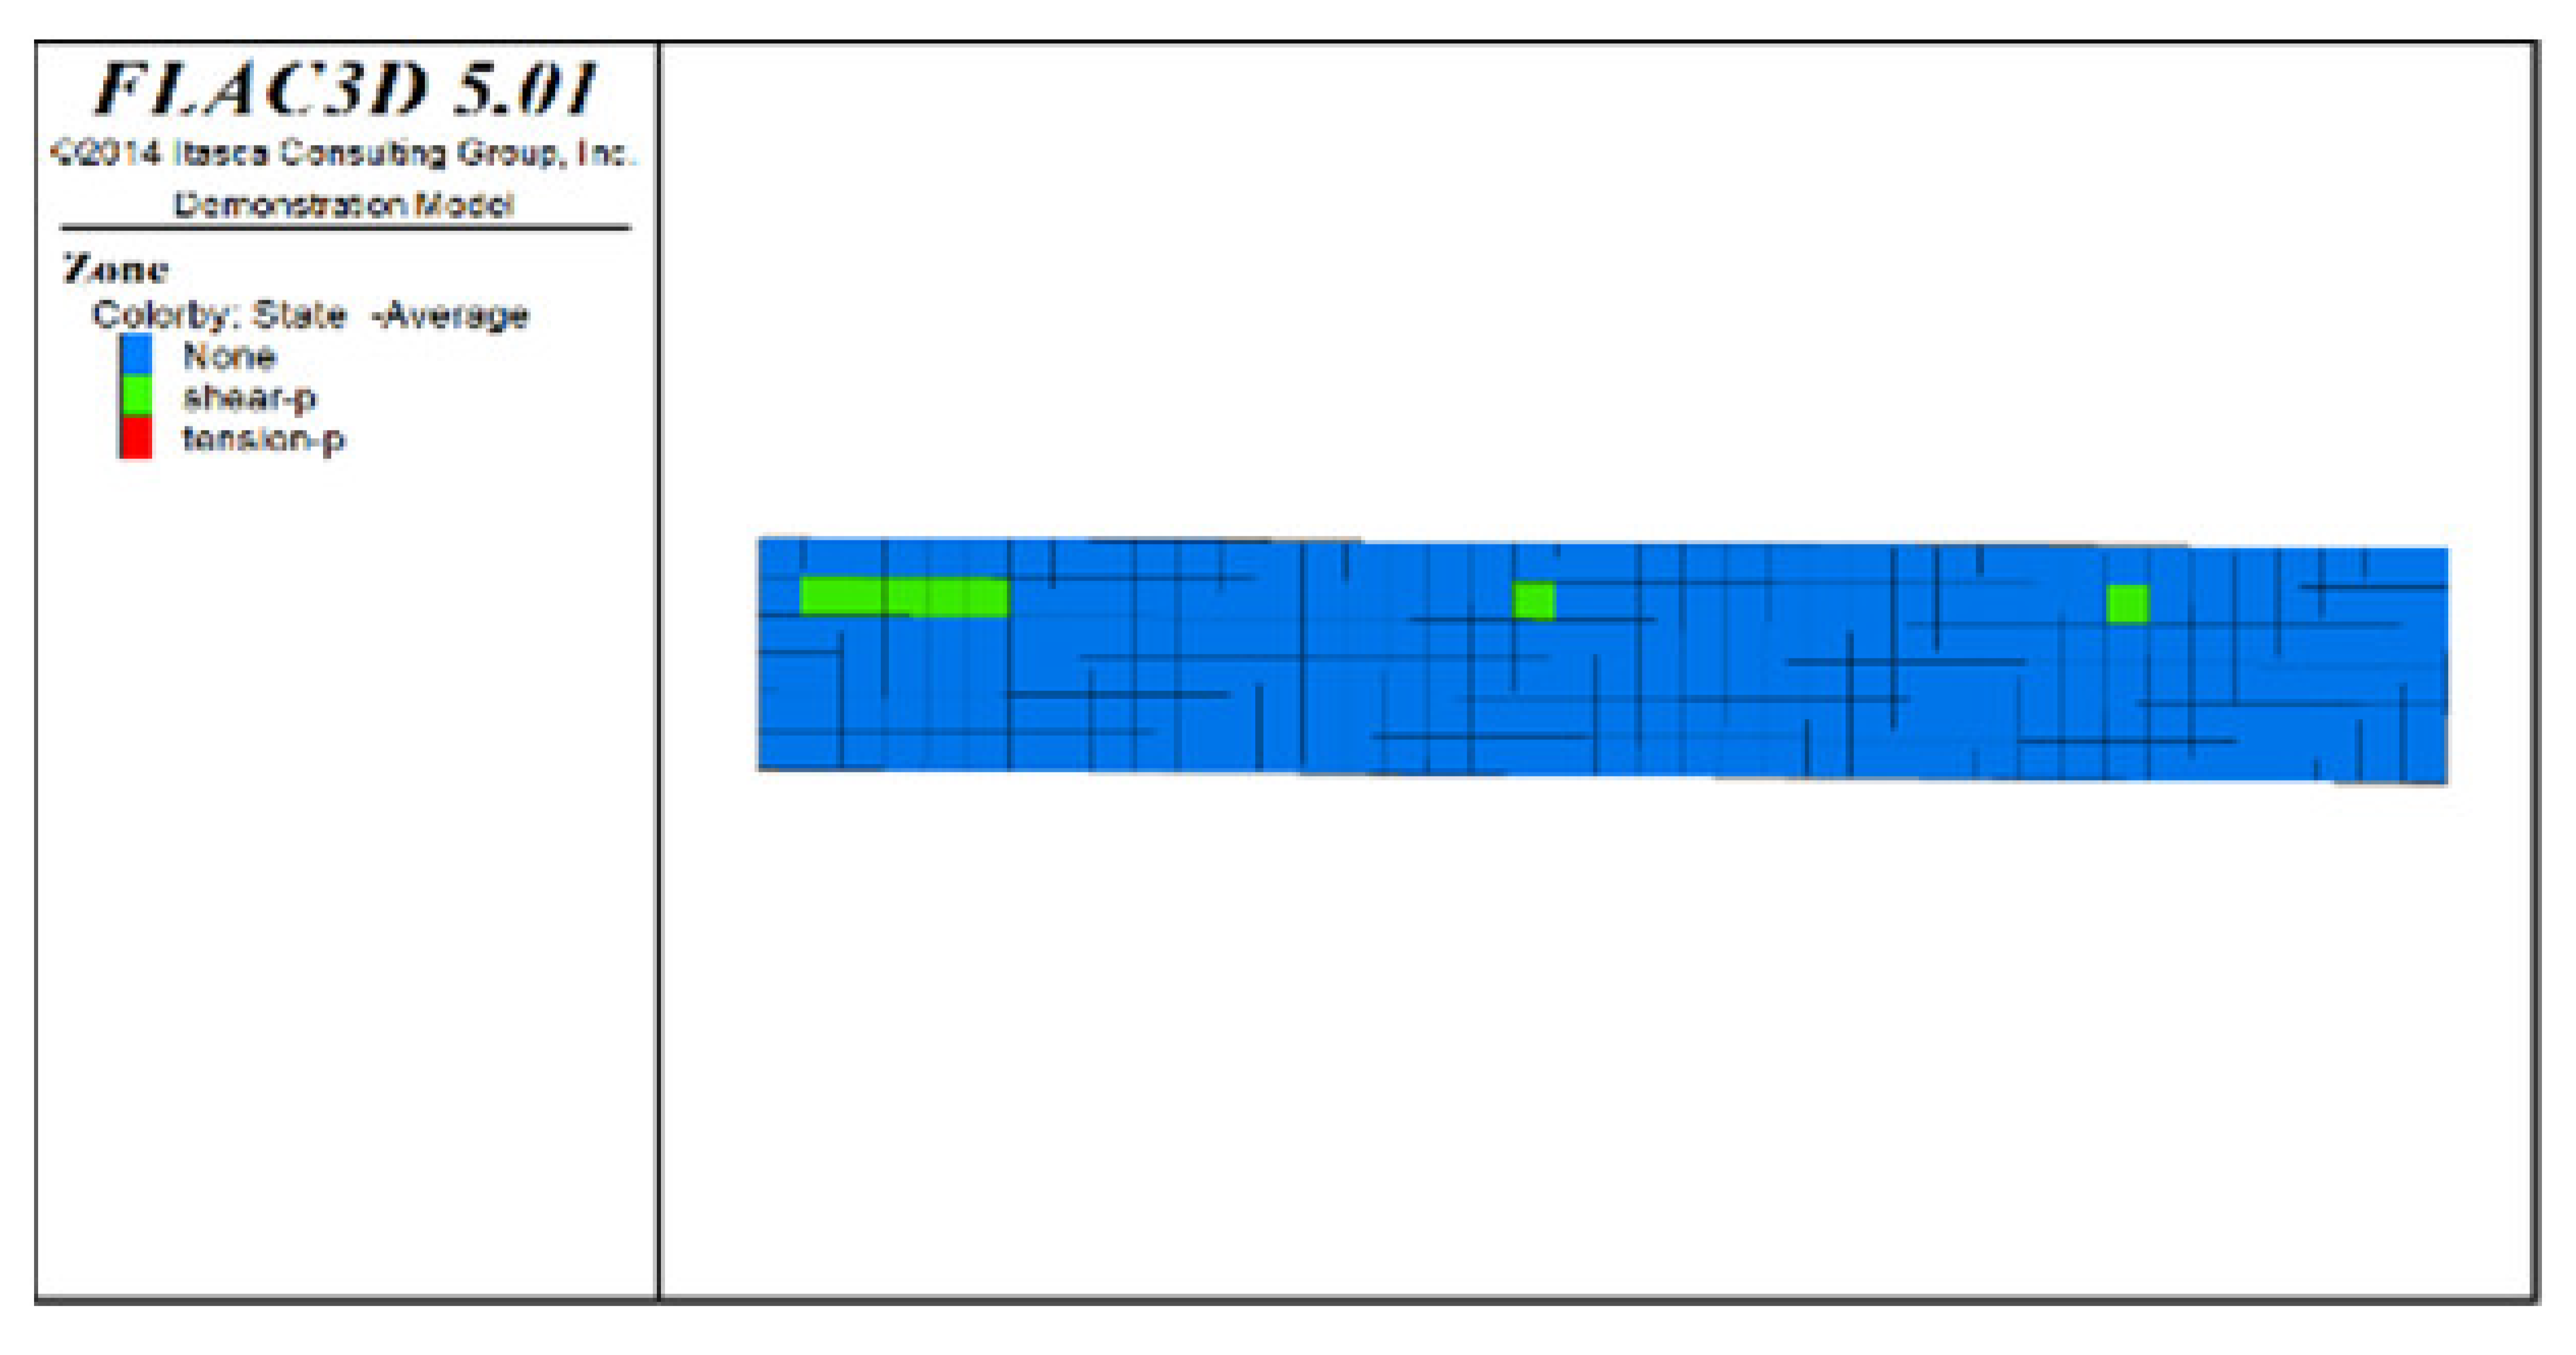
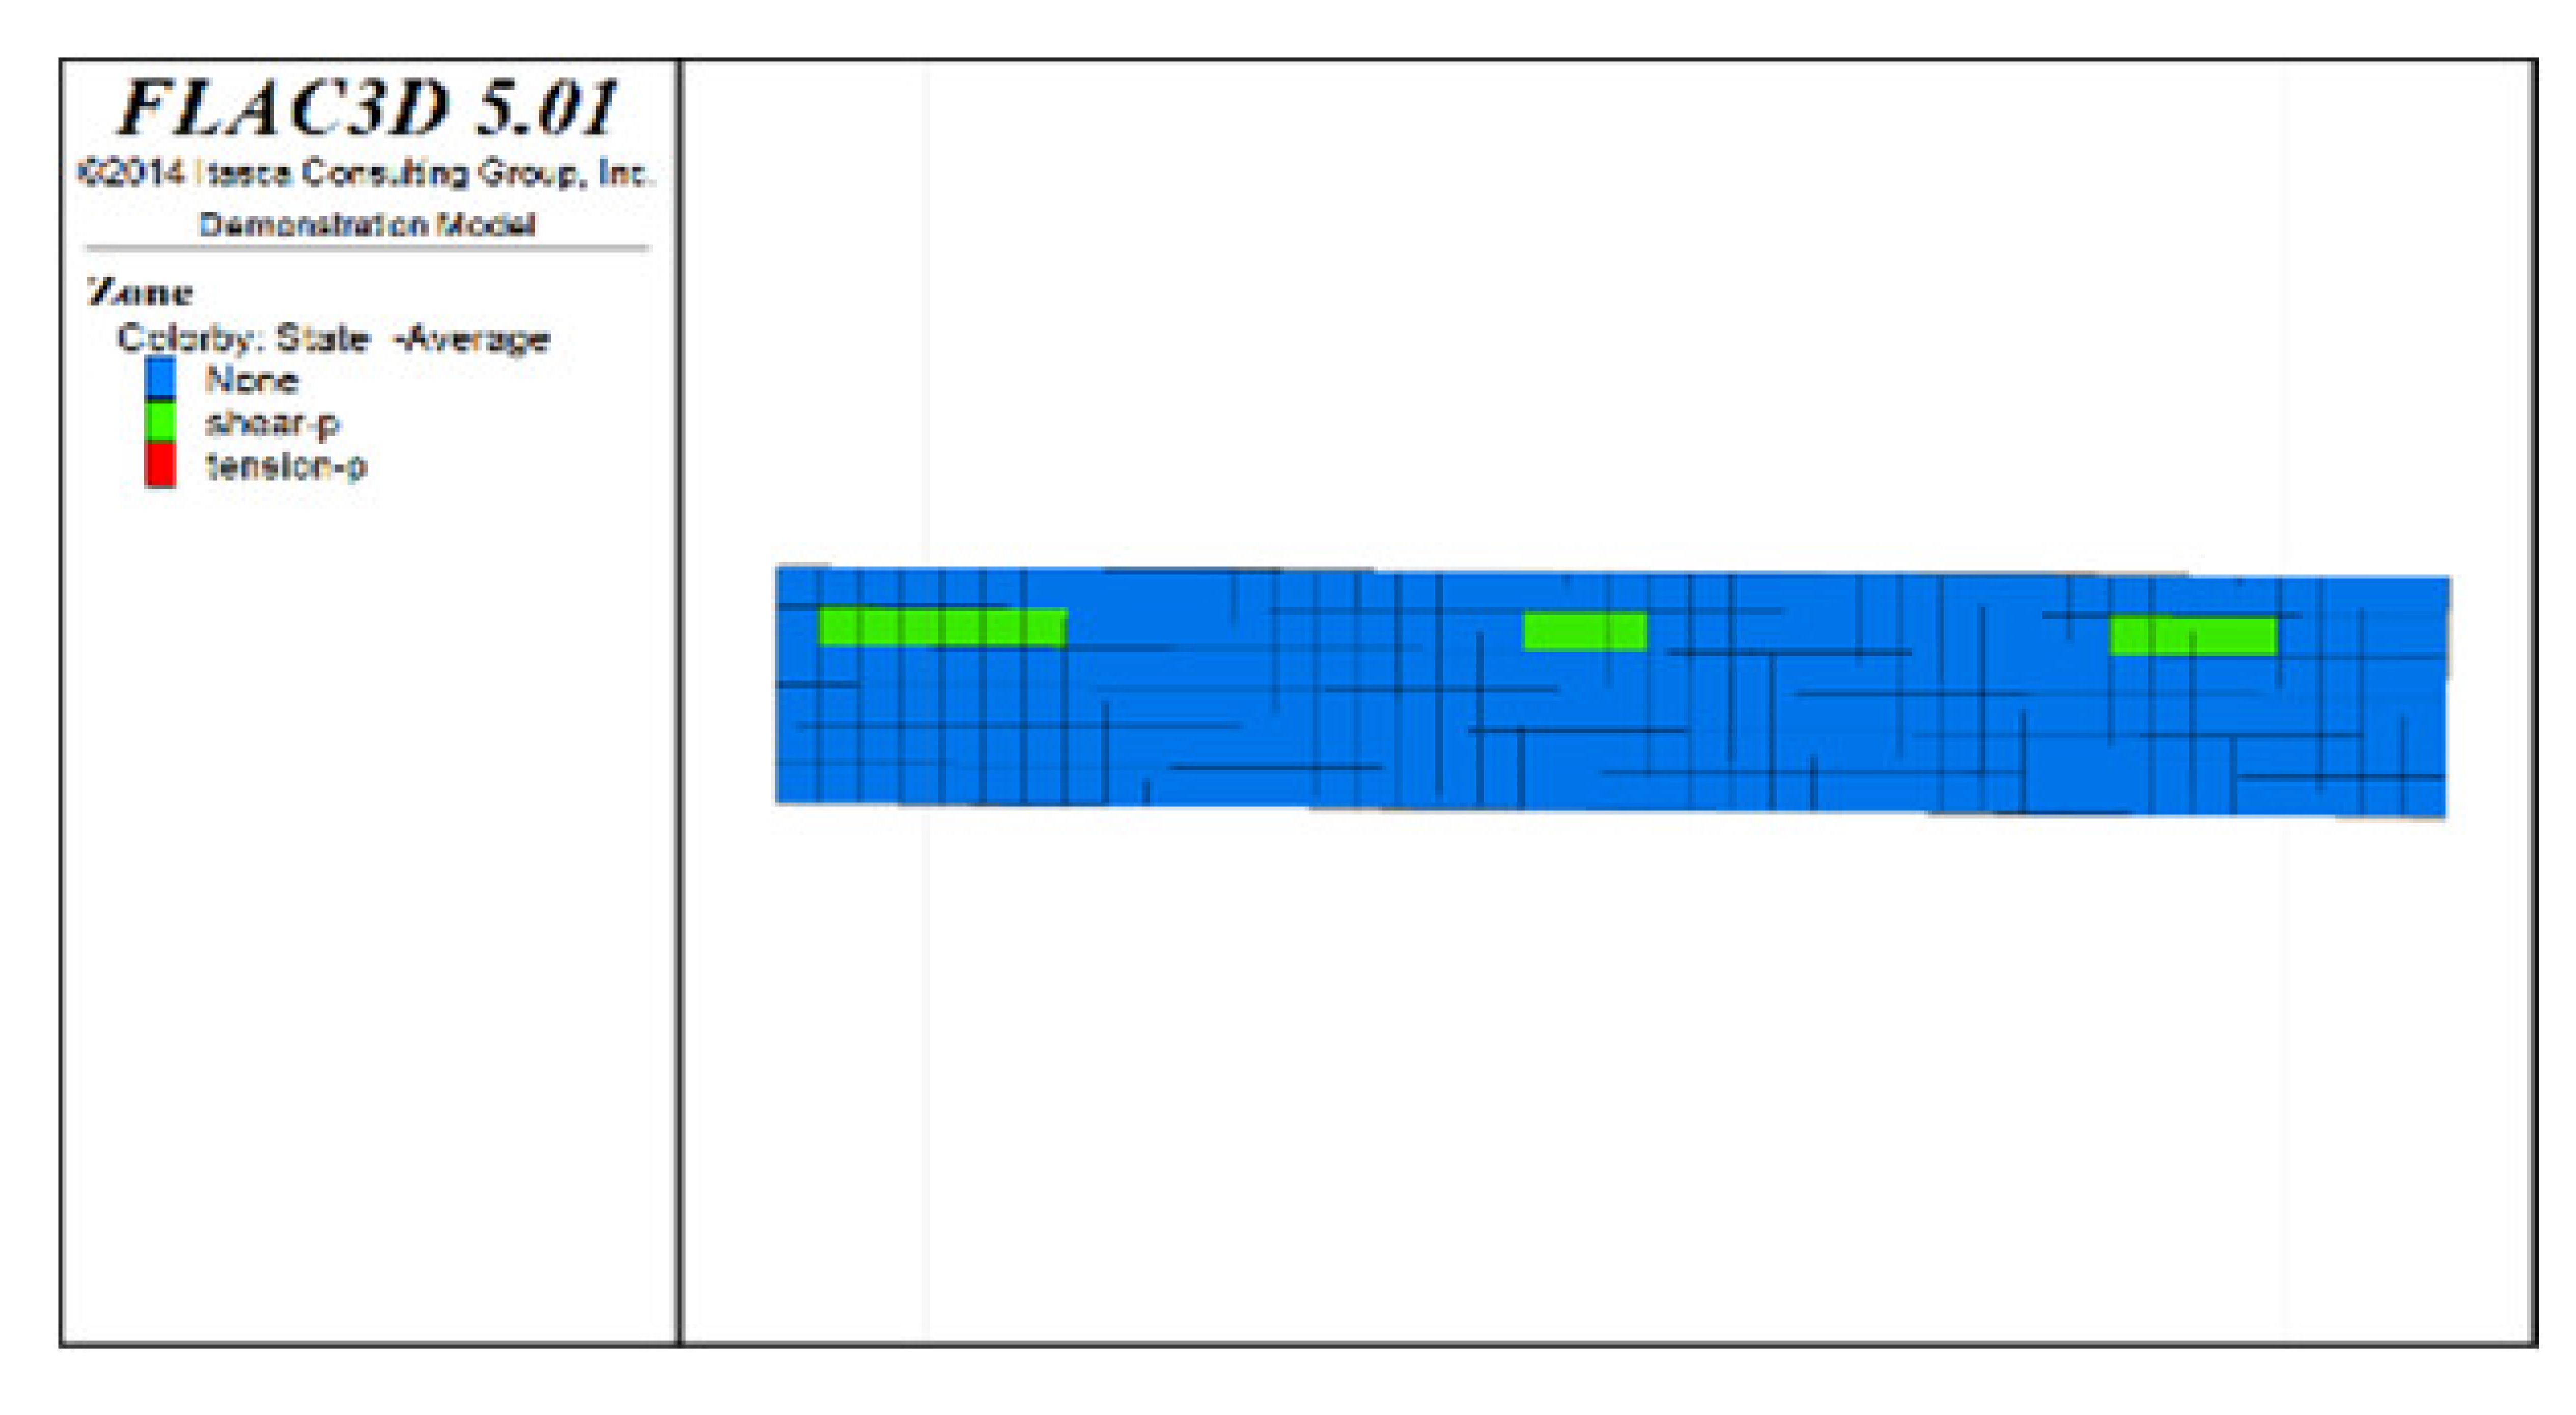
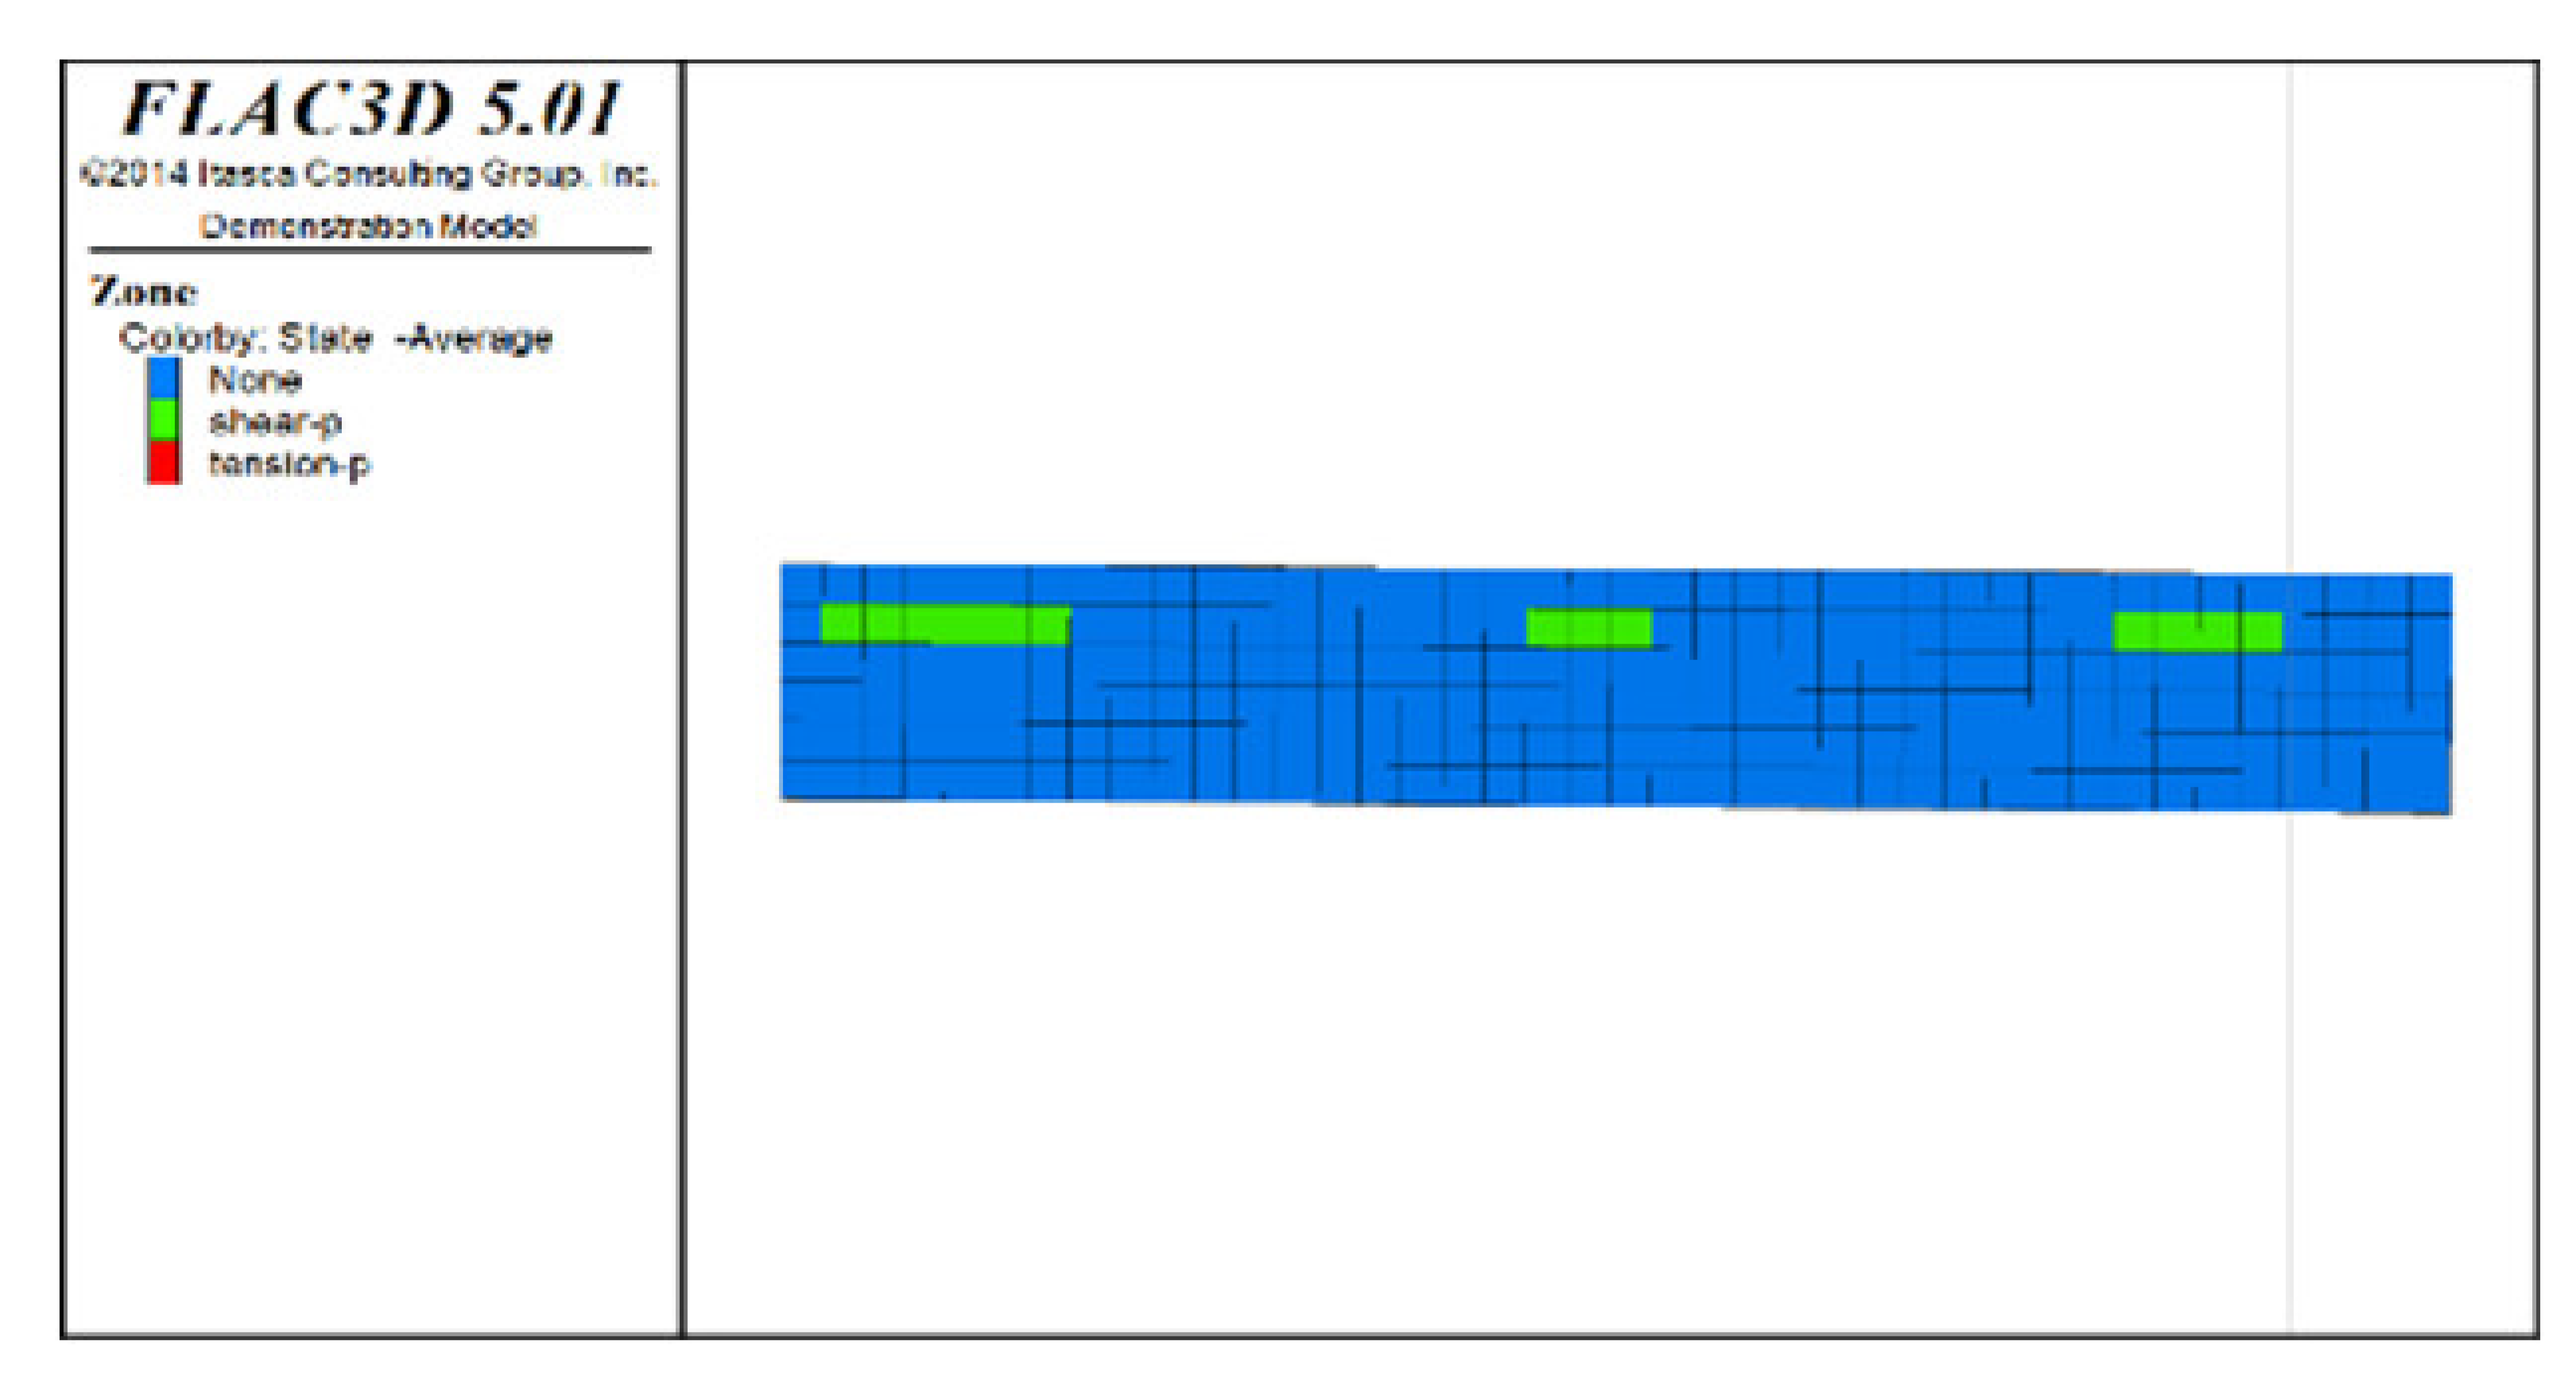
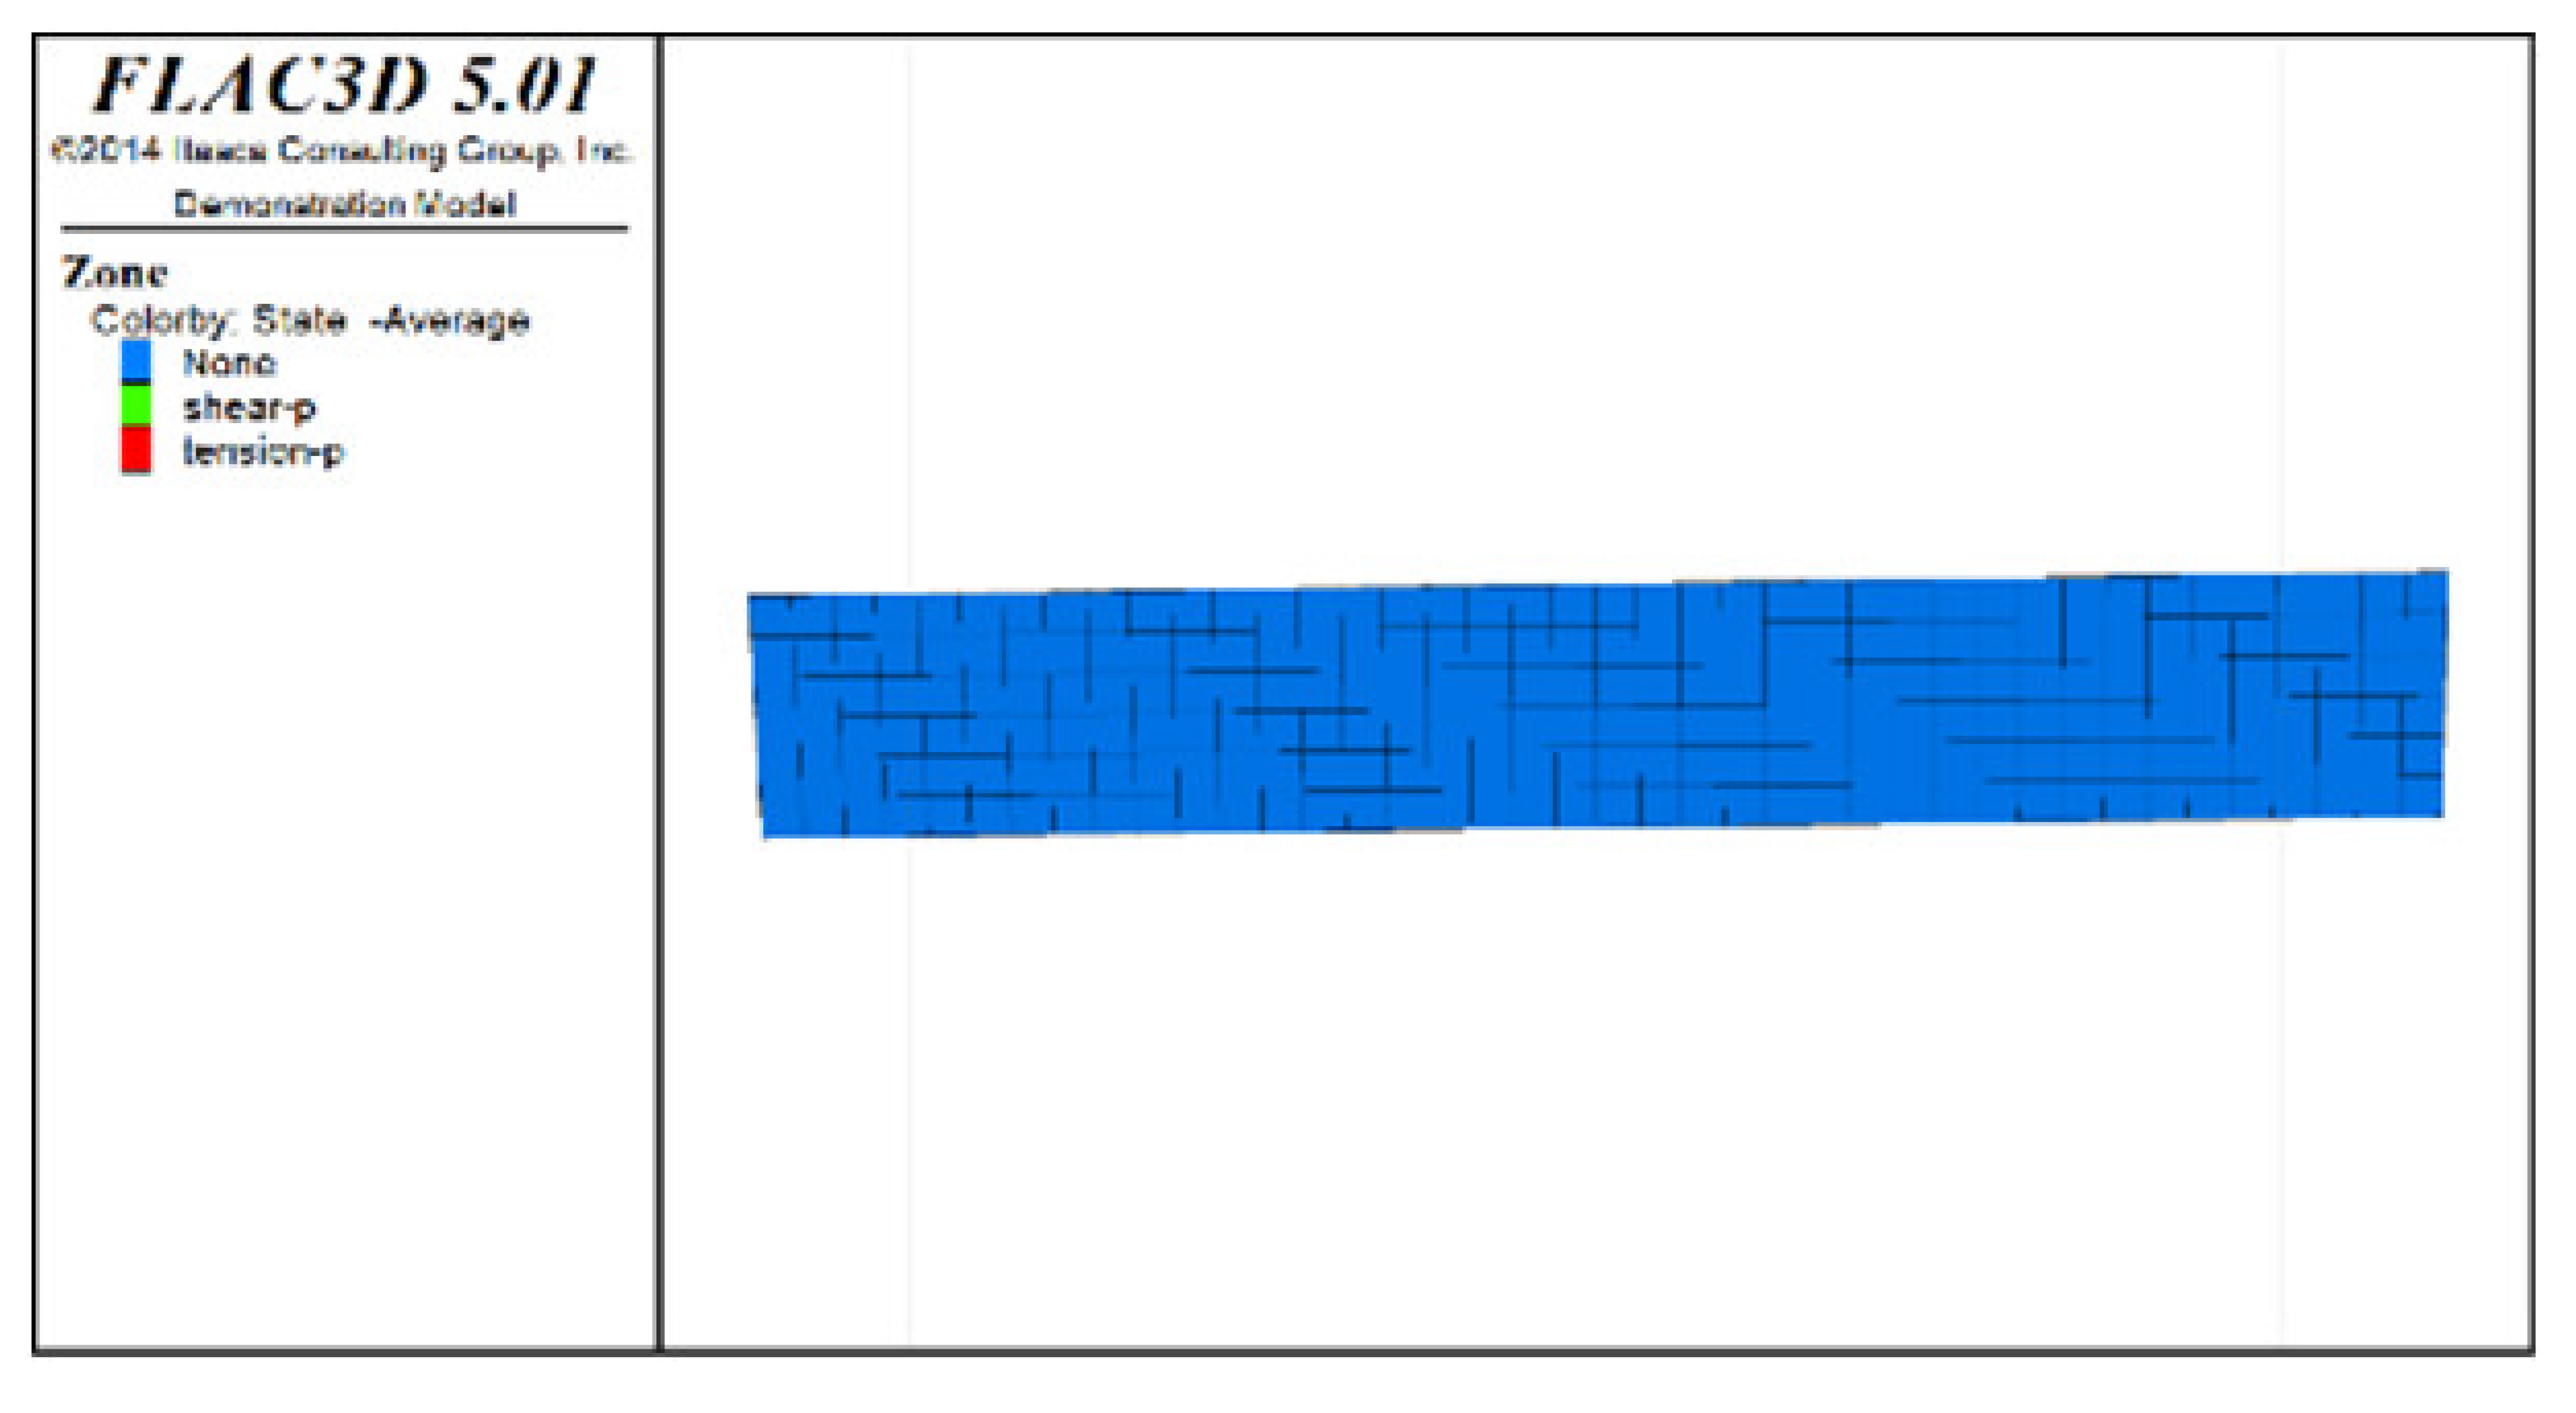
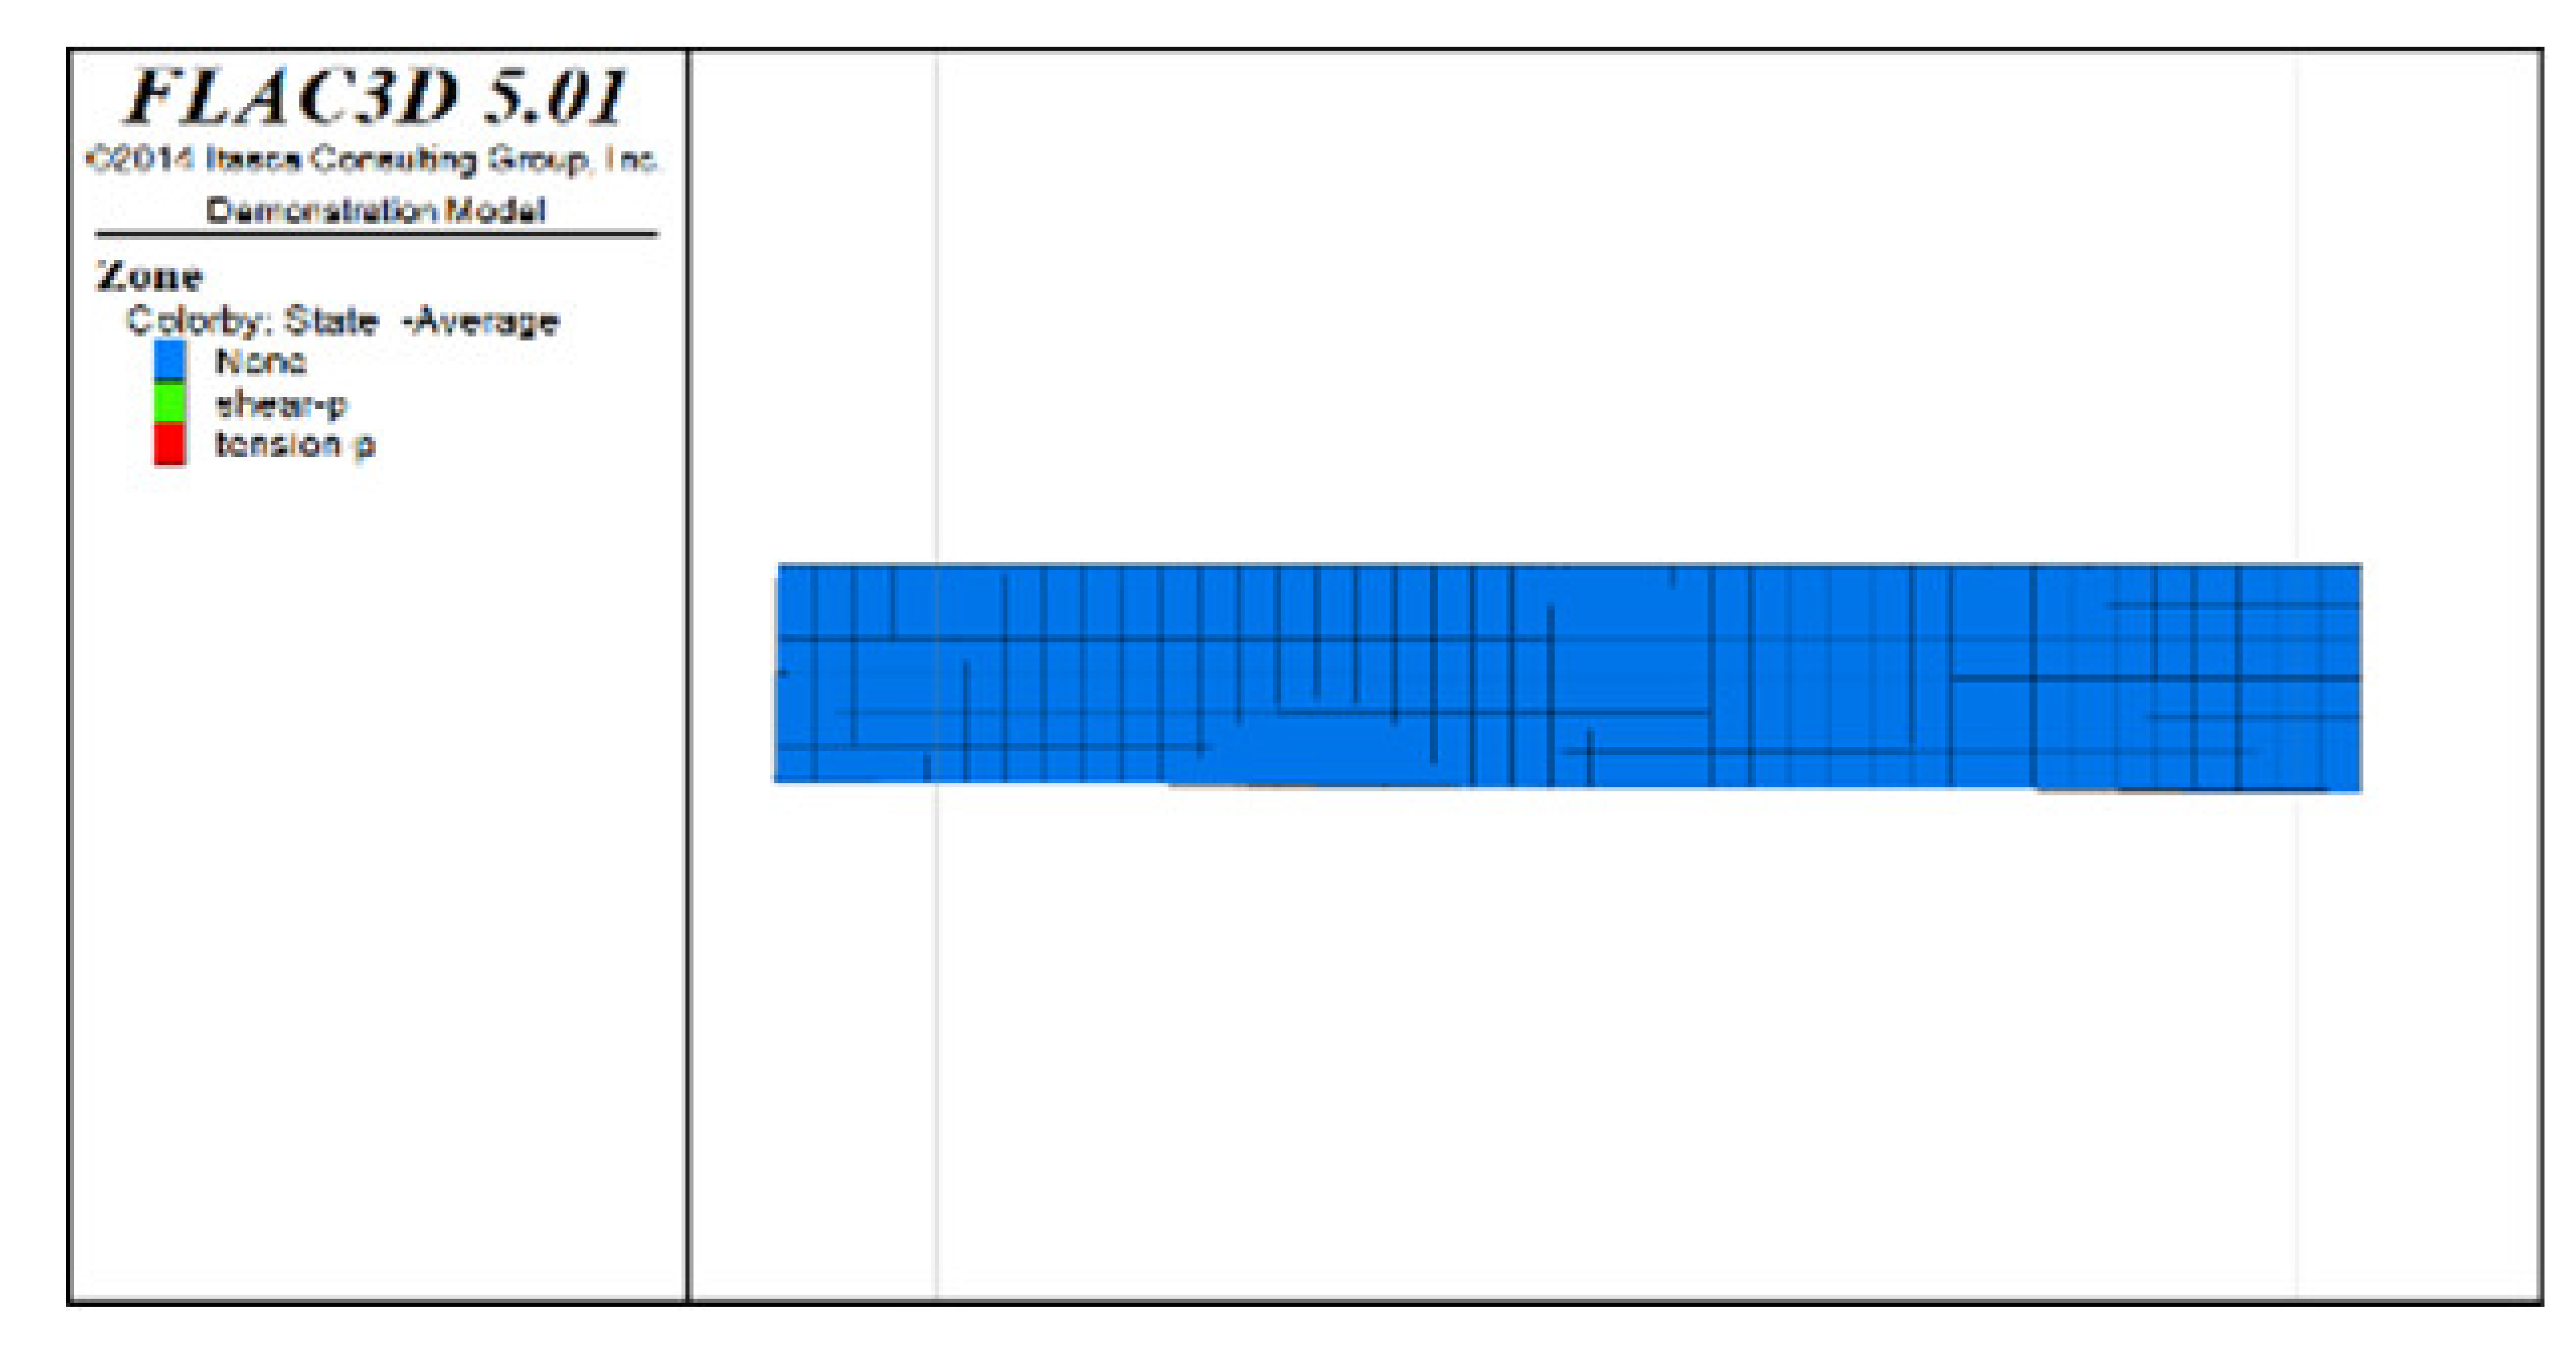
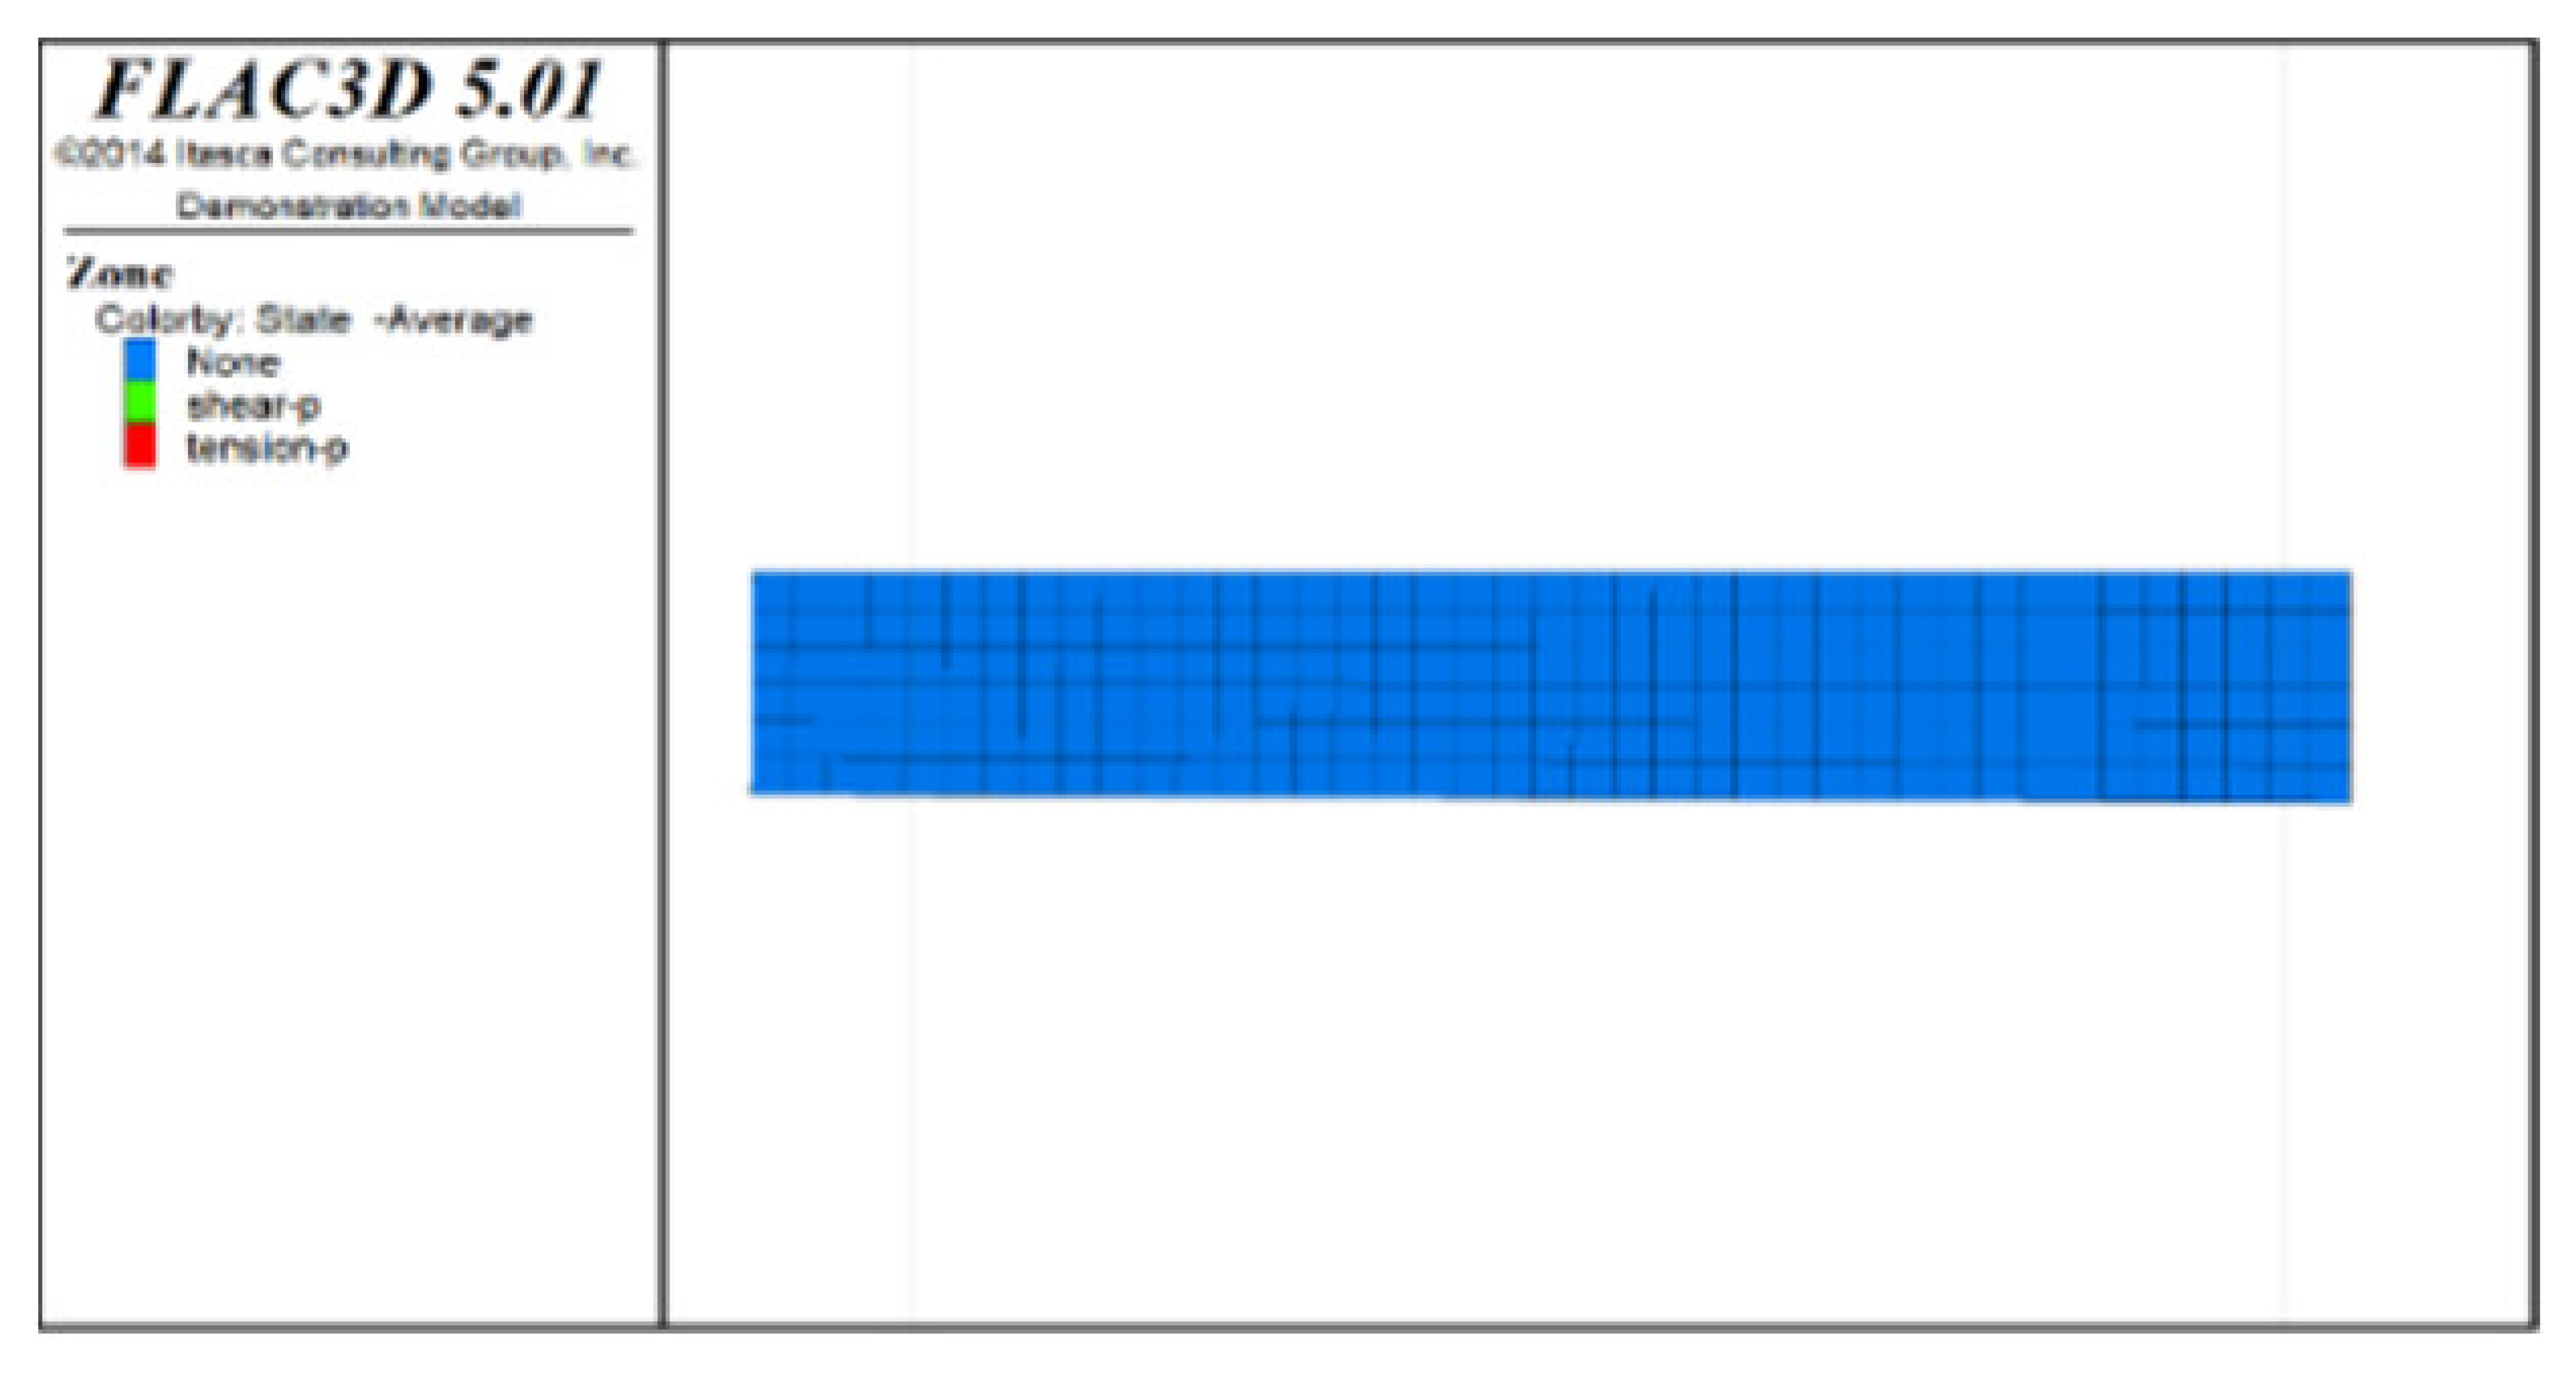
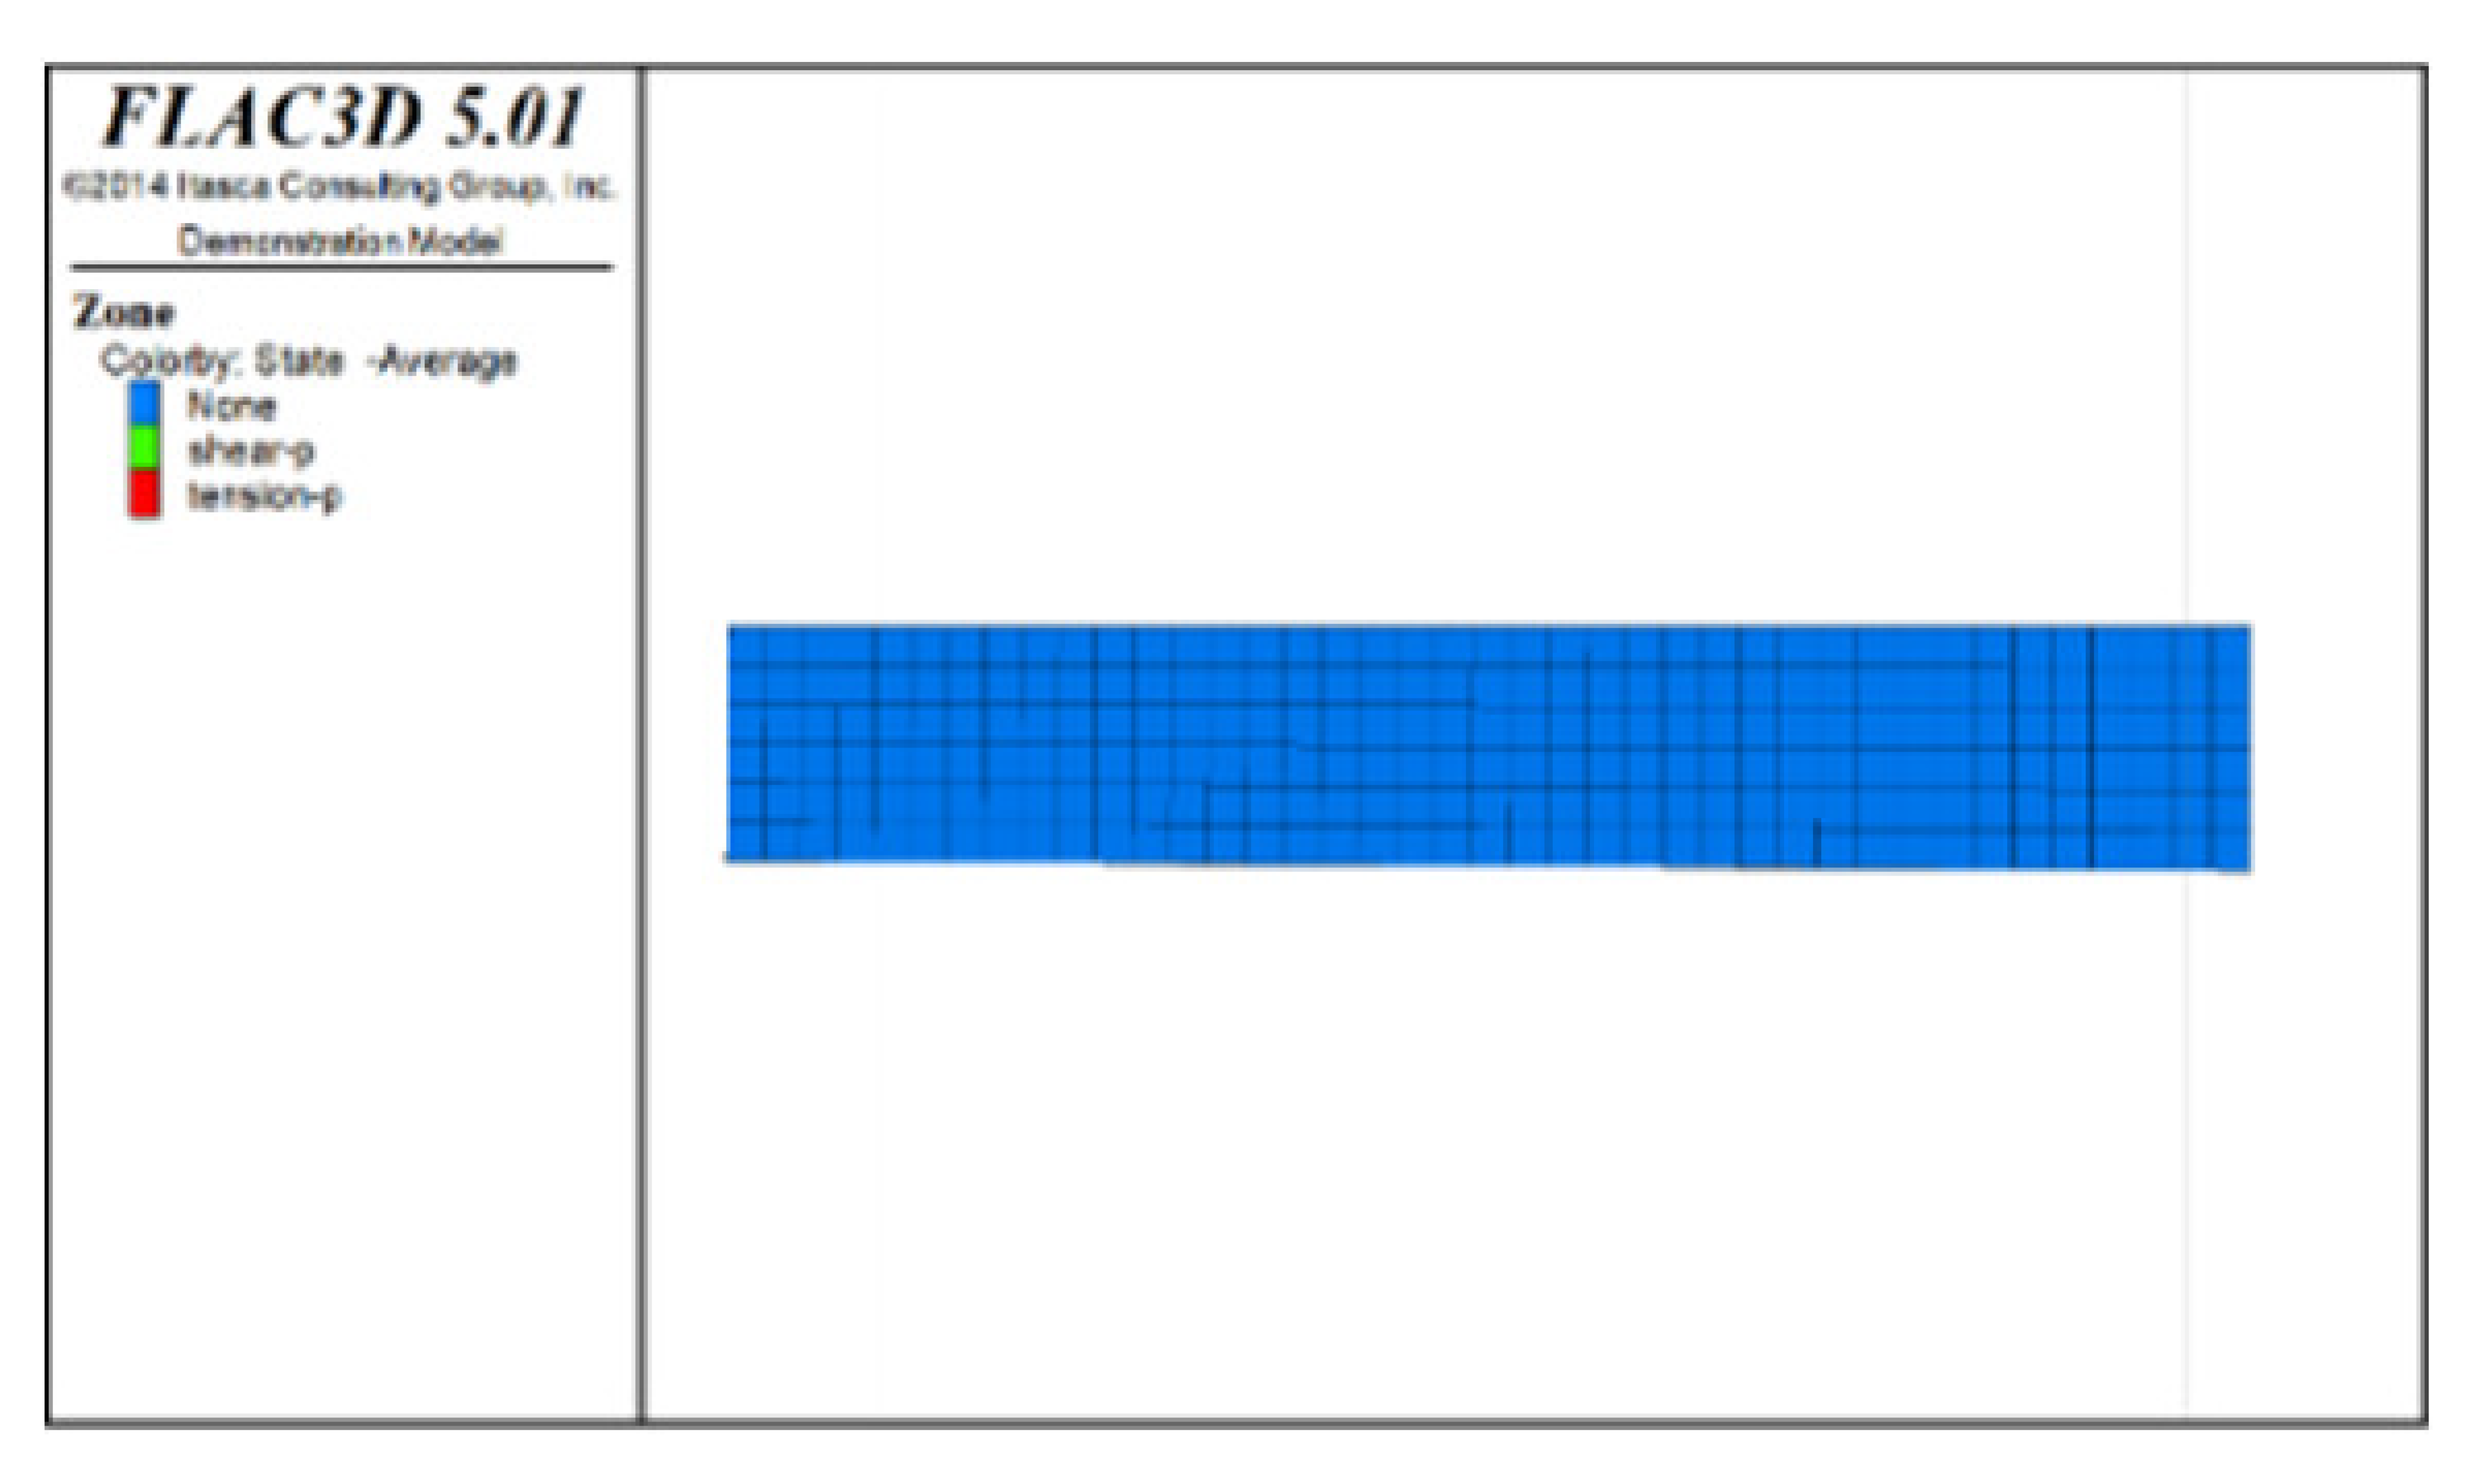
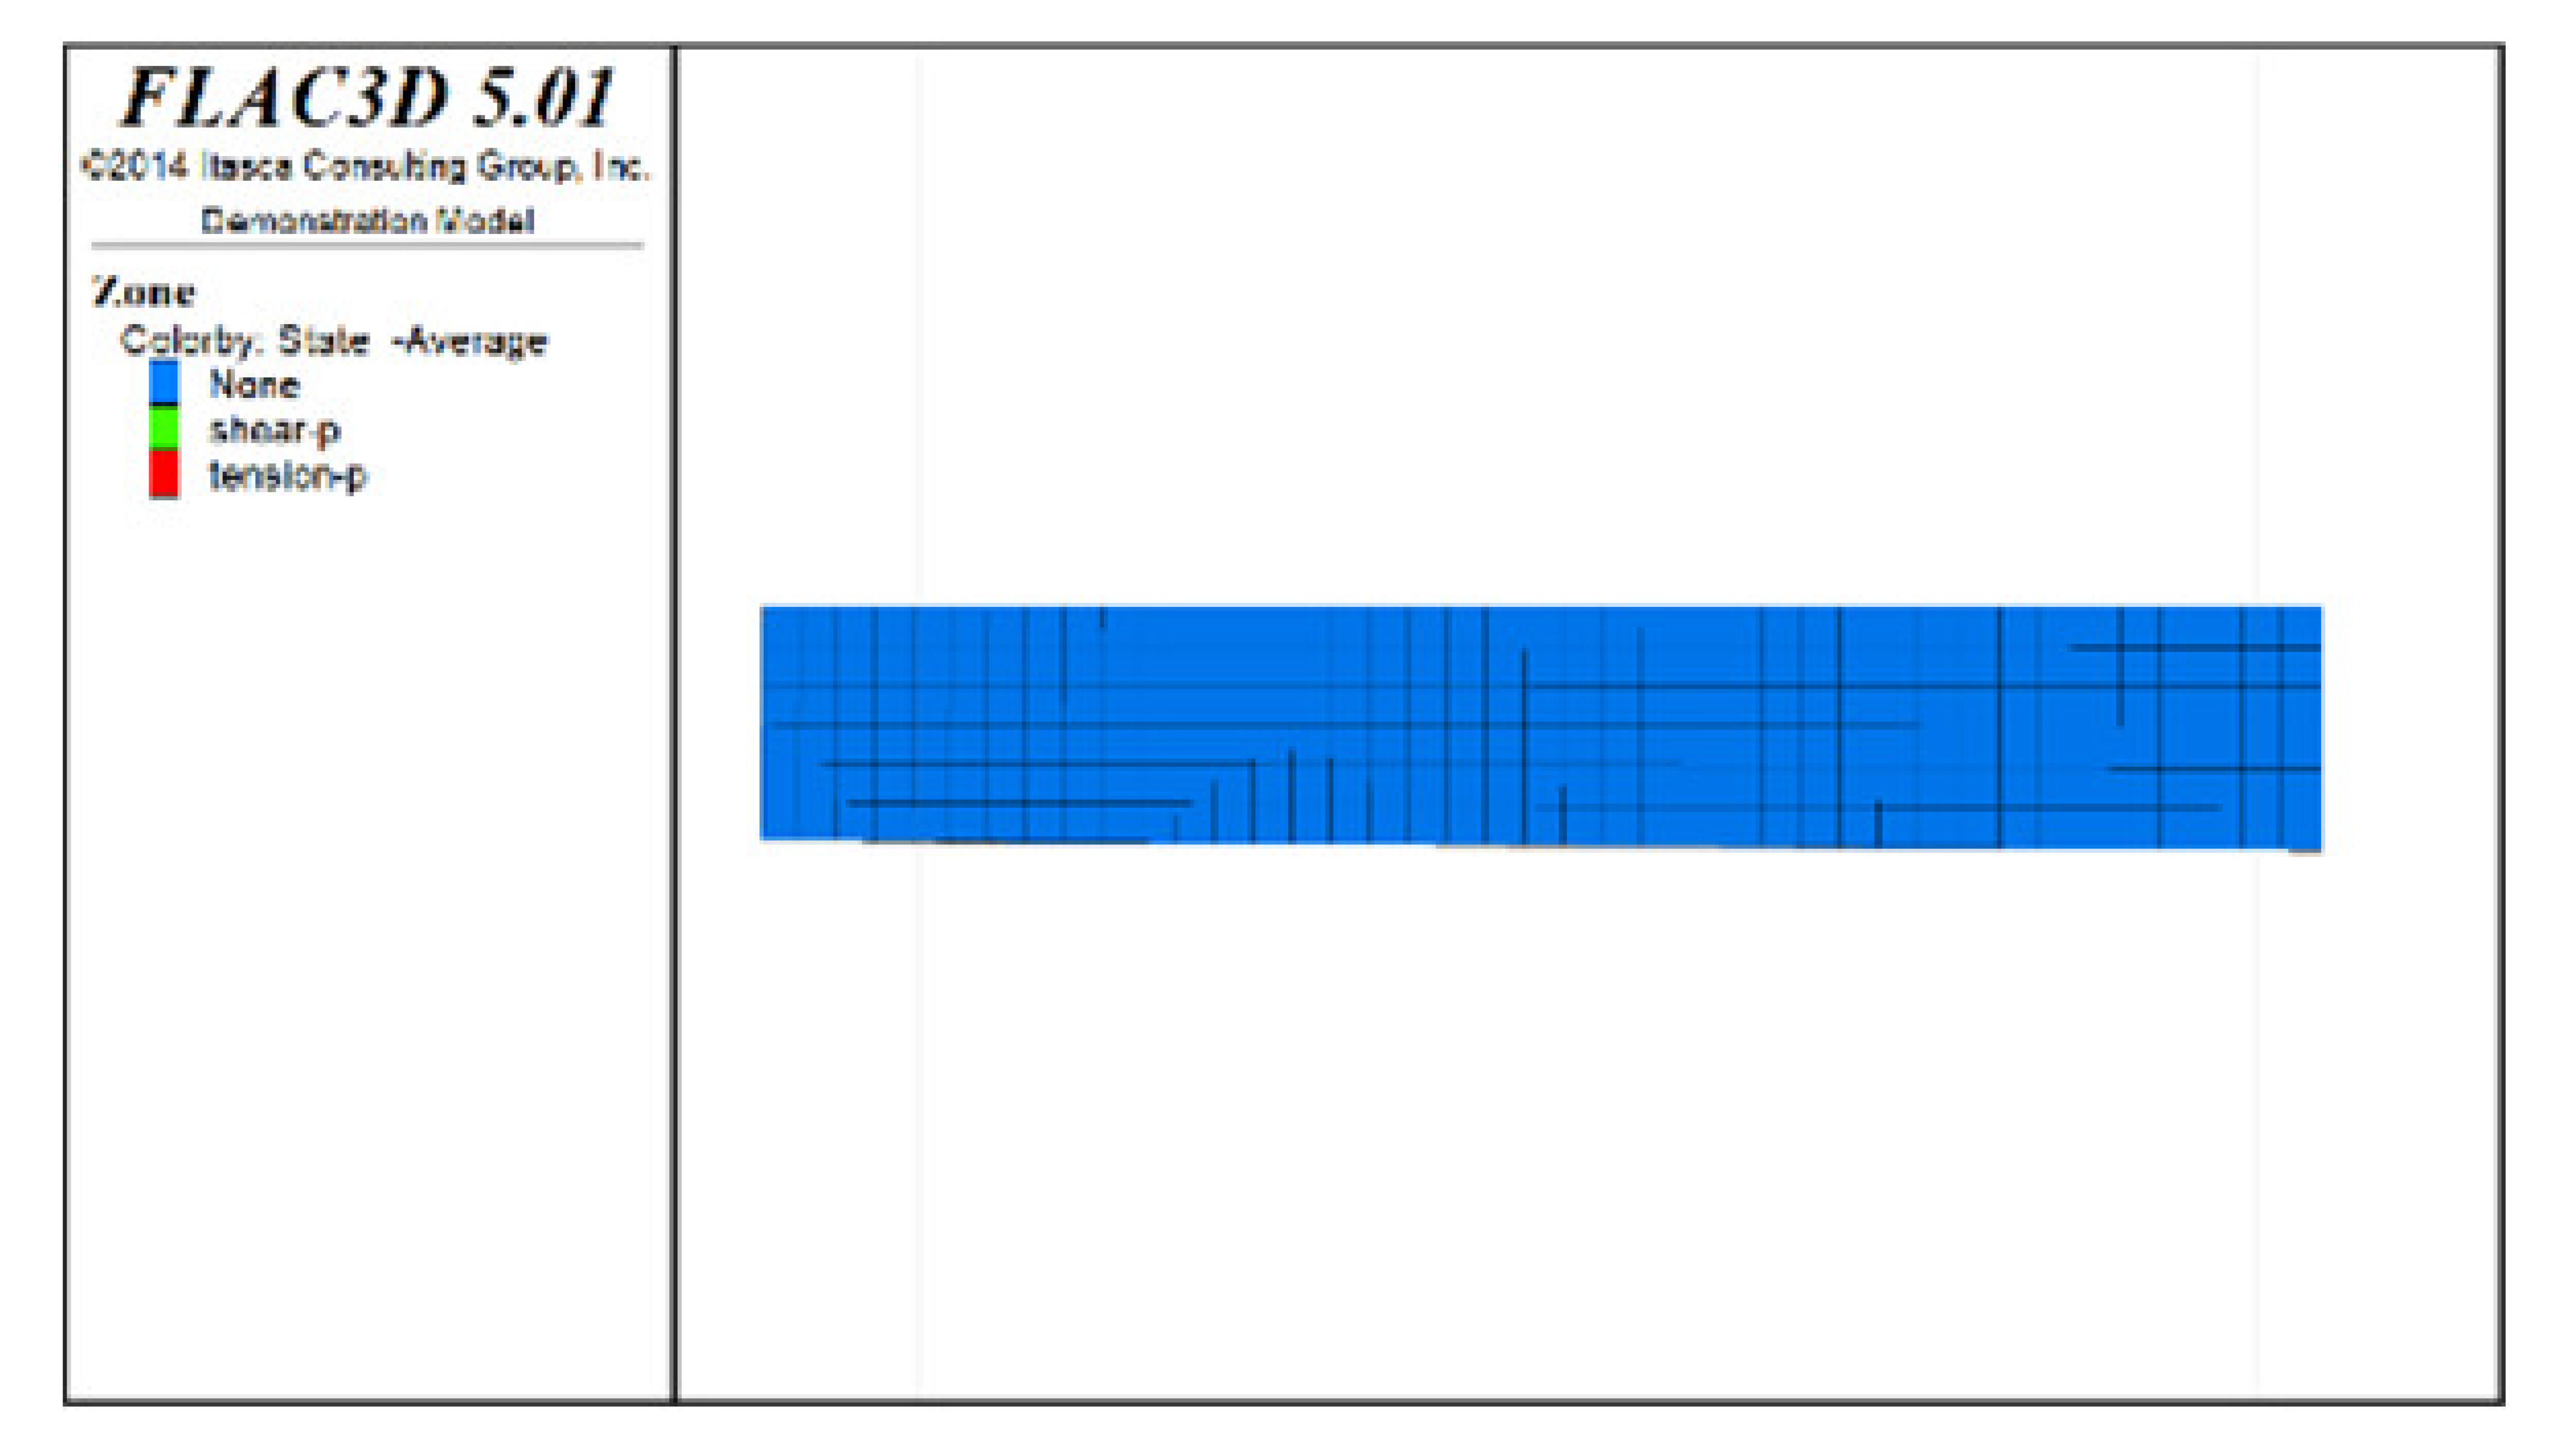
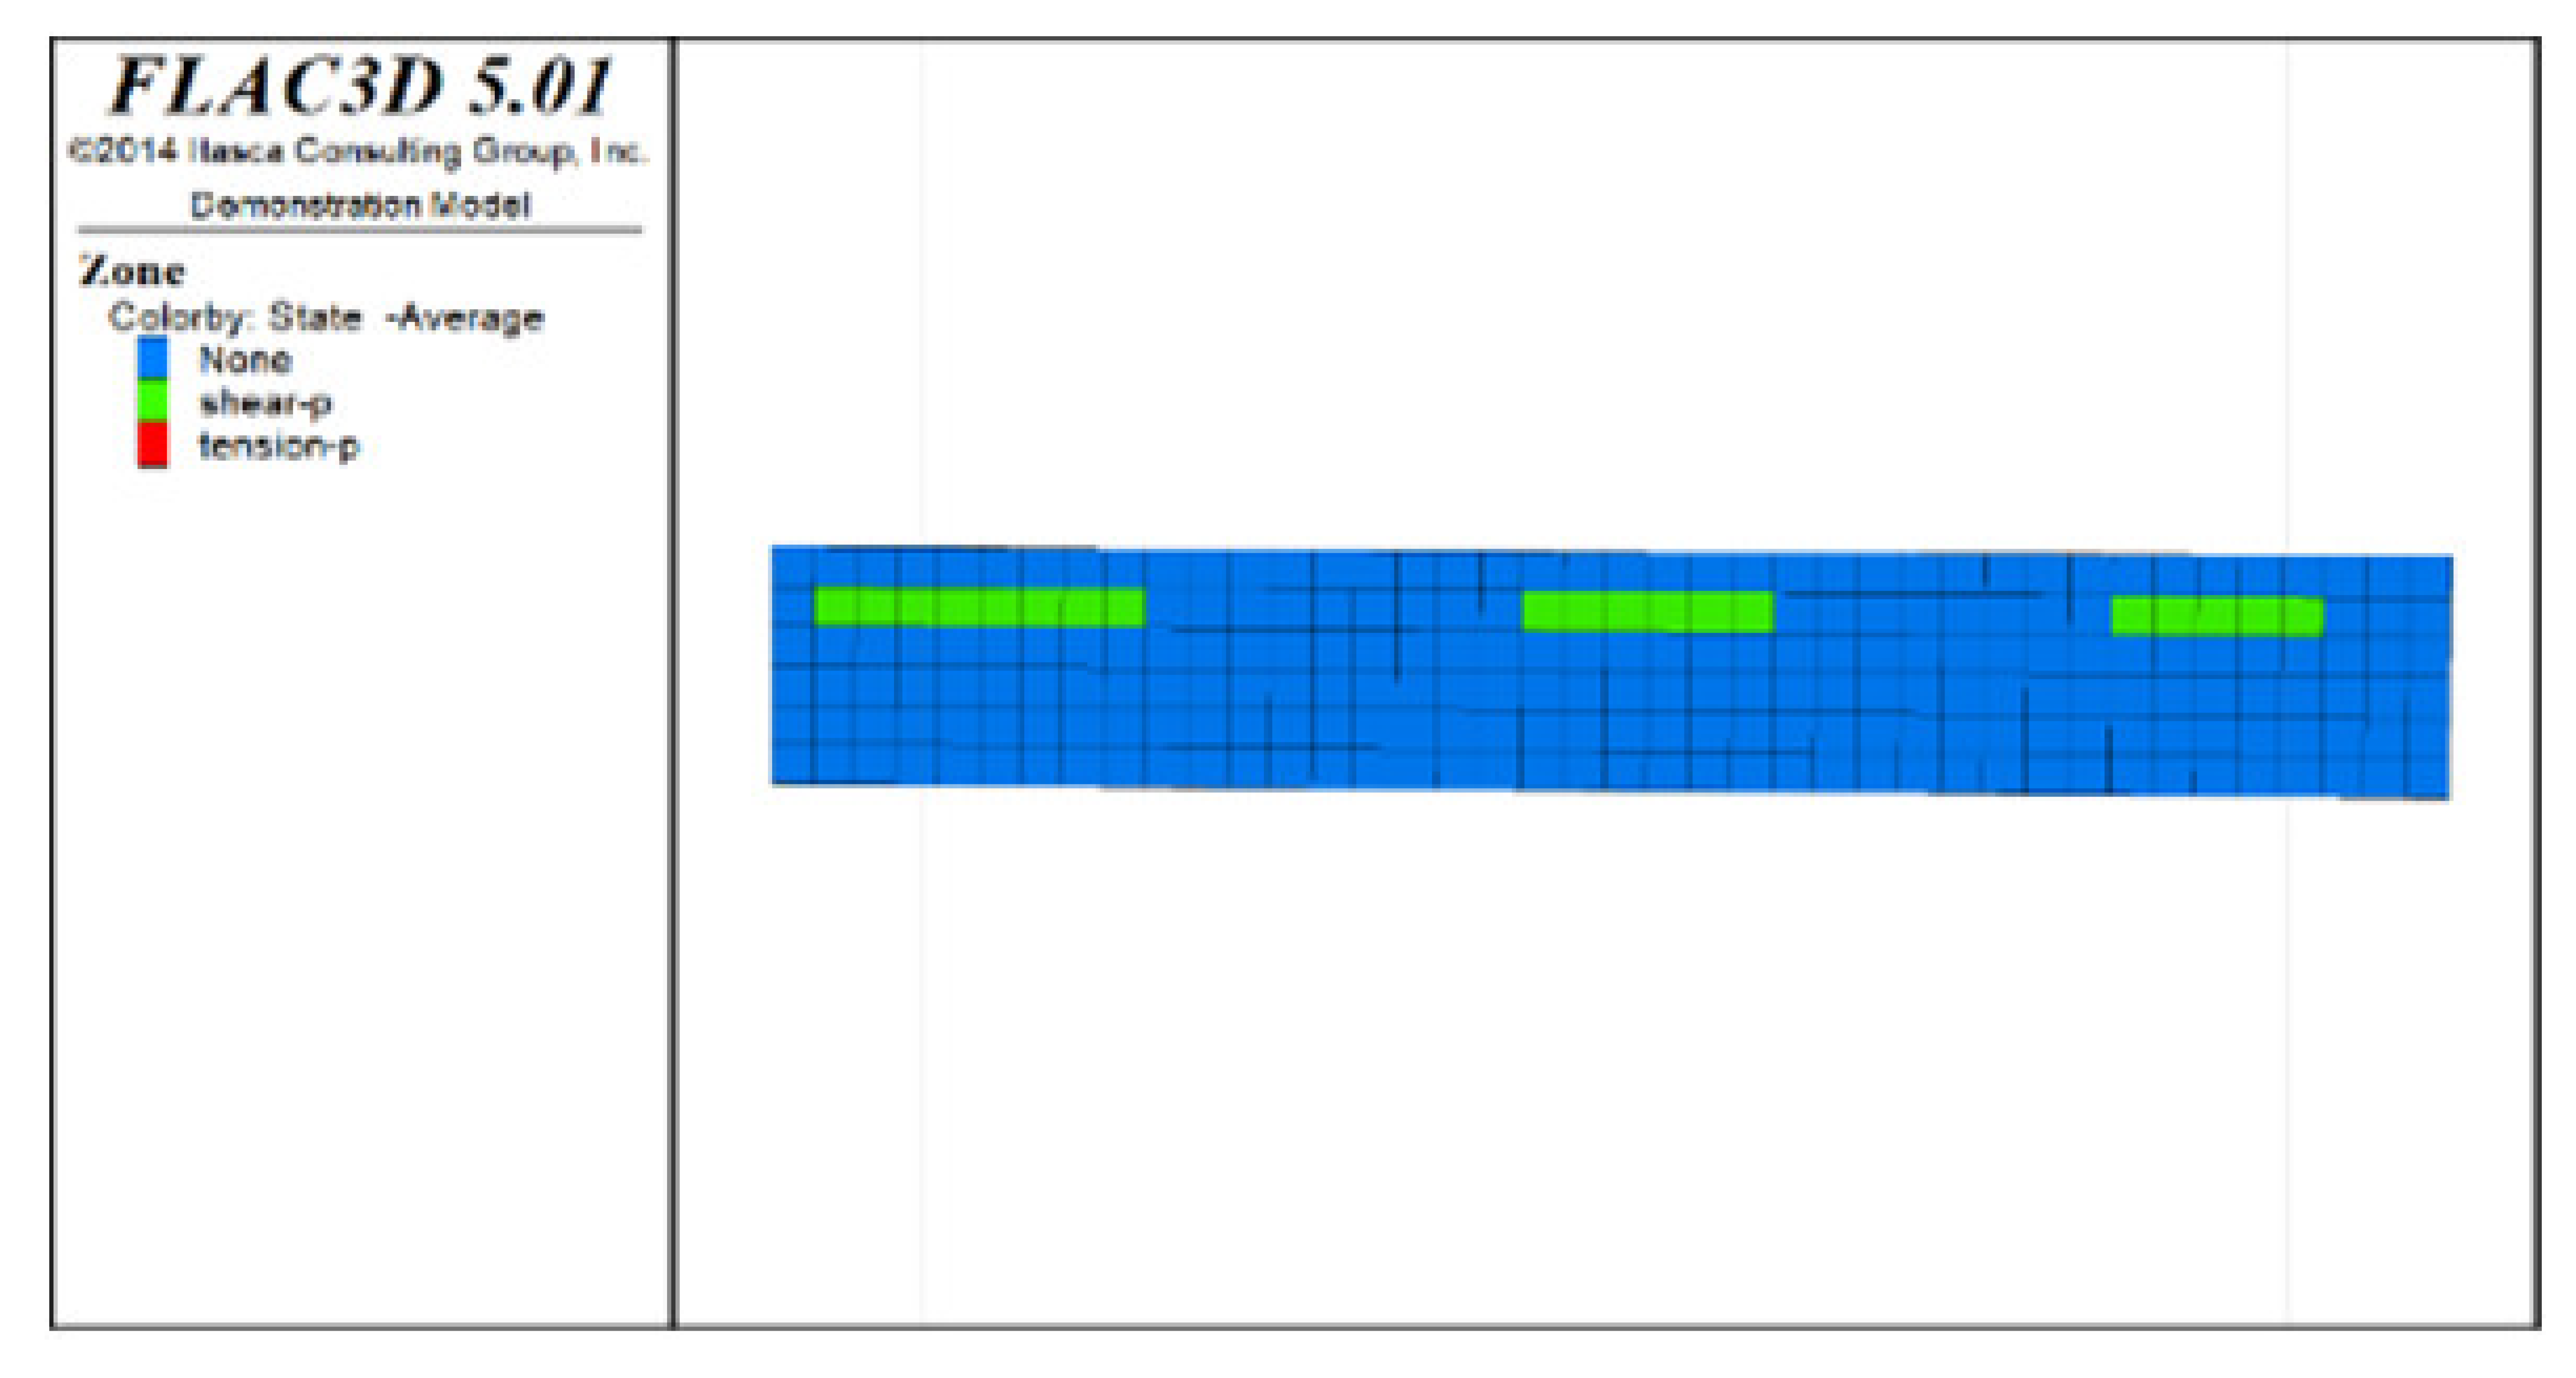
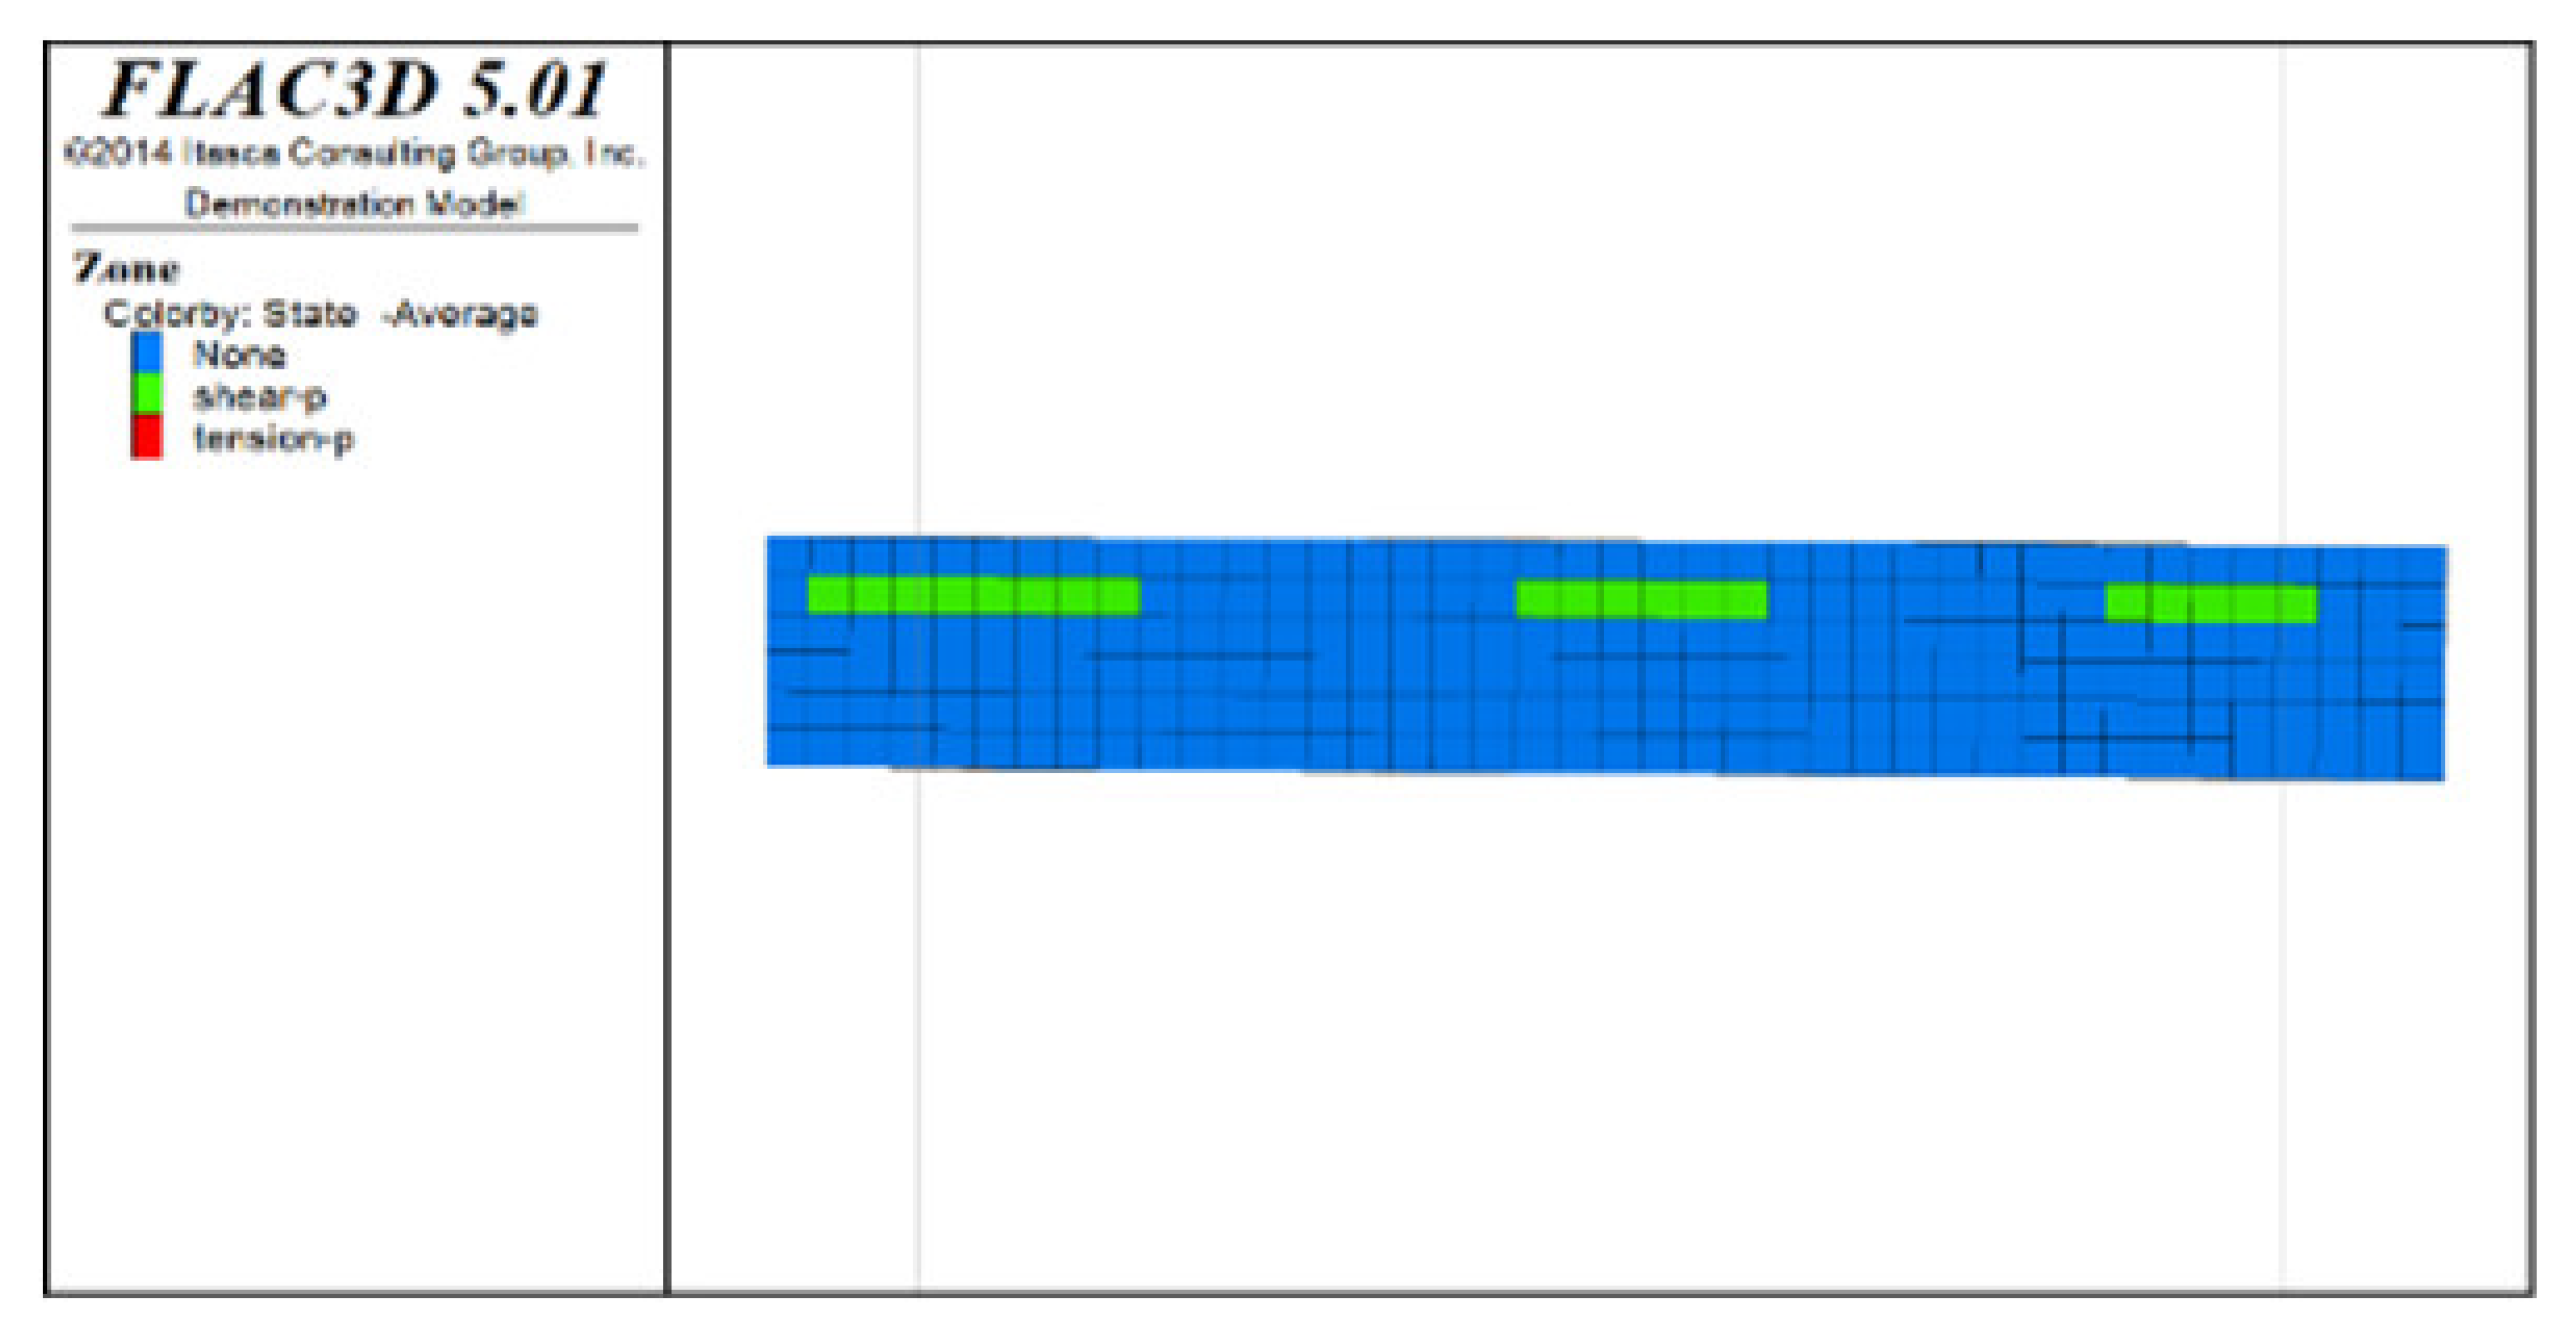
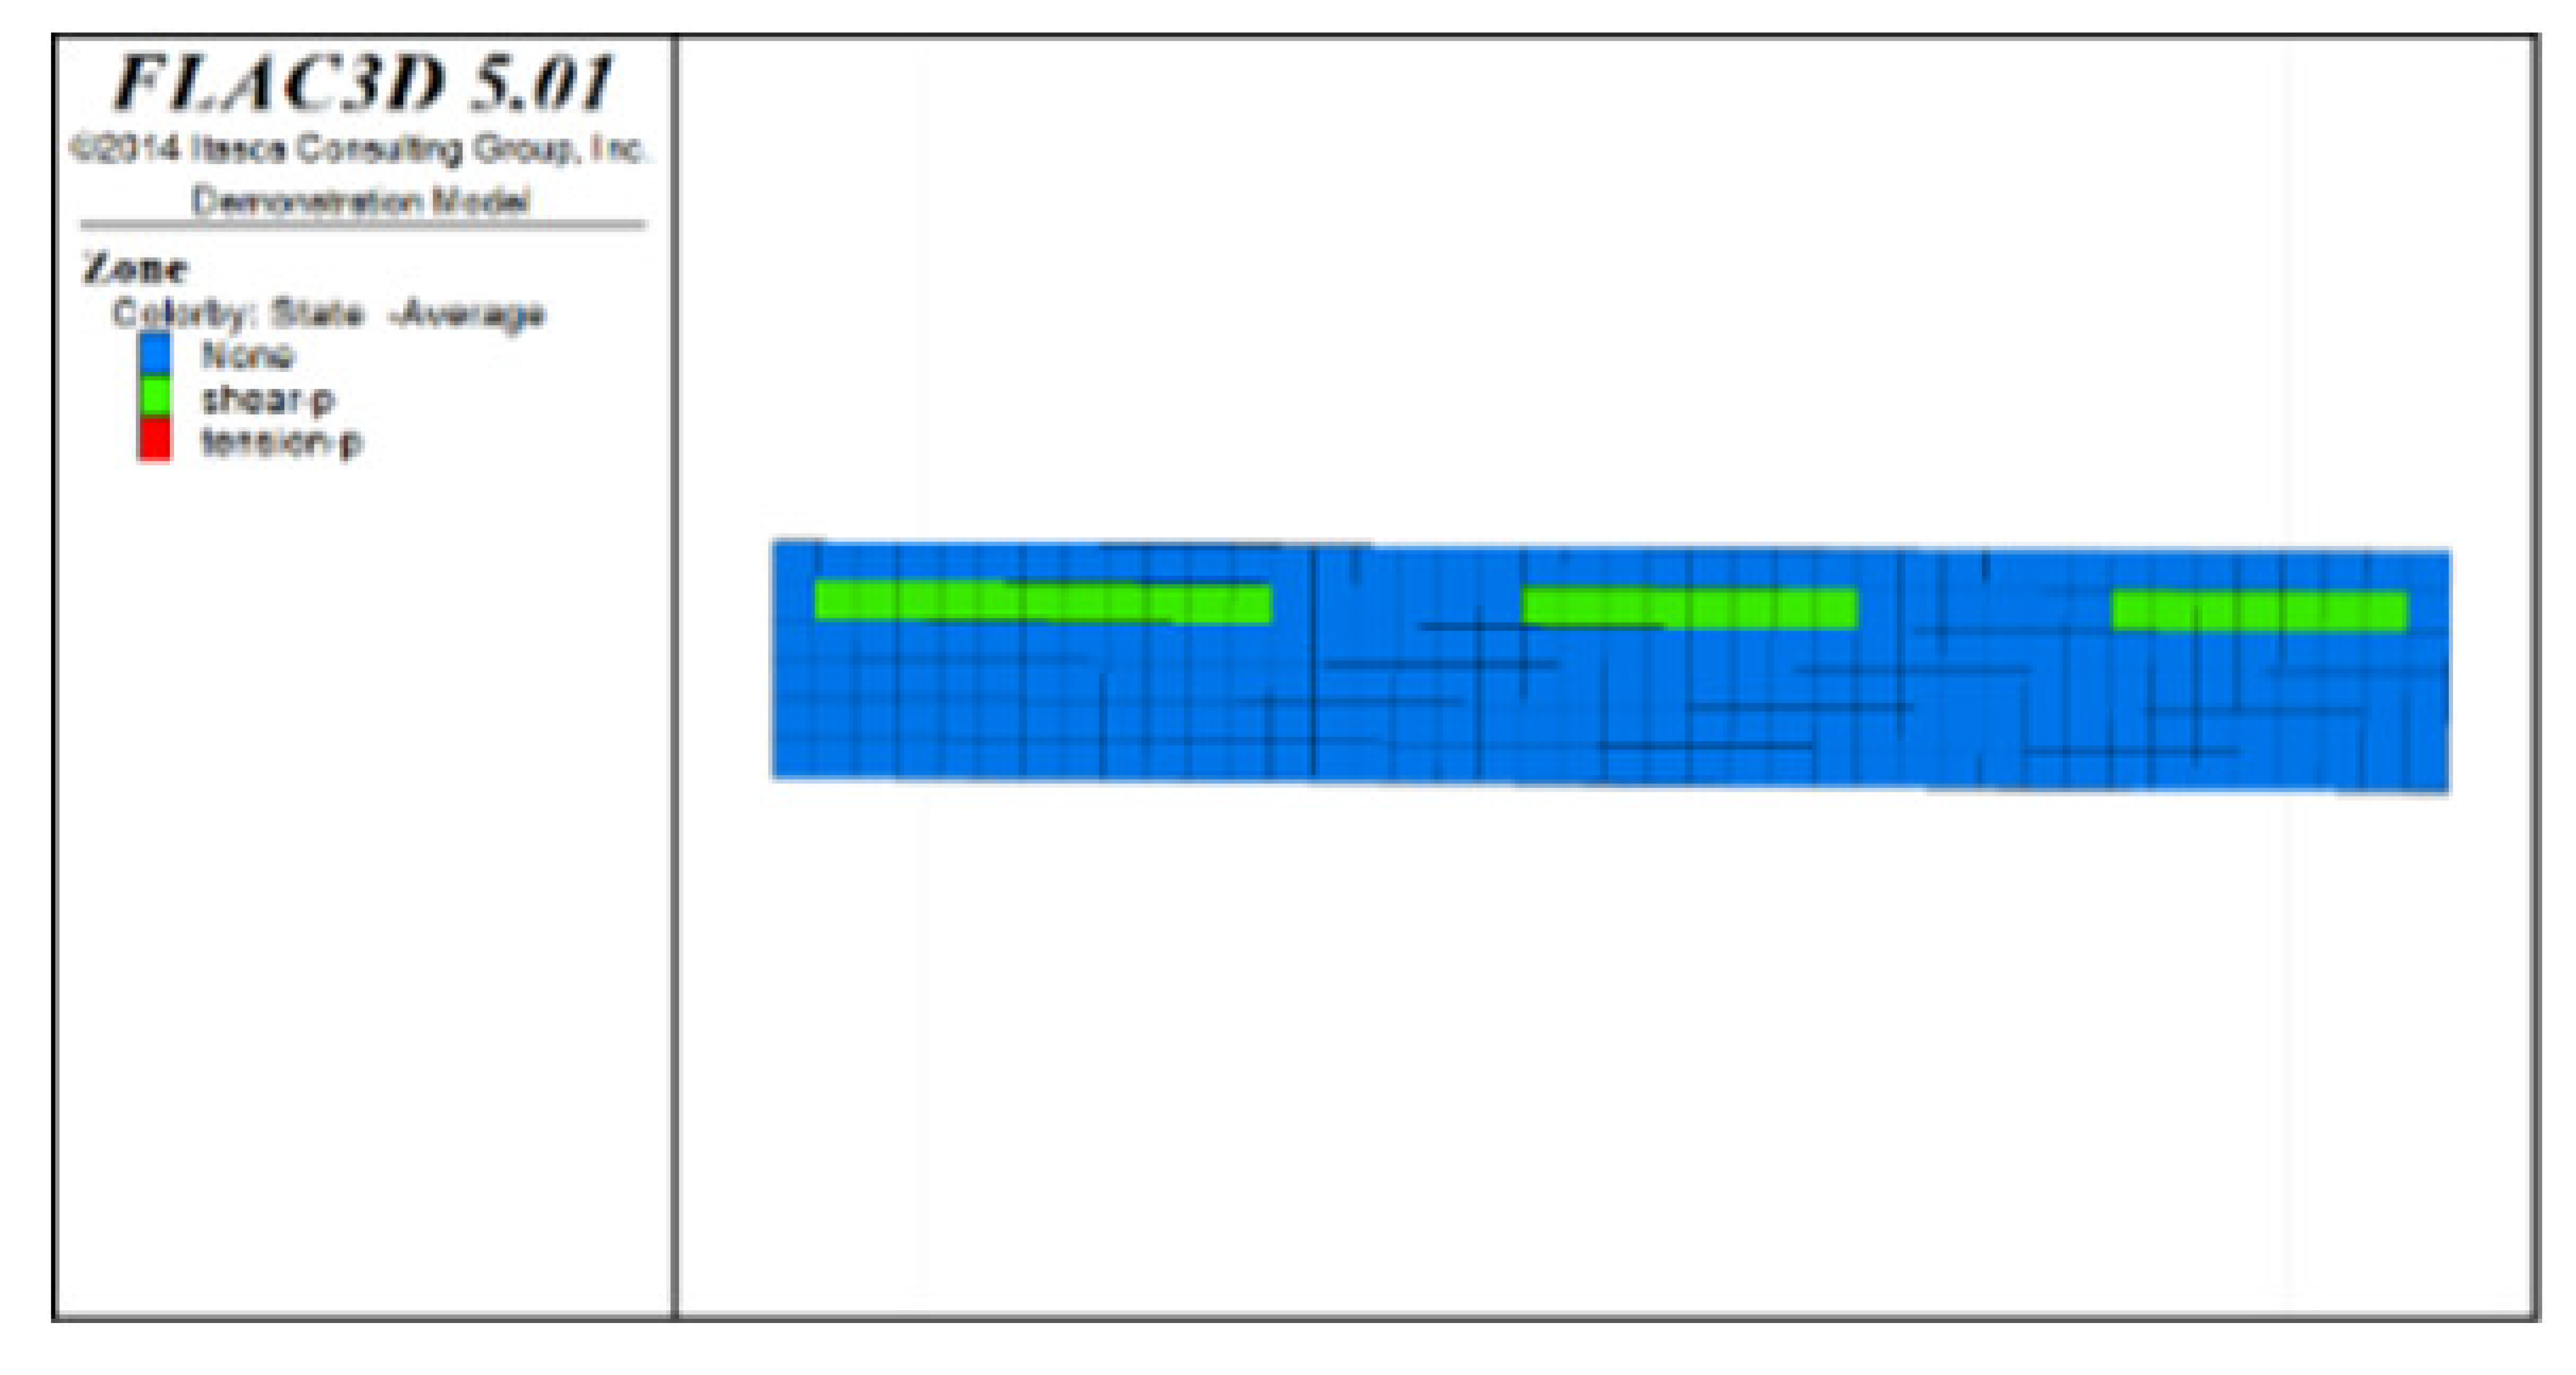
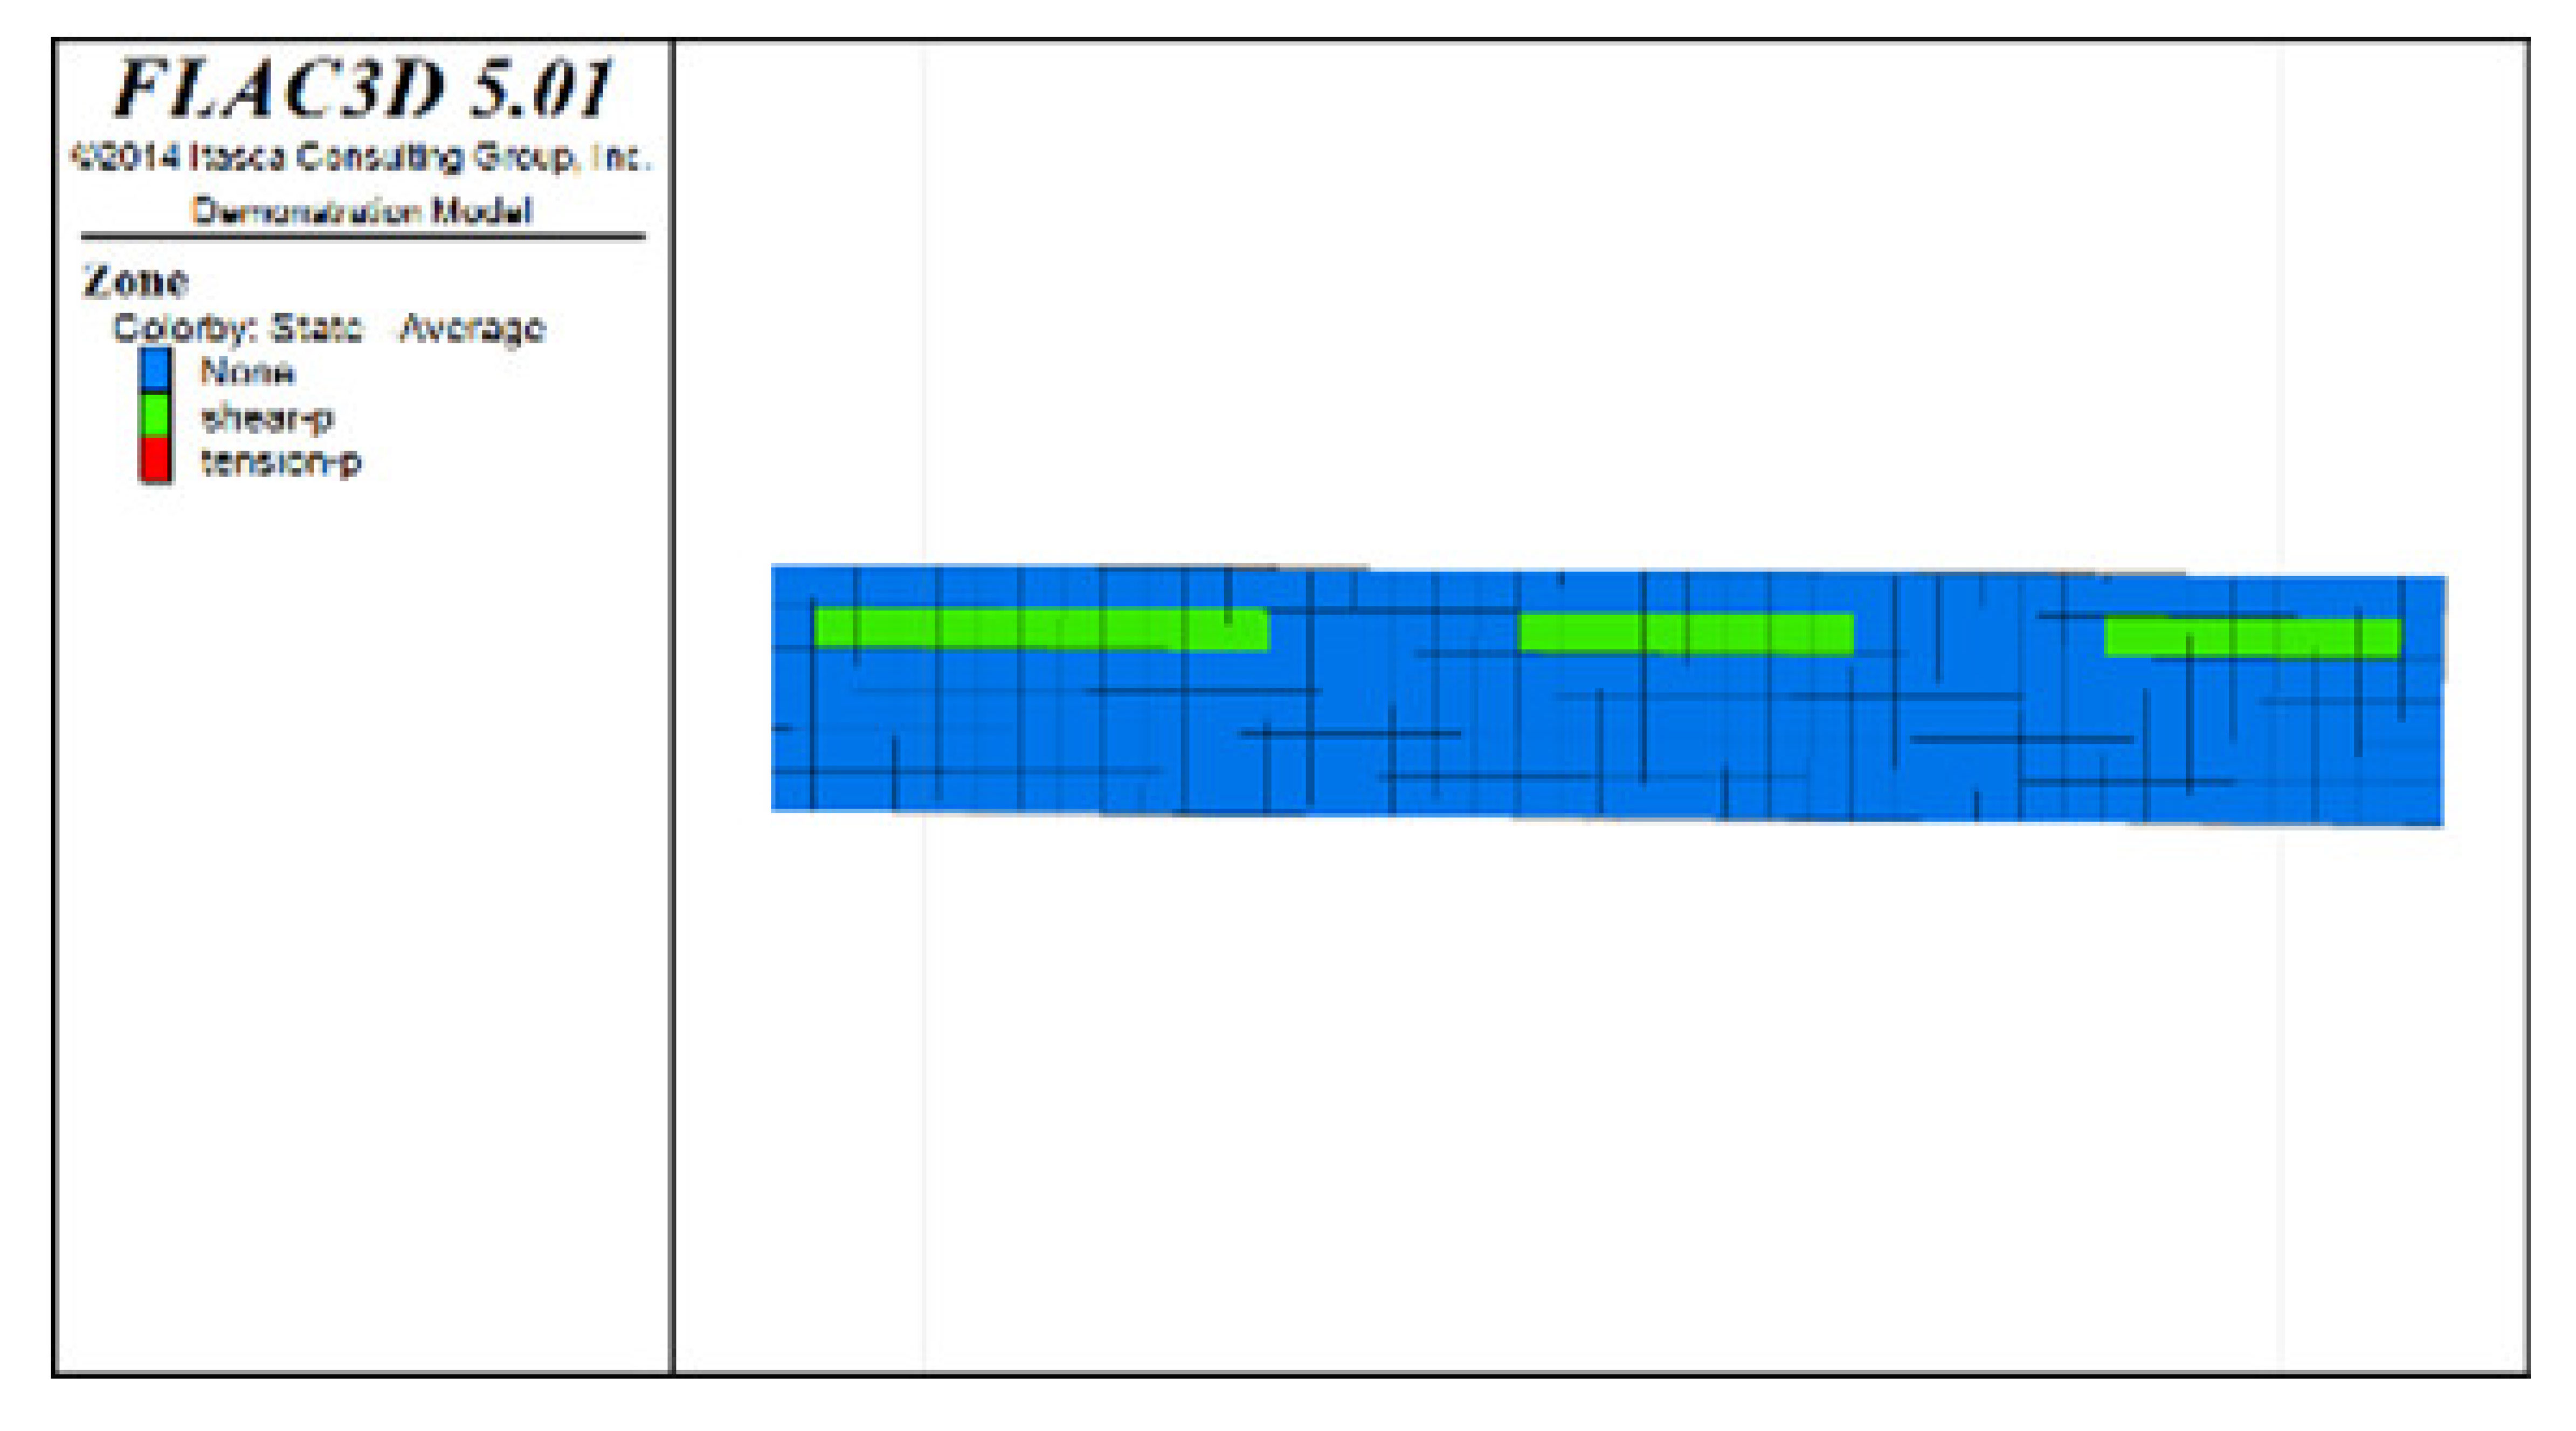
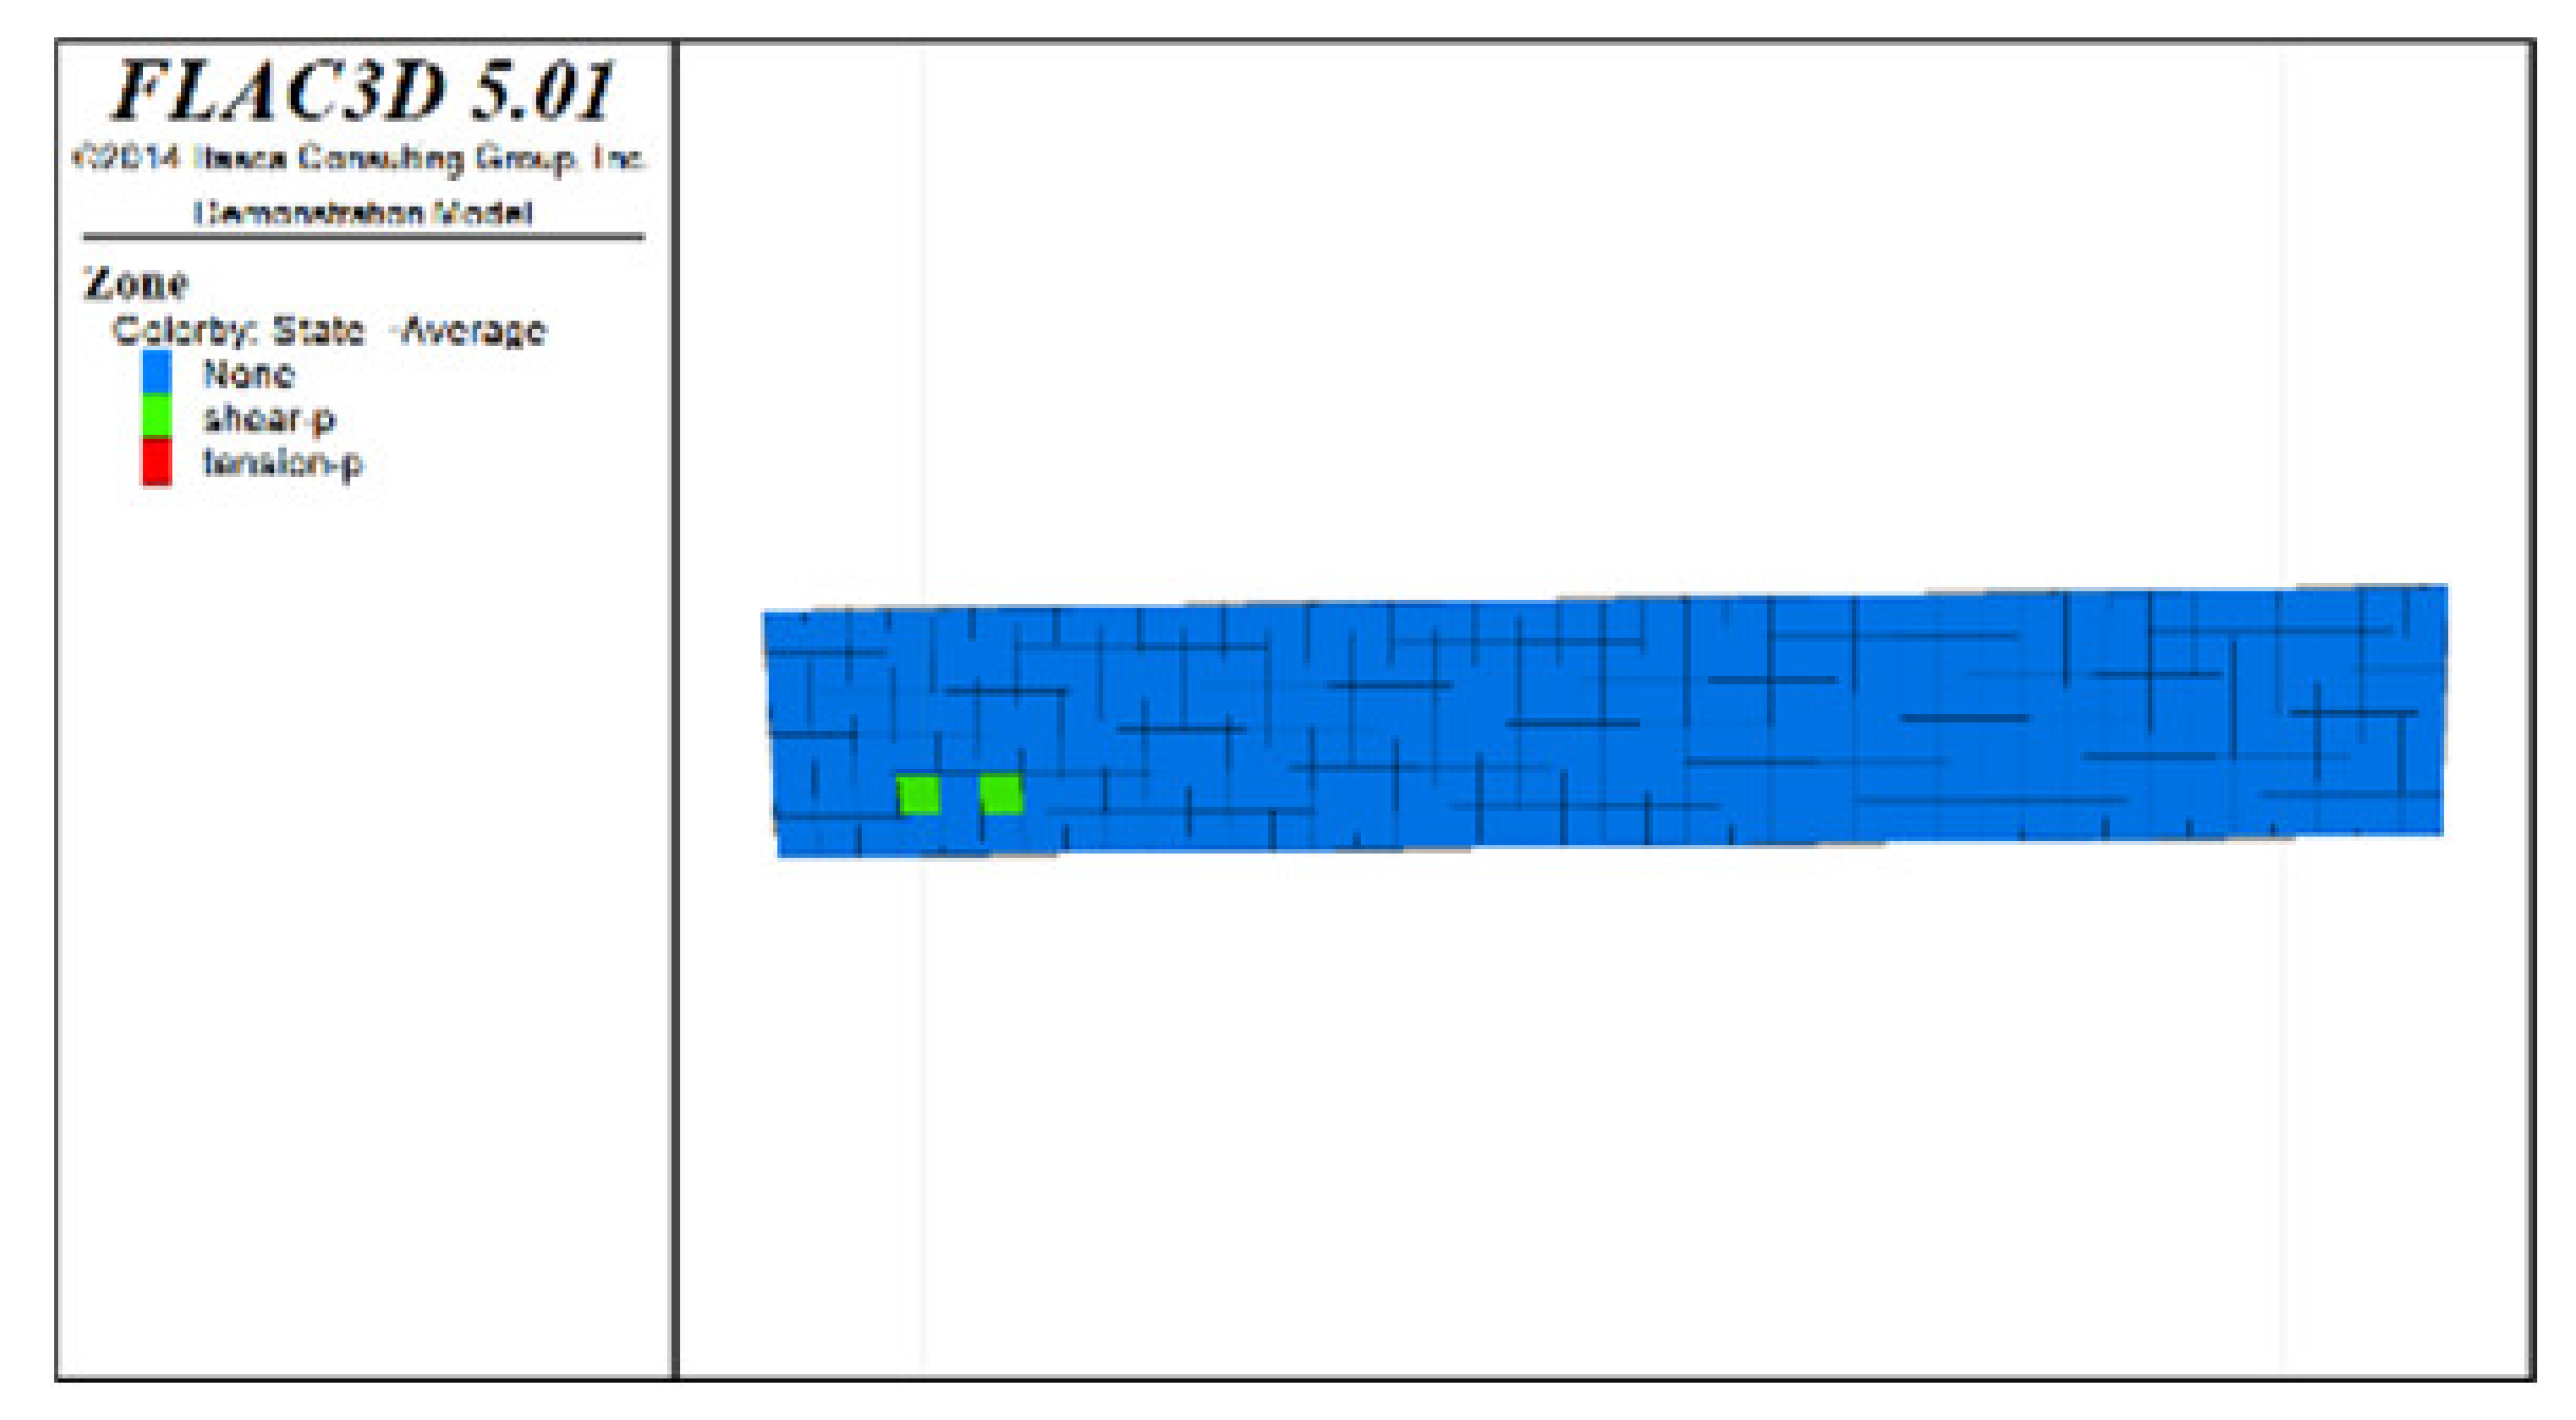
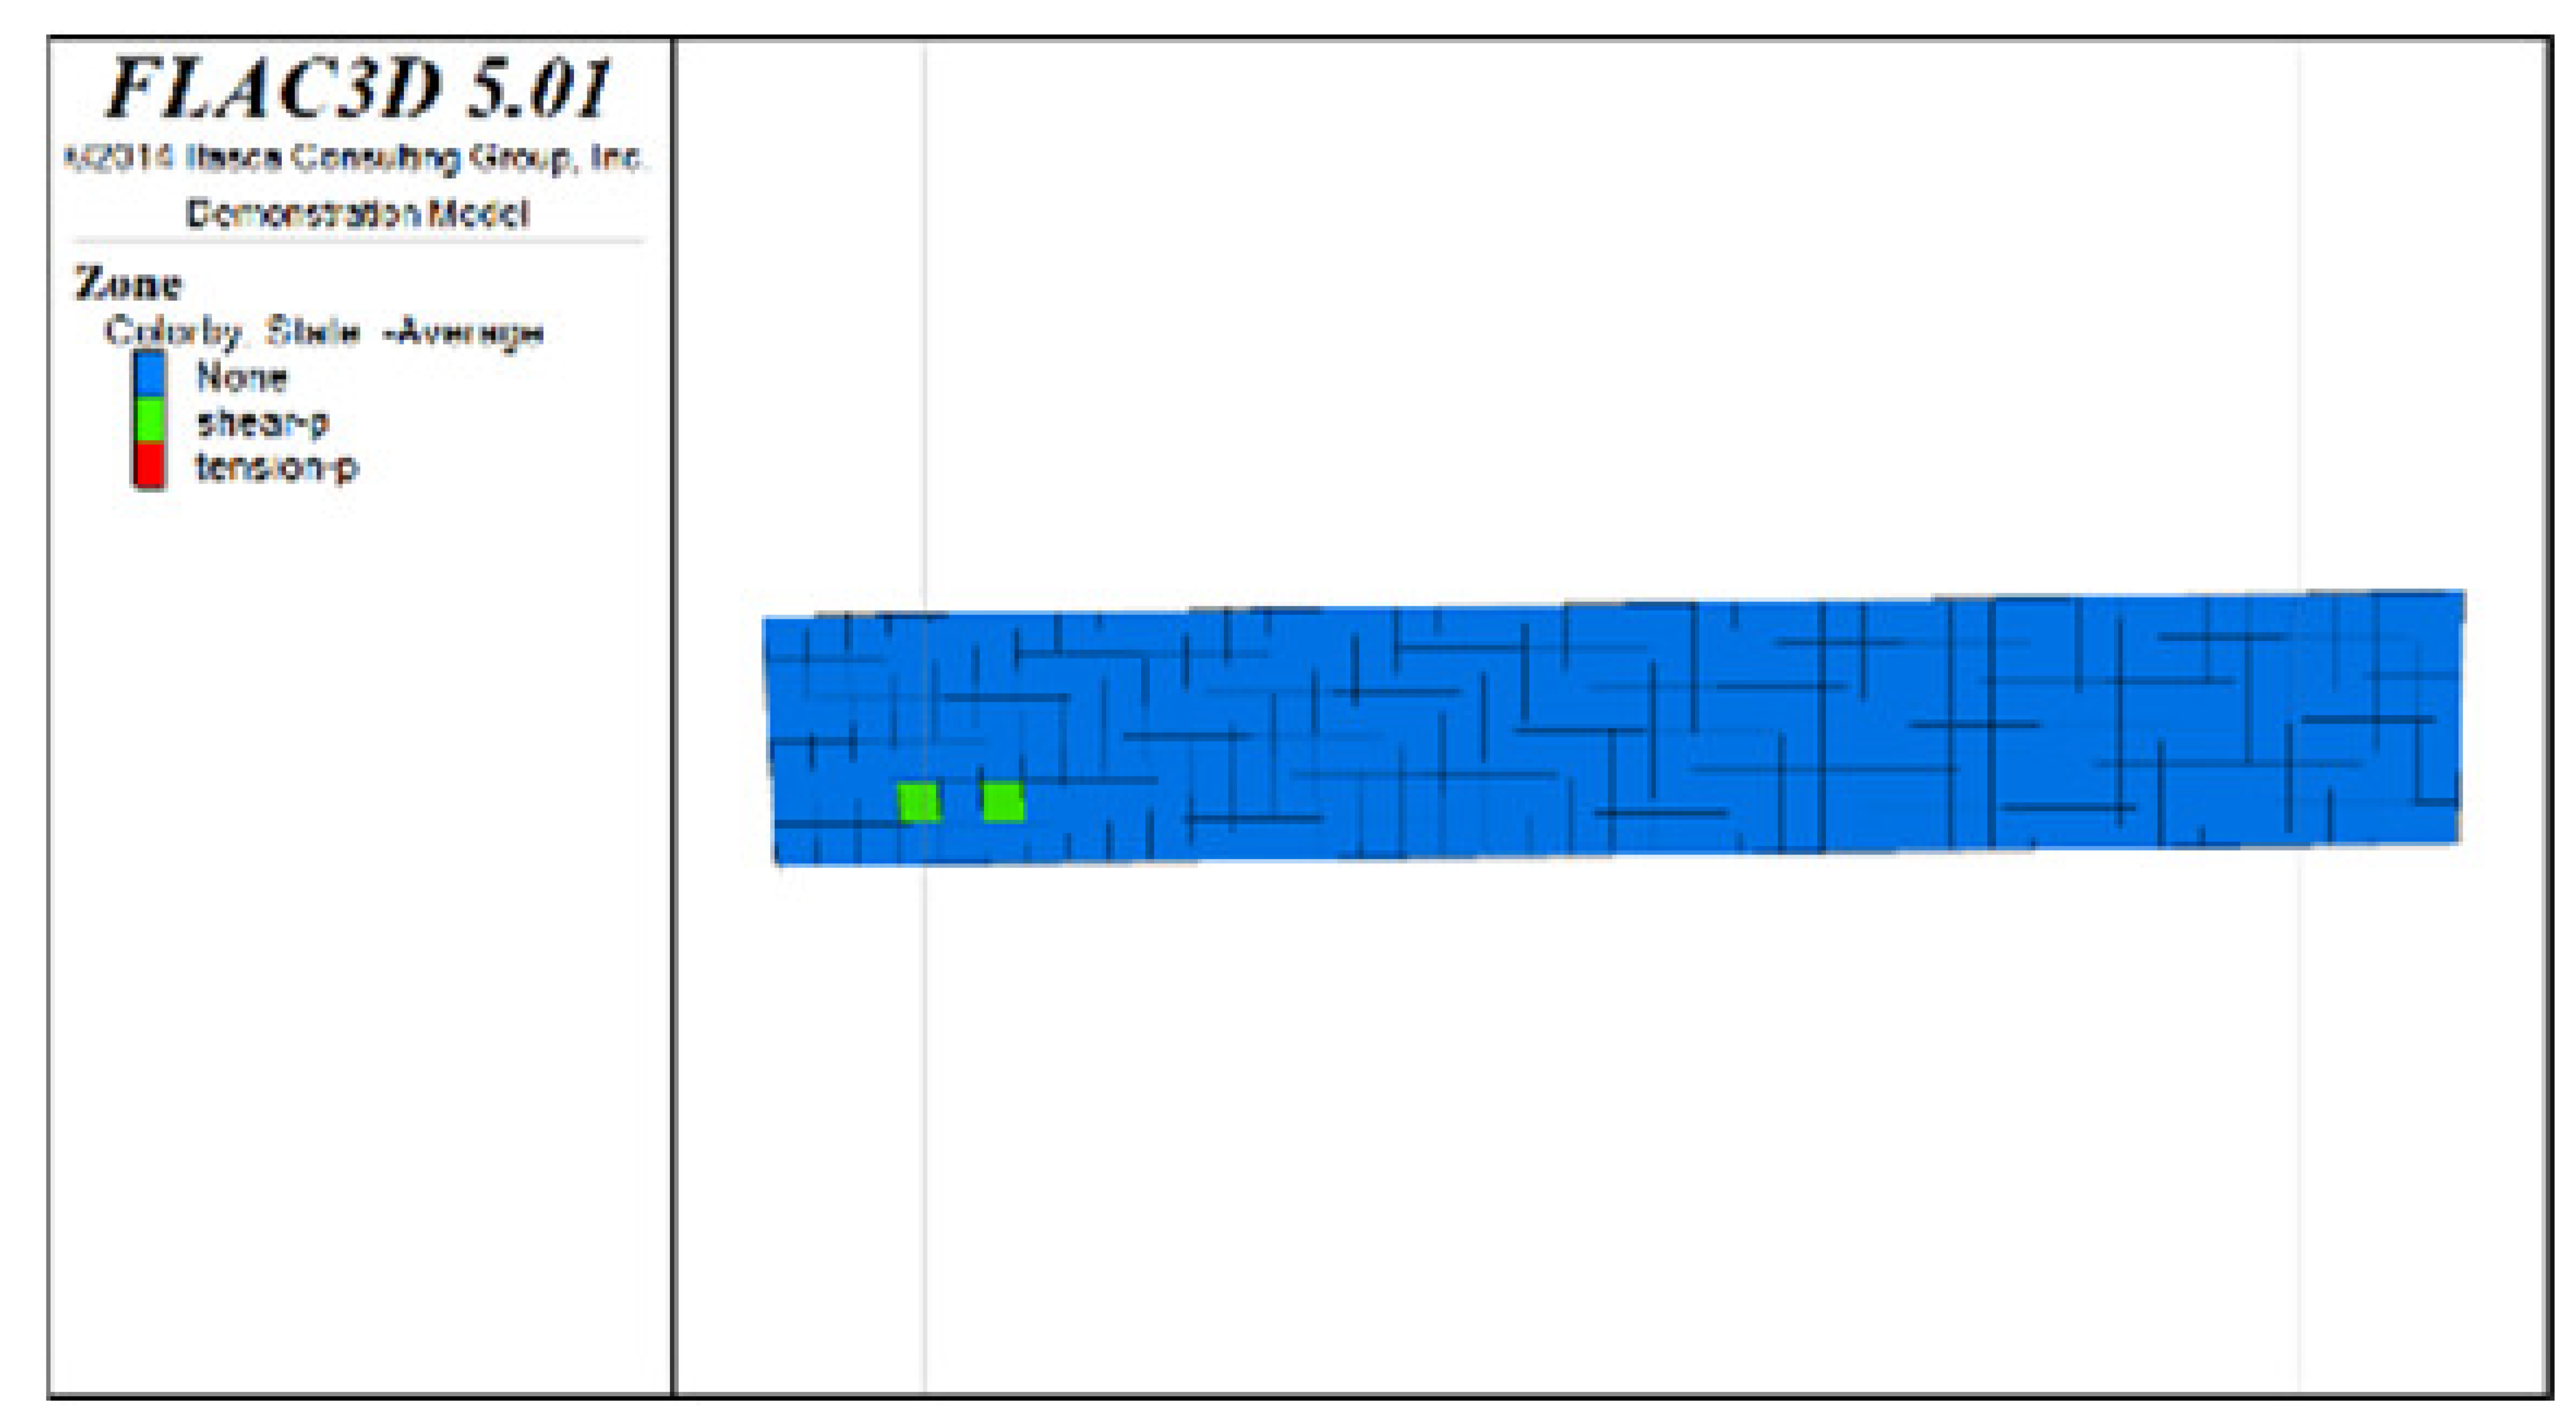
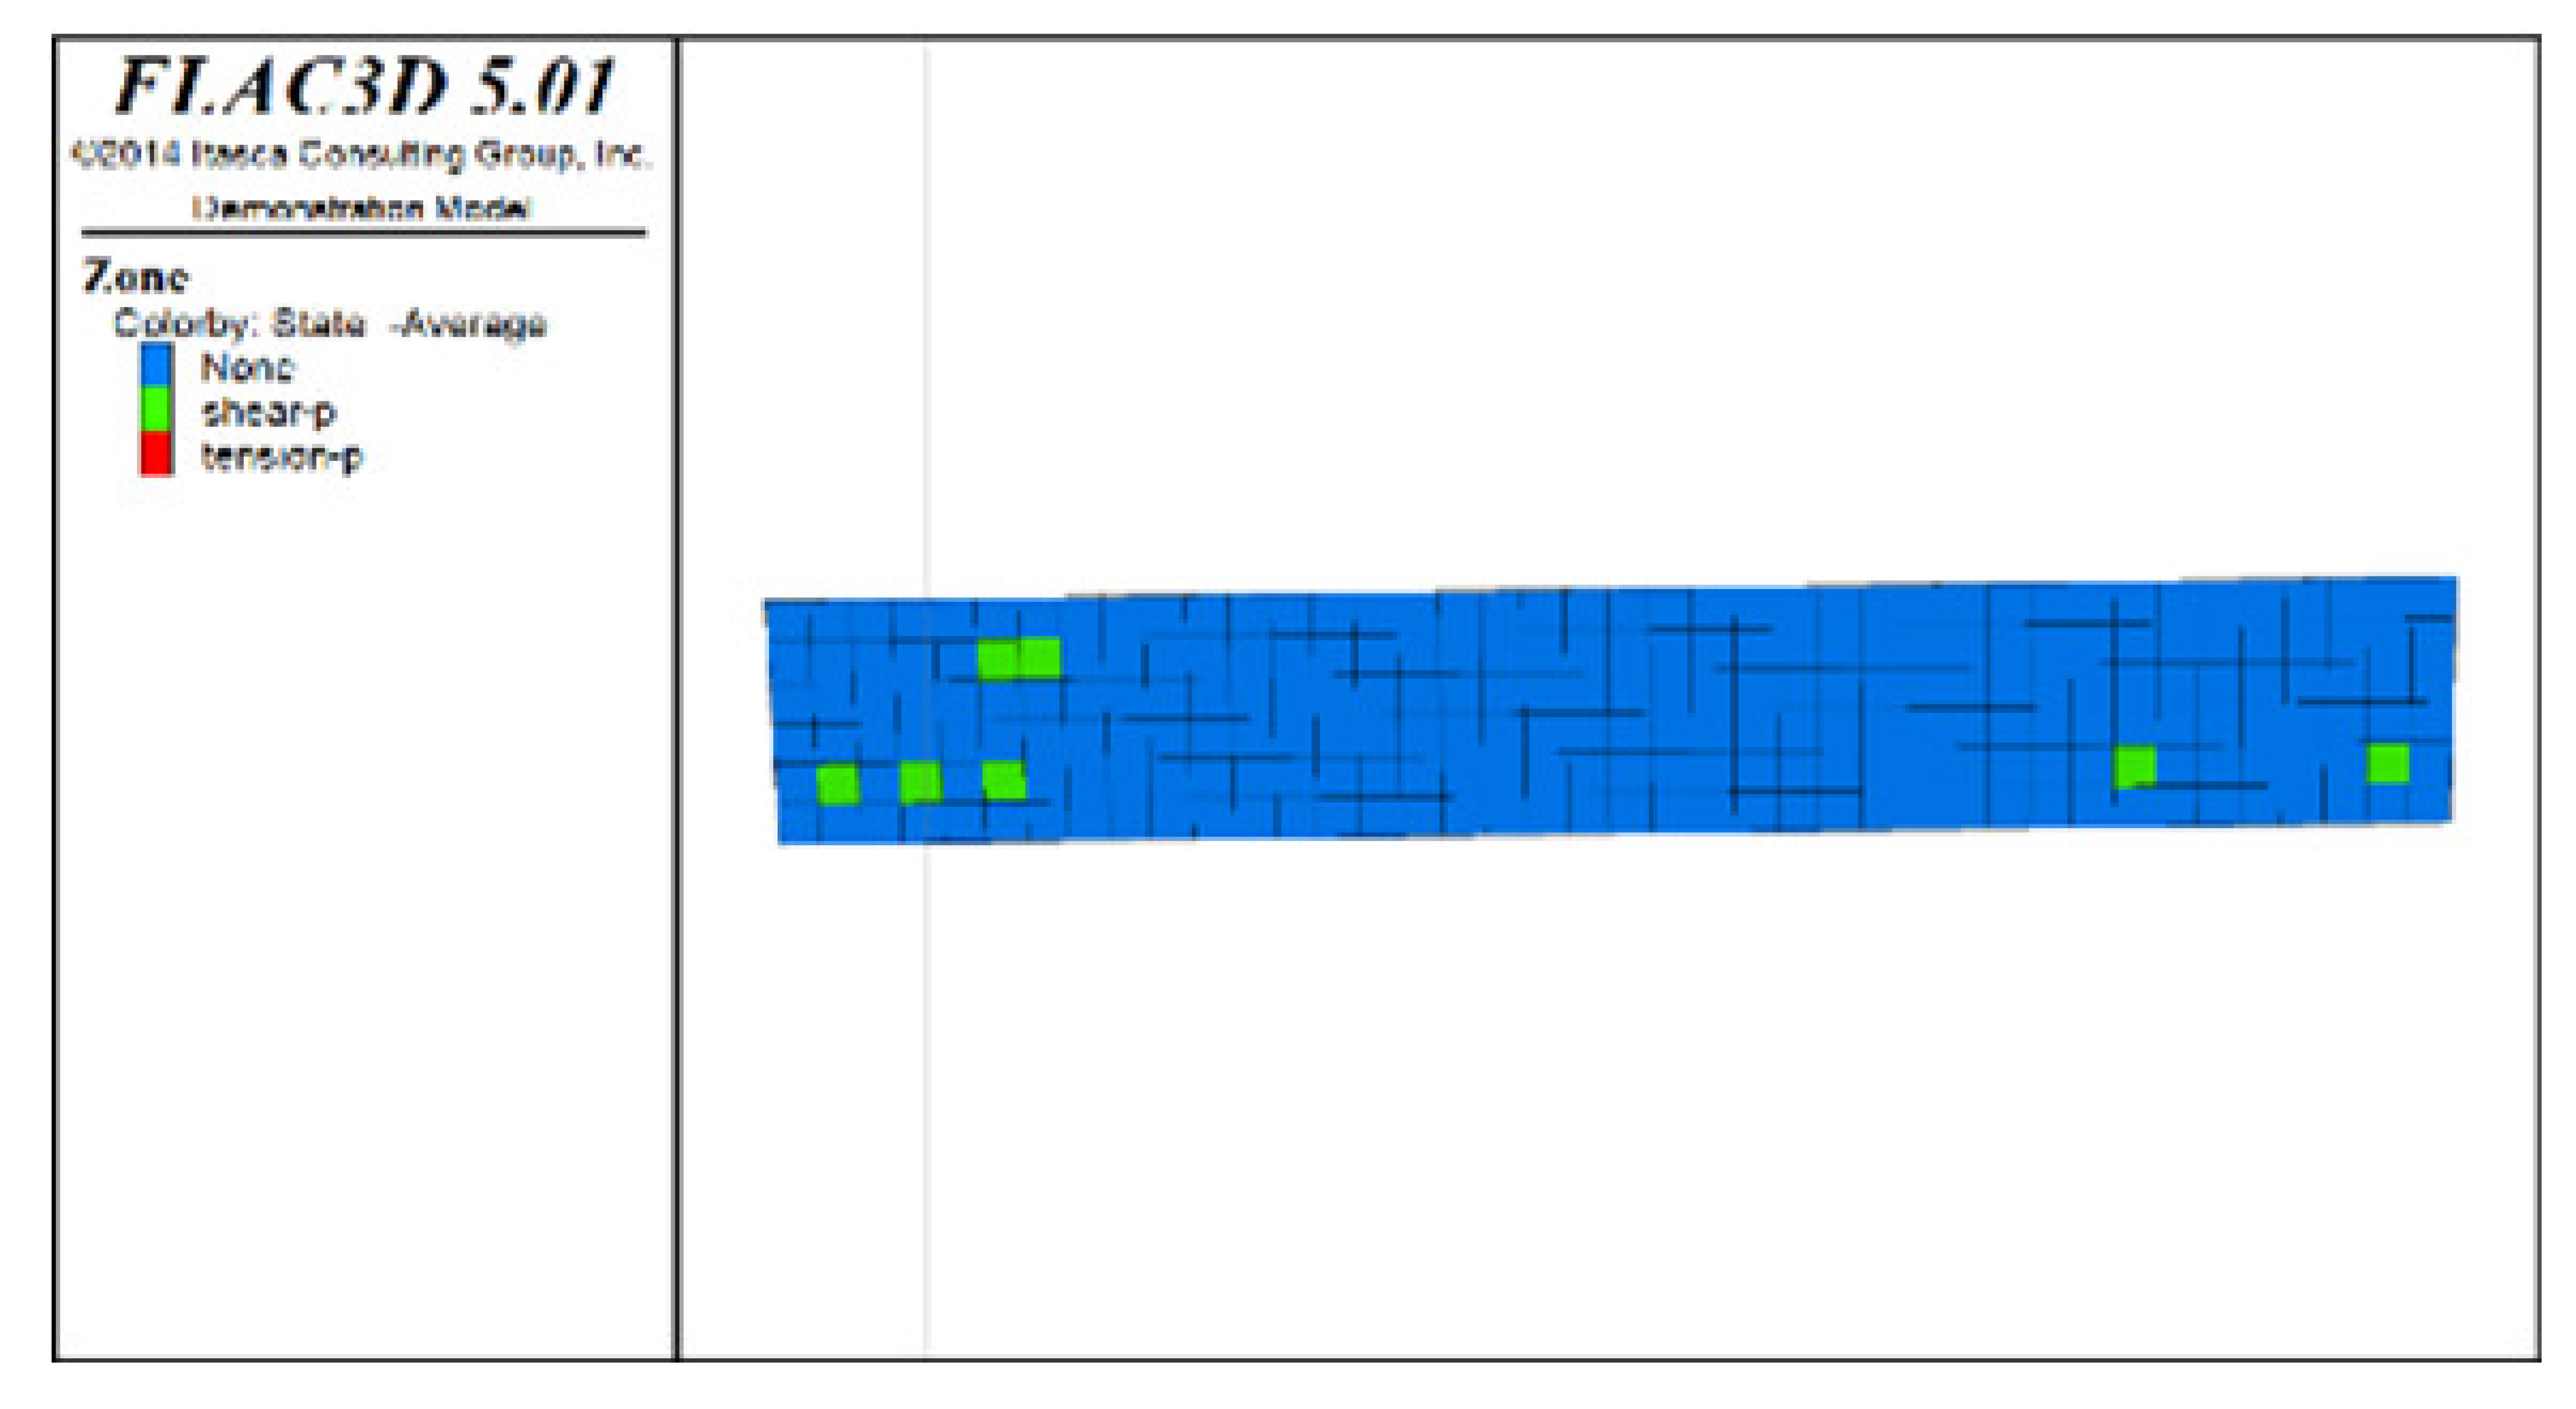
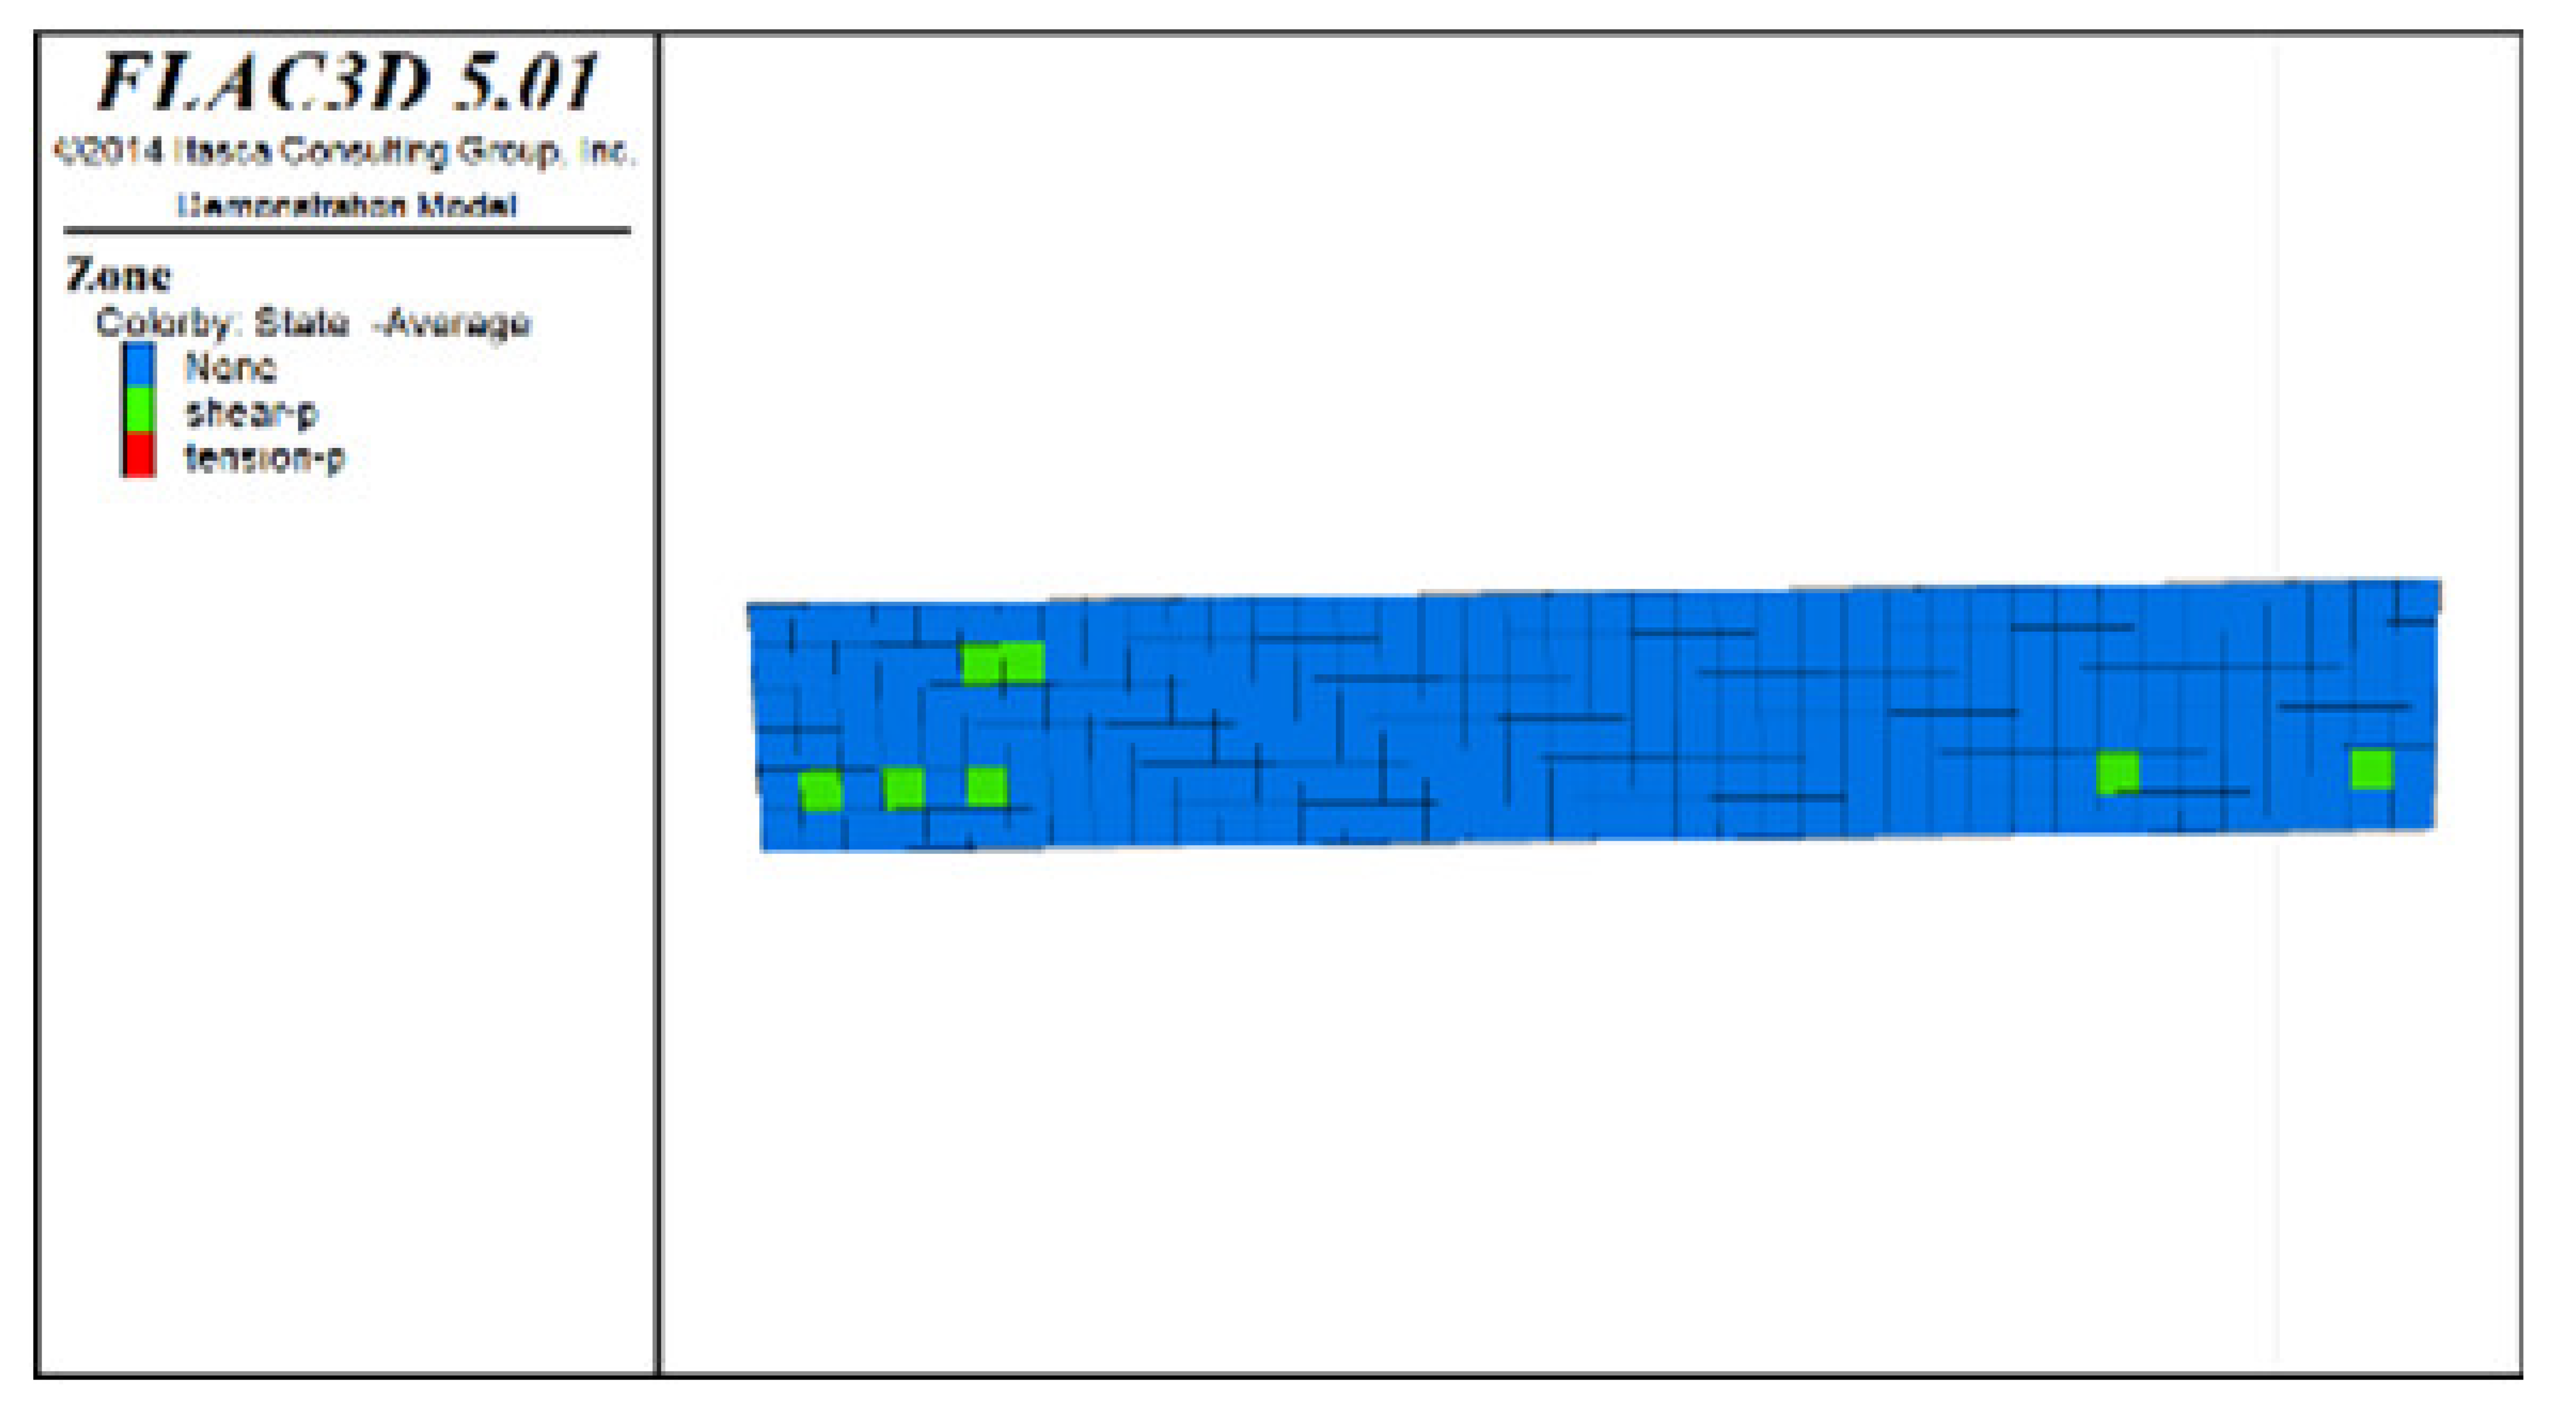
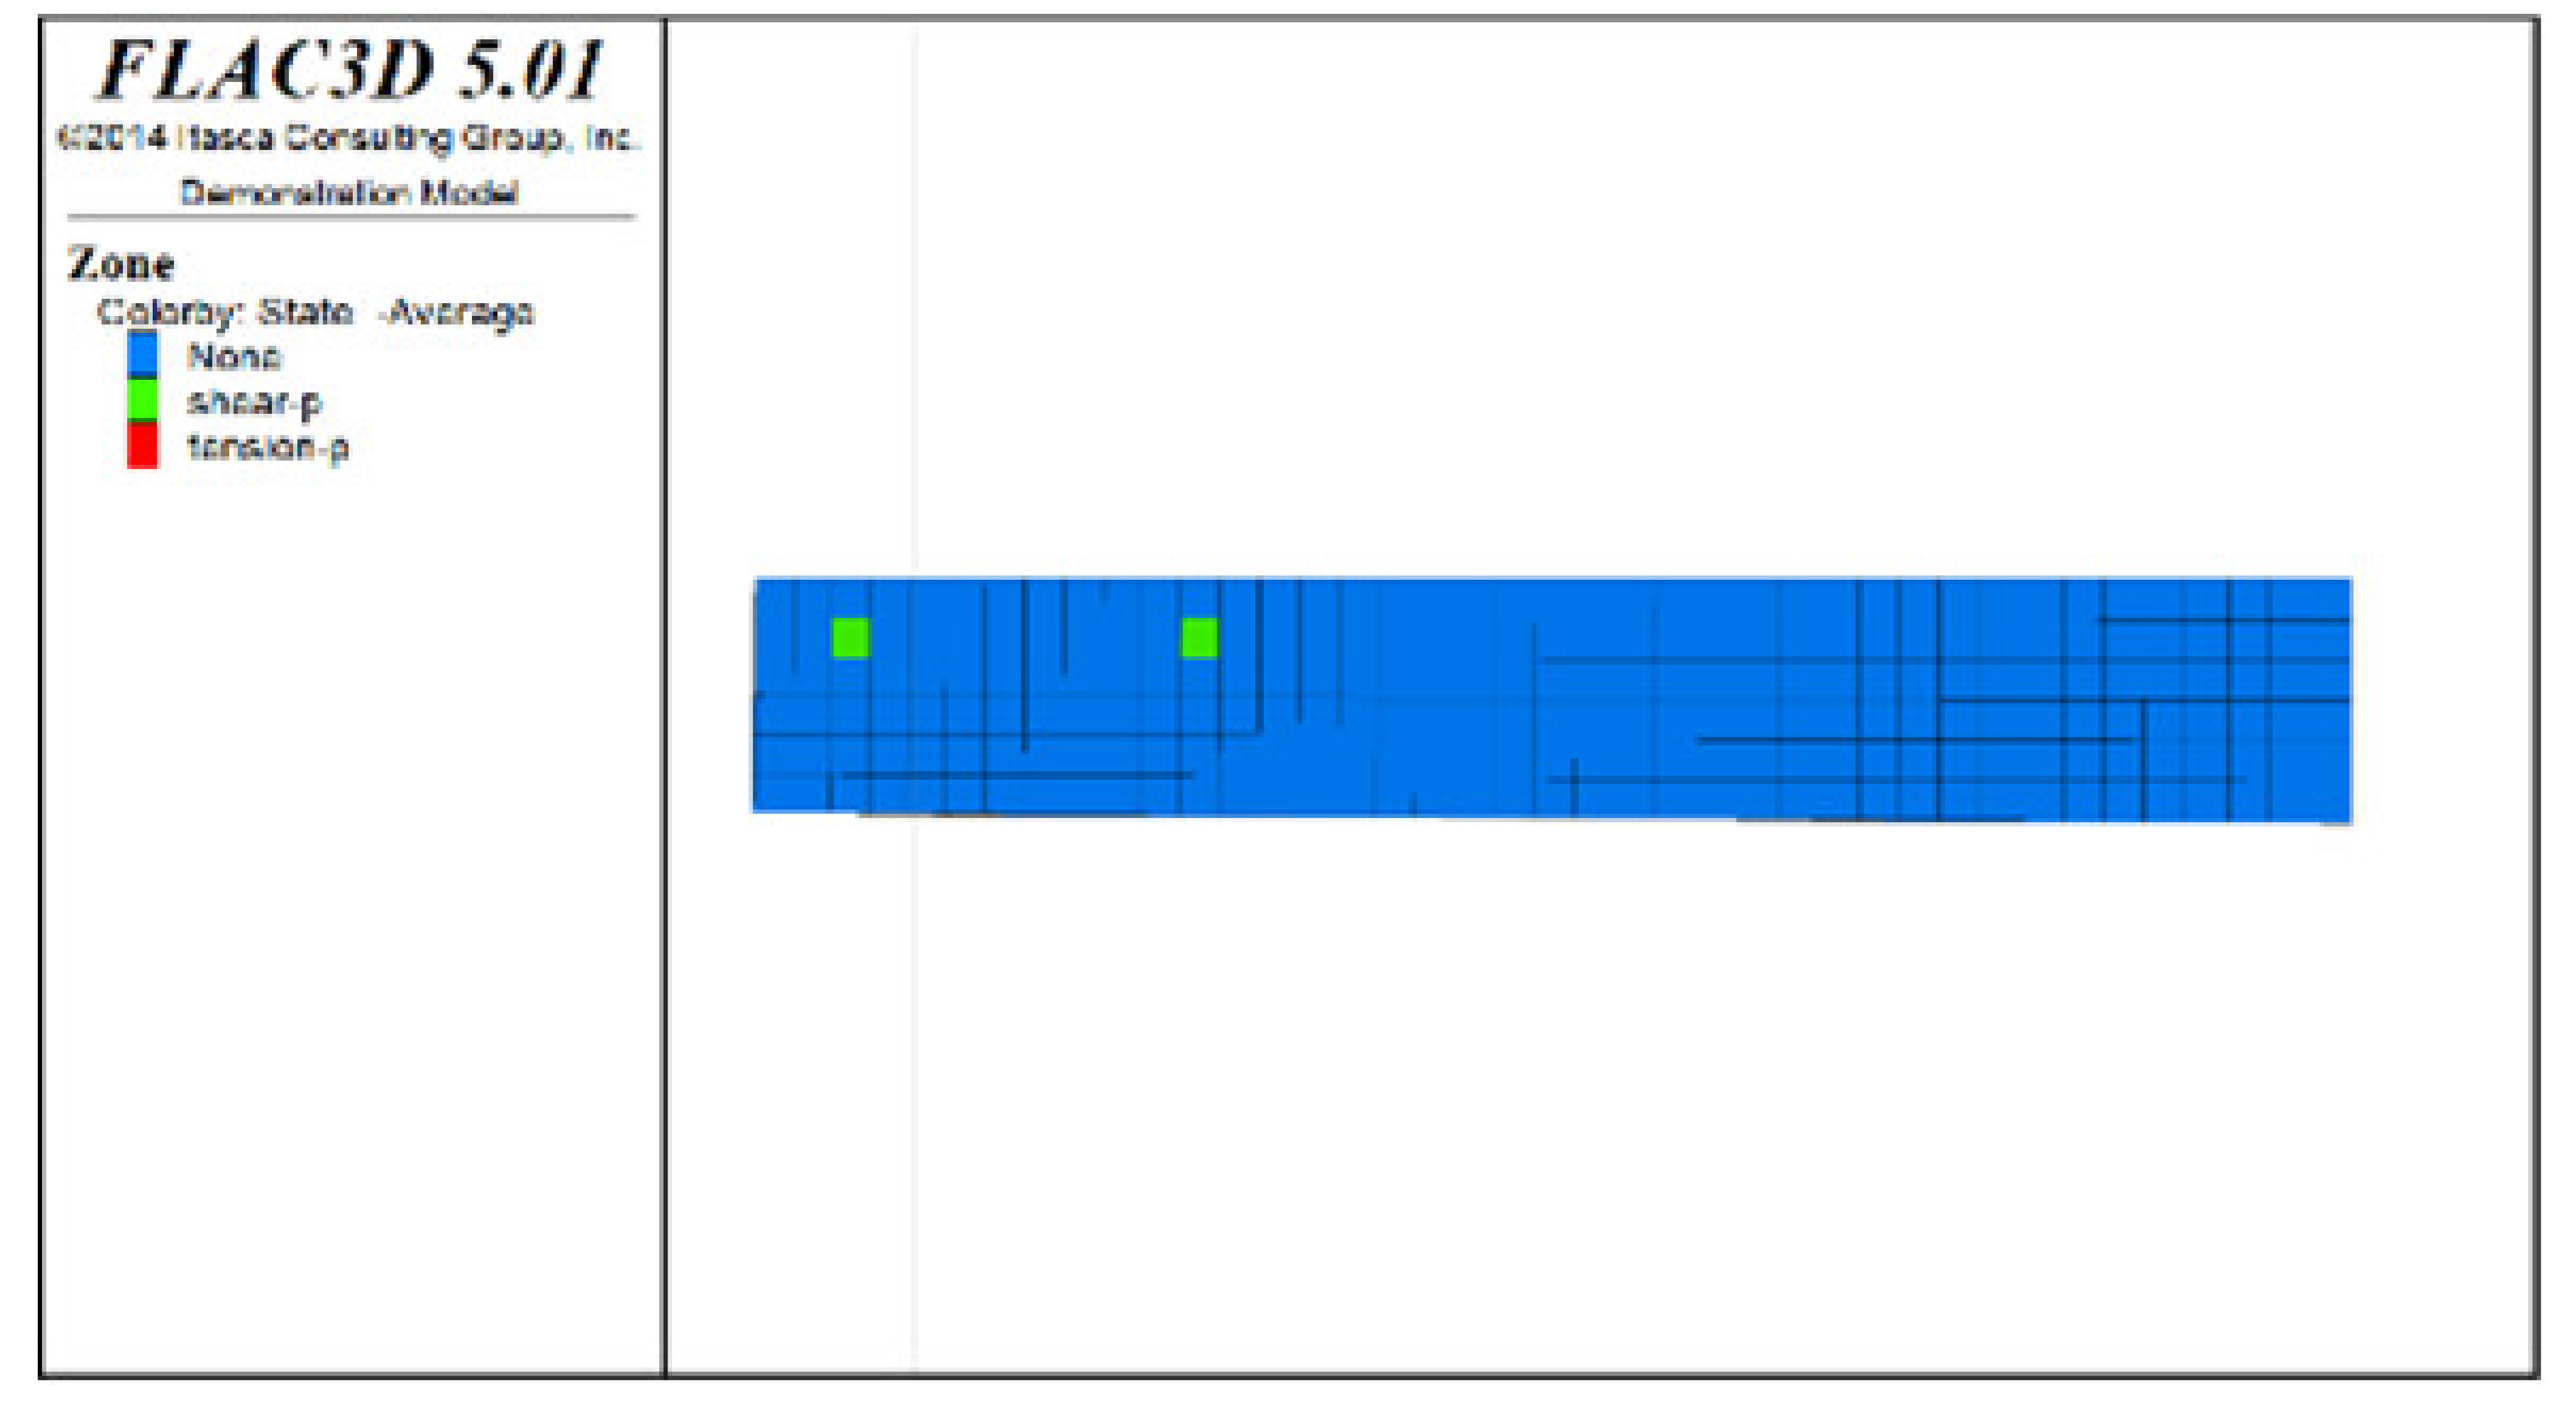
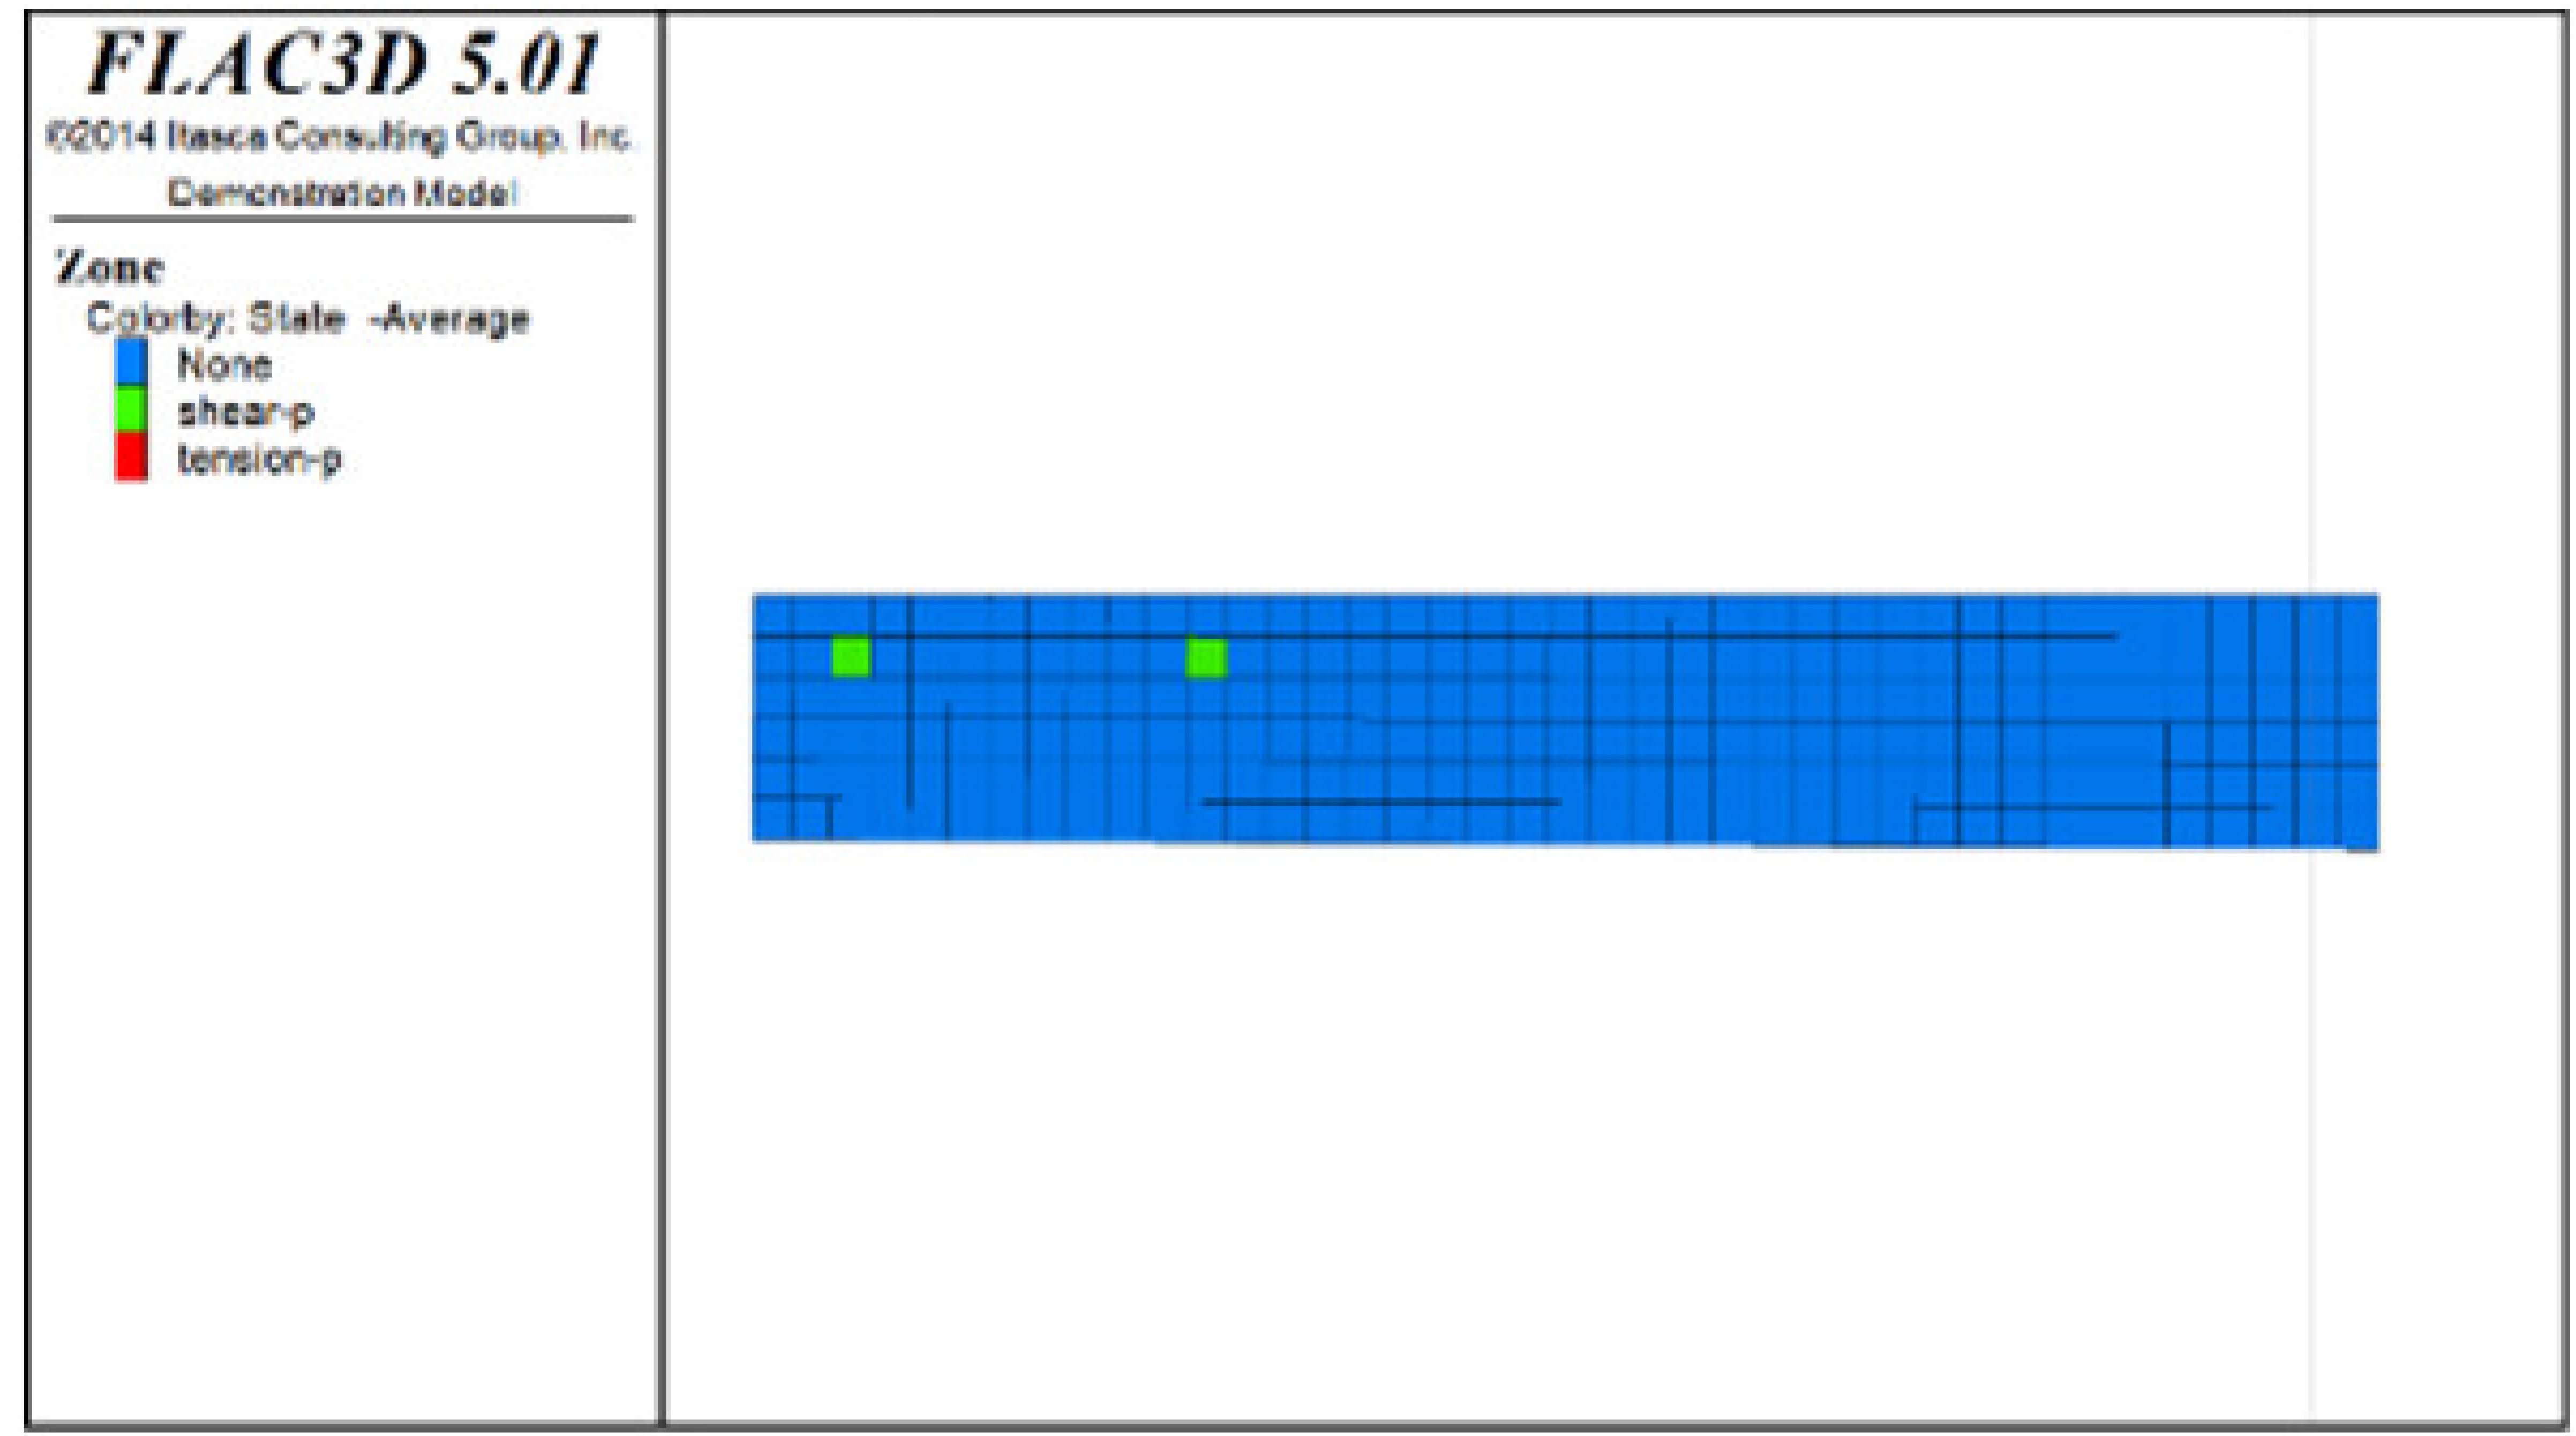
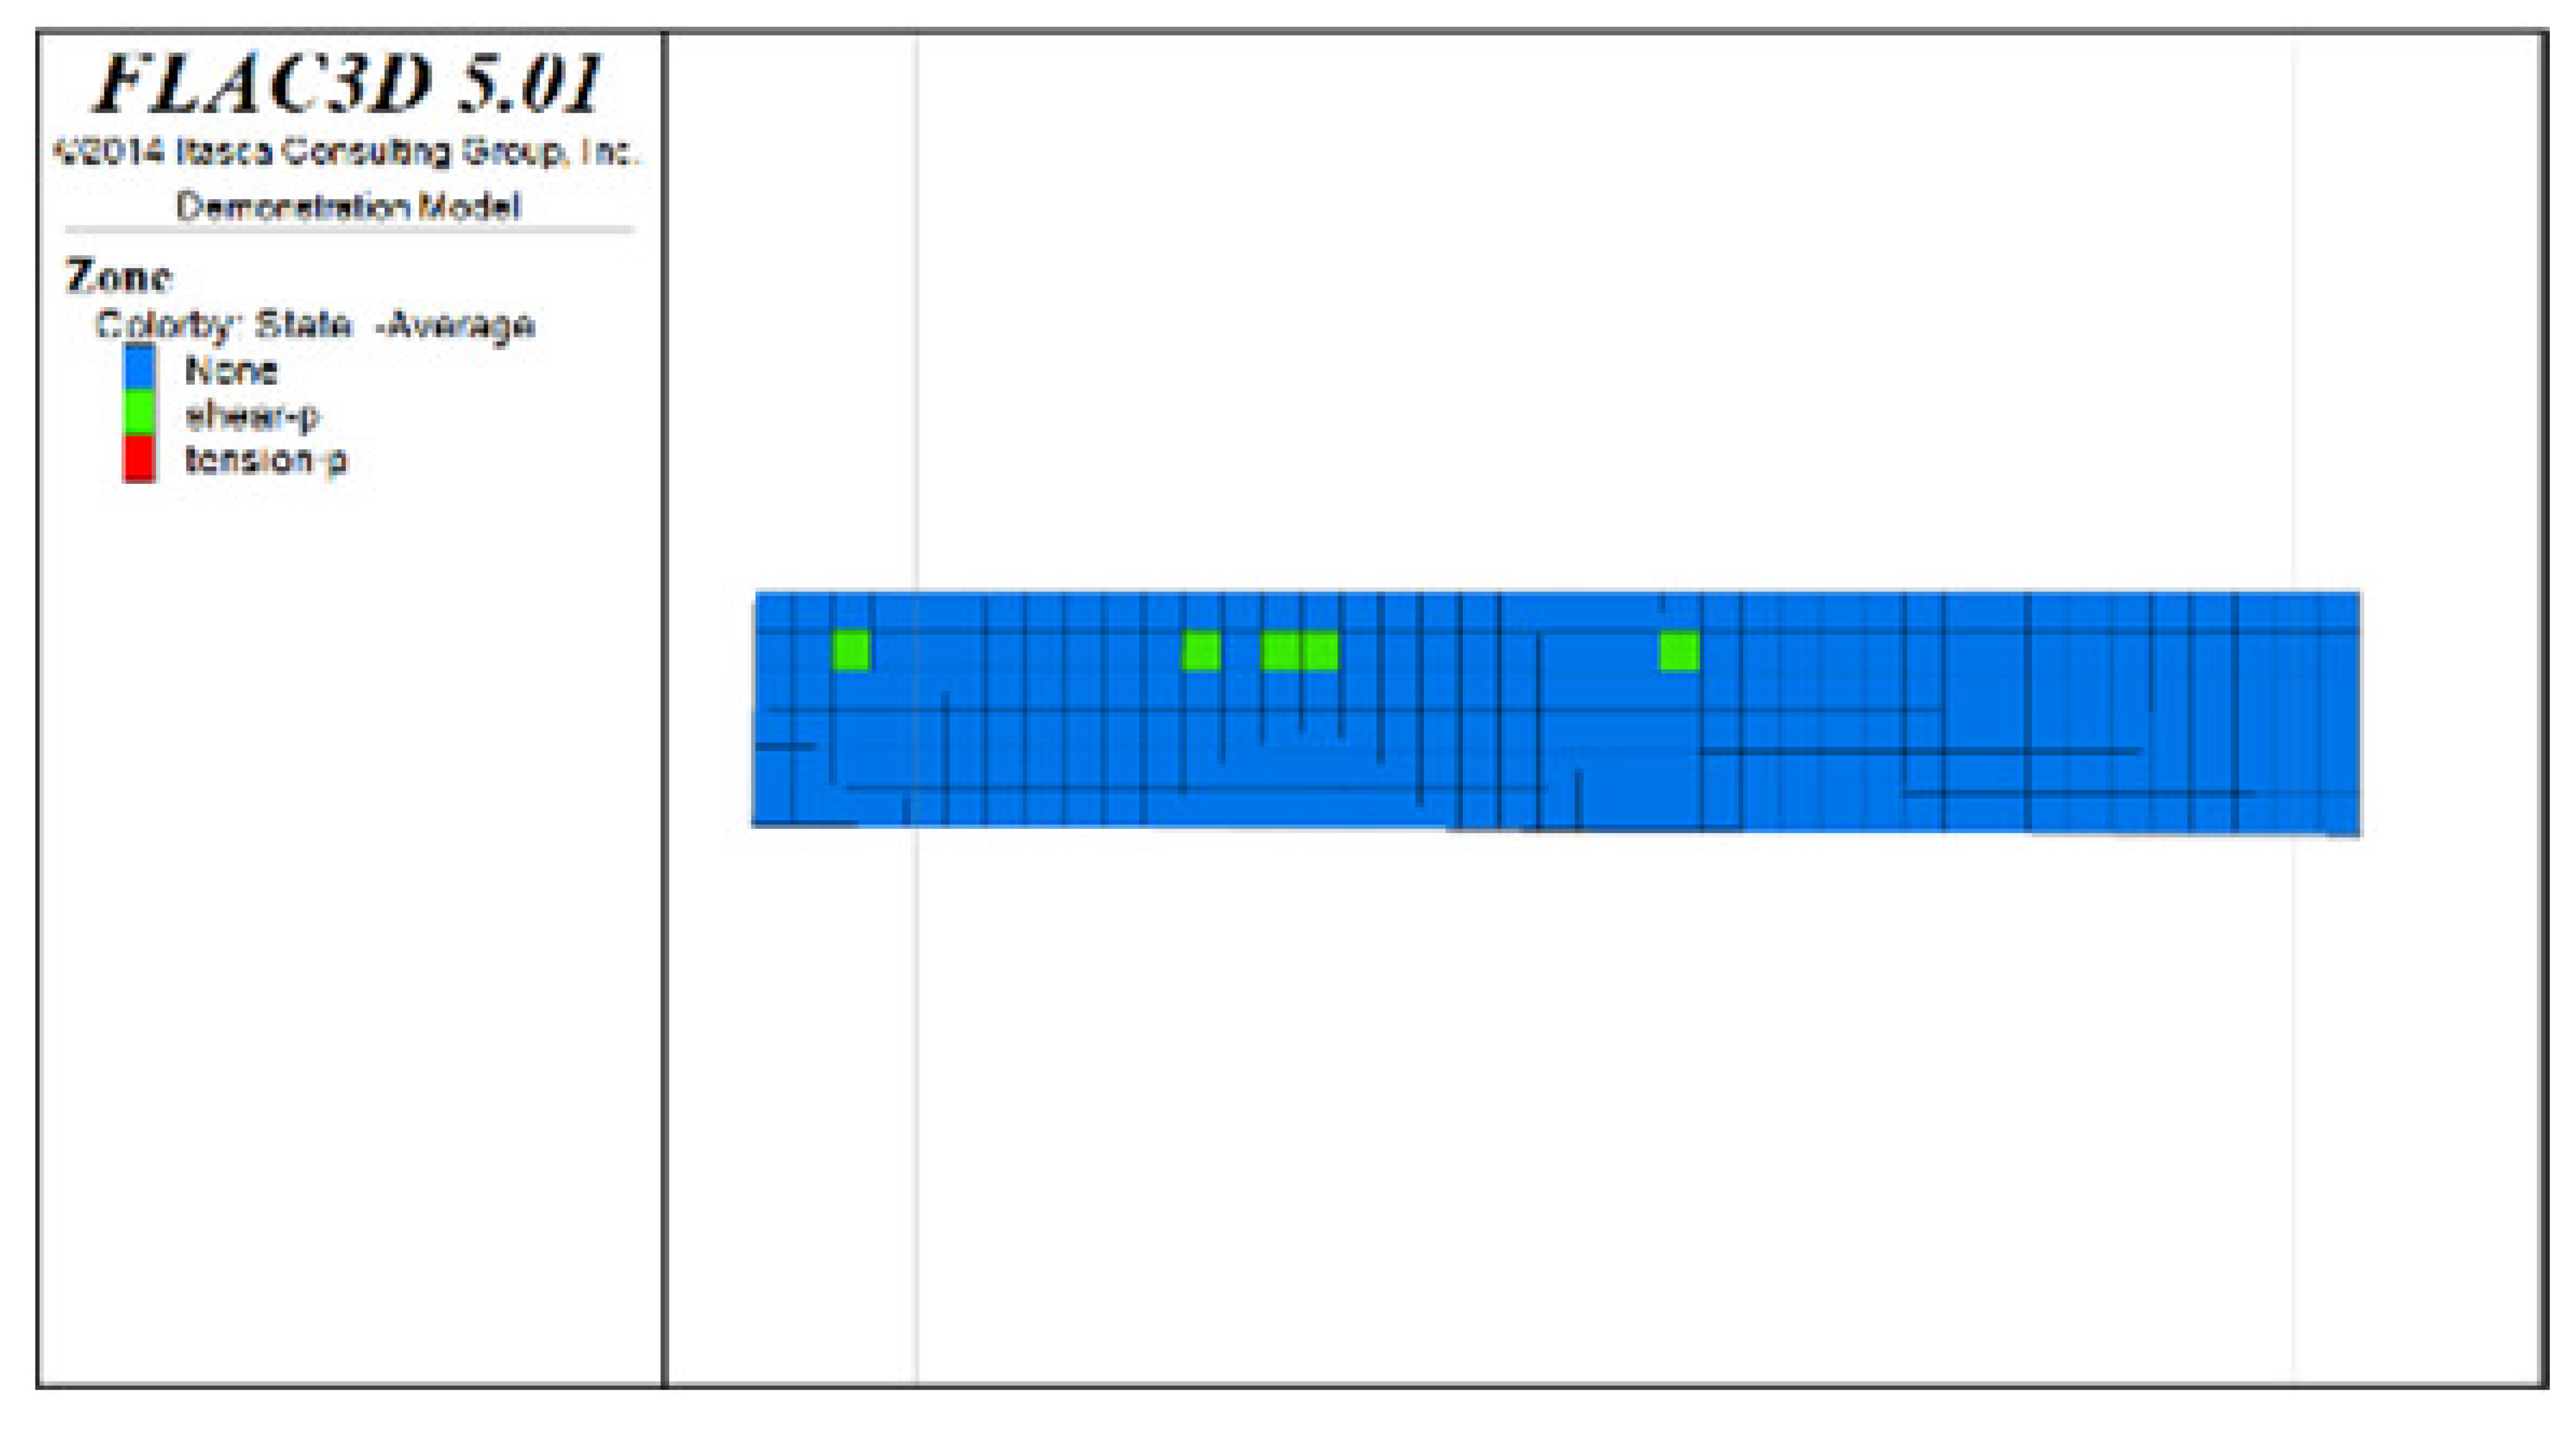
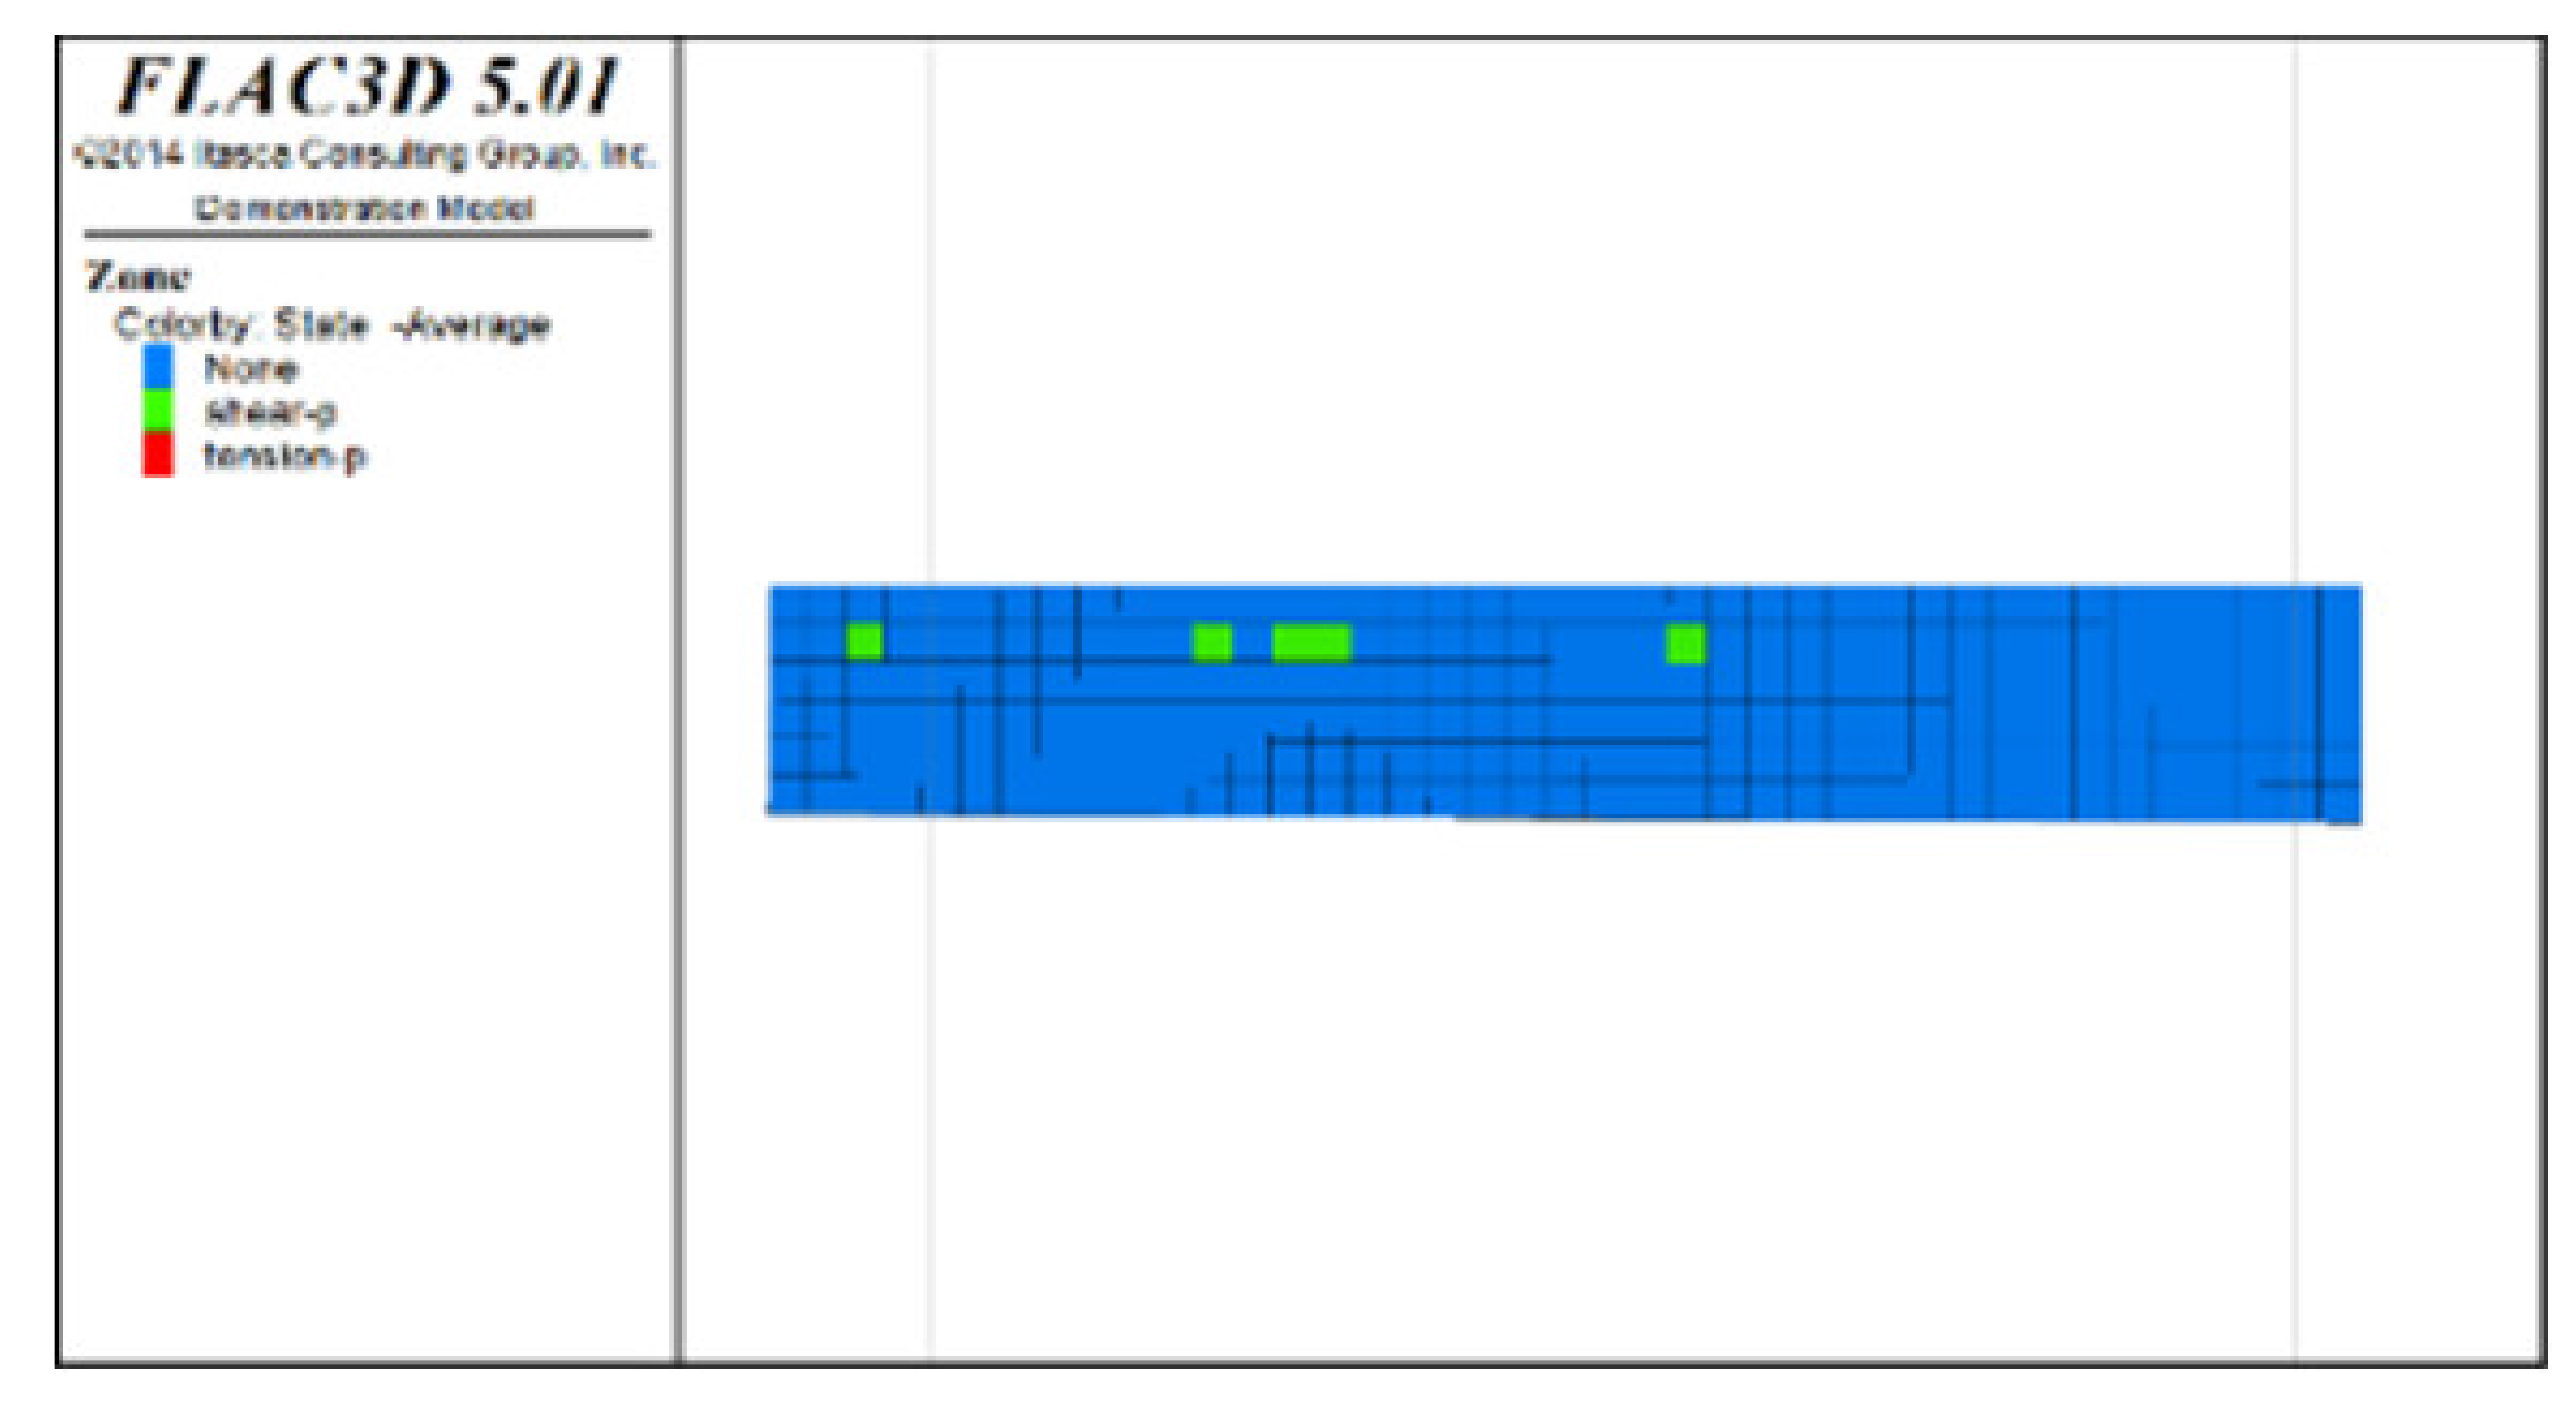
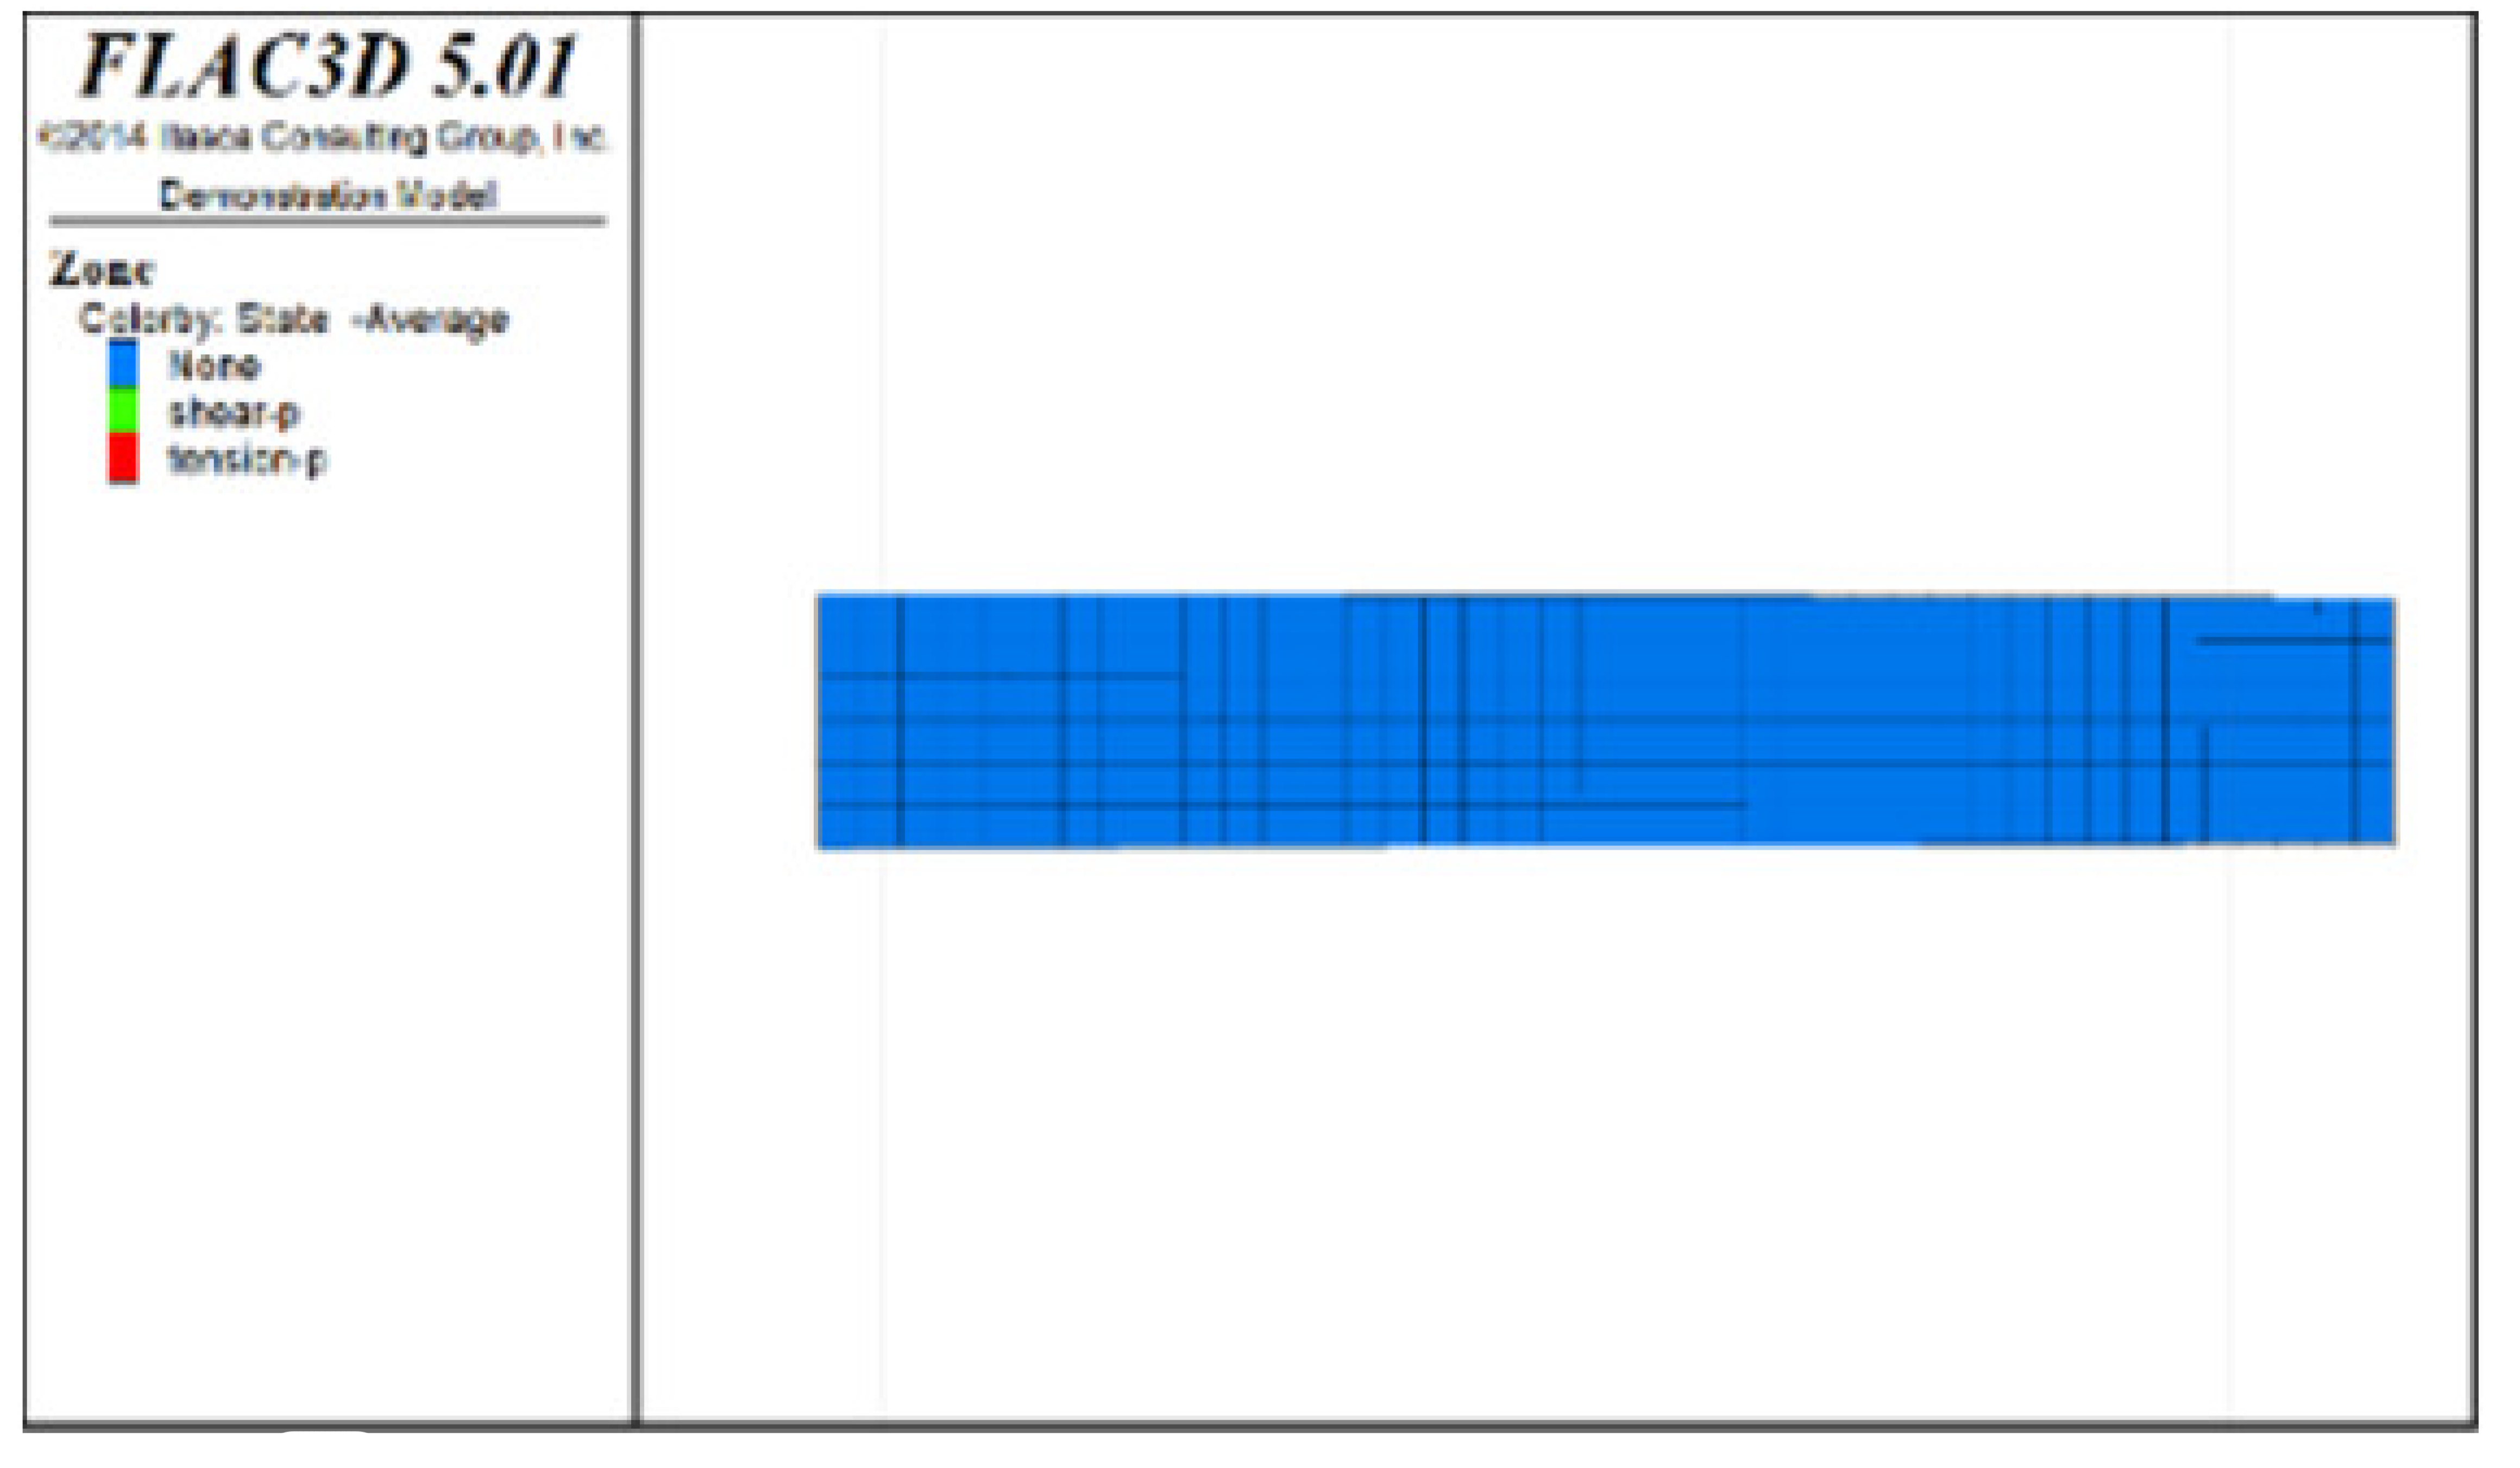
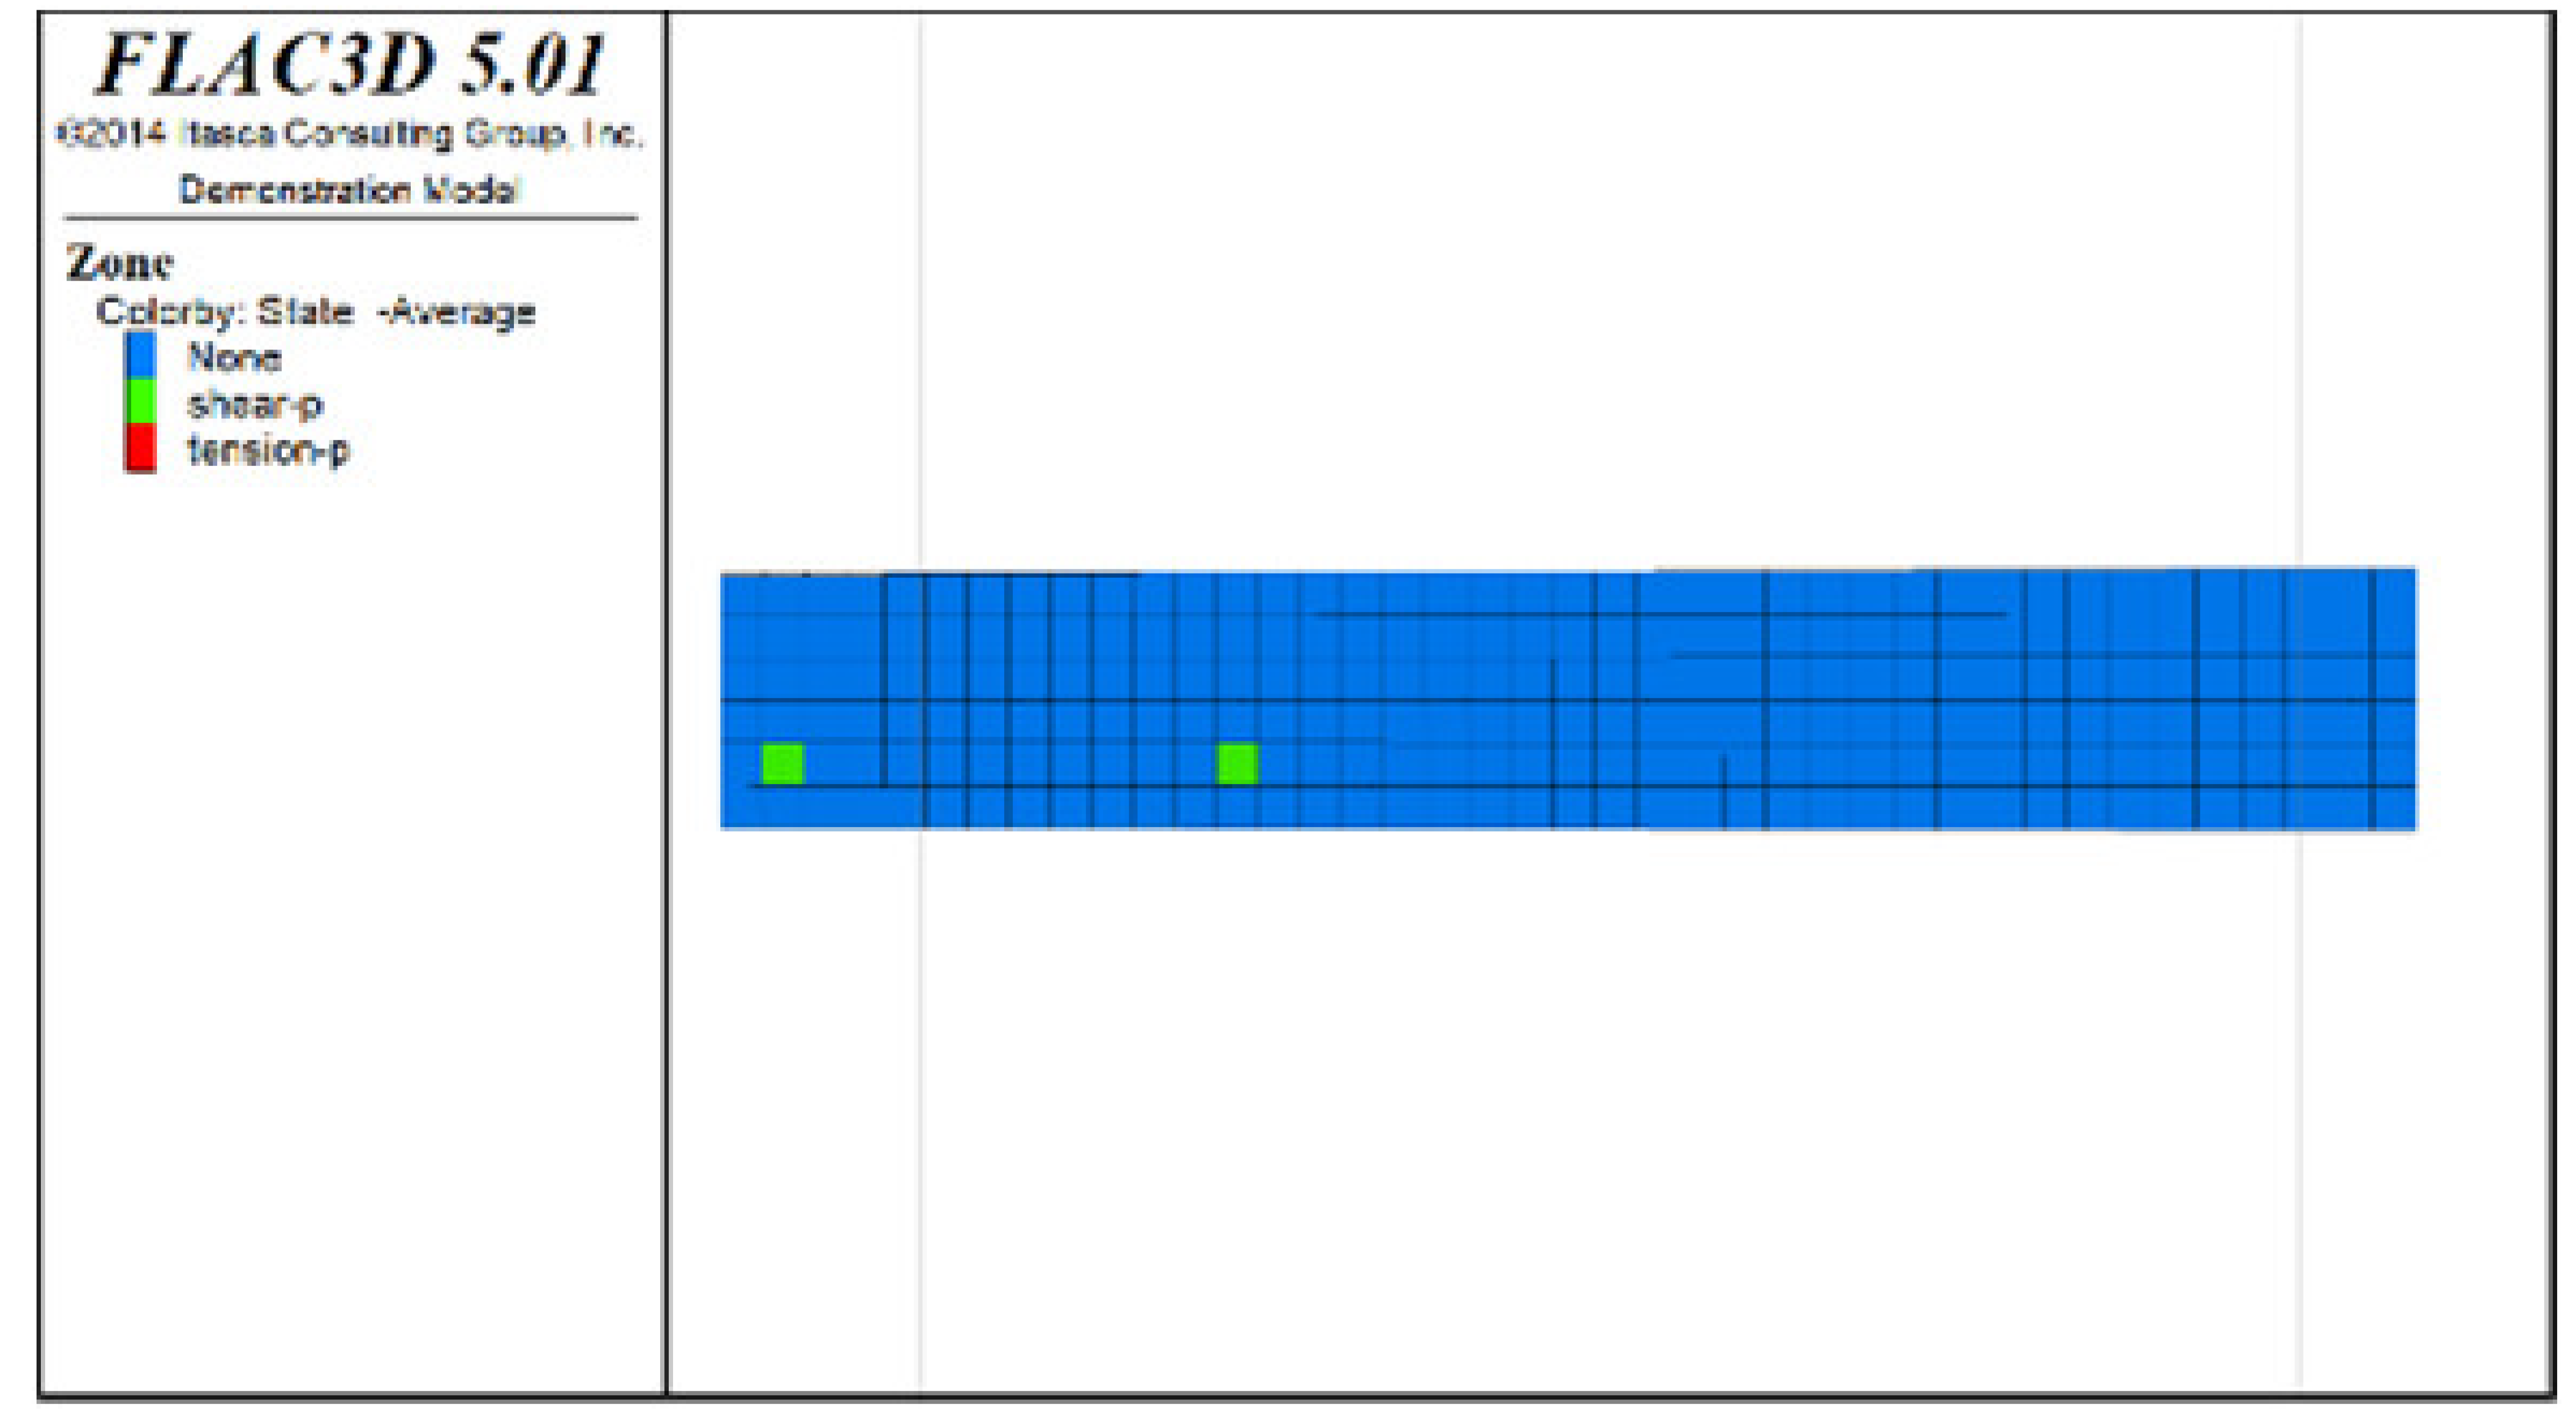
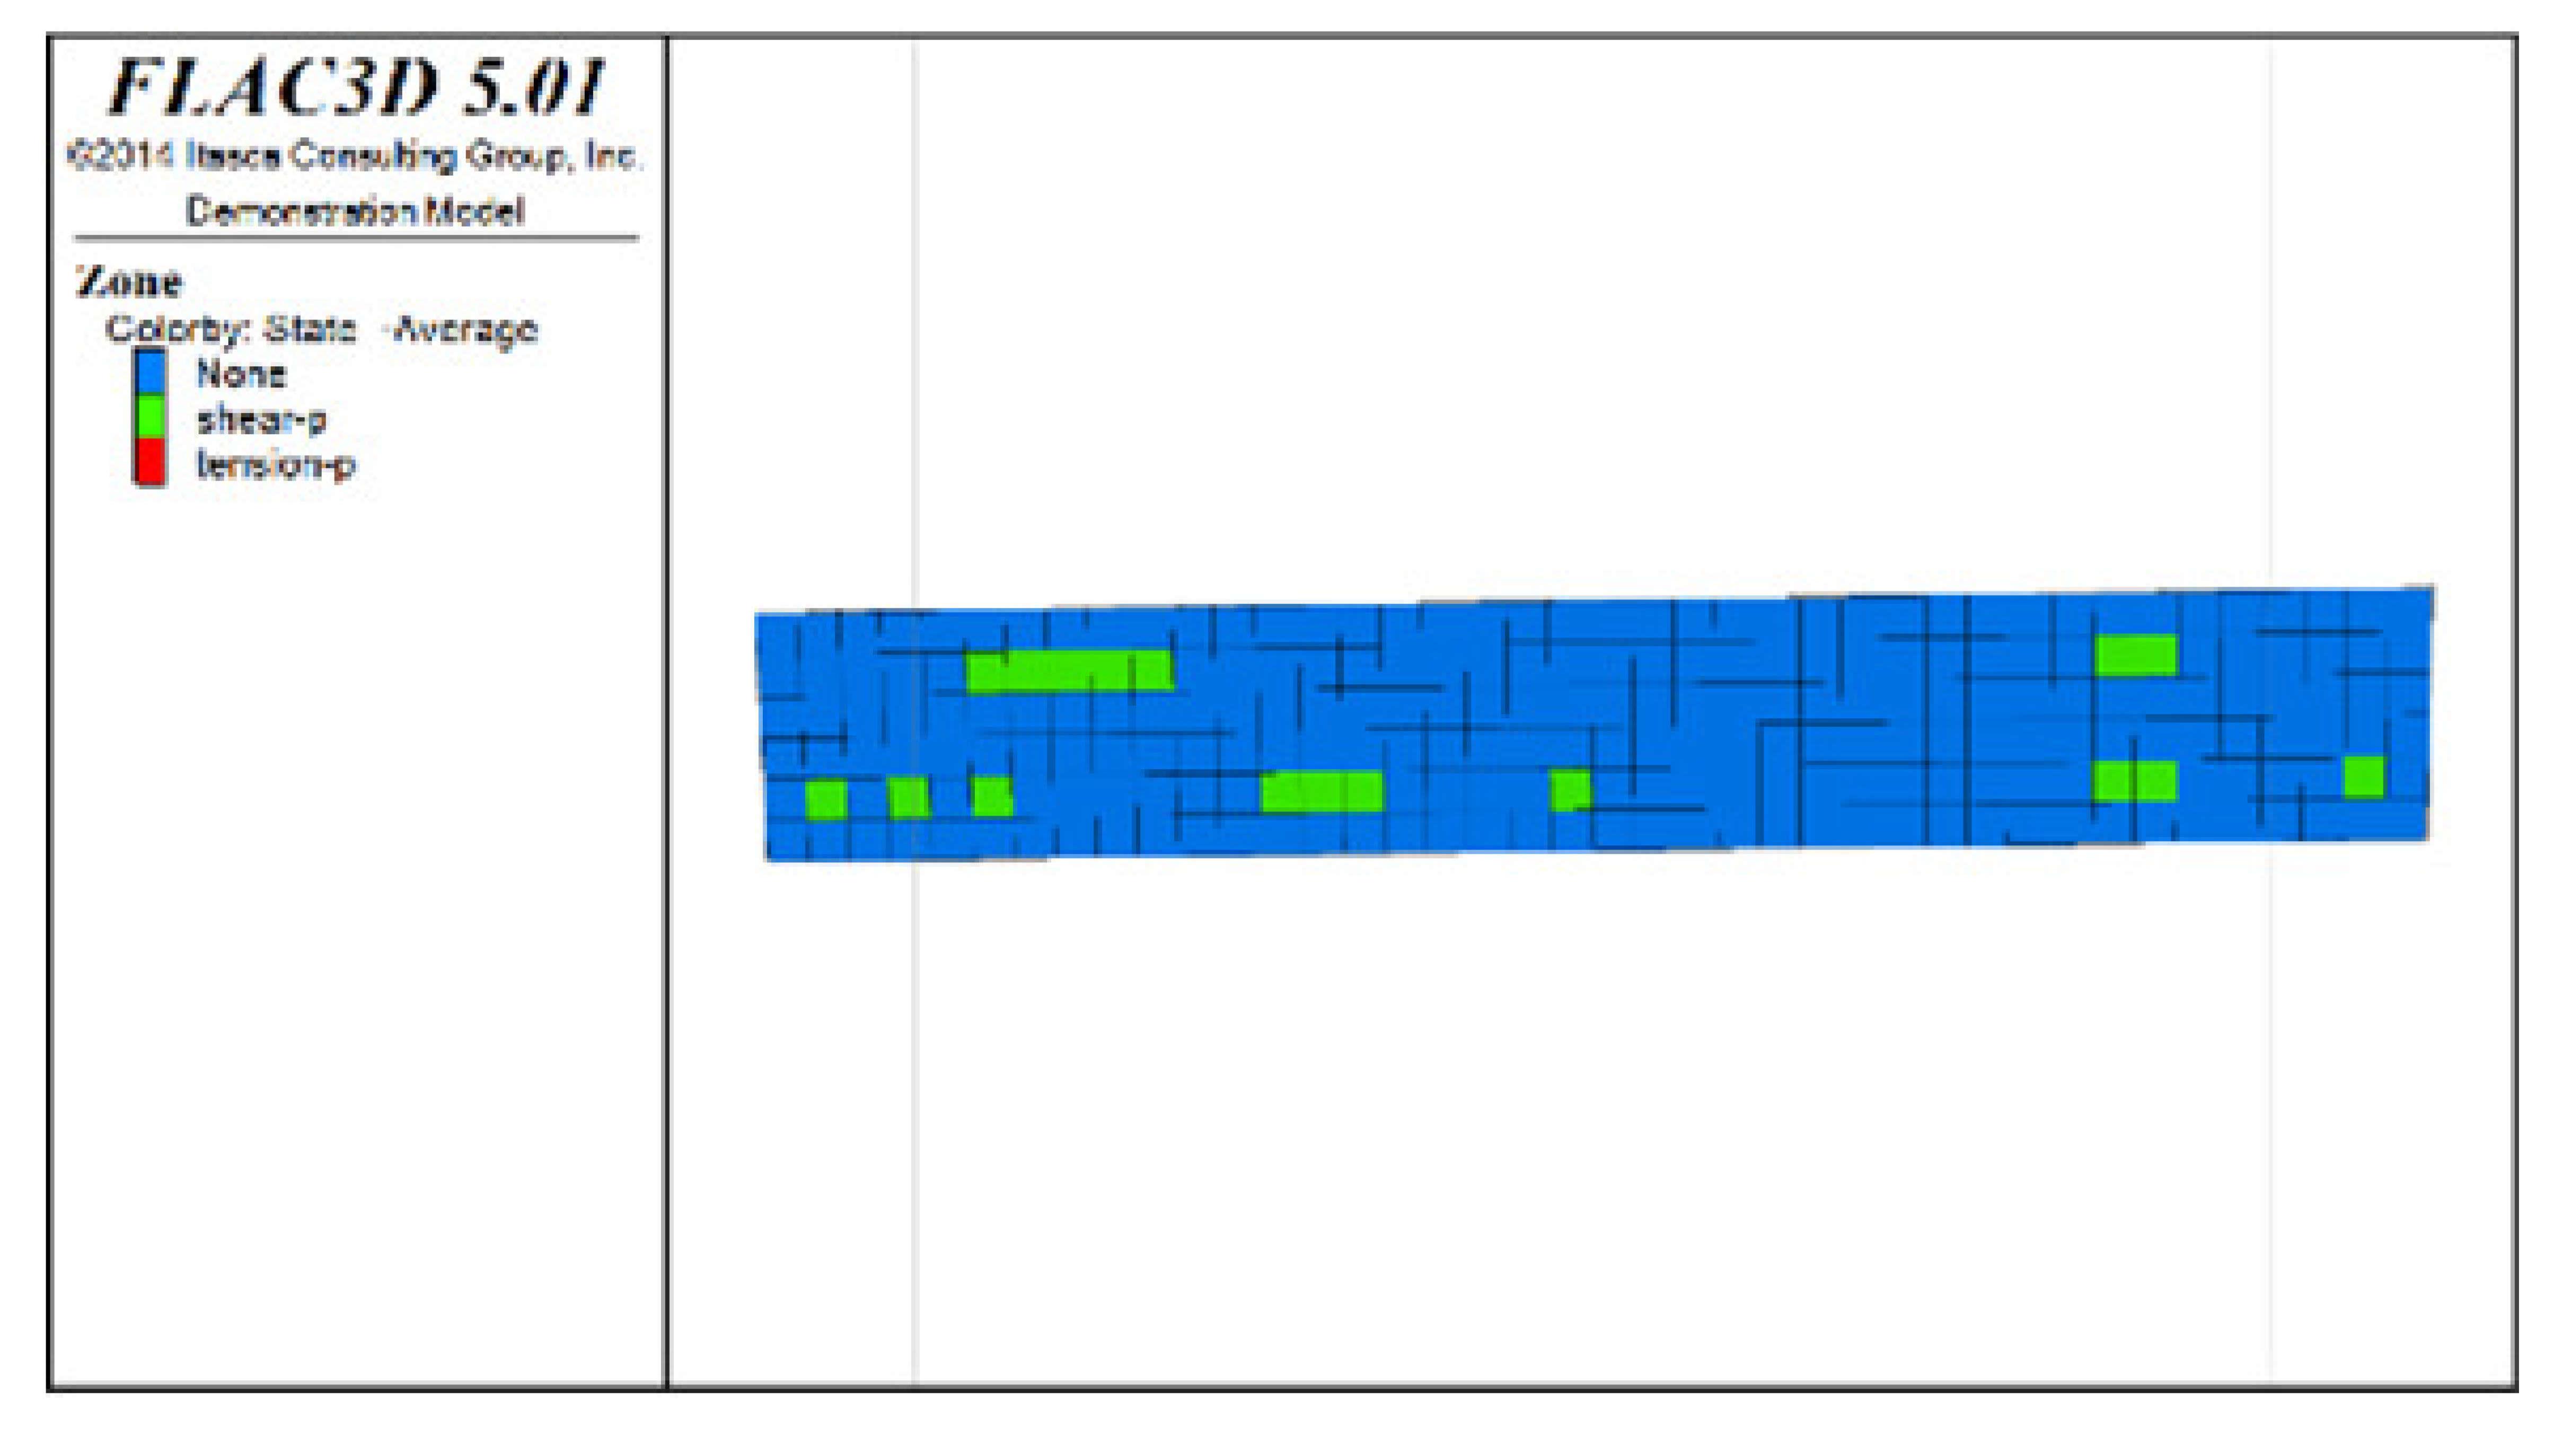
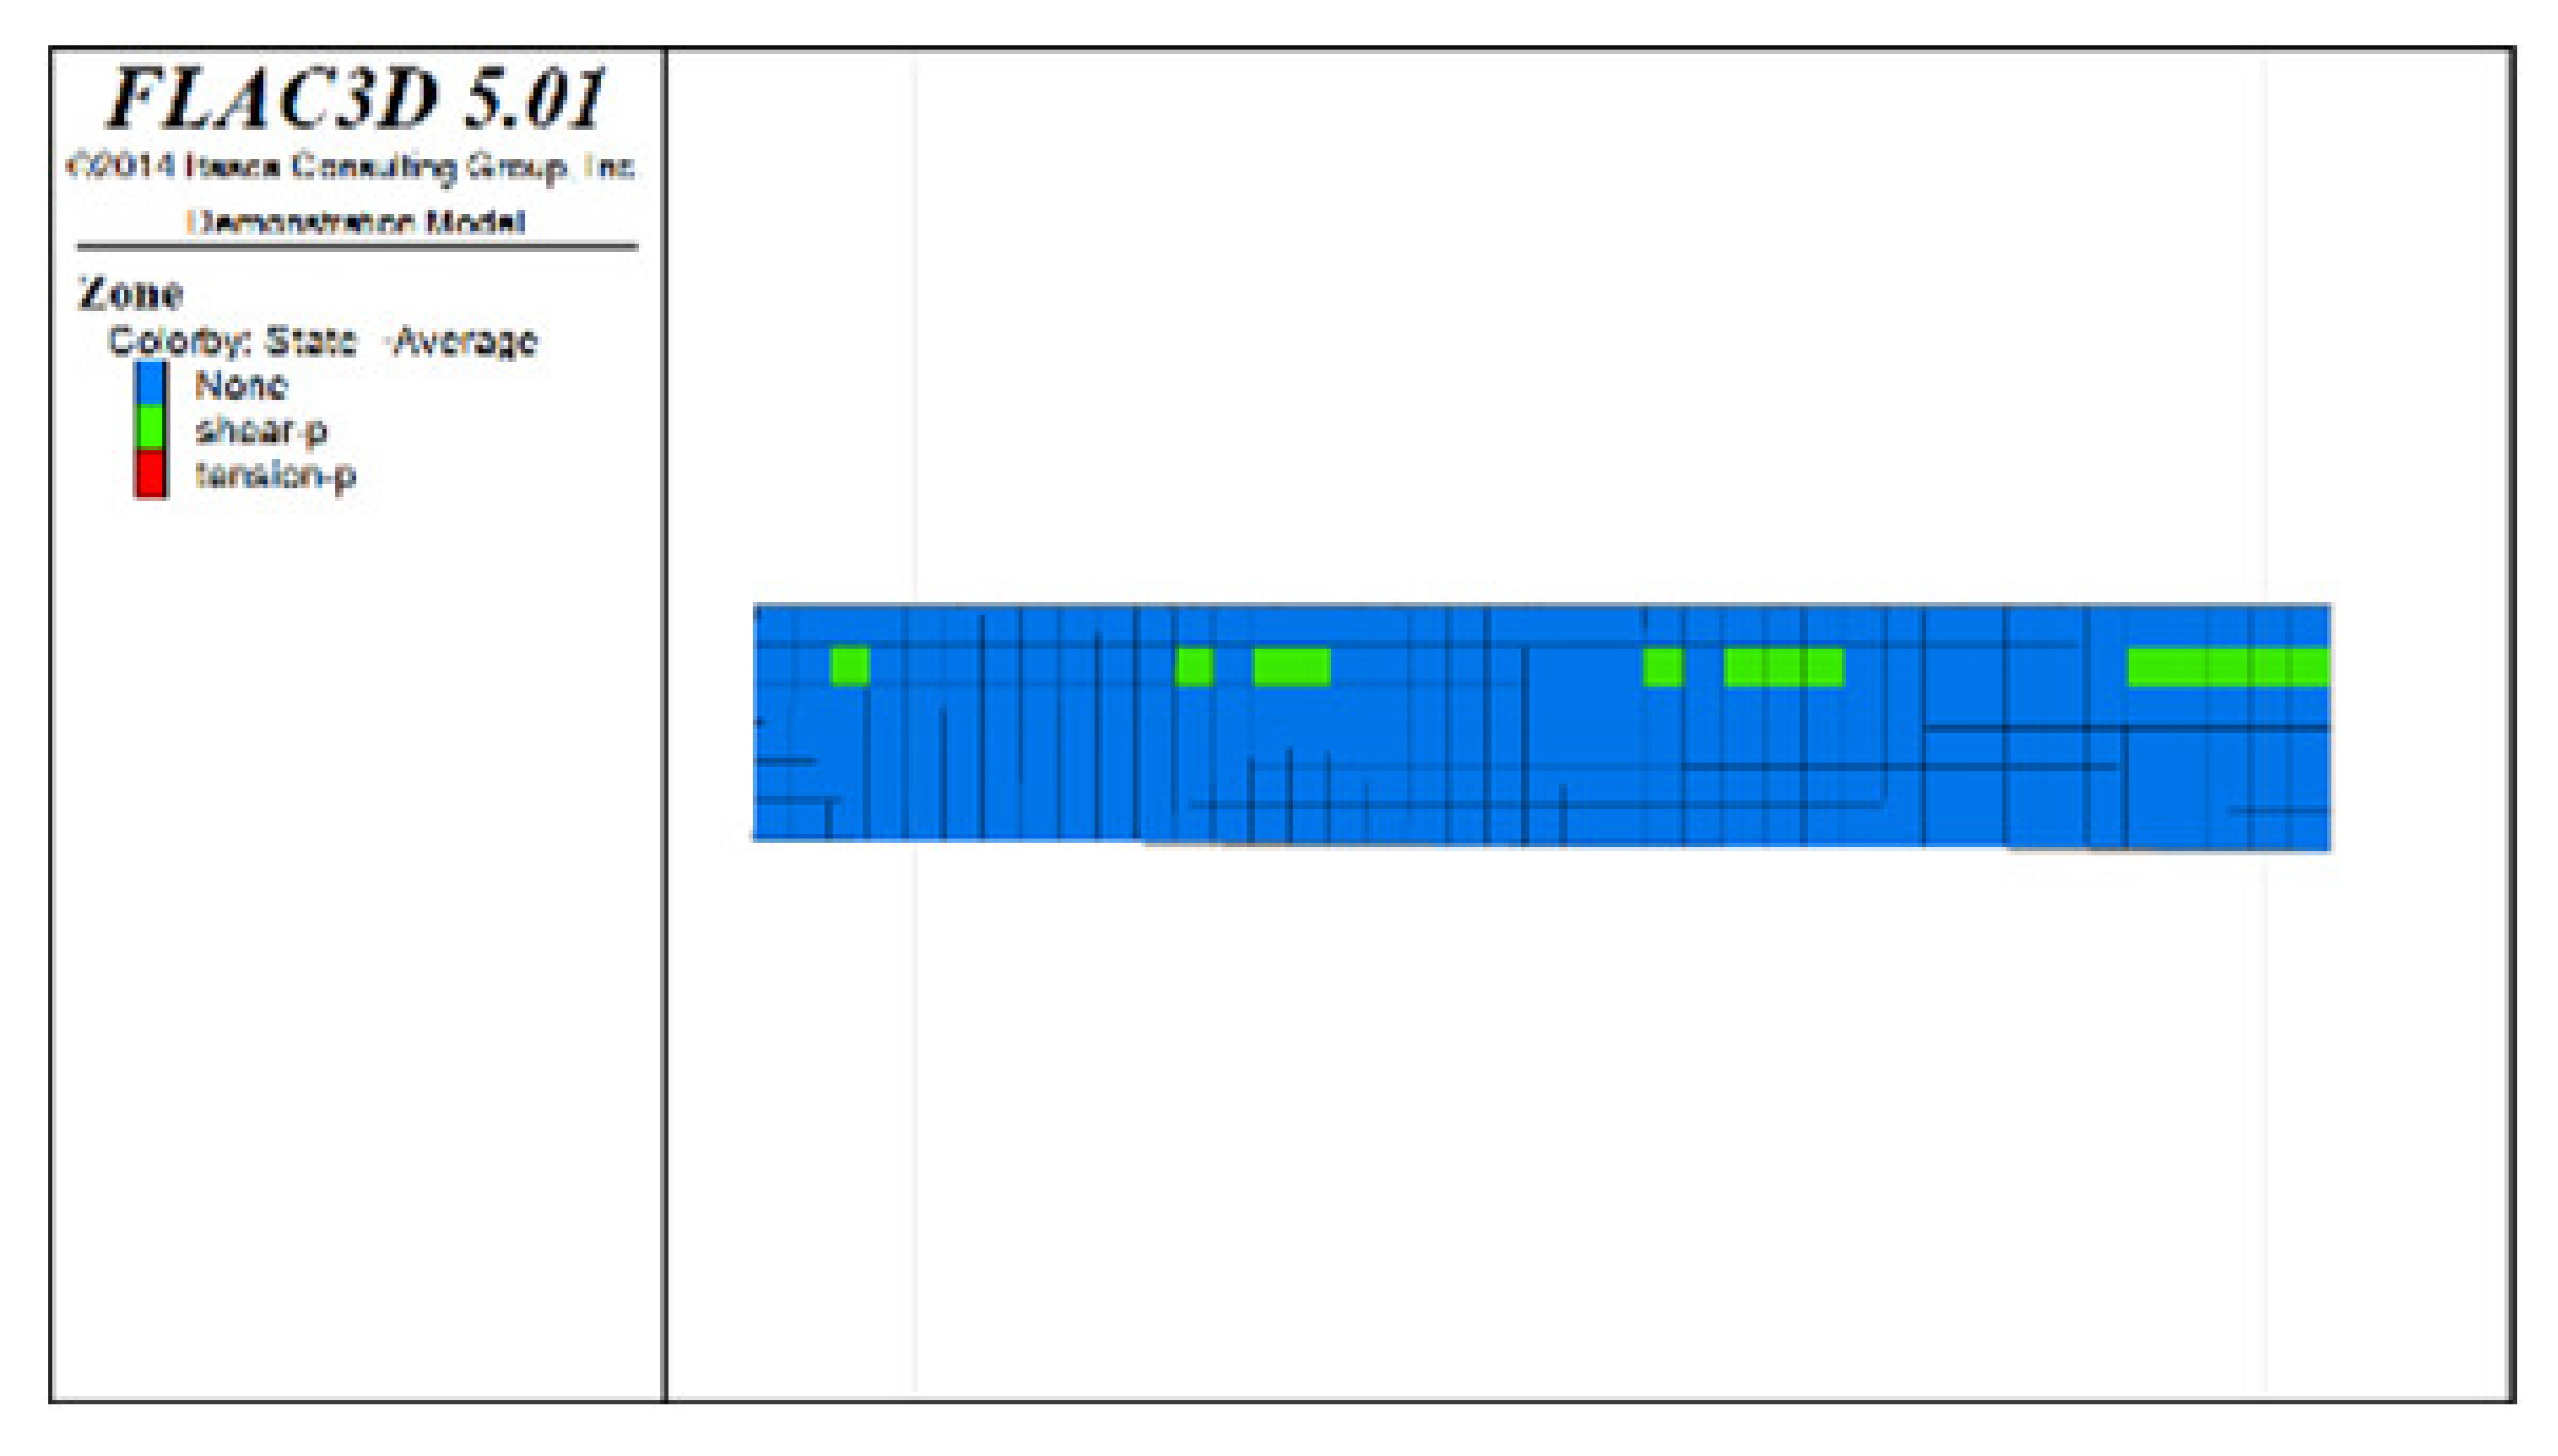
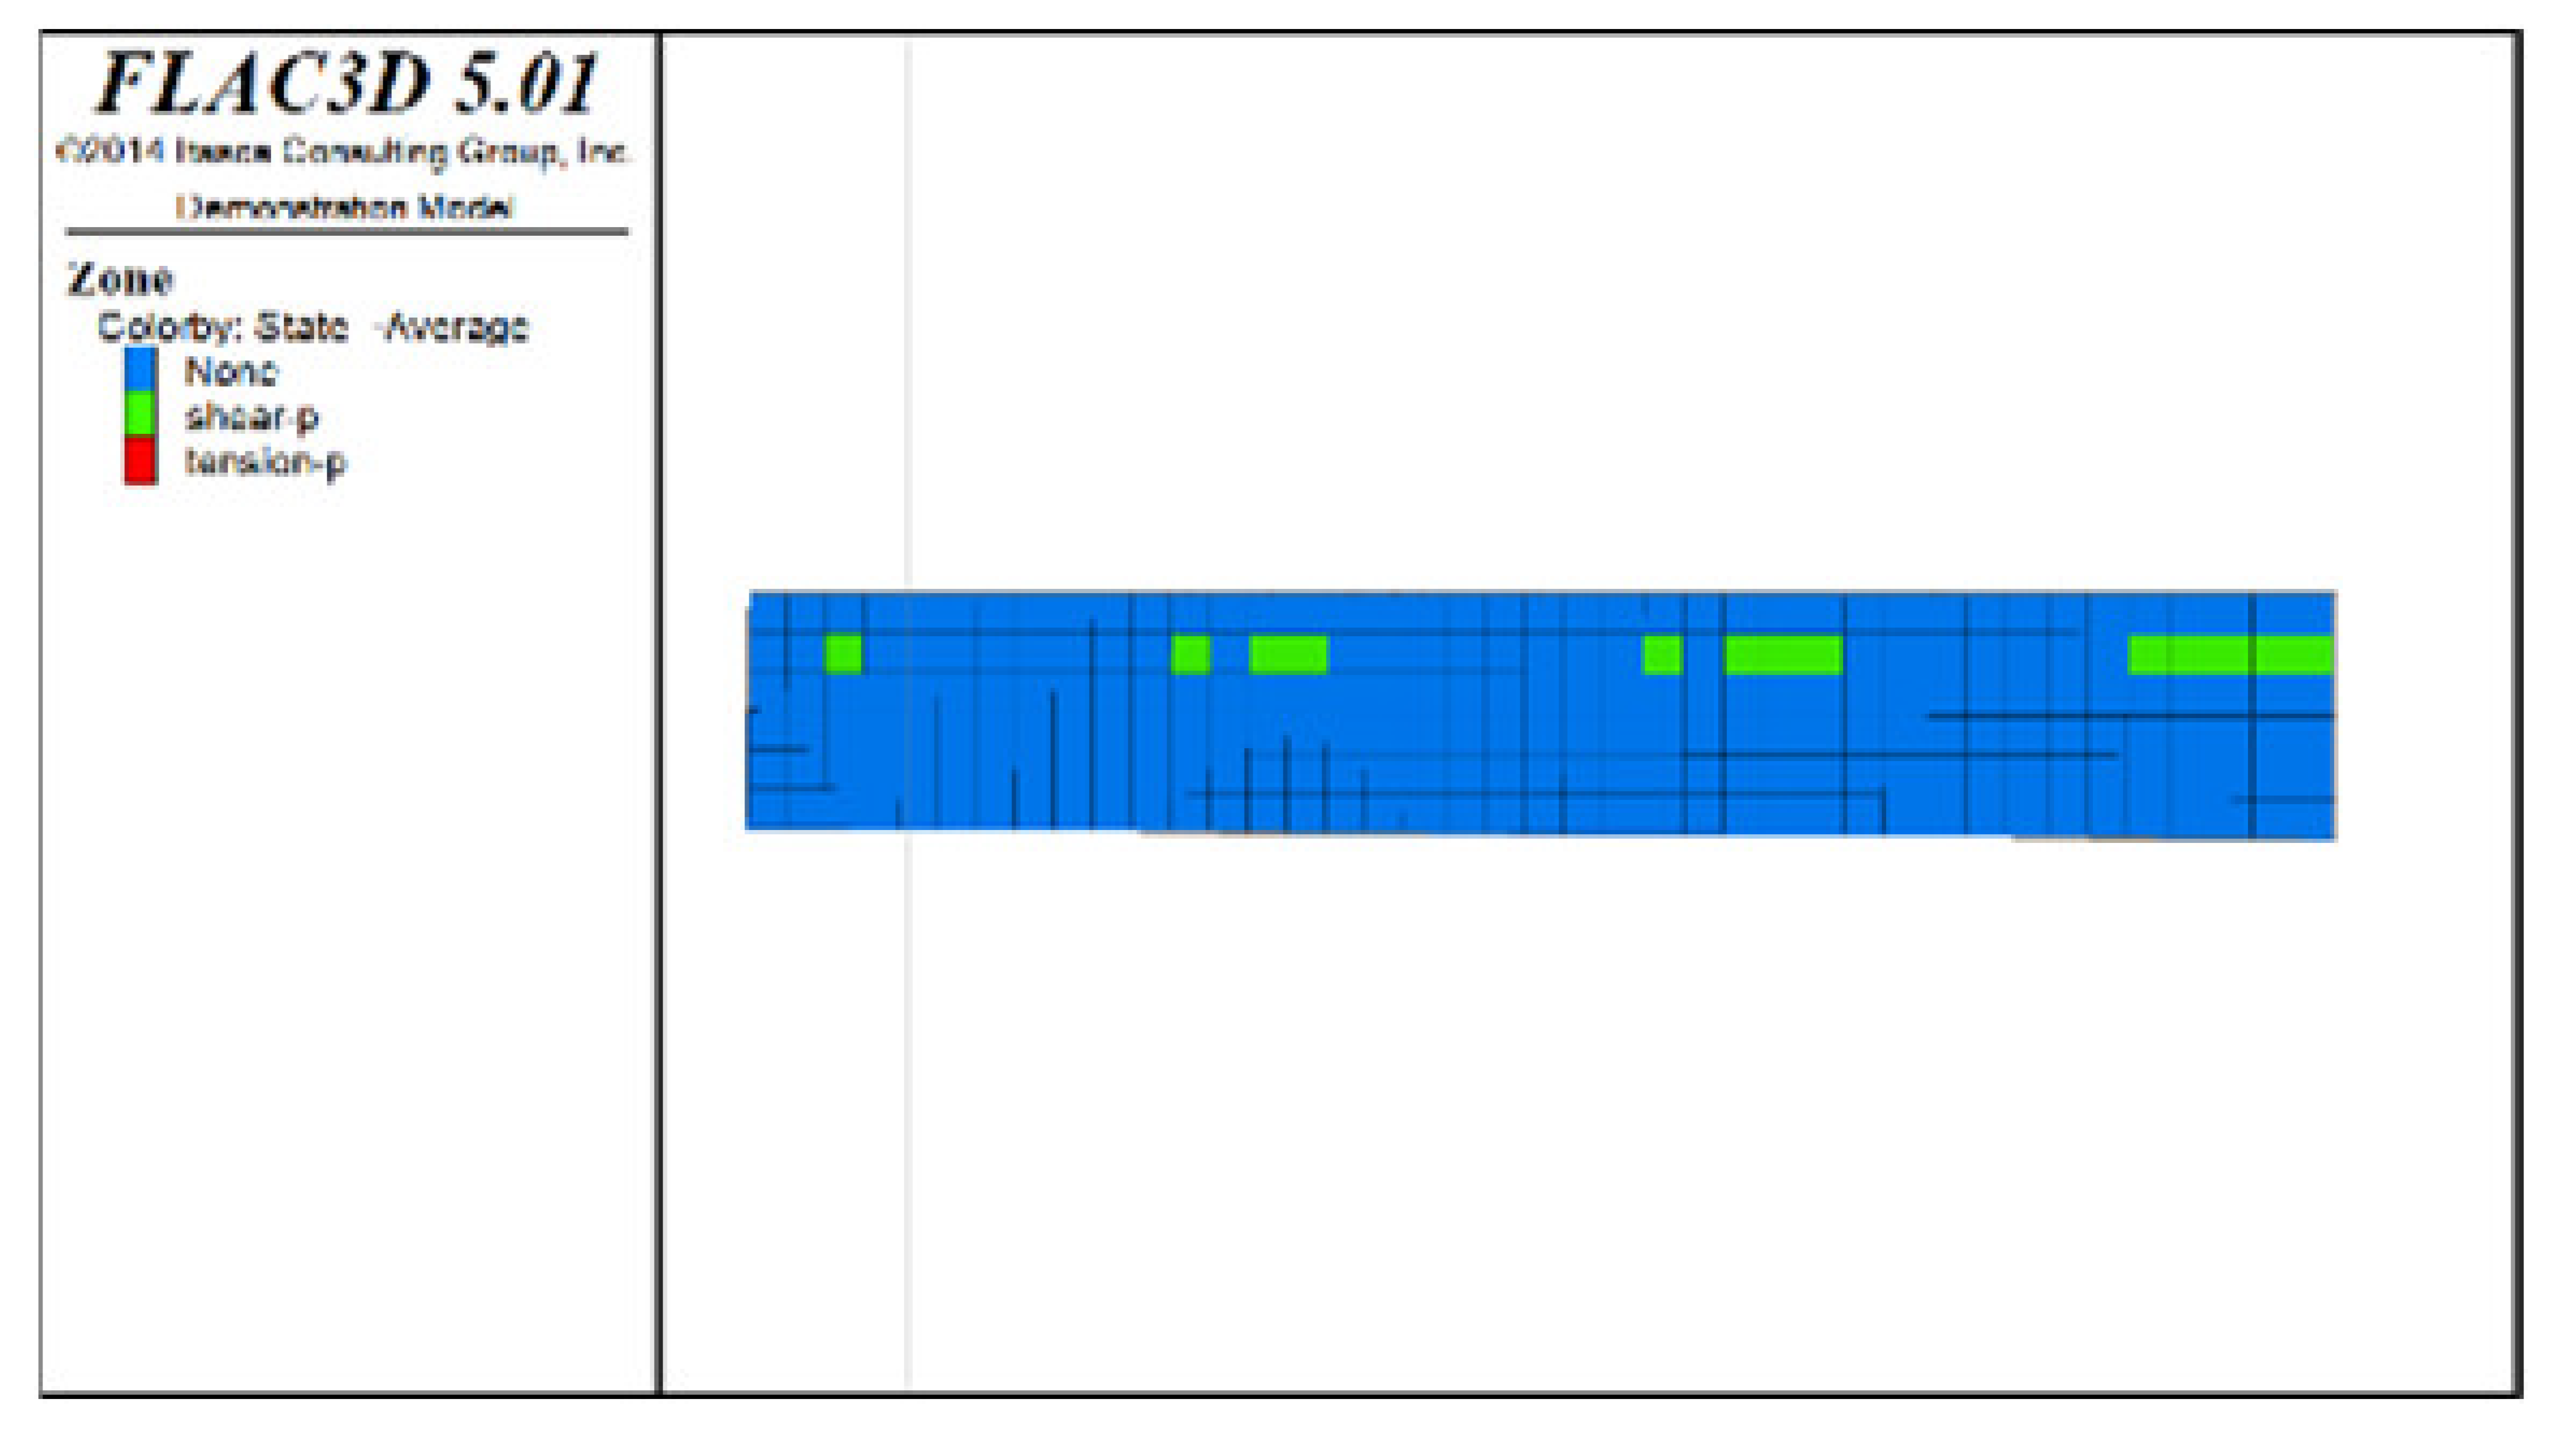
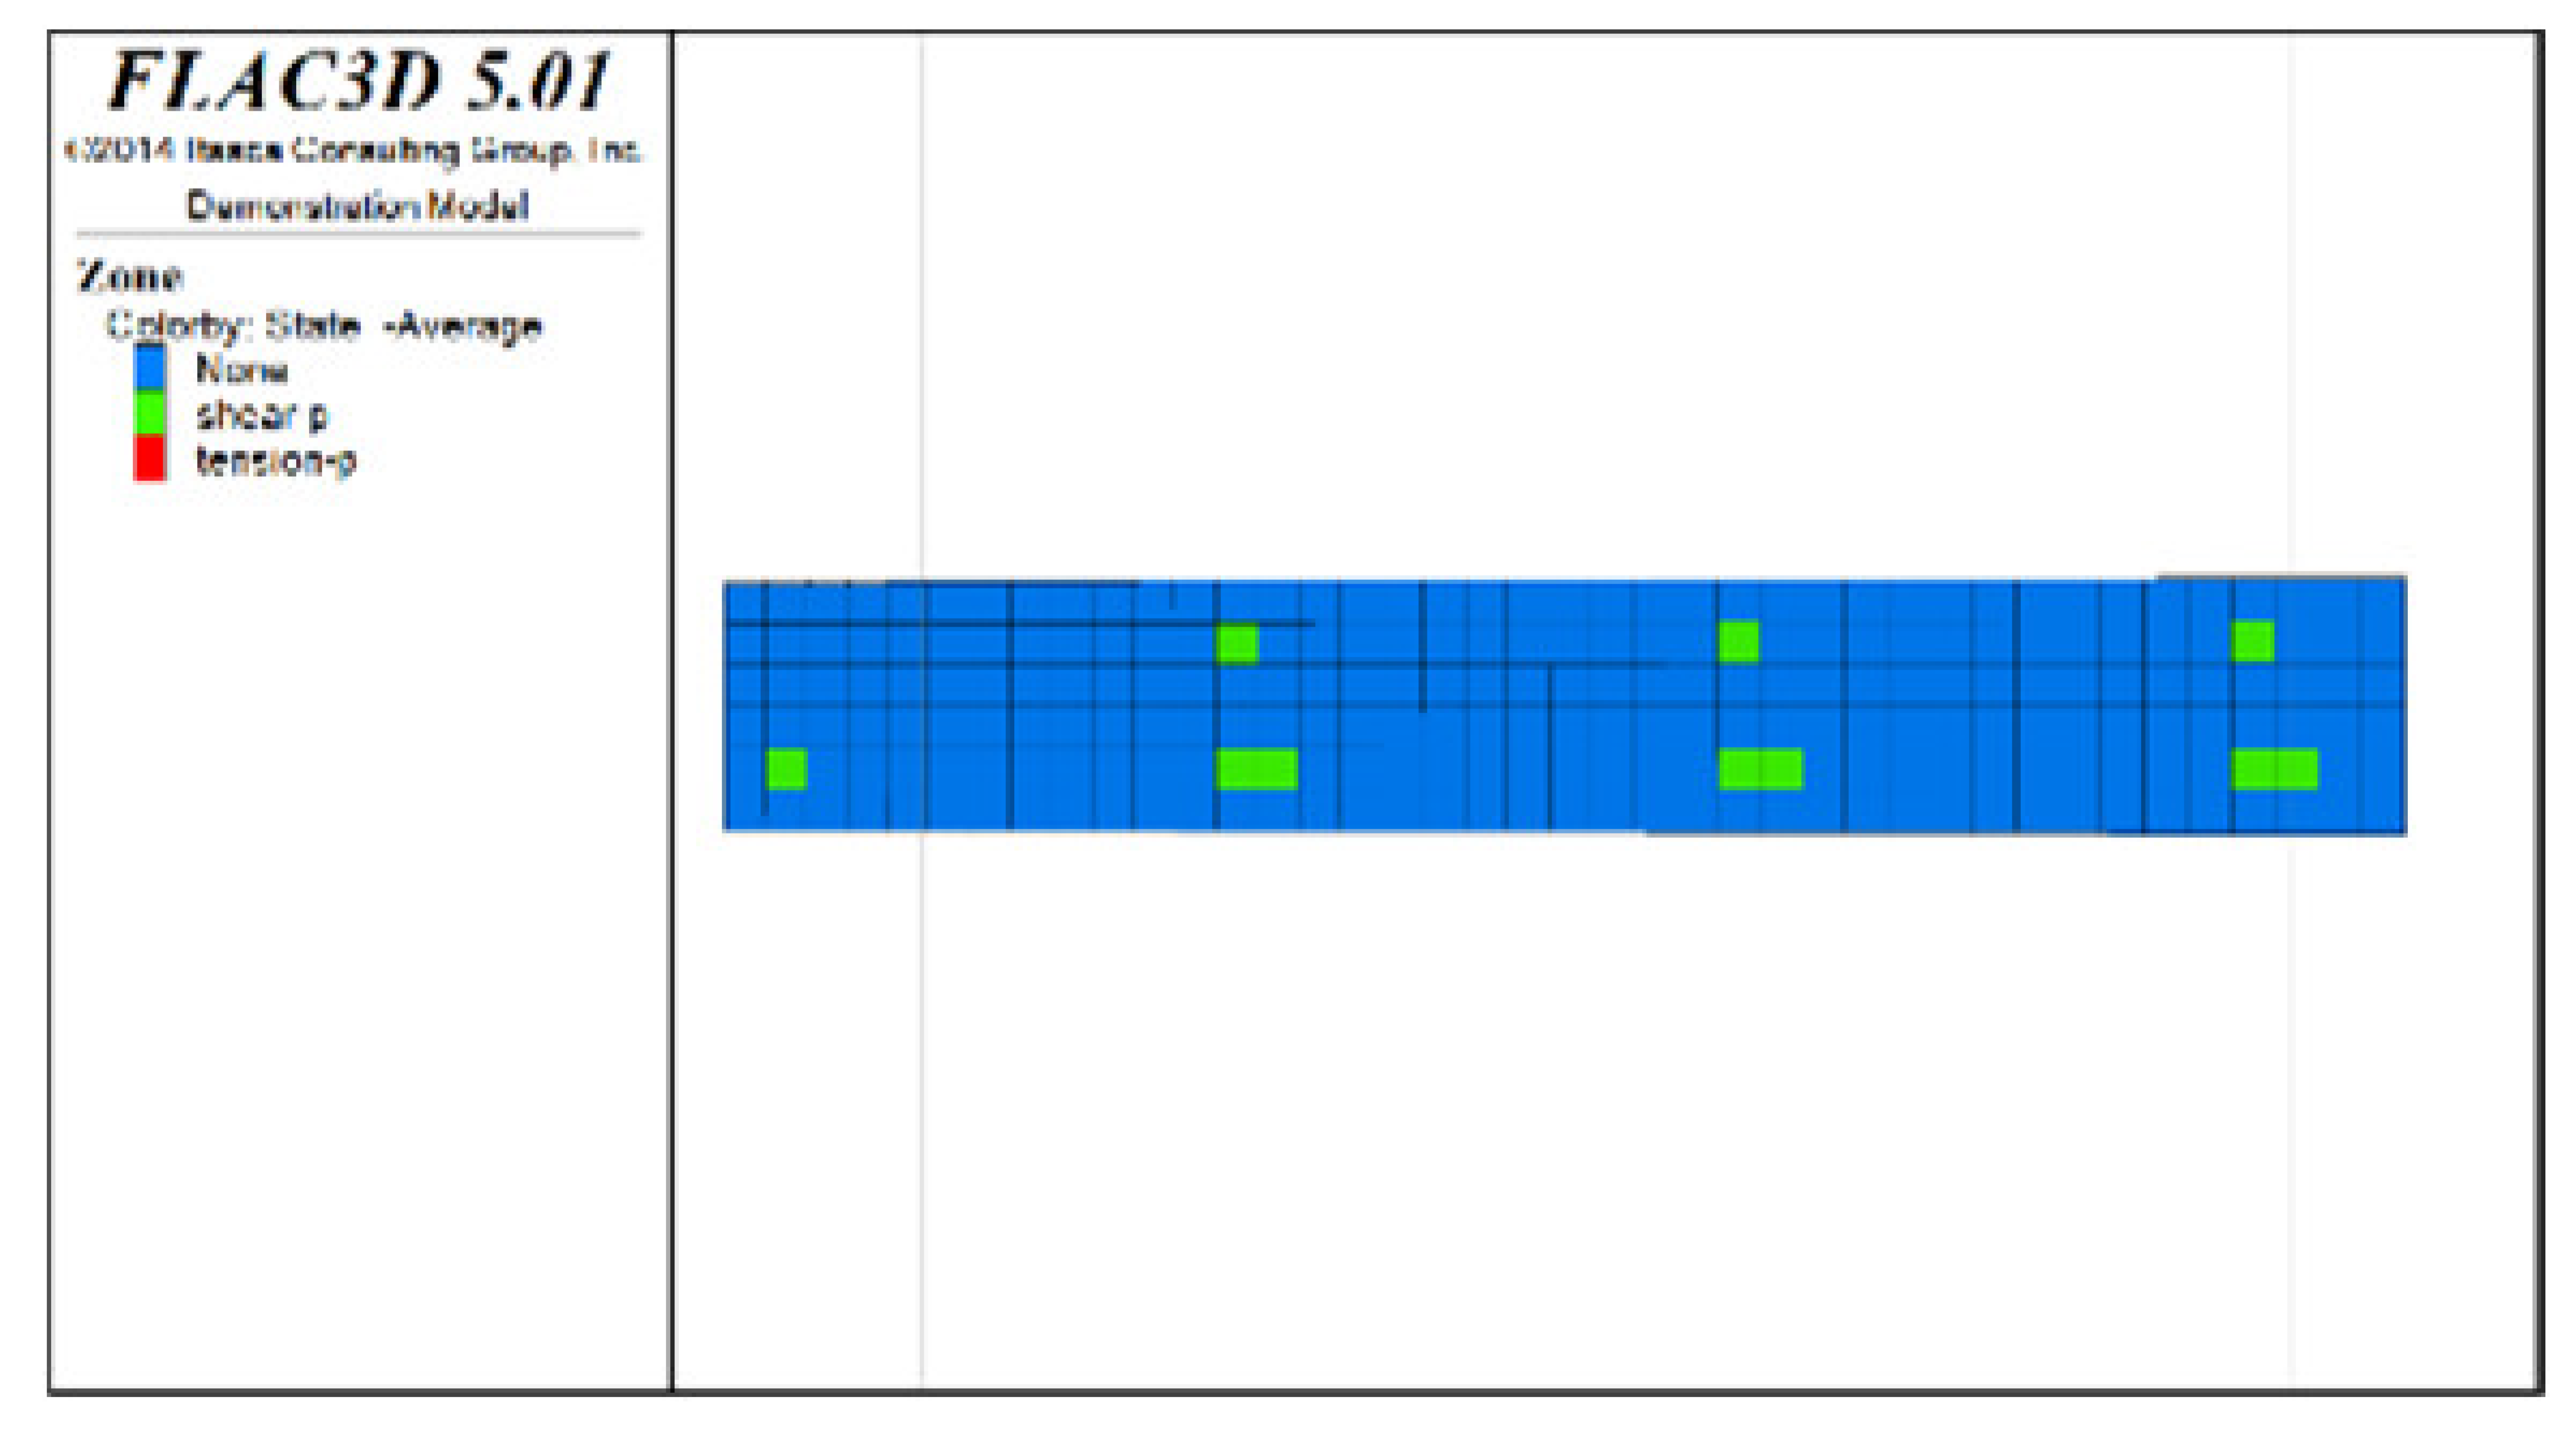
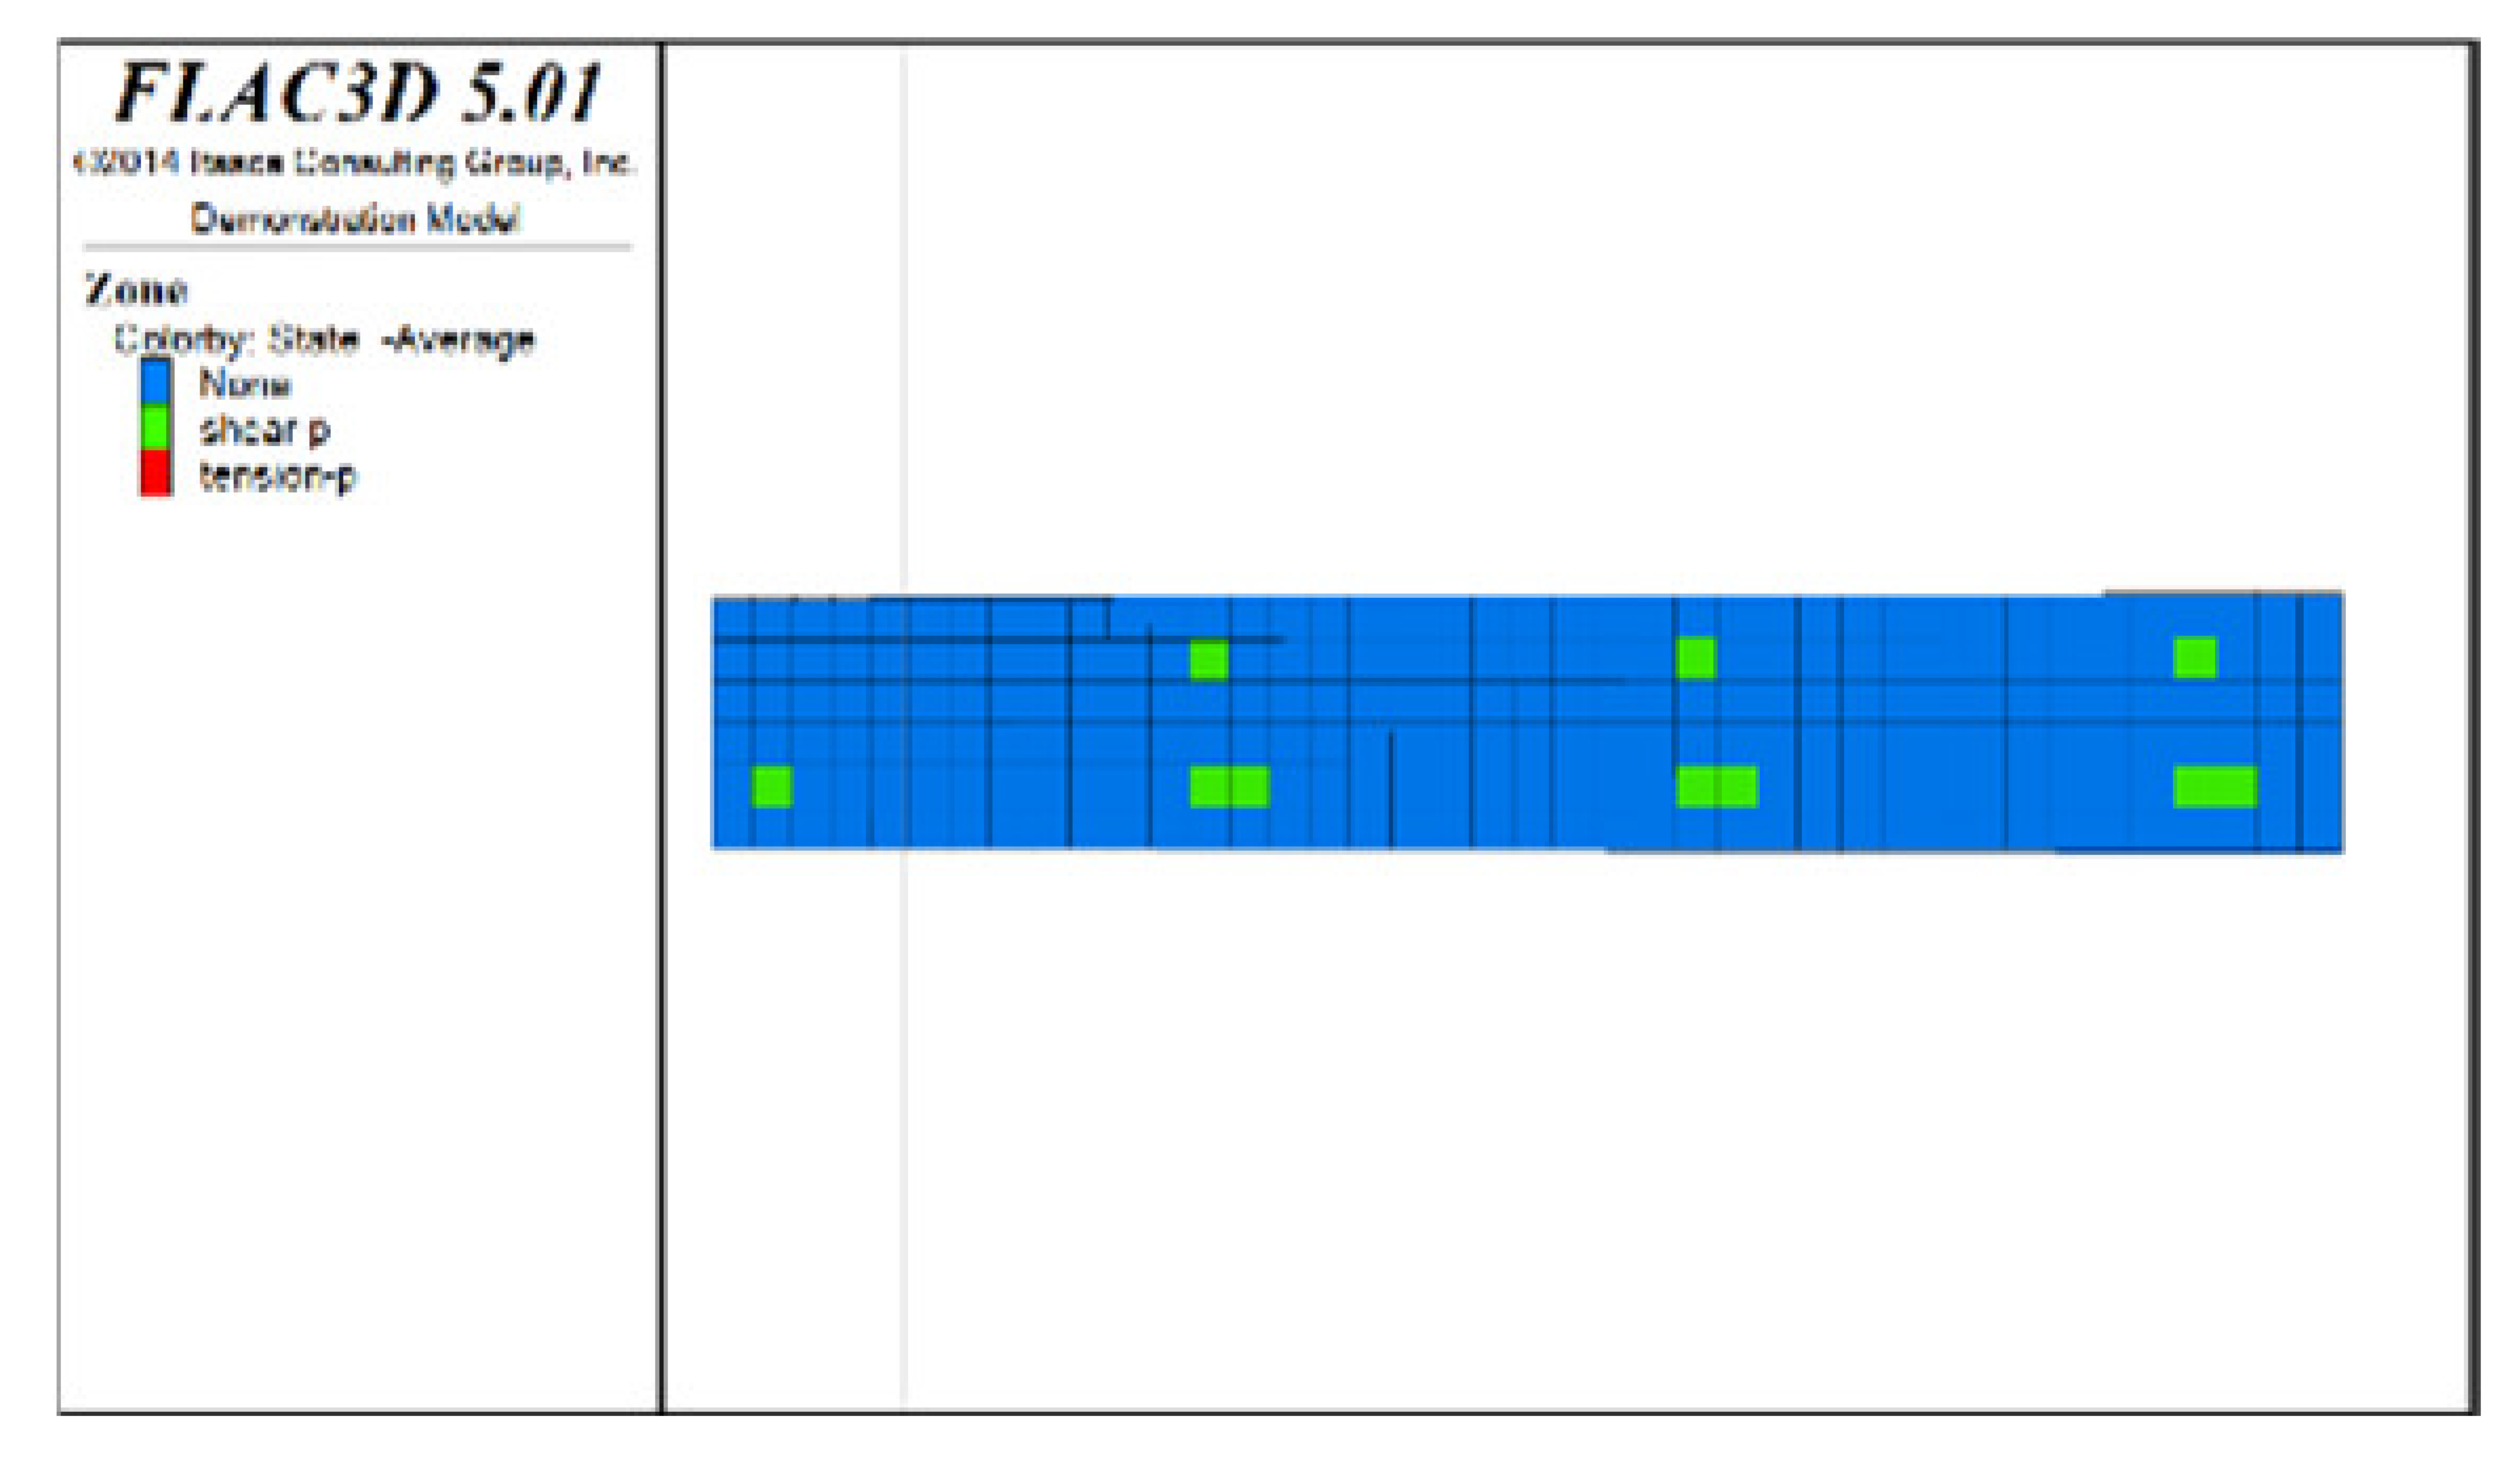
(2) Distribution characteristics of roof protection layer plastic zones with different roof protection layer thicknesses
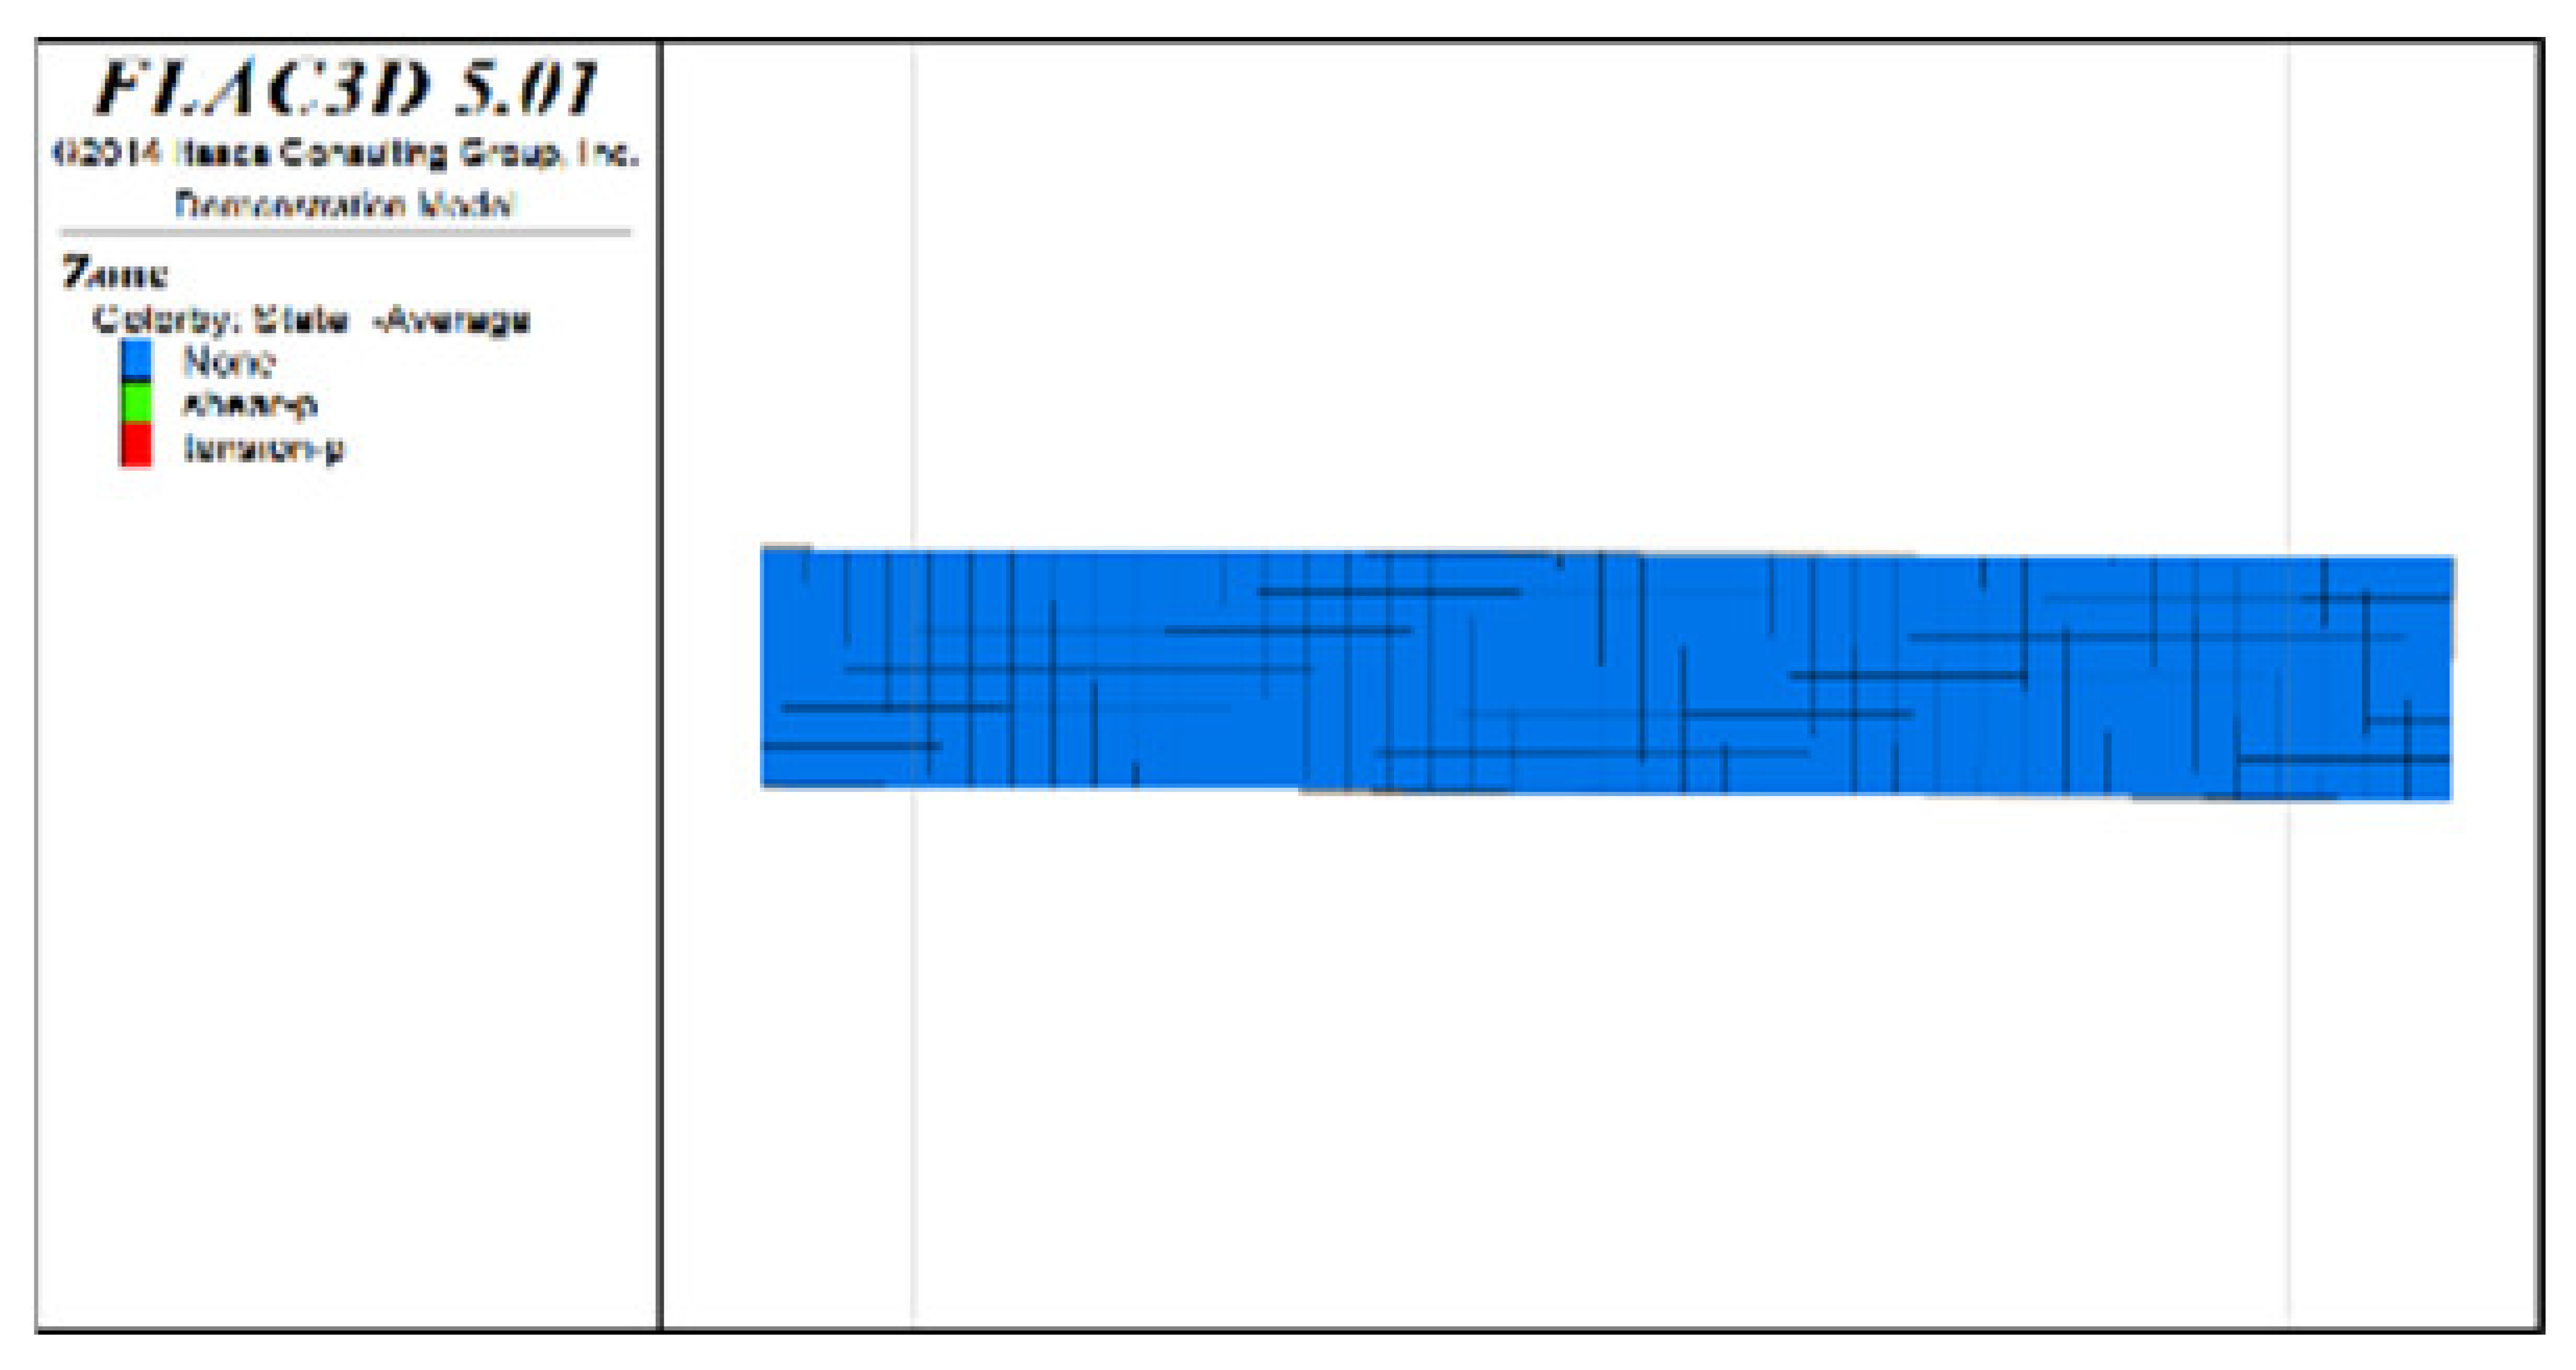
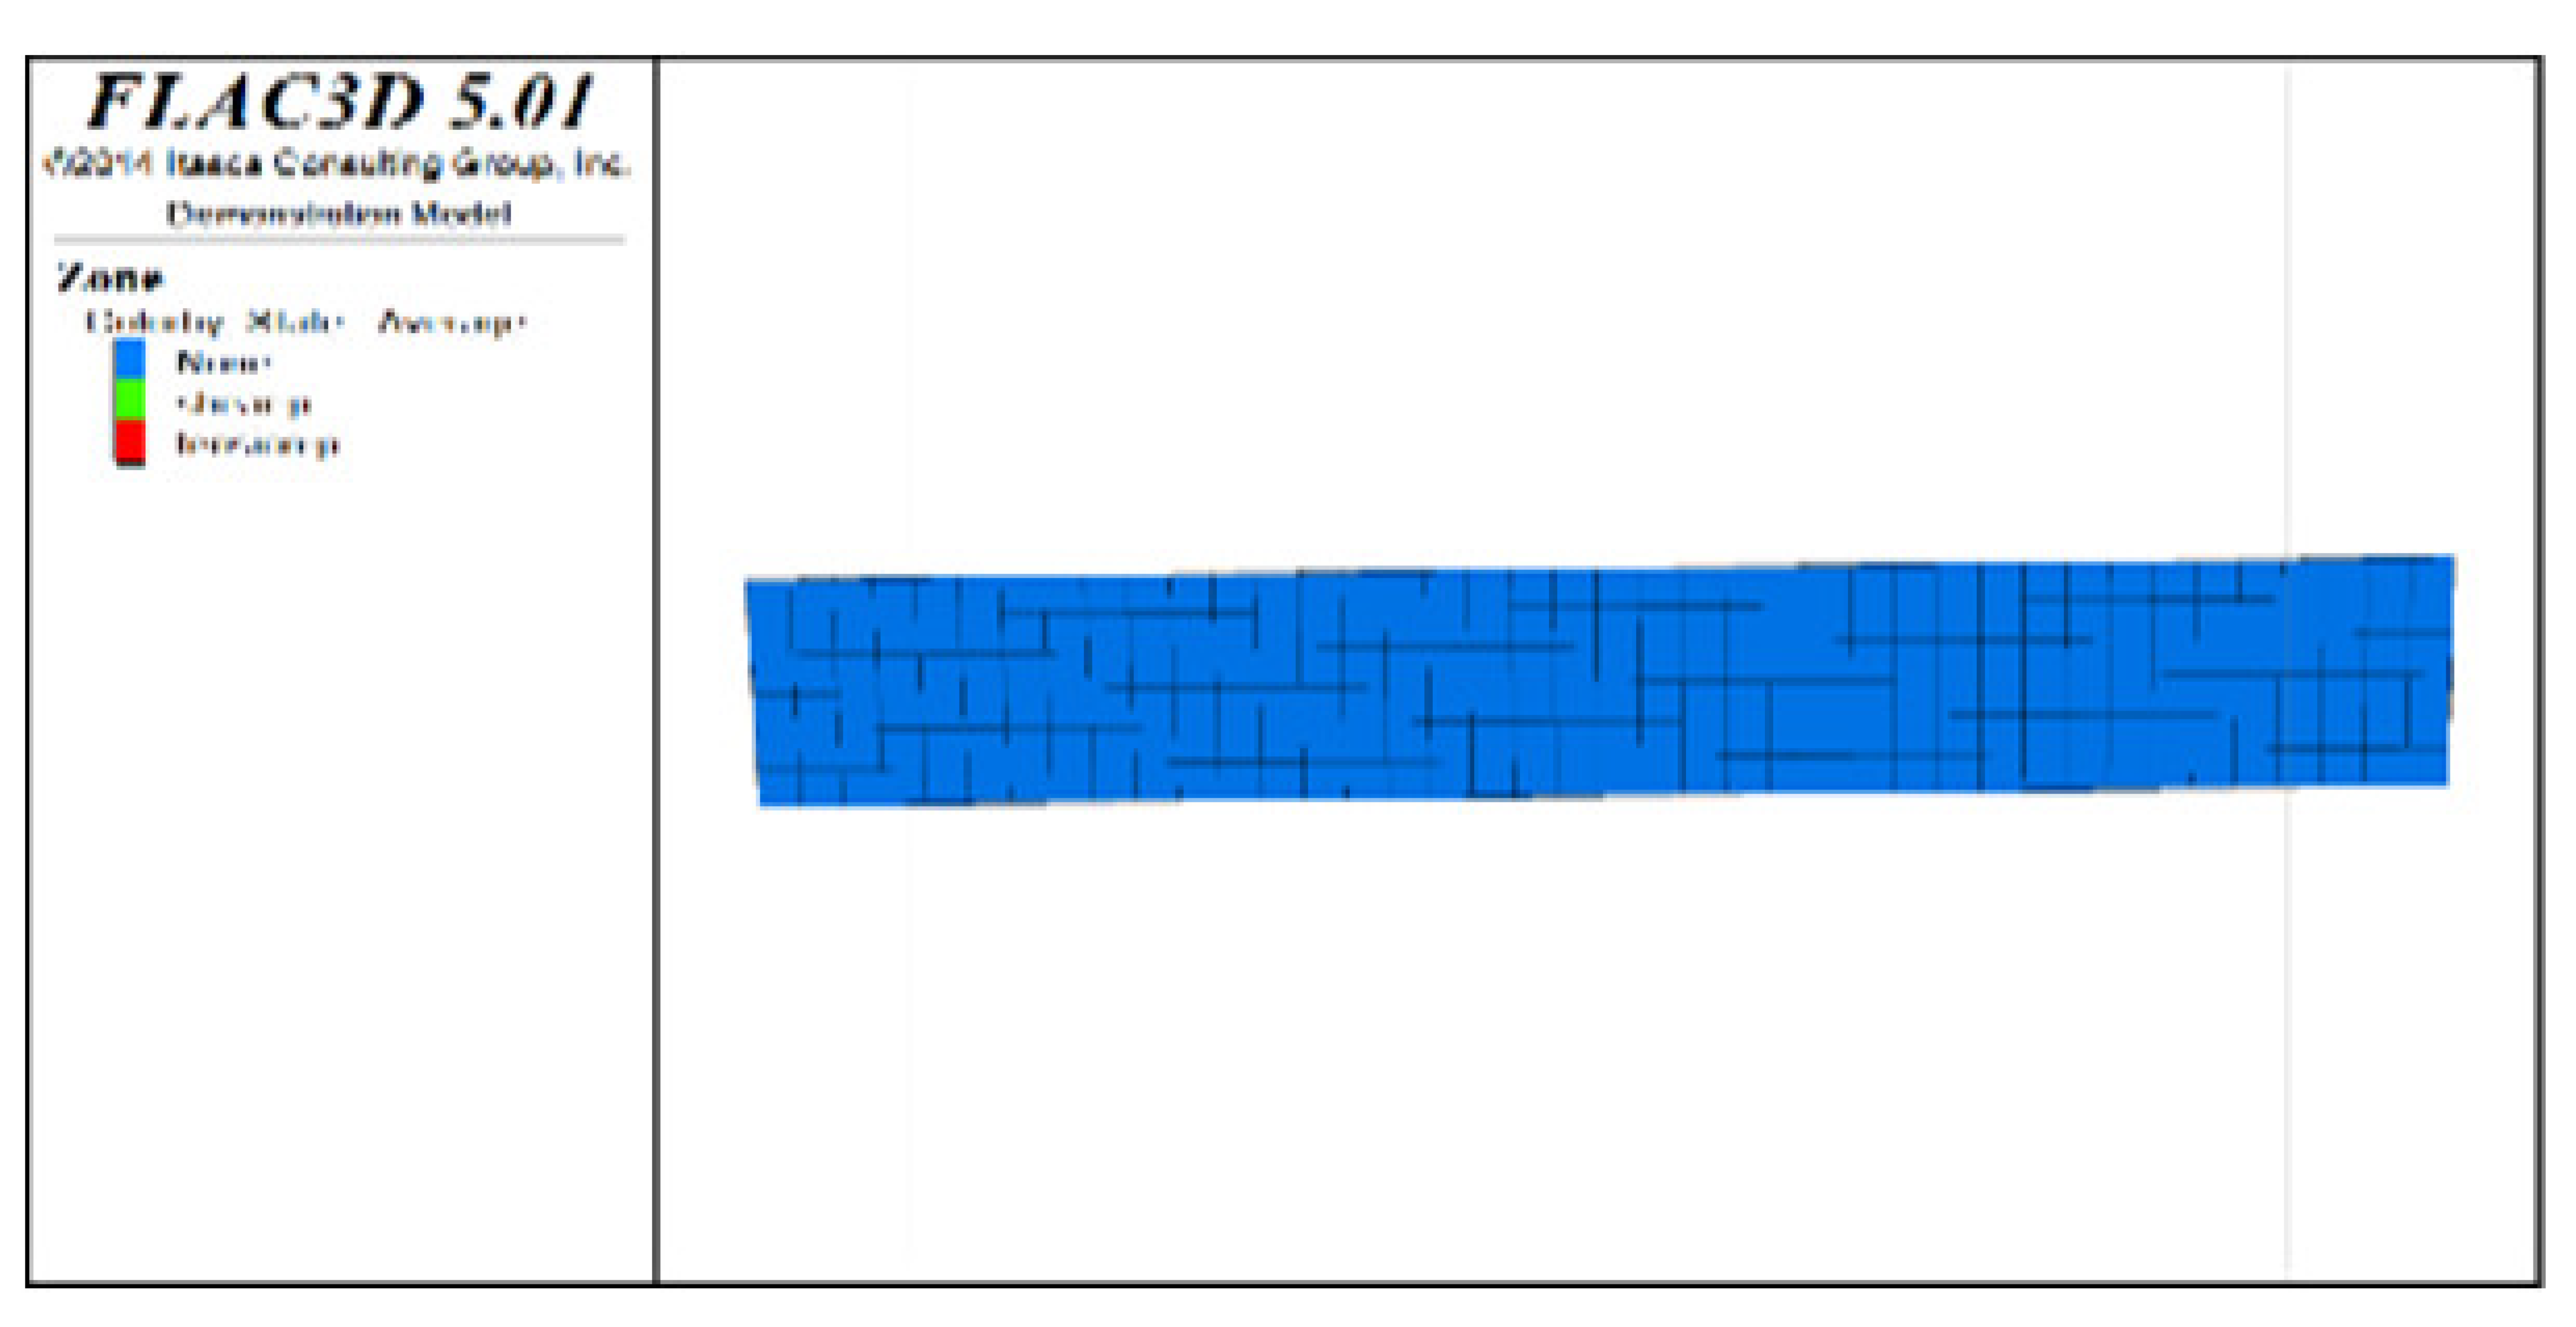
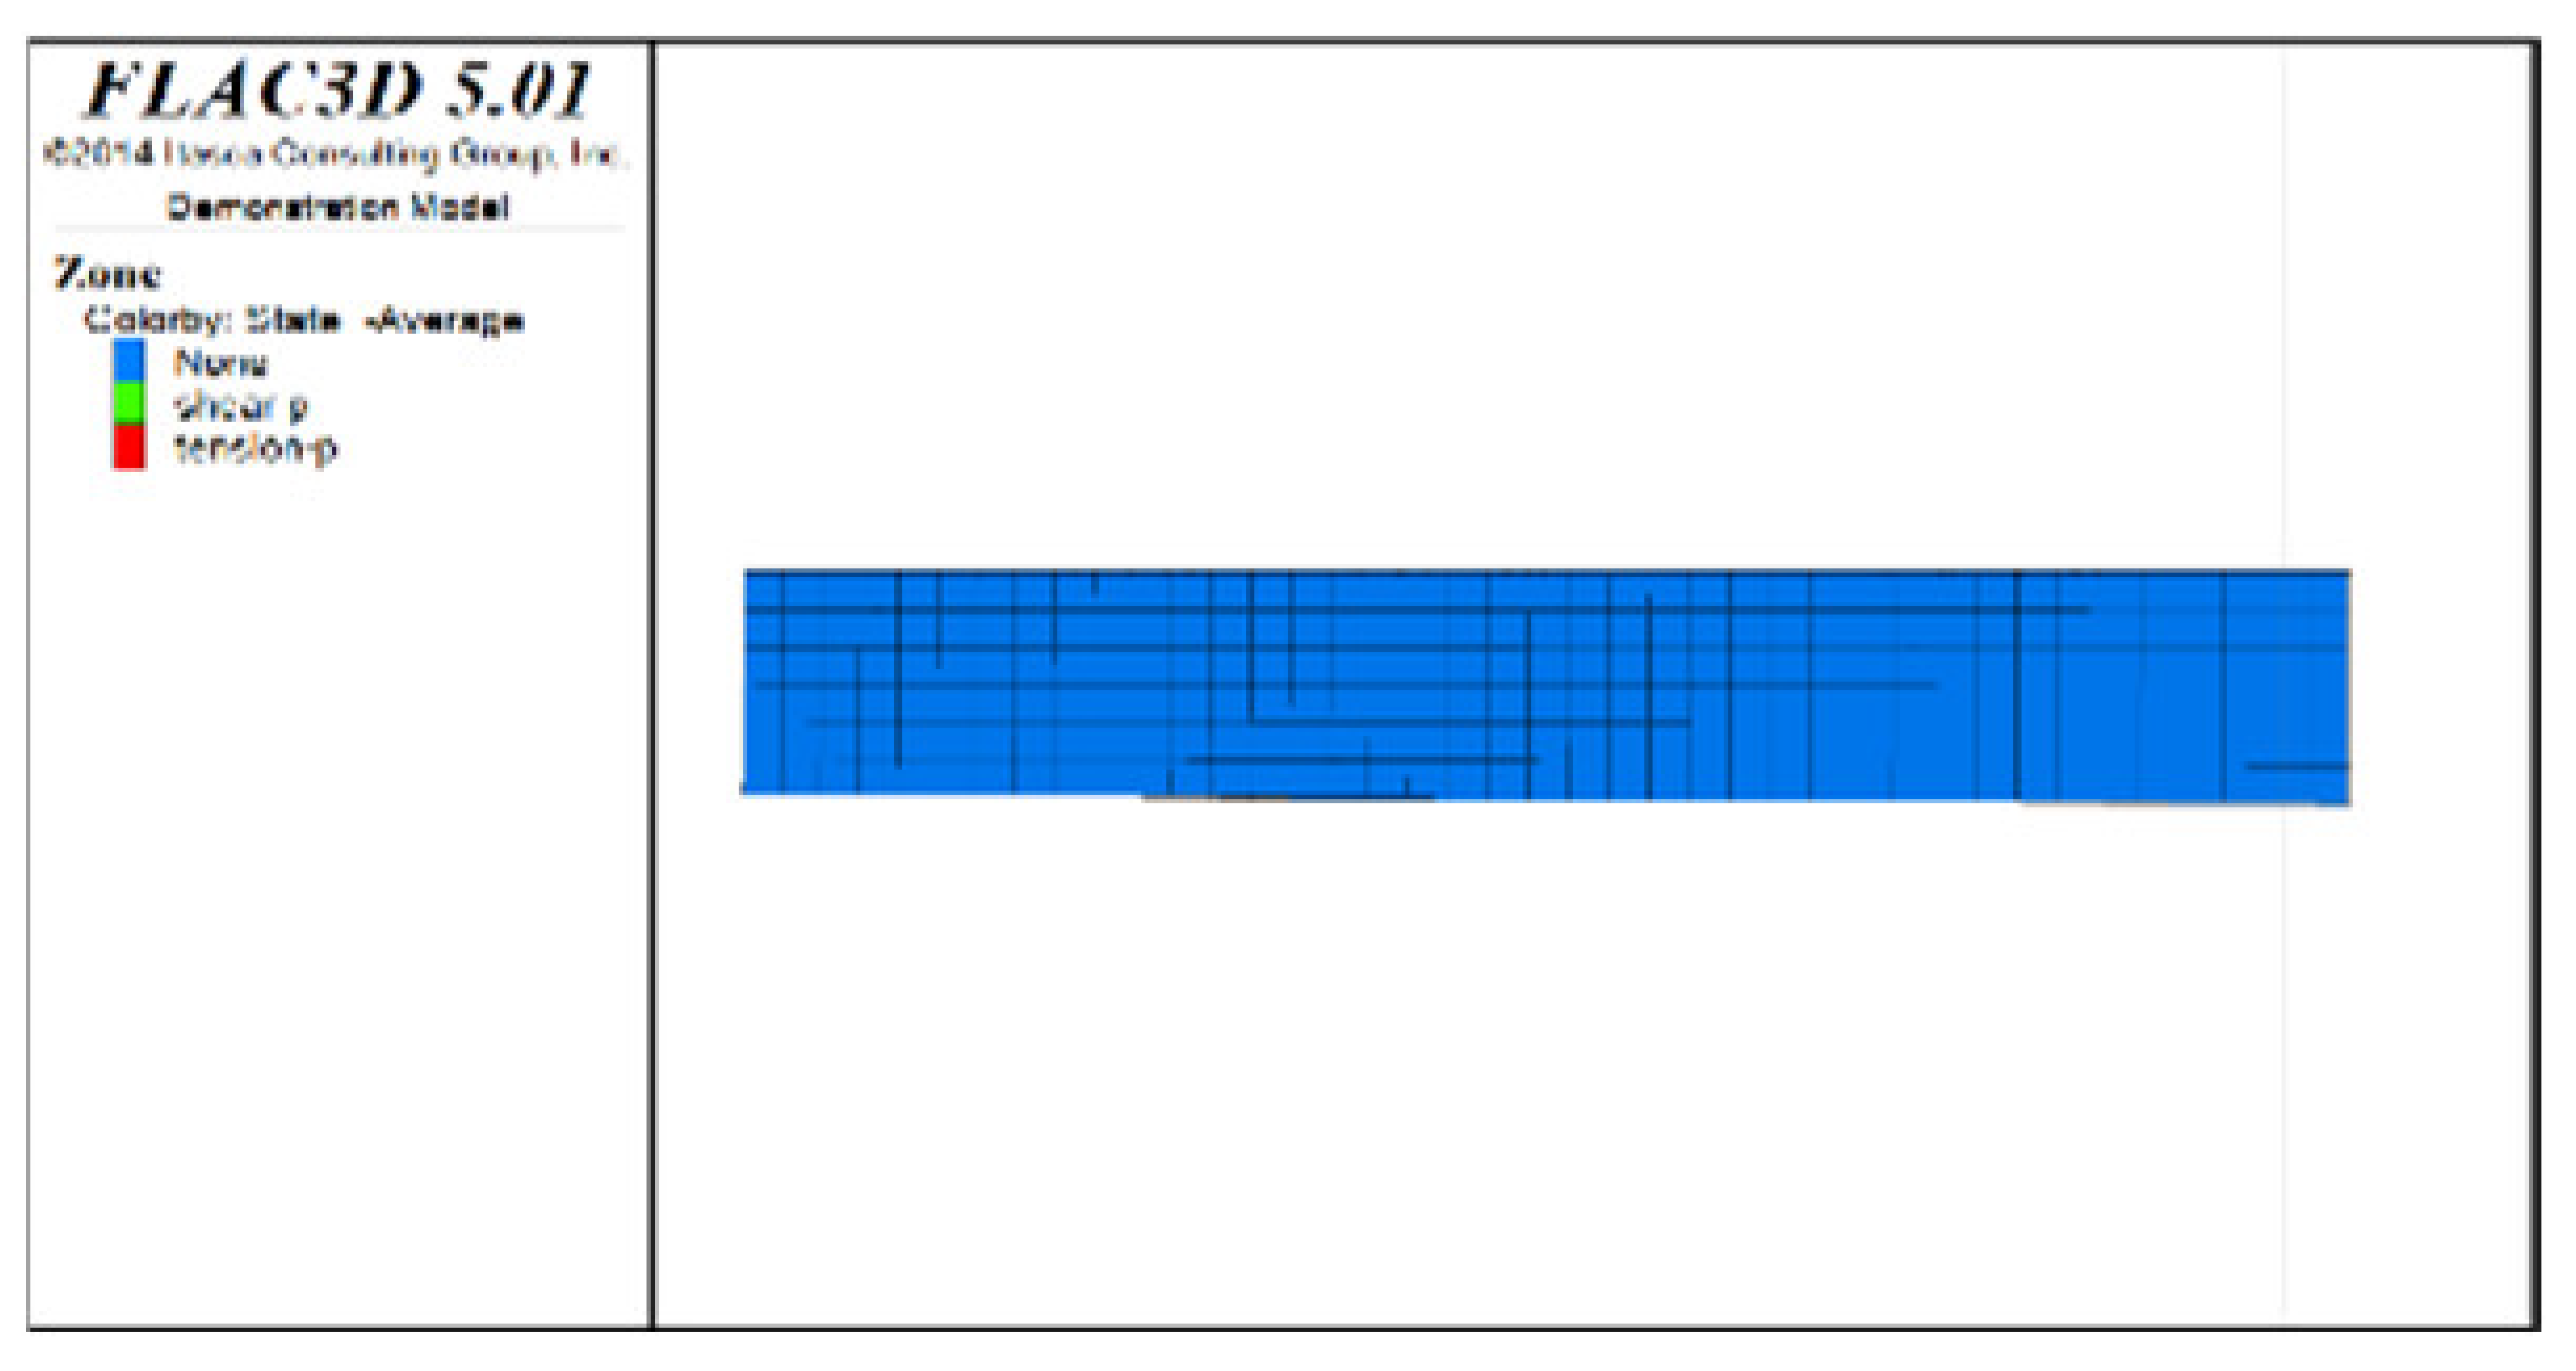
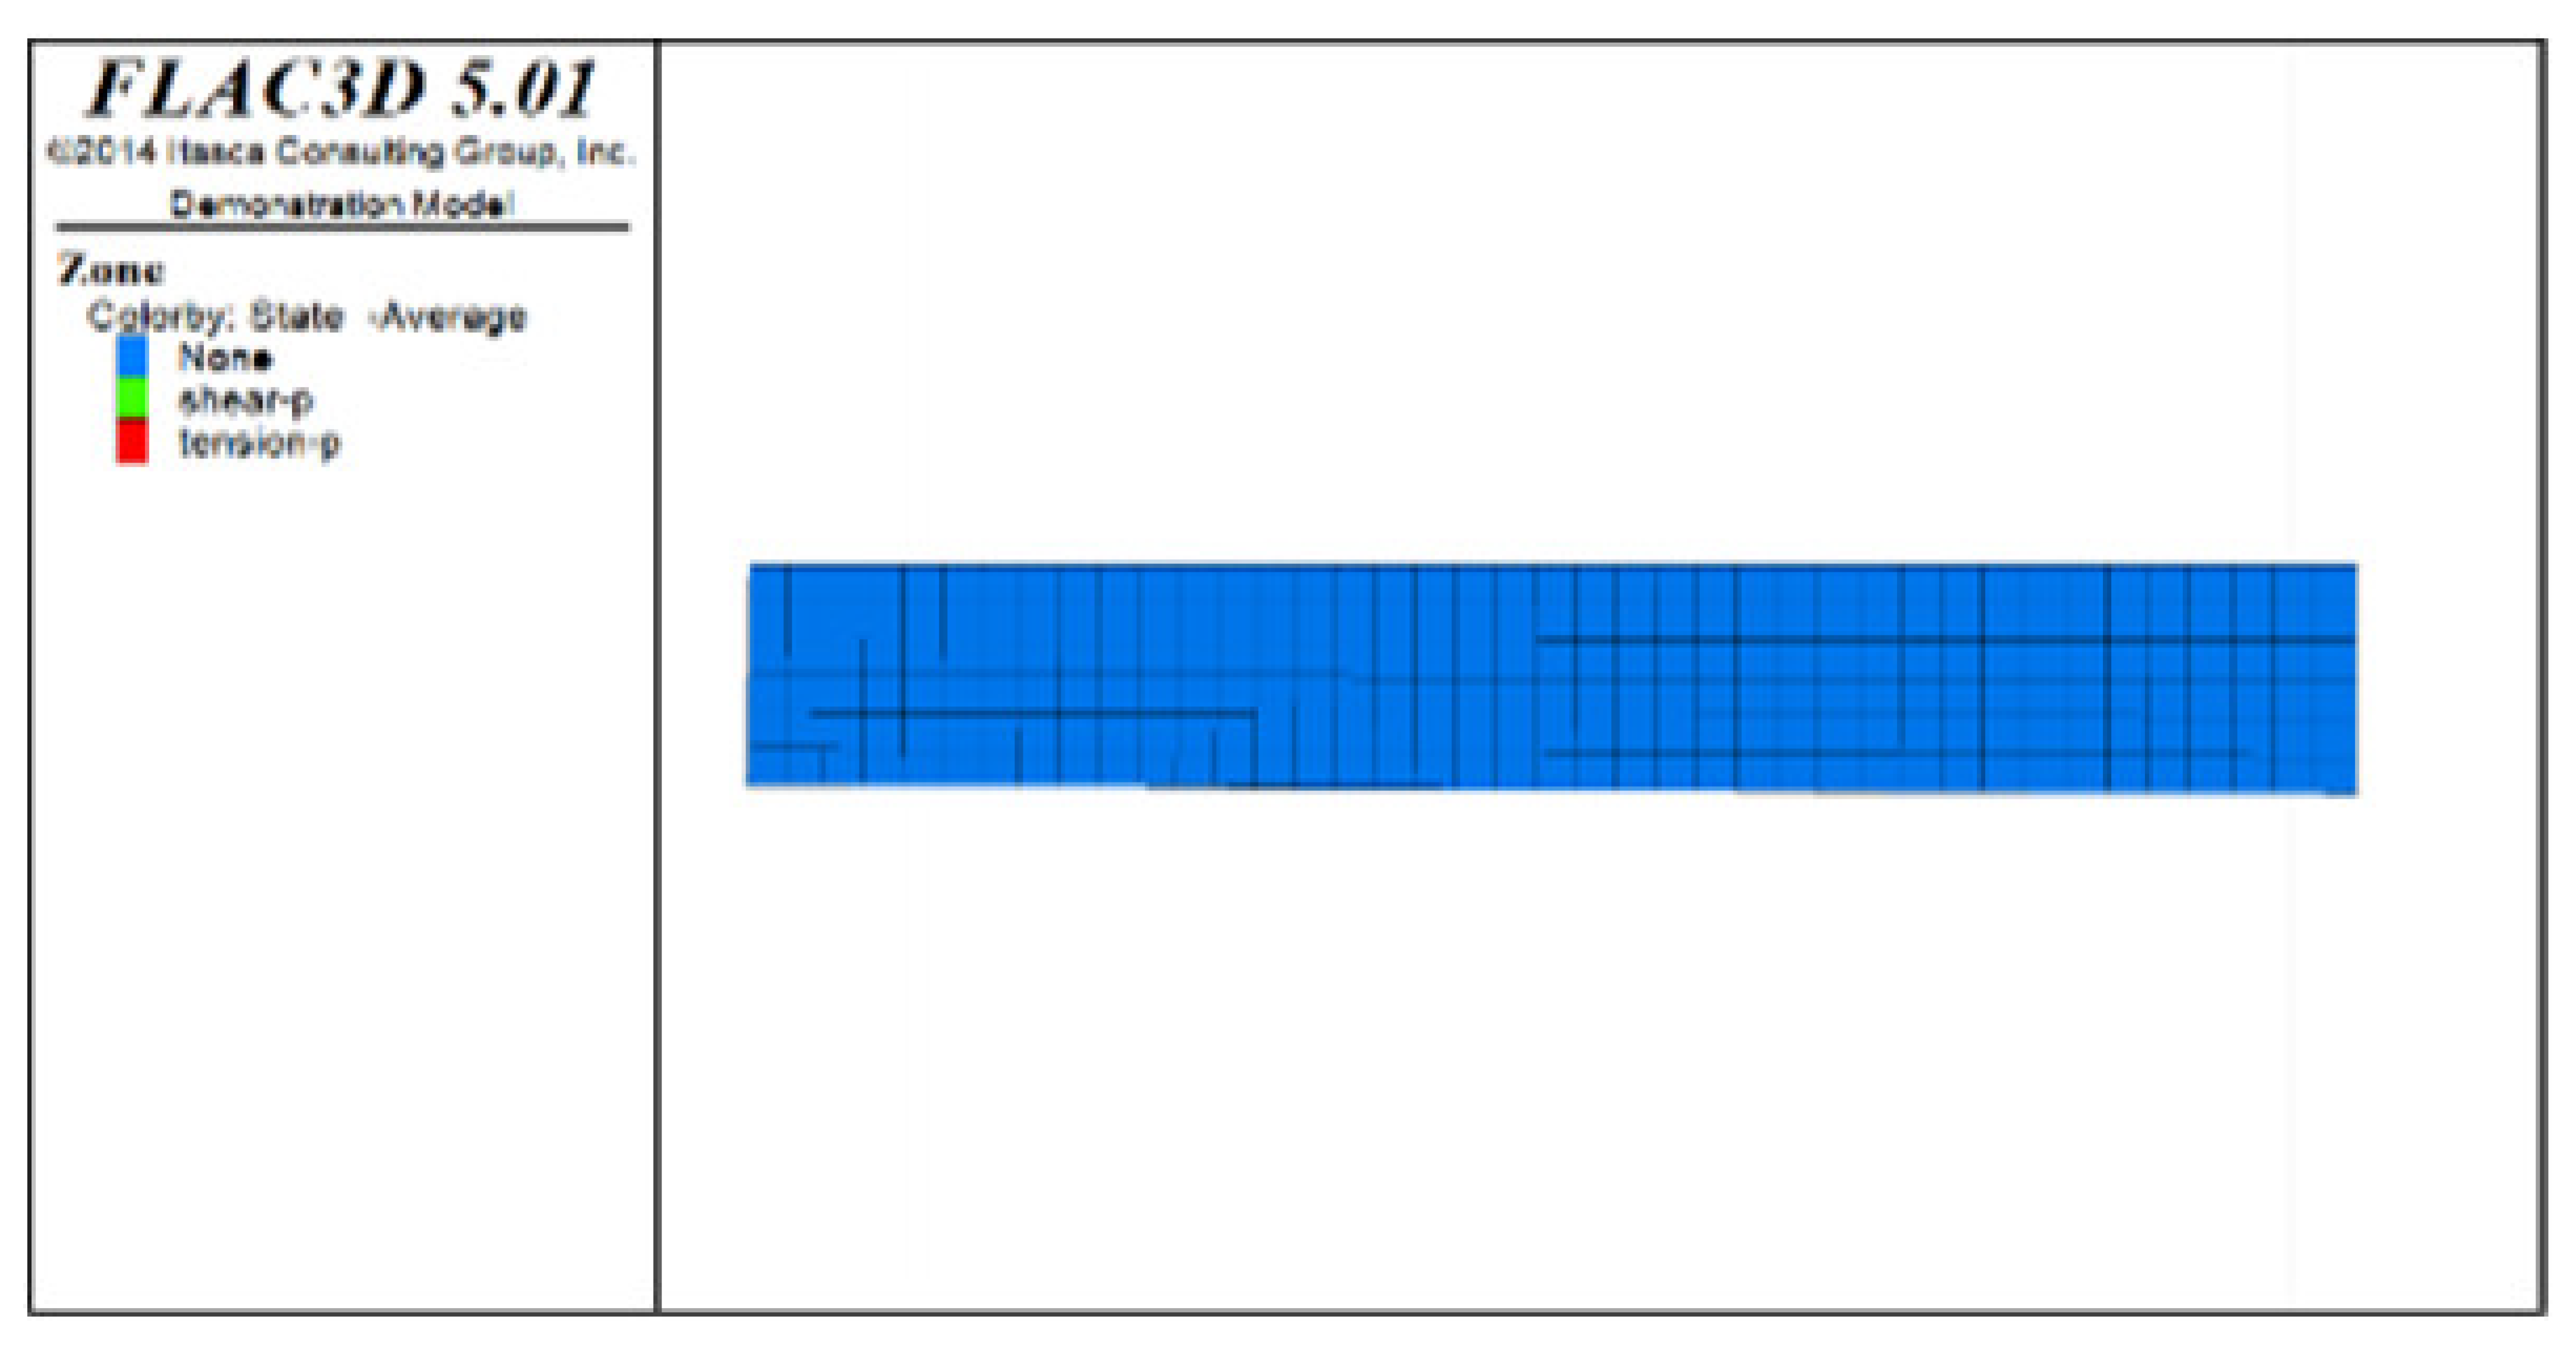
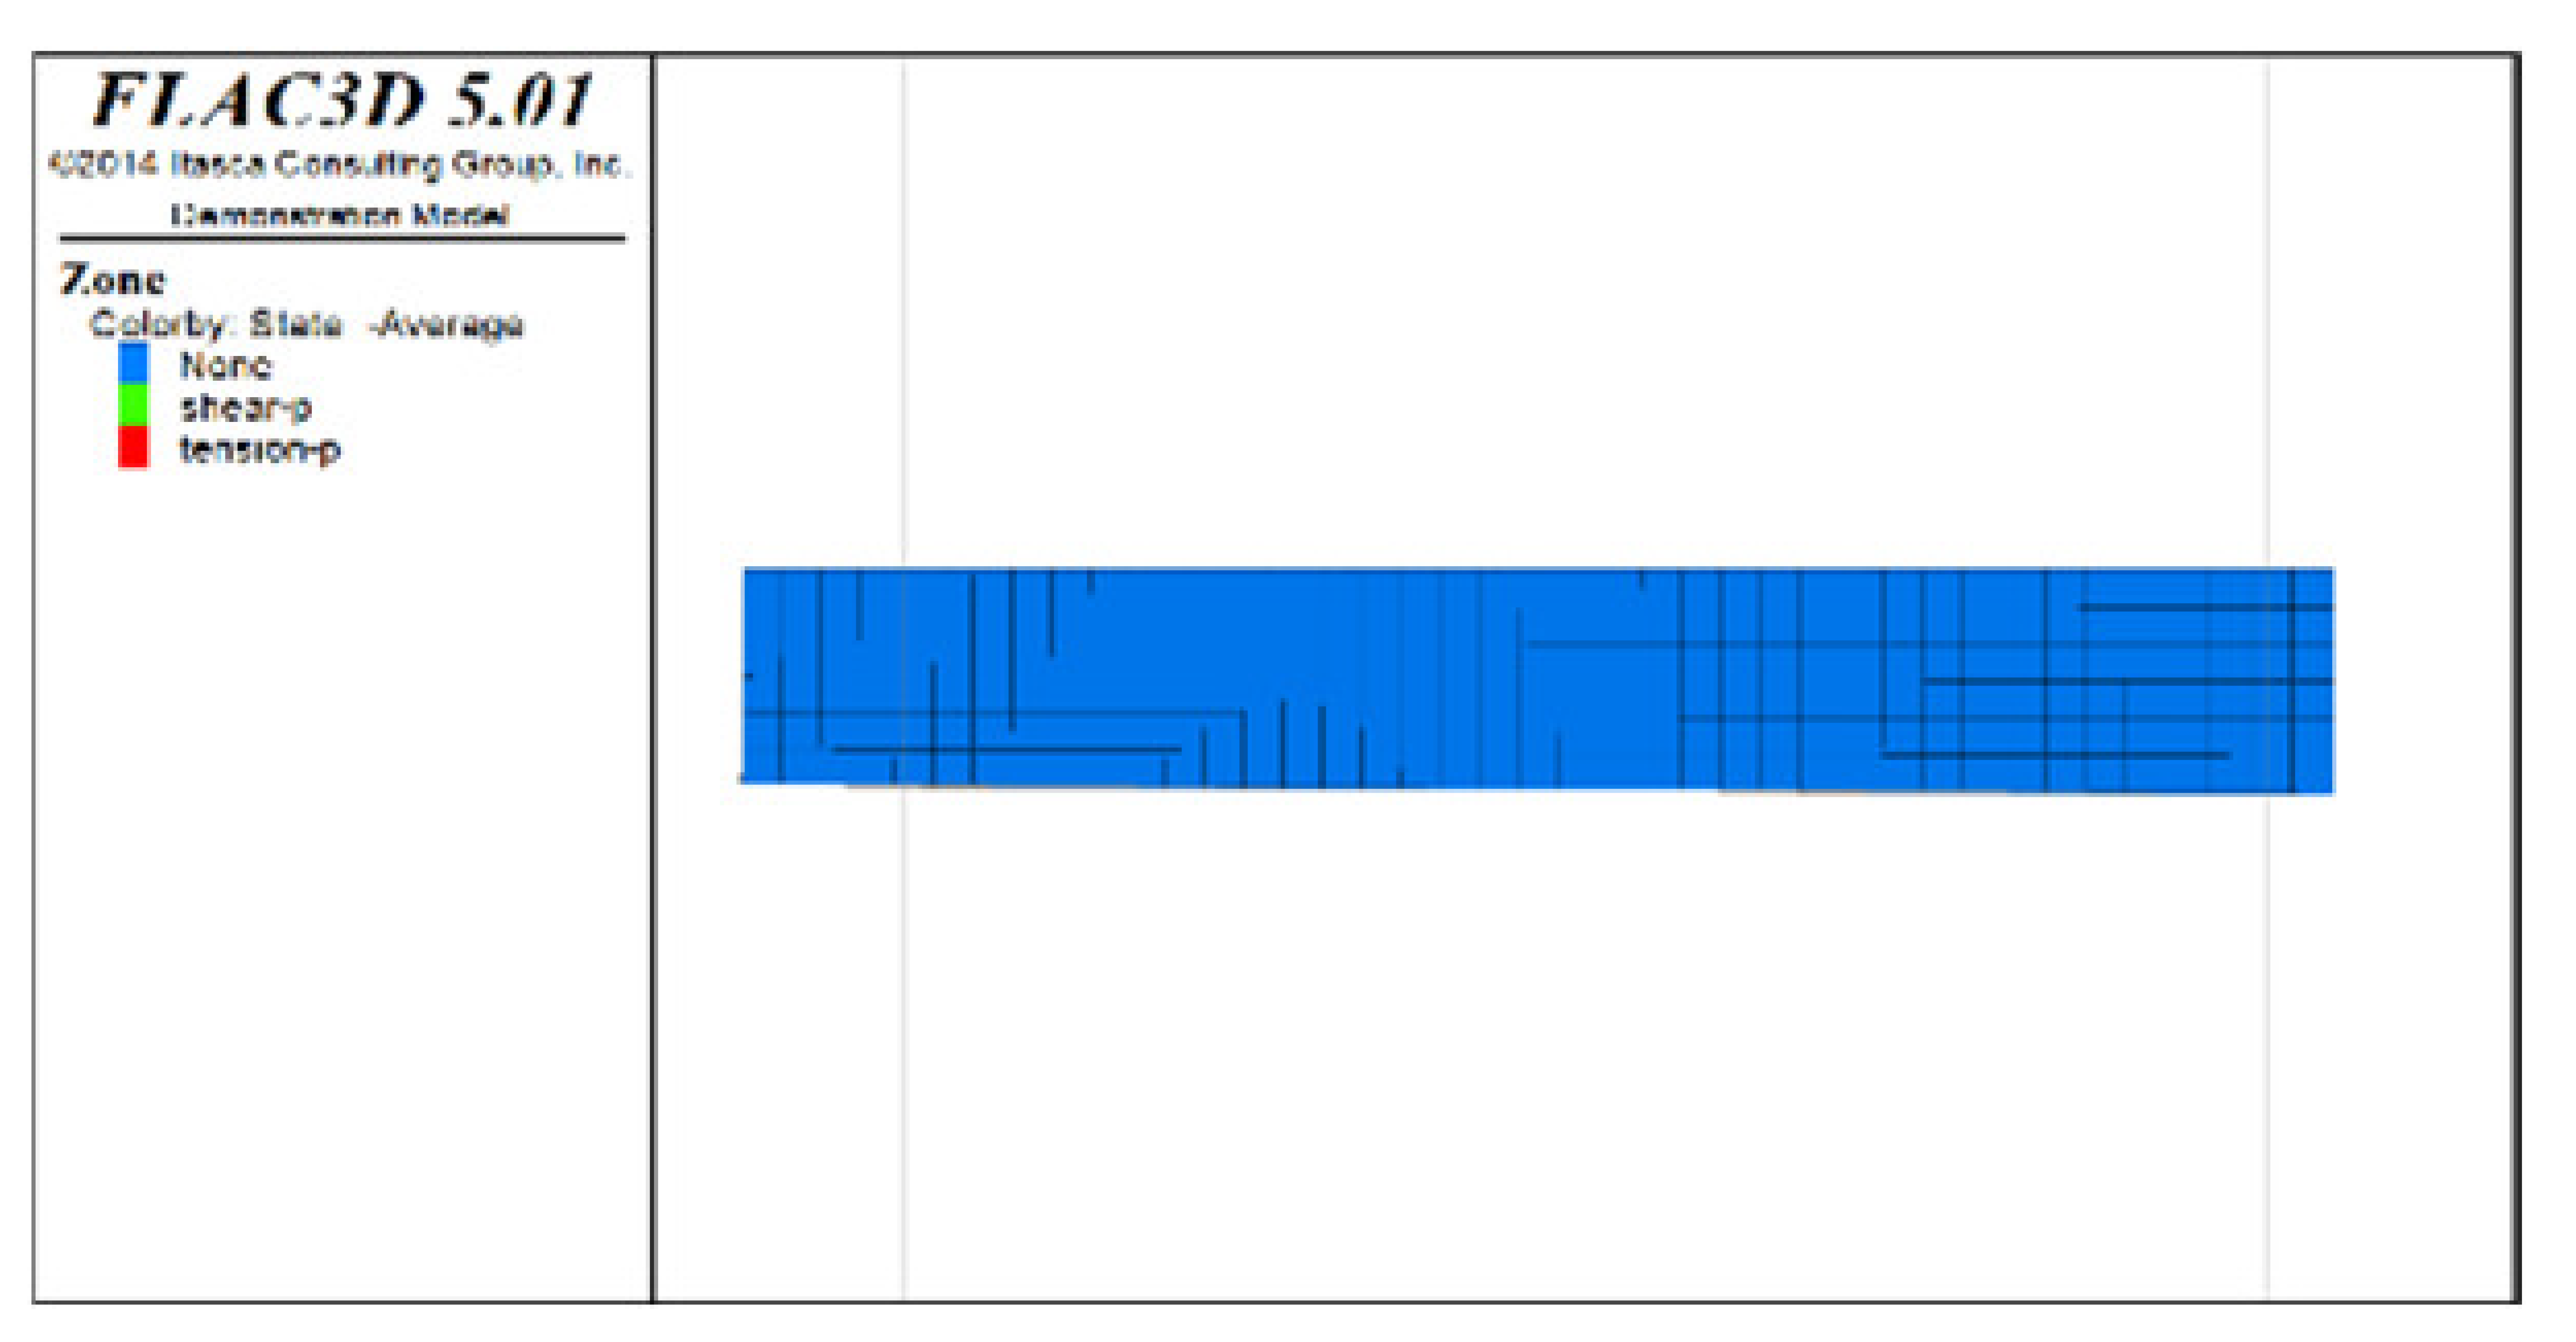
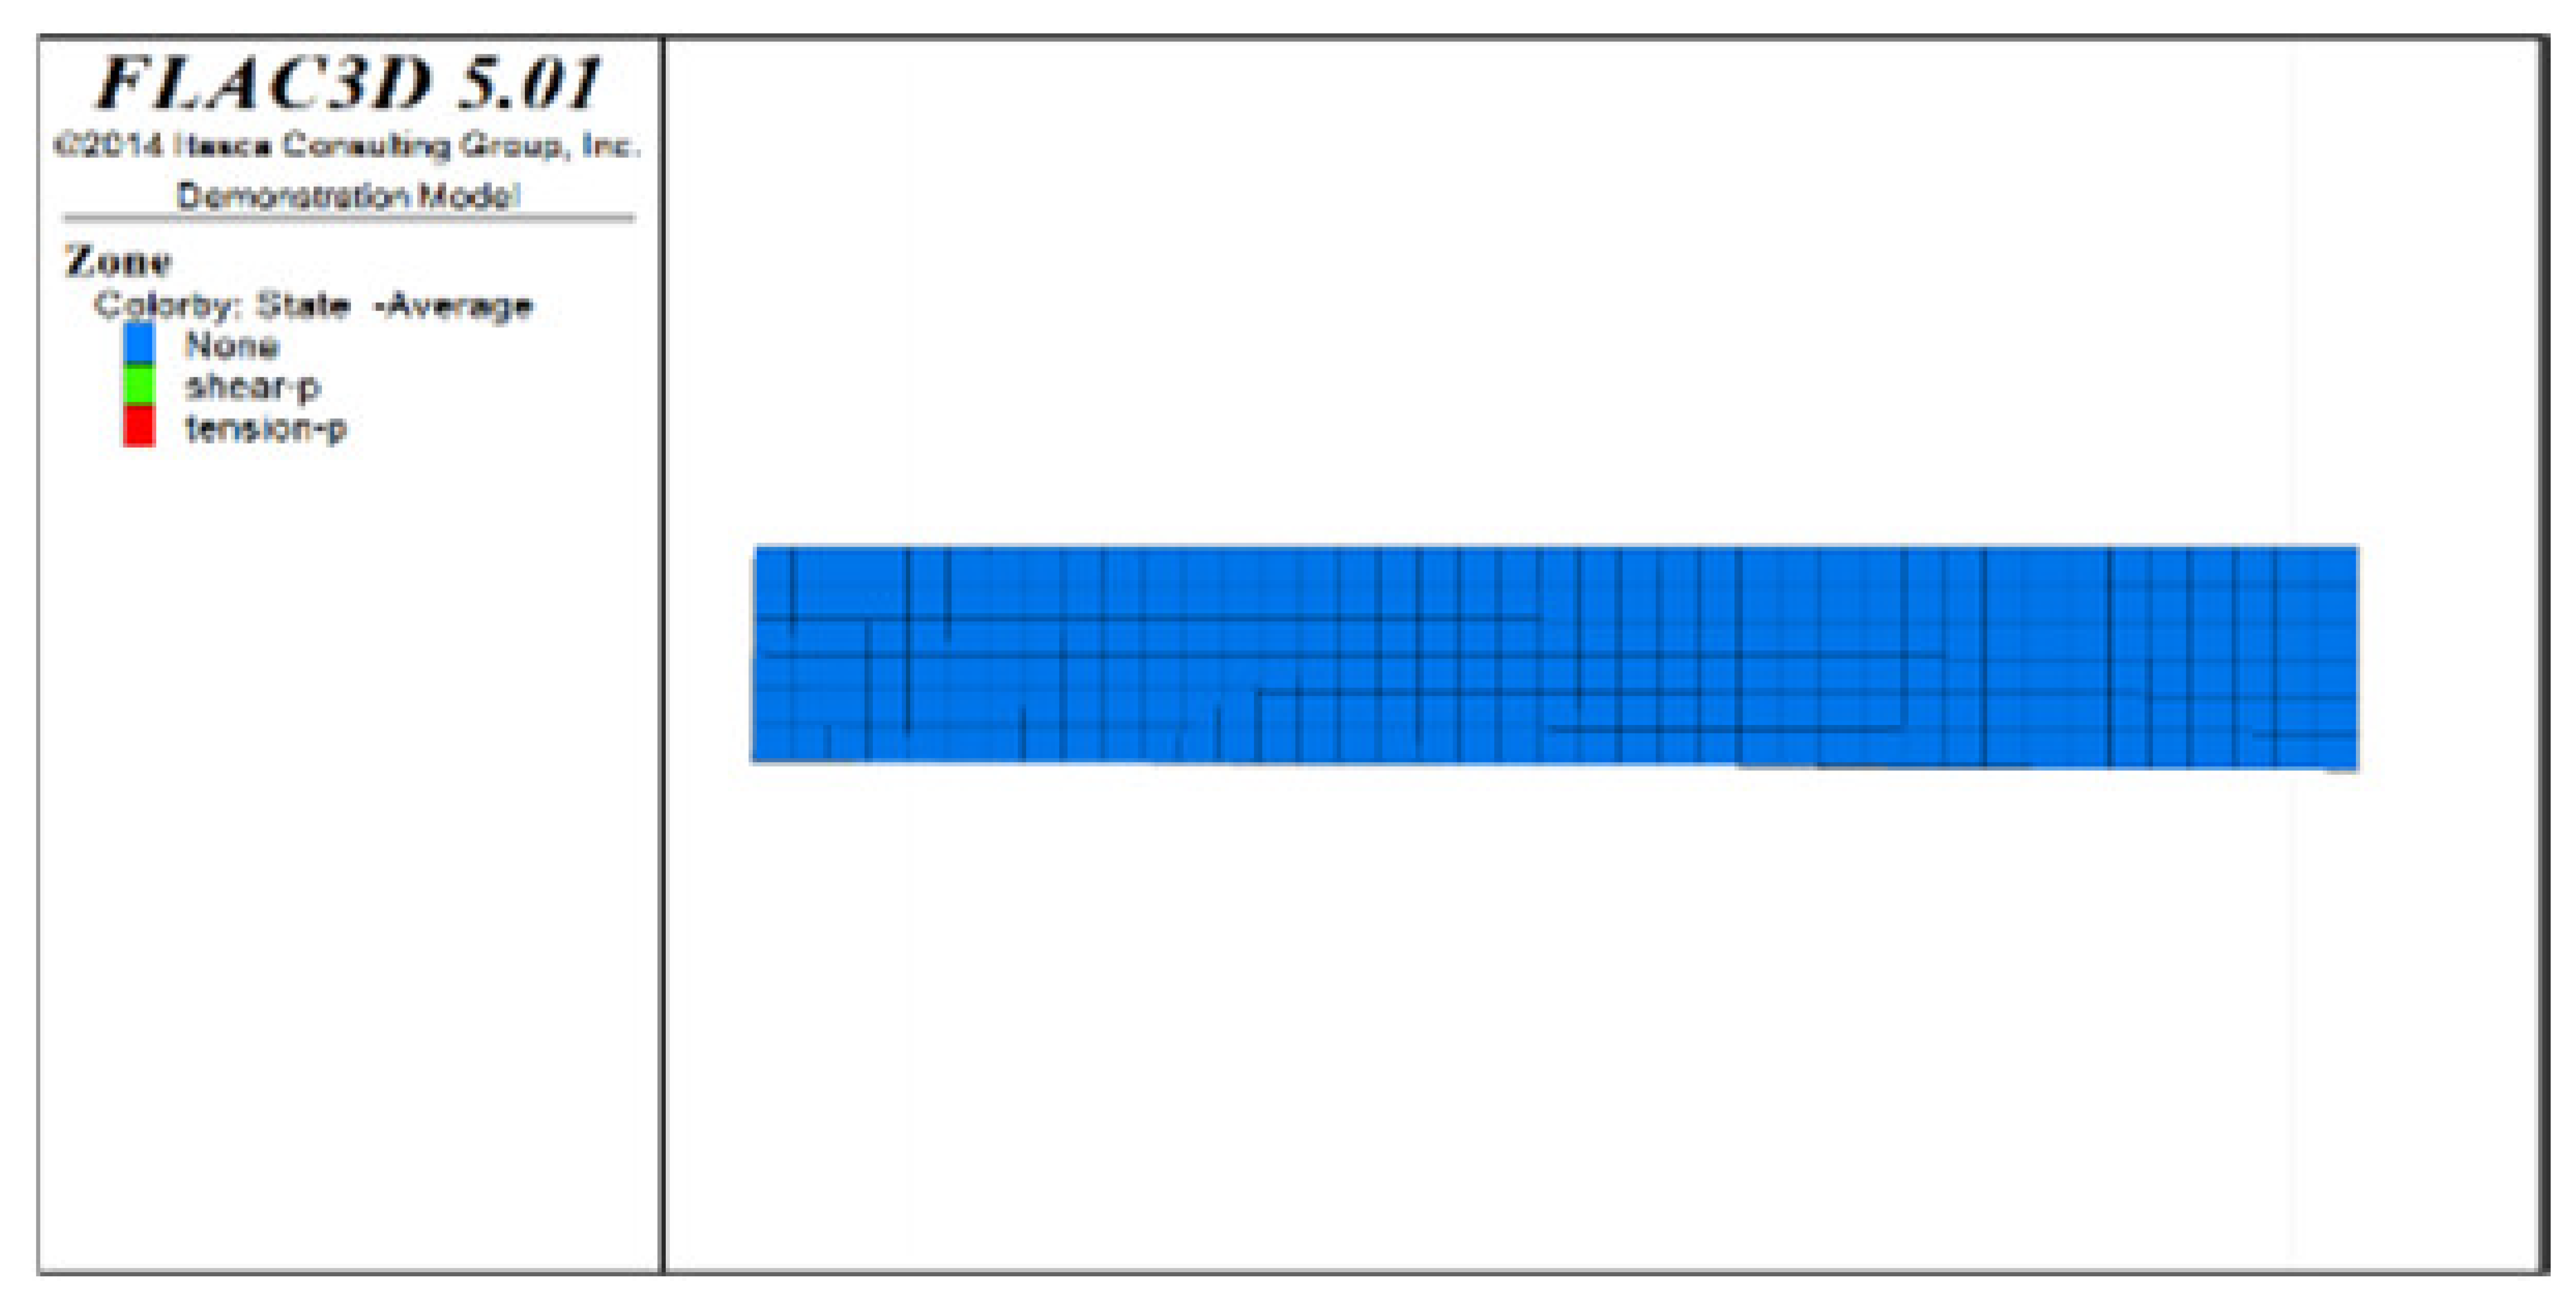
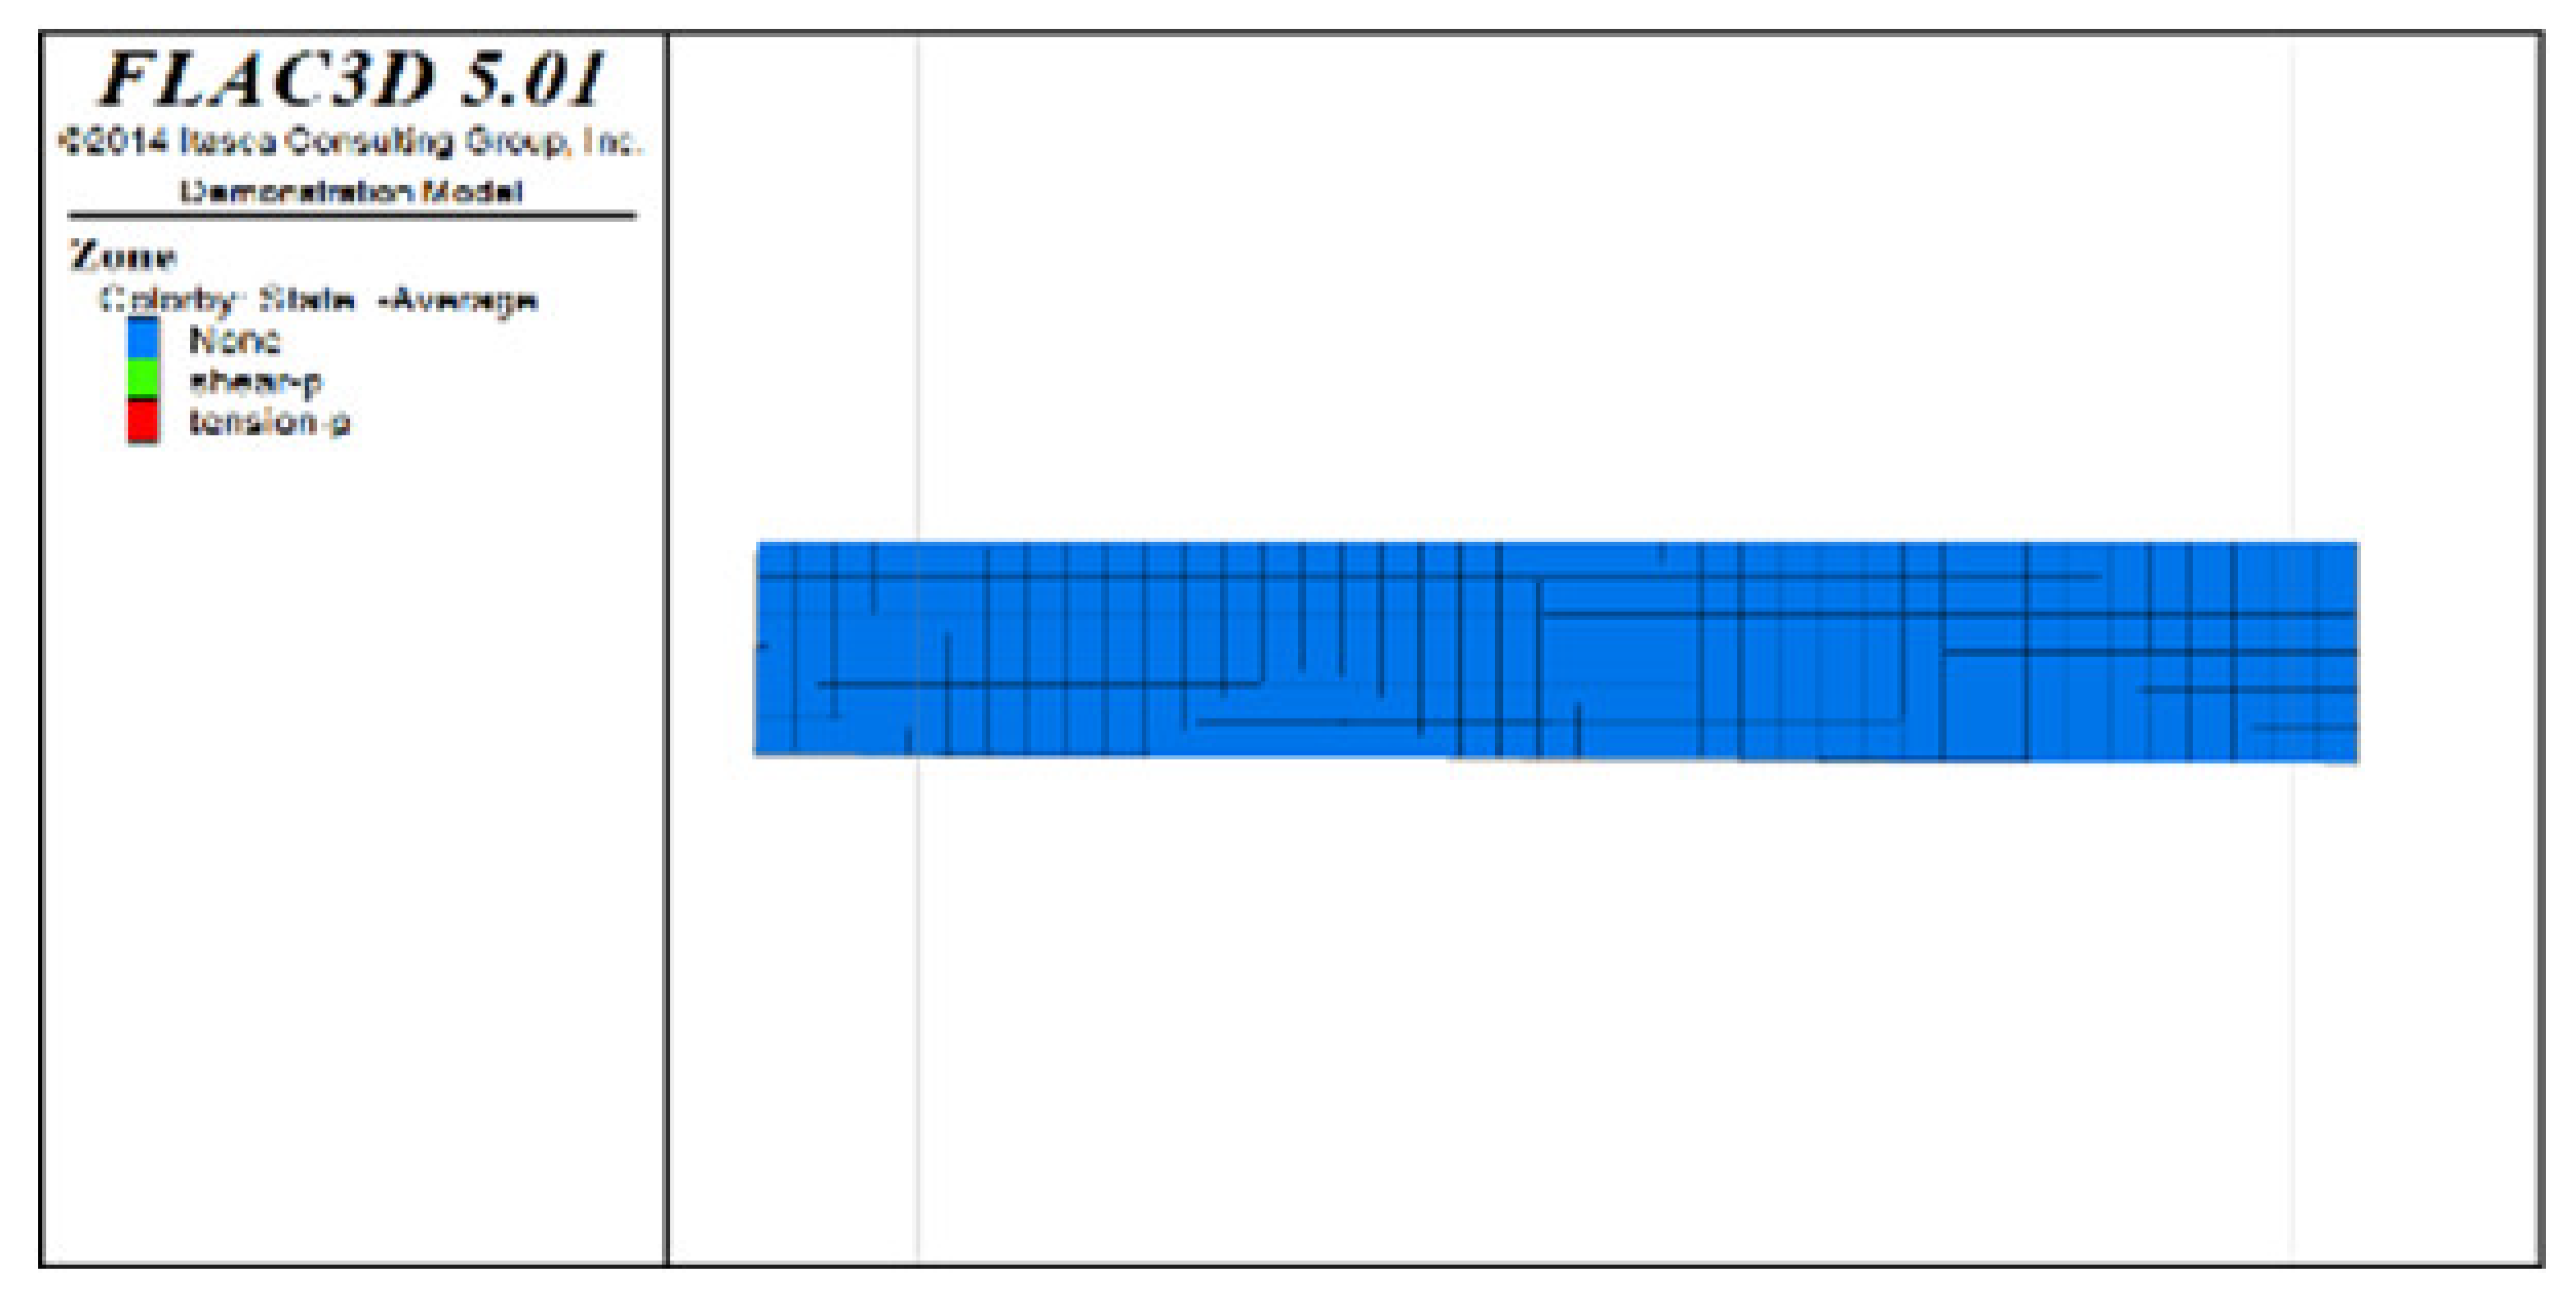
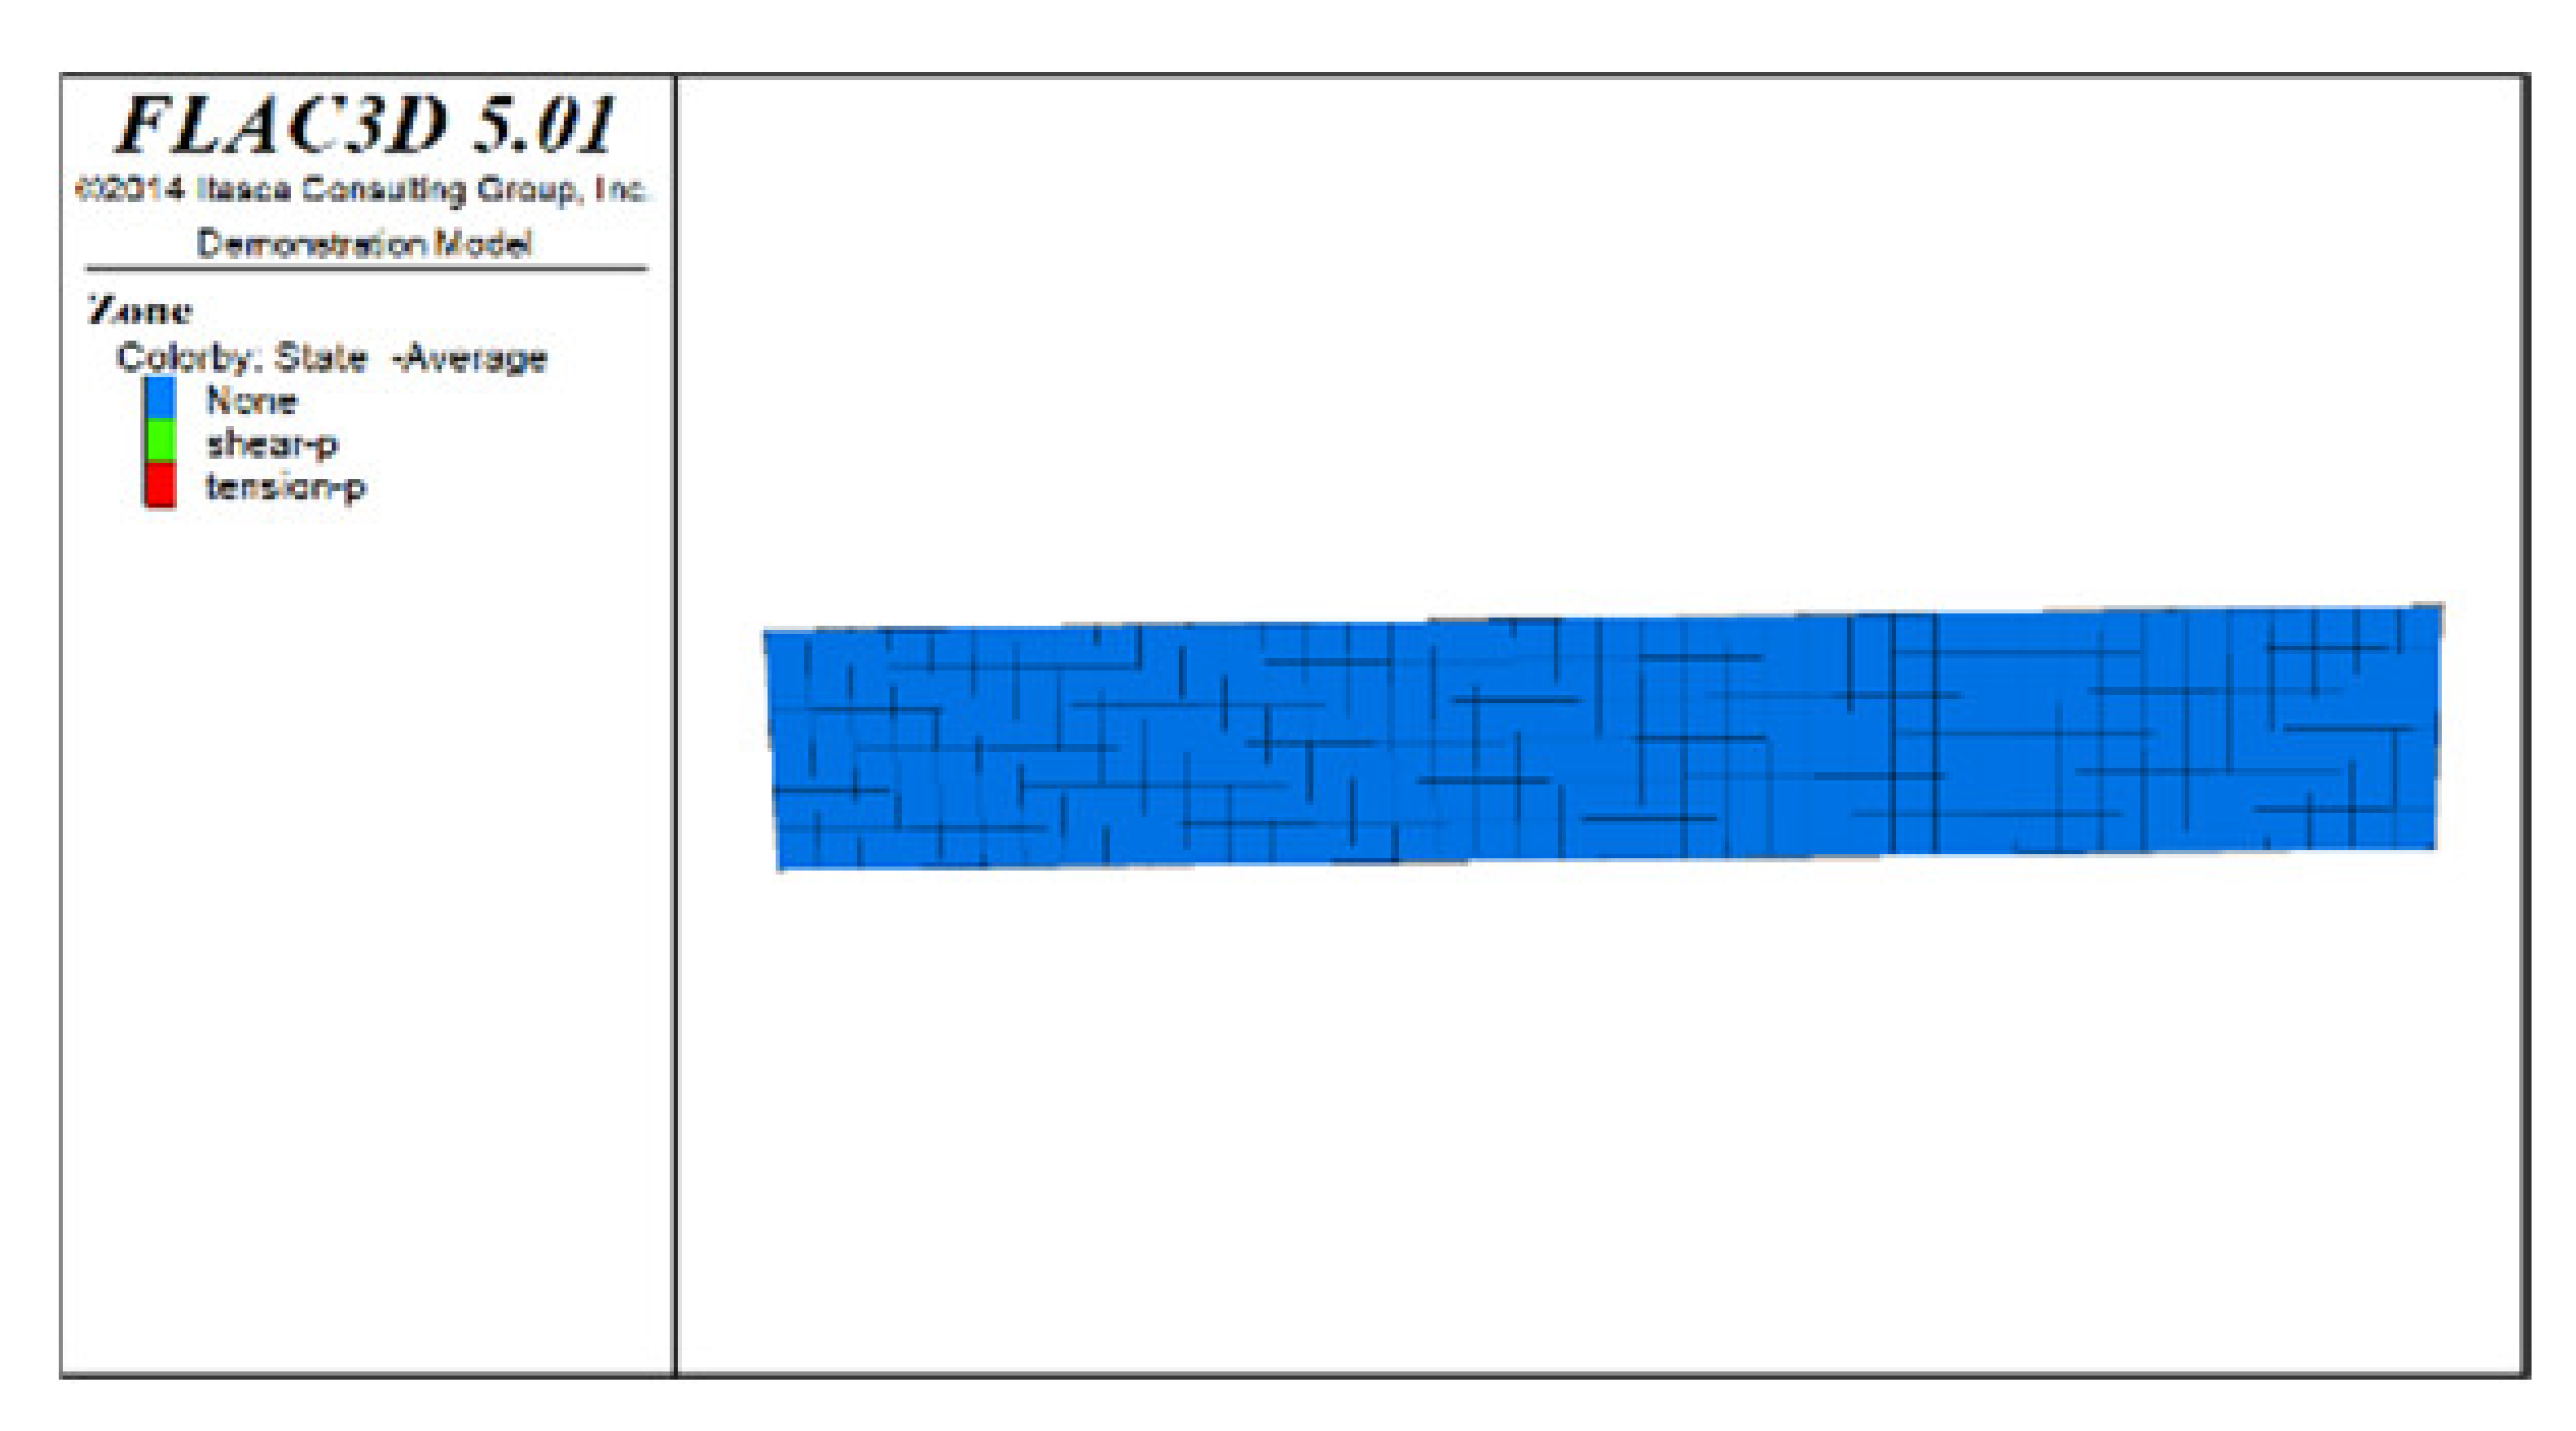
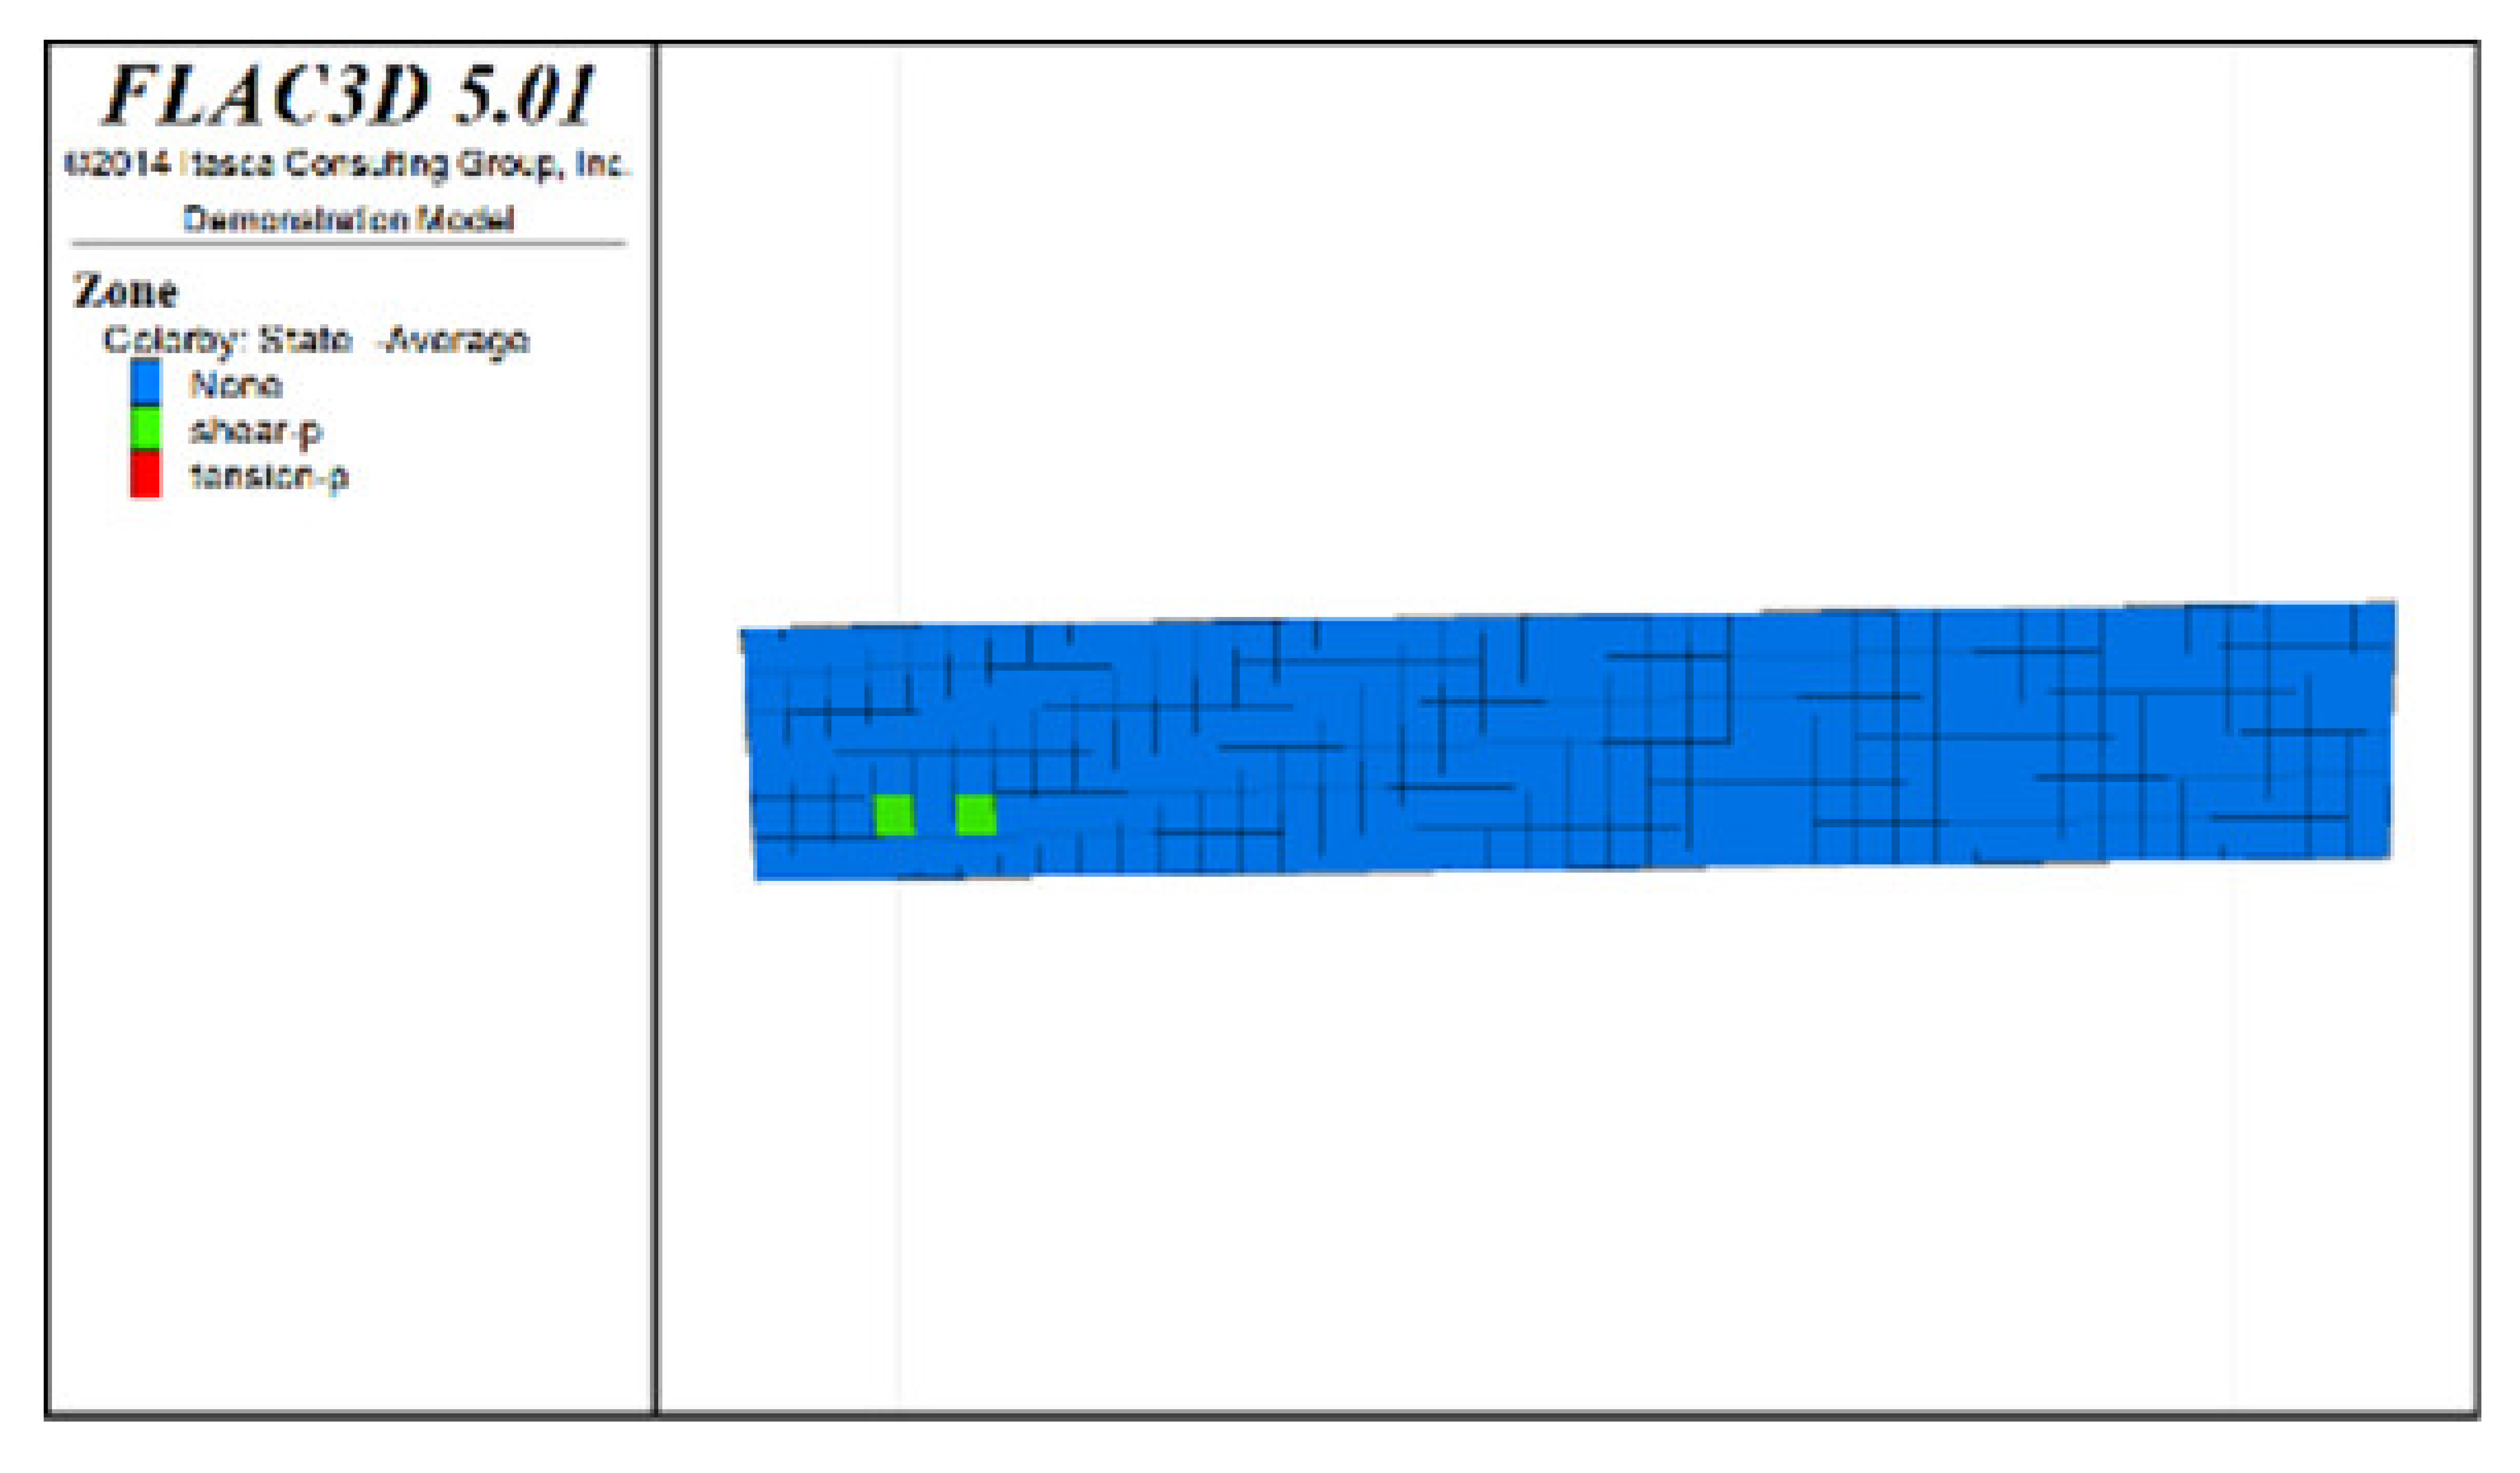
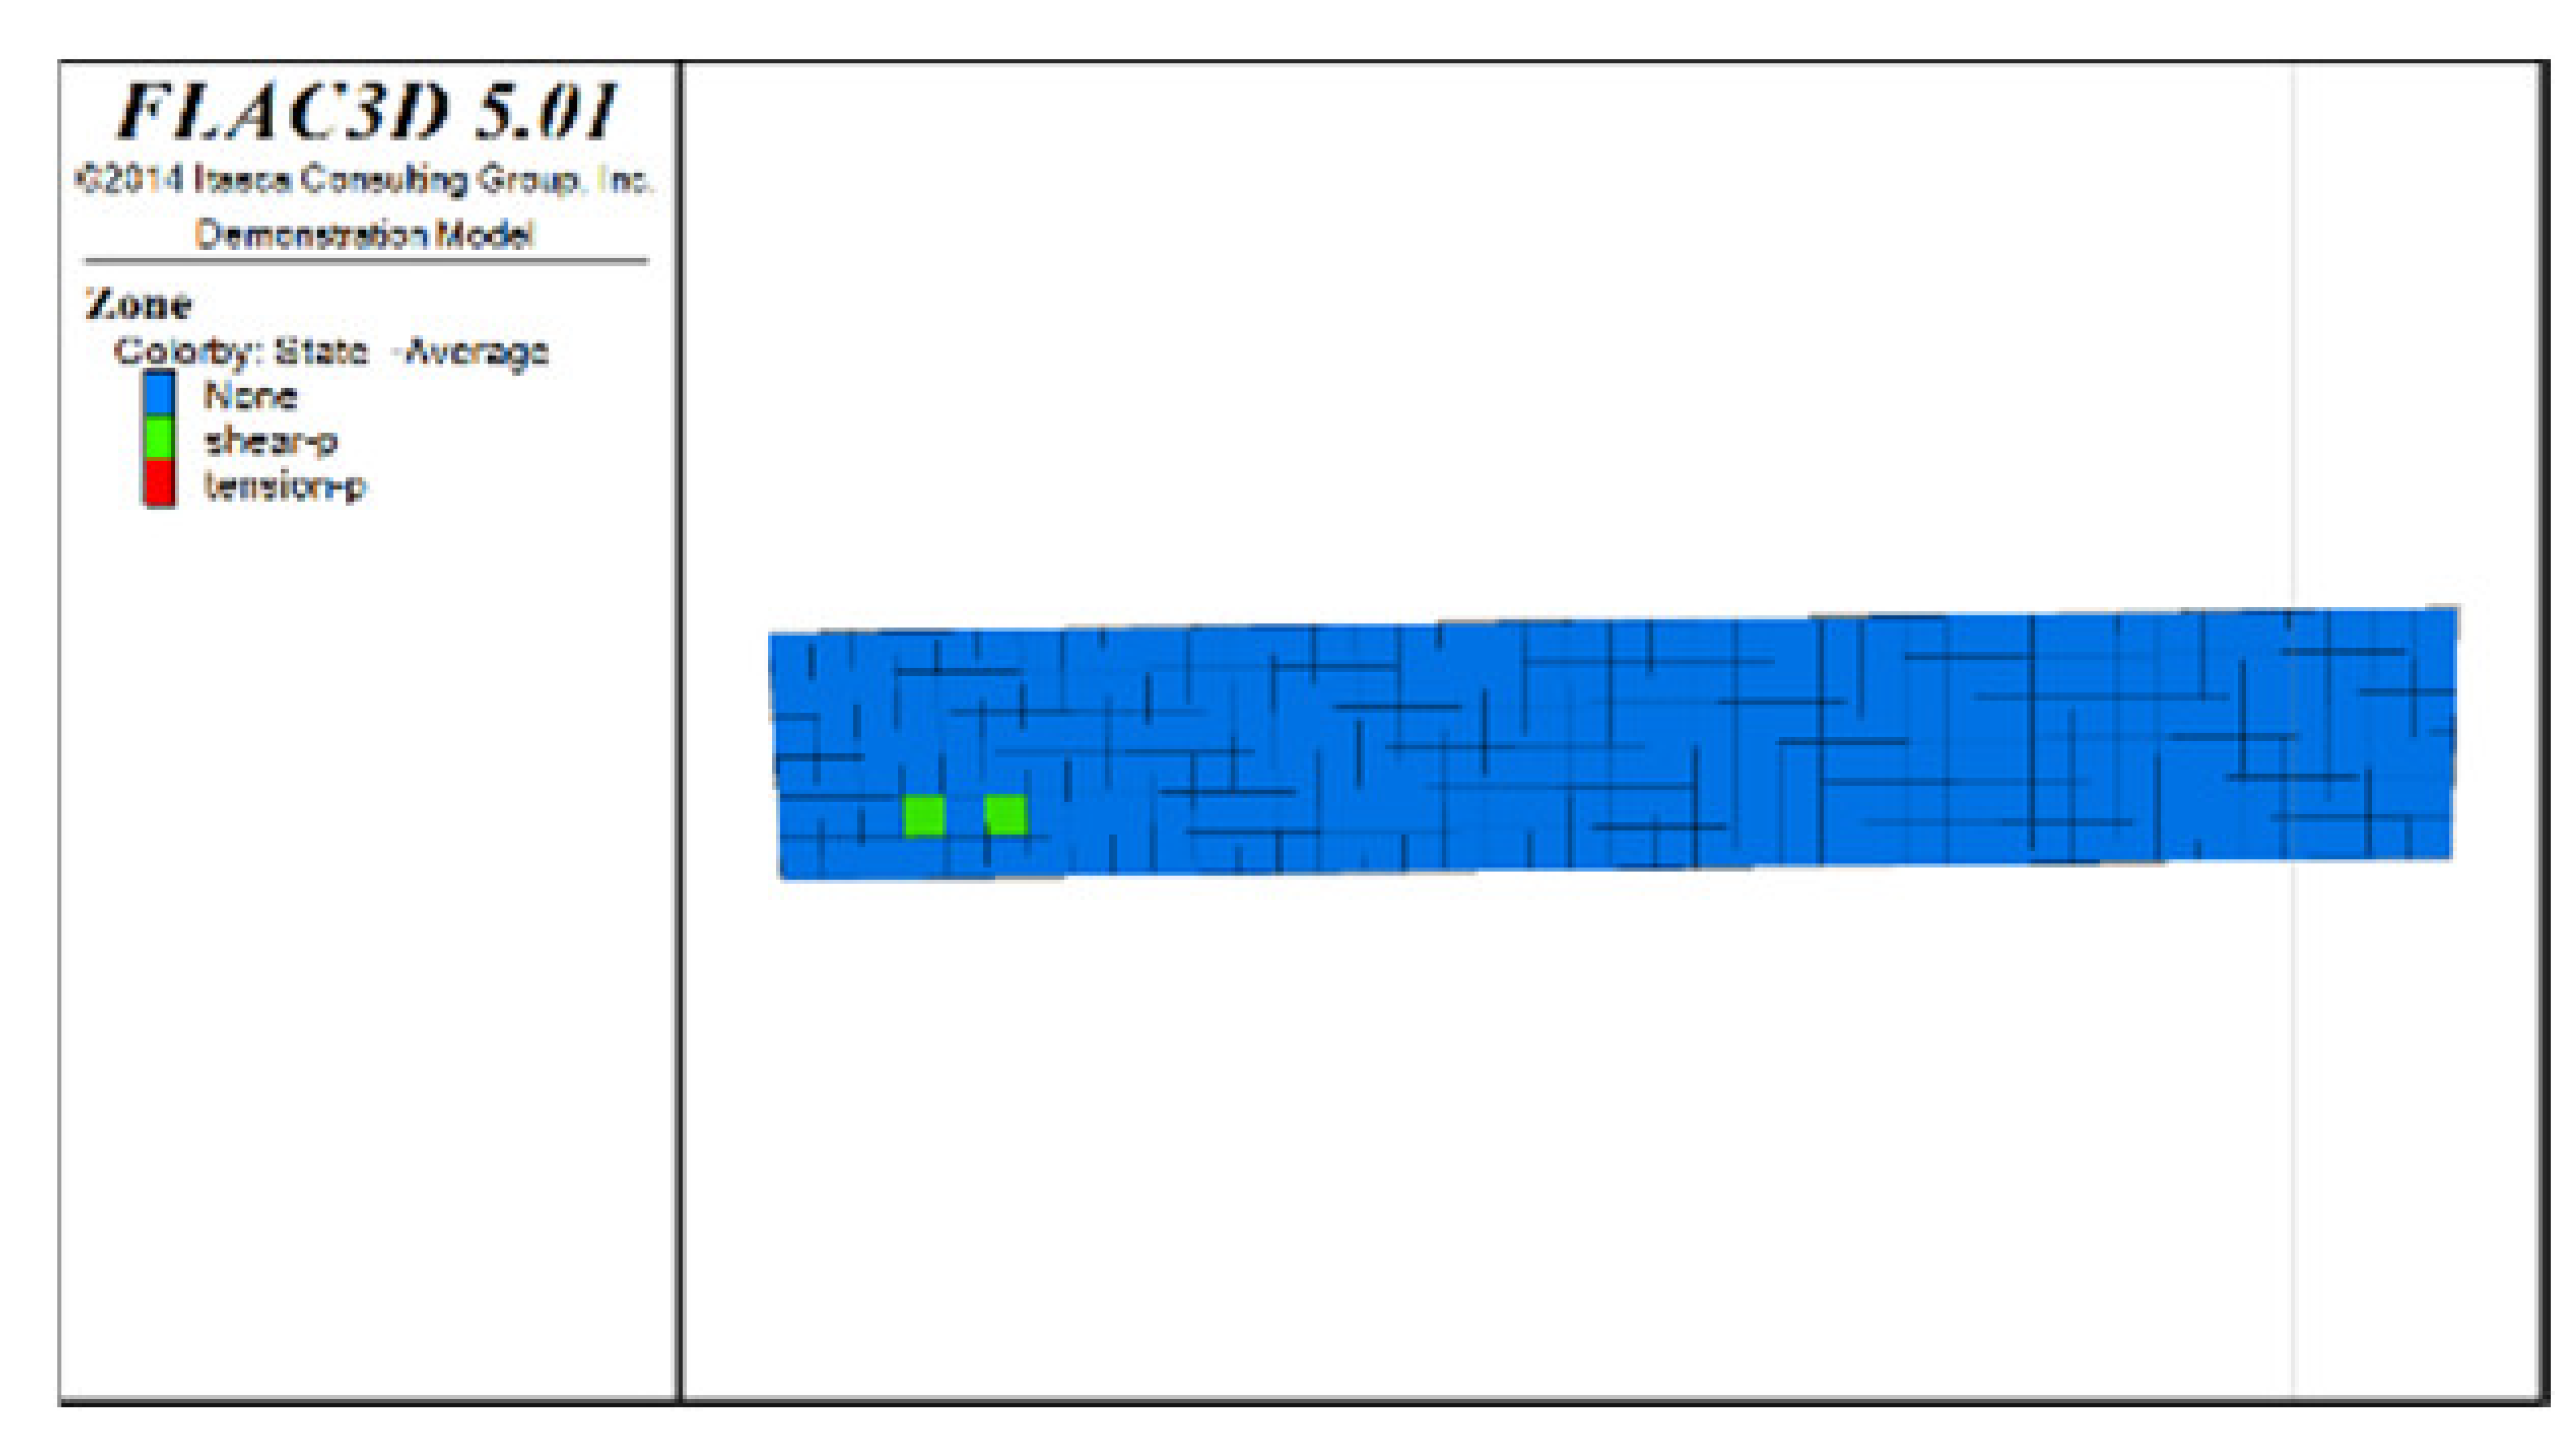
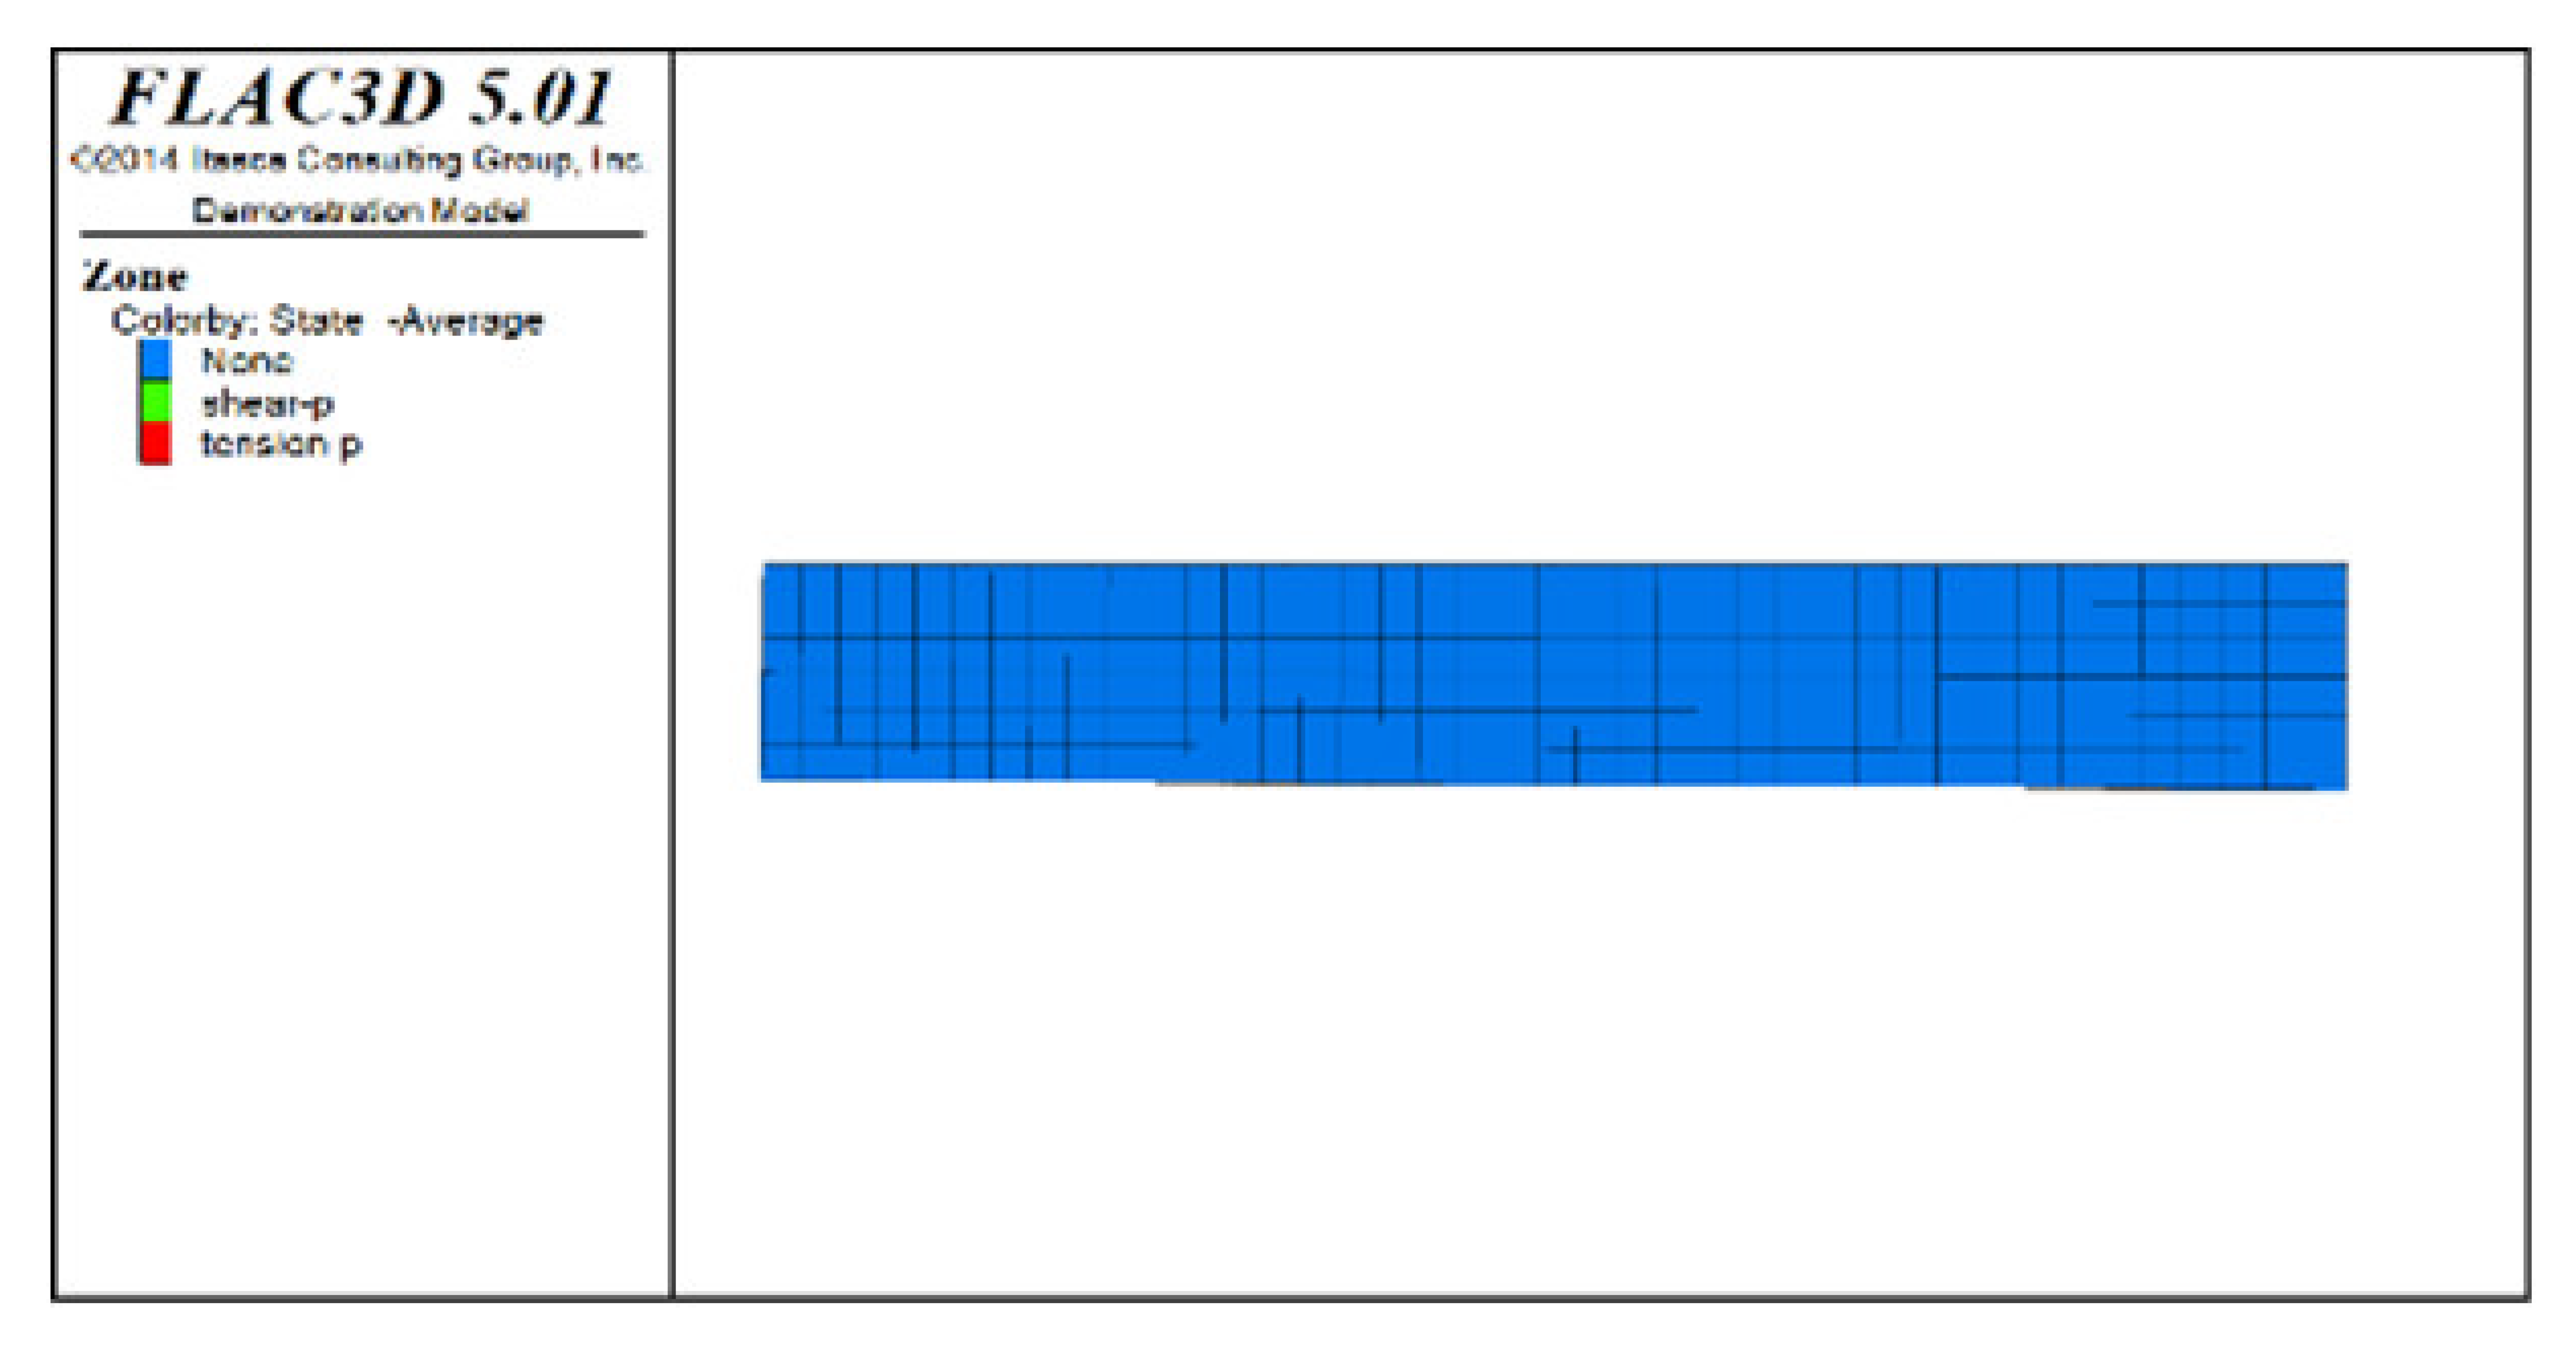
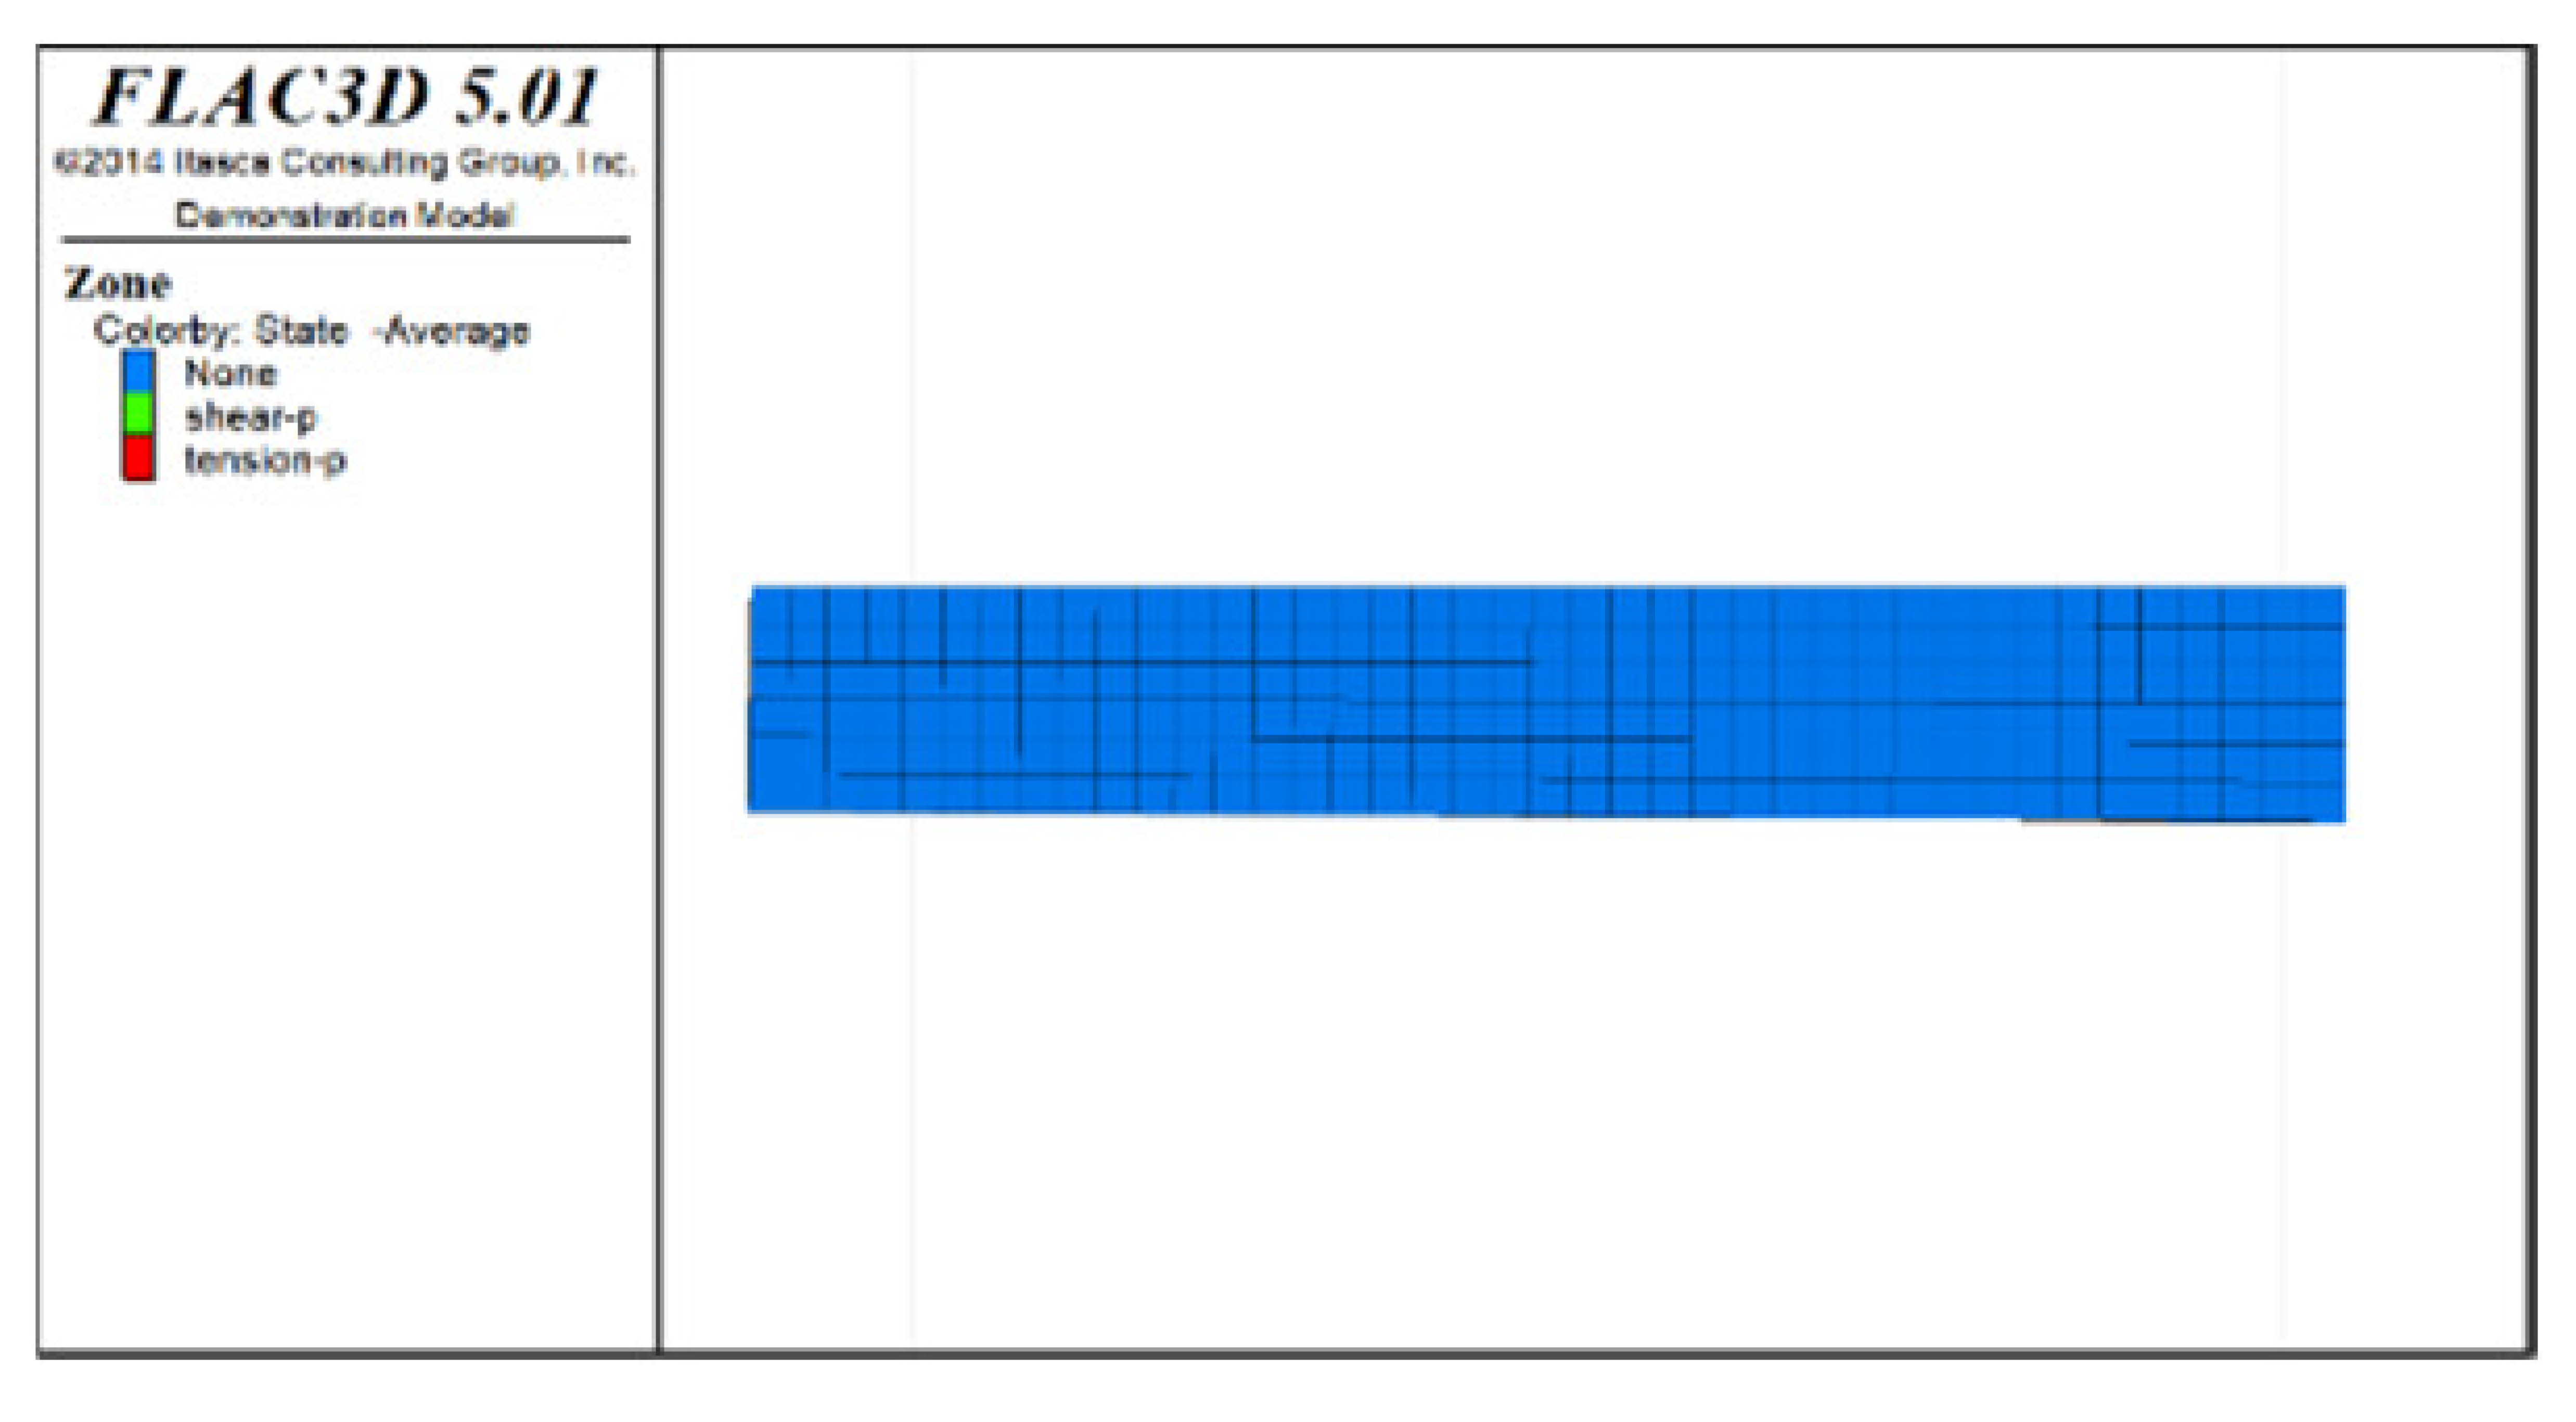
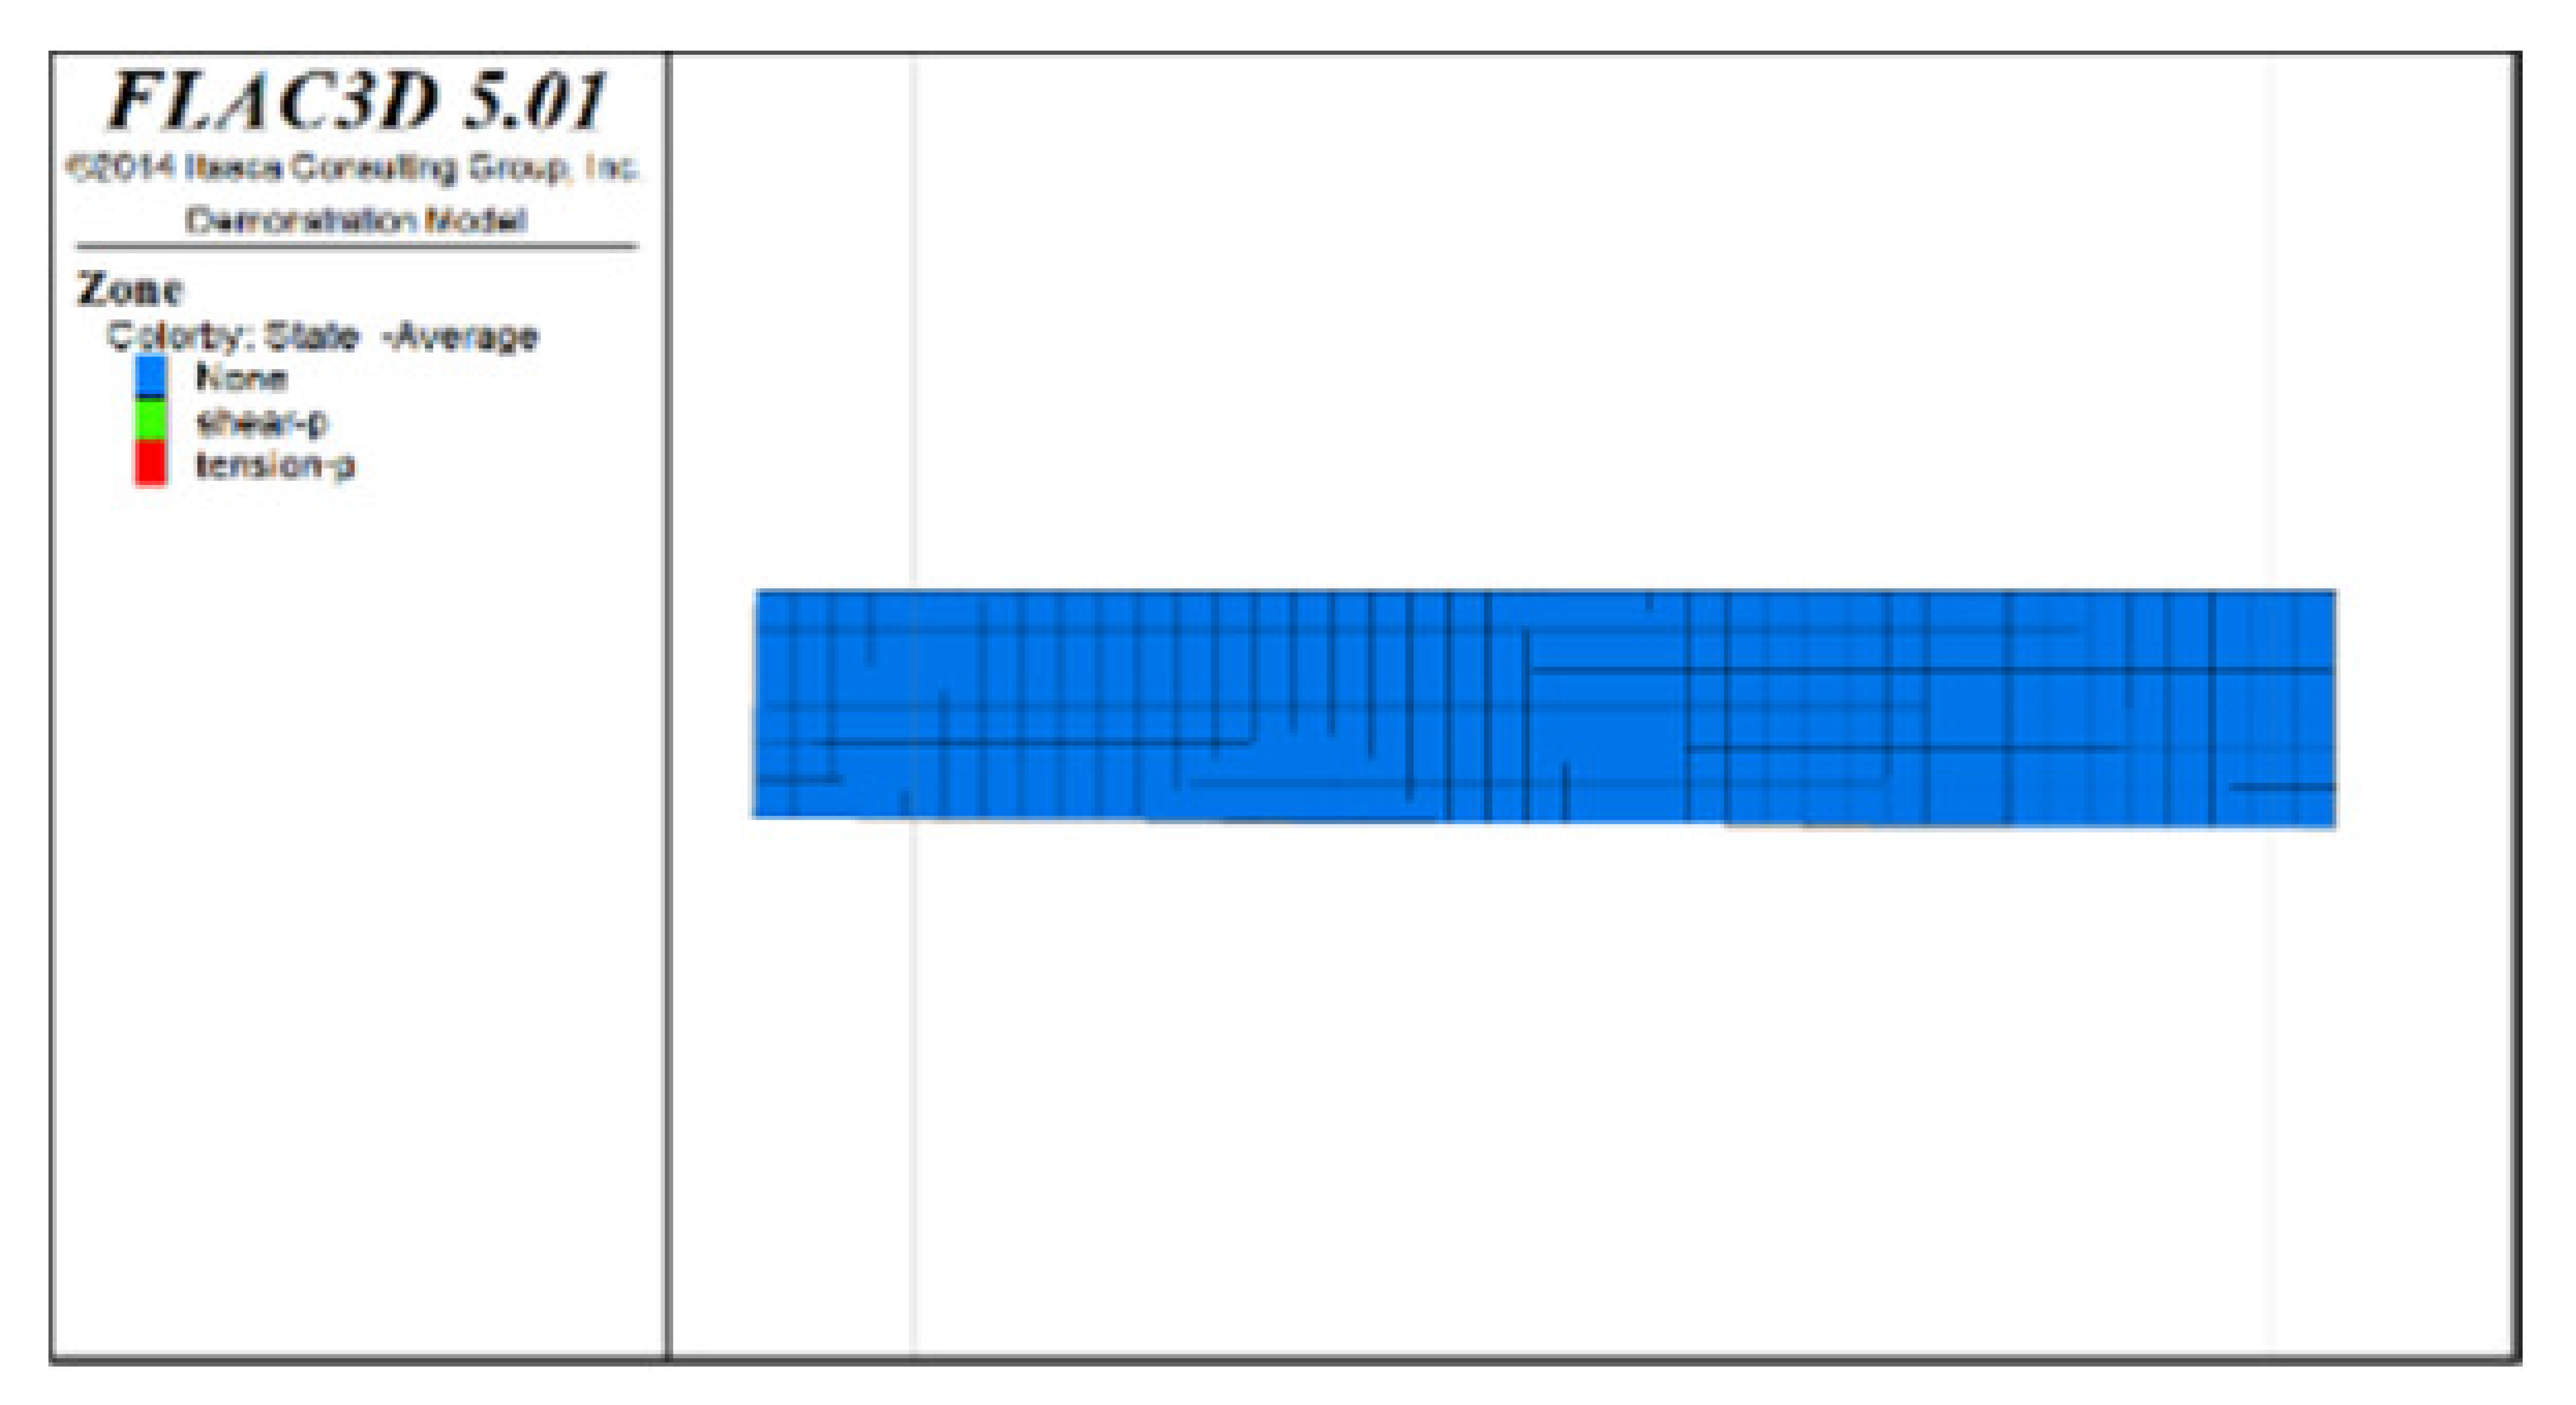
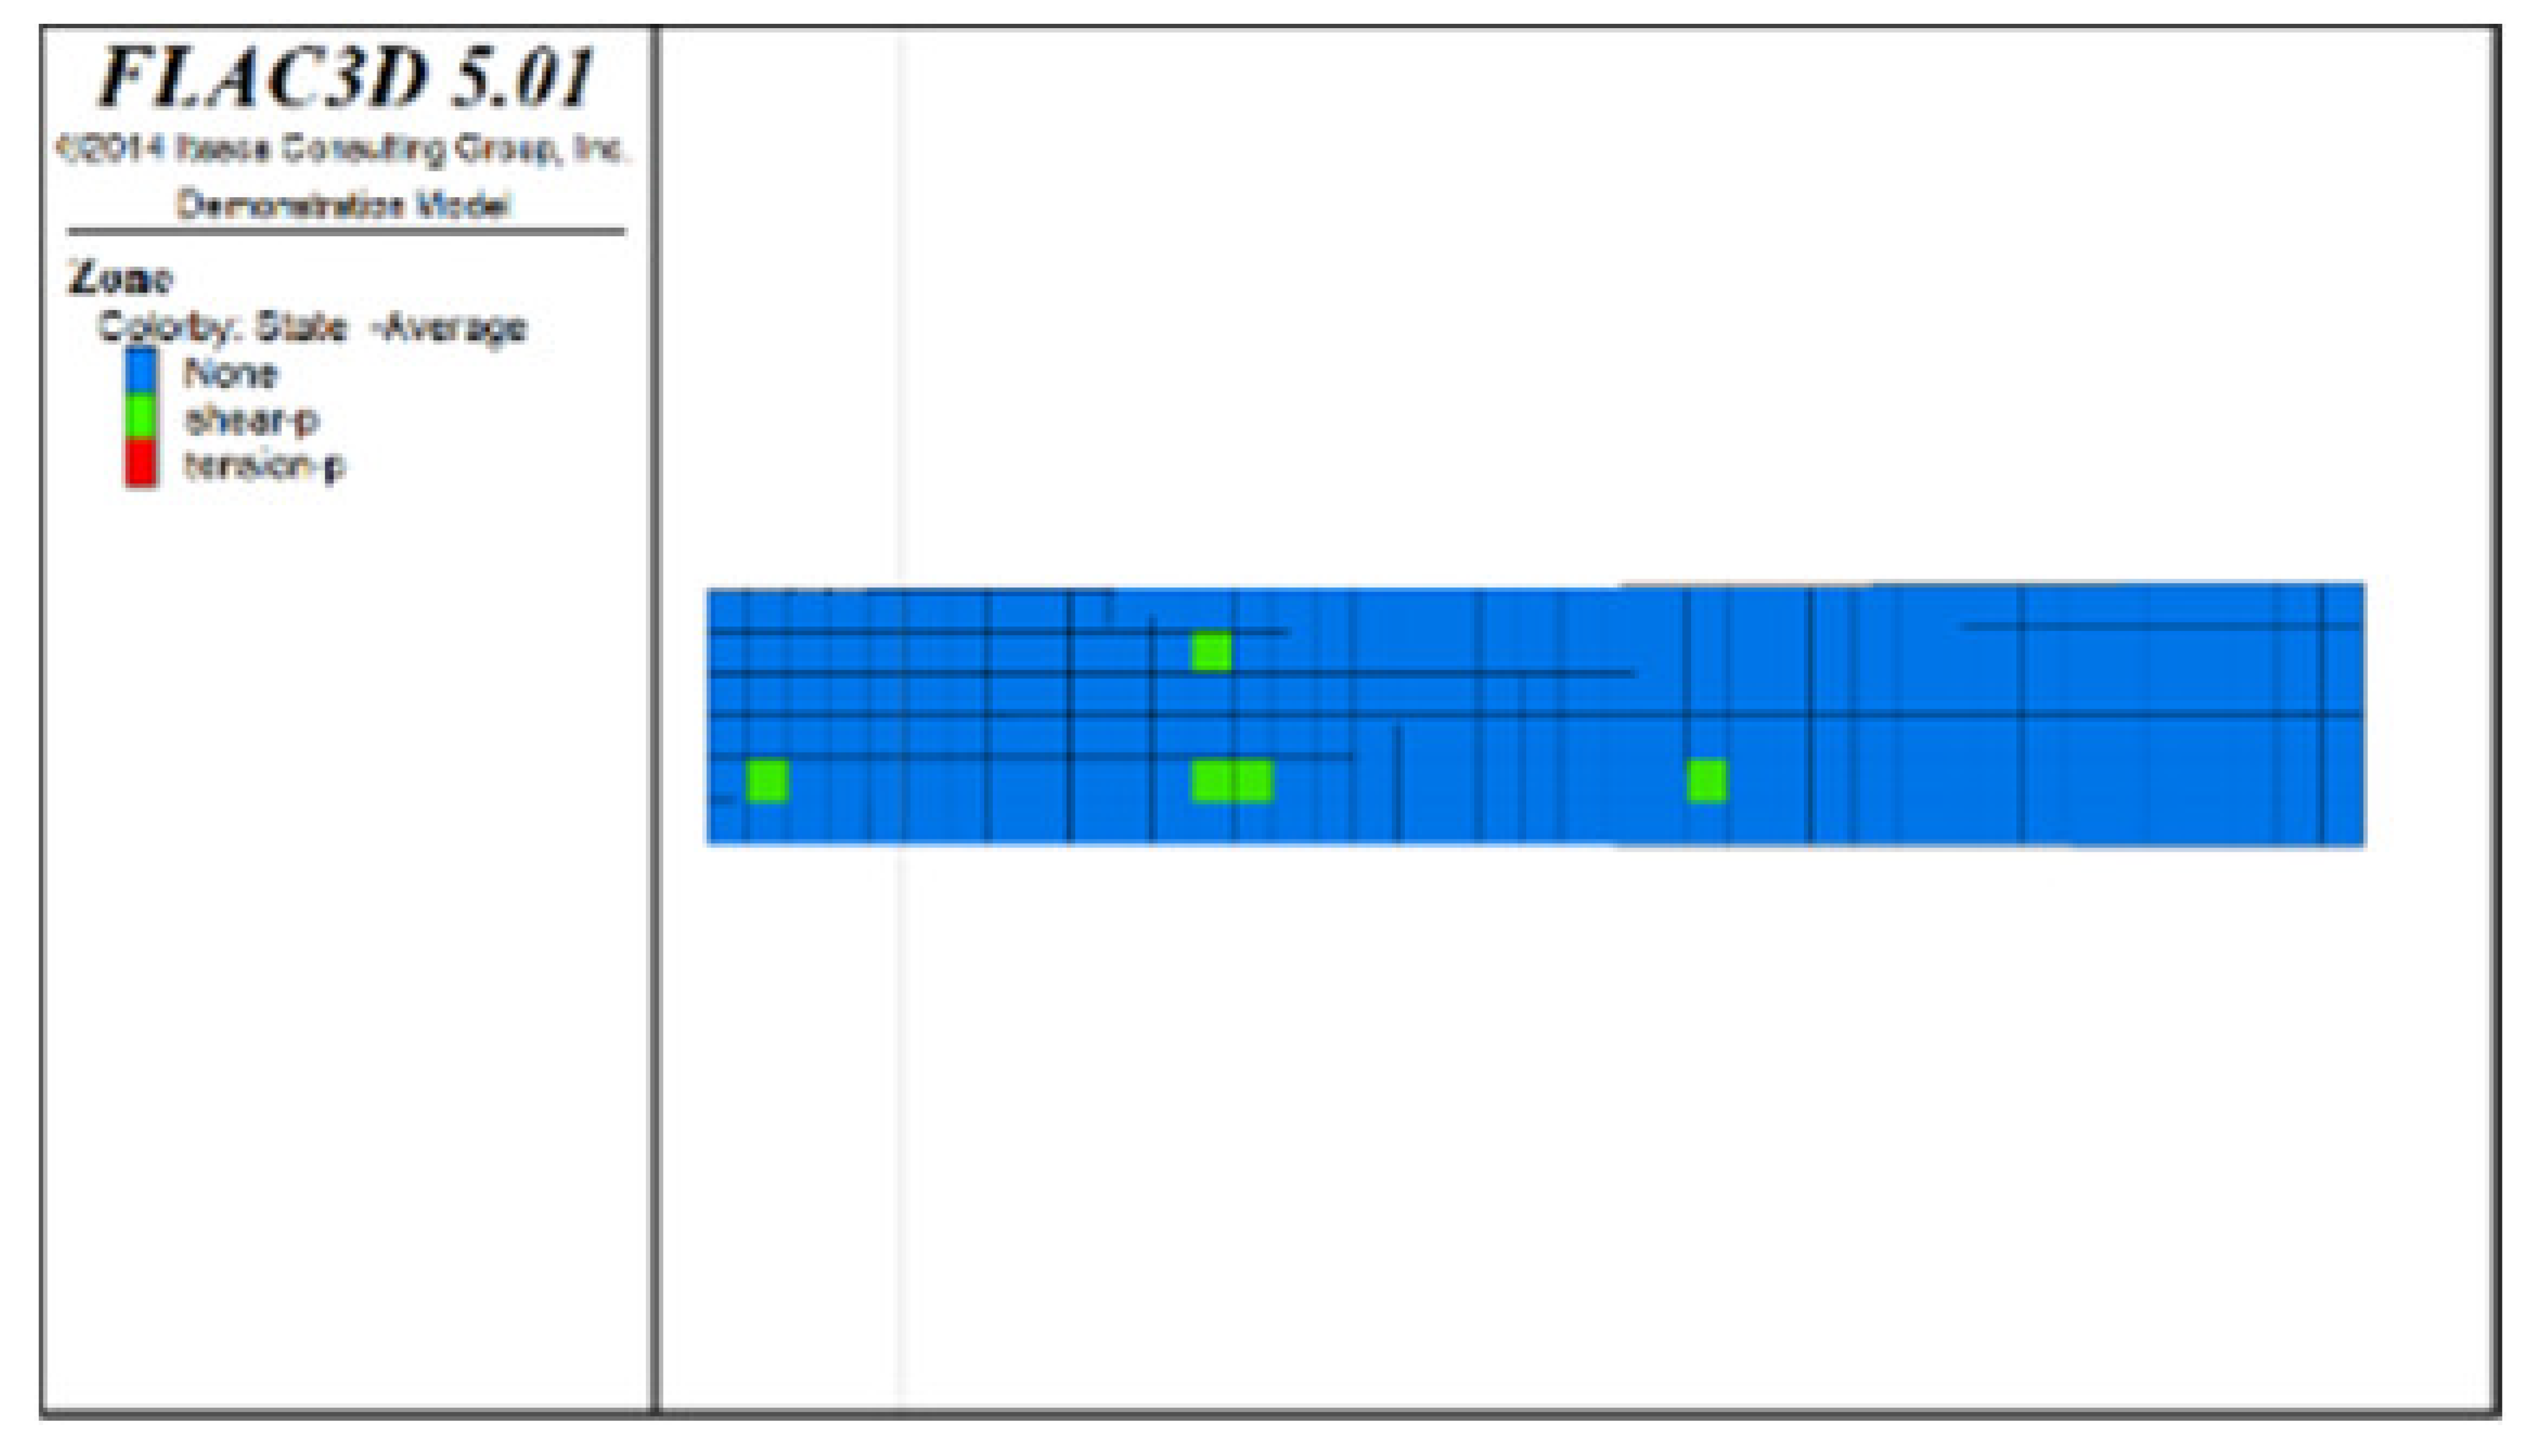
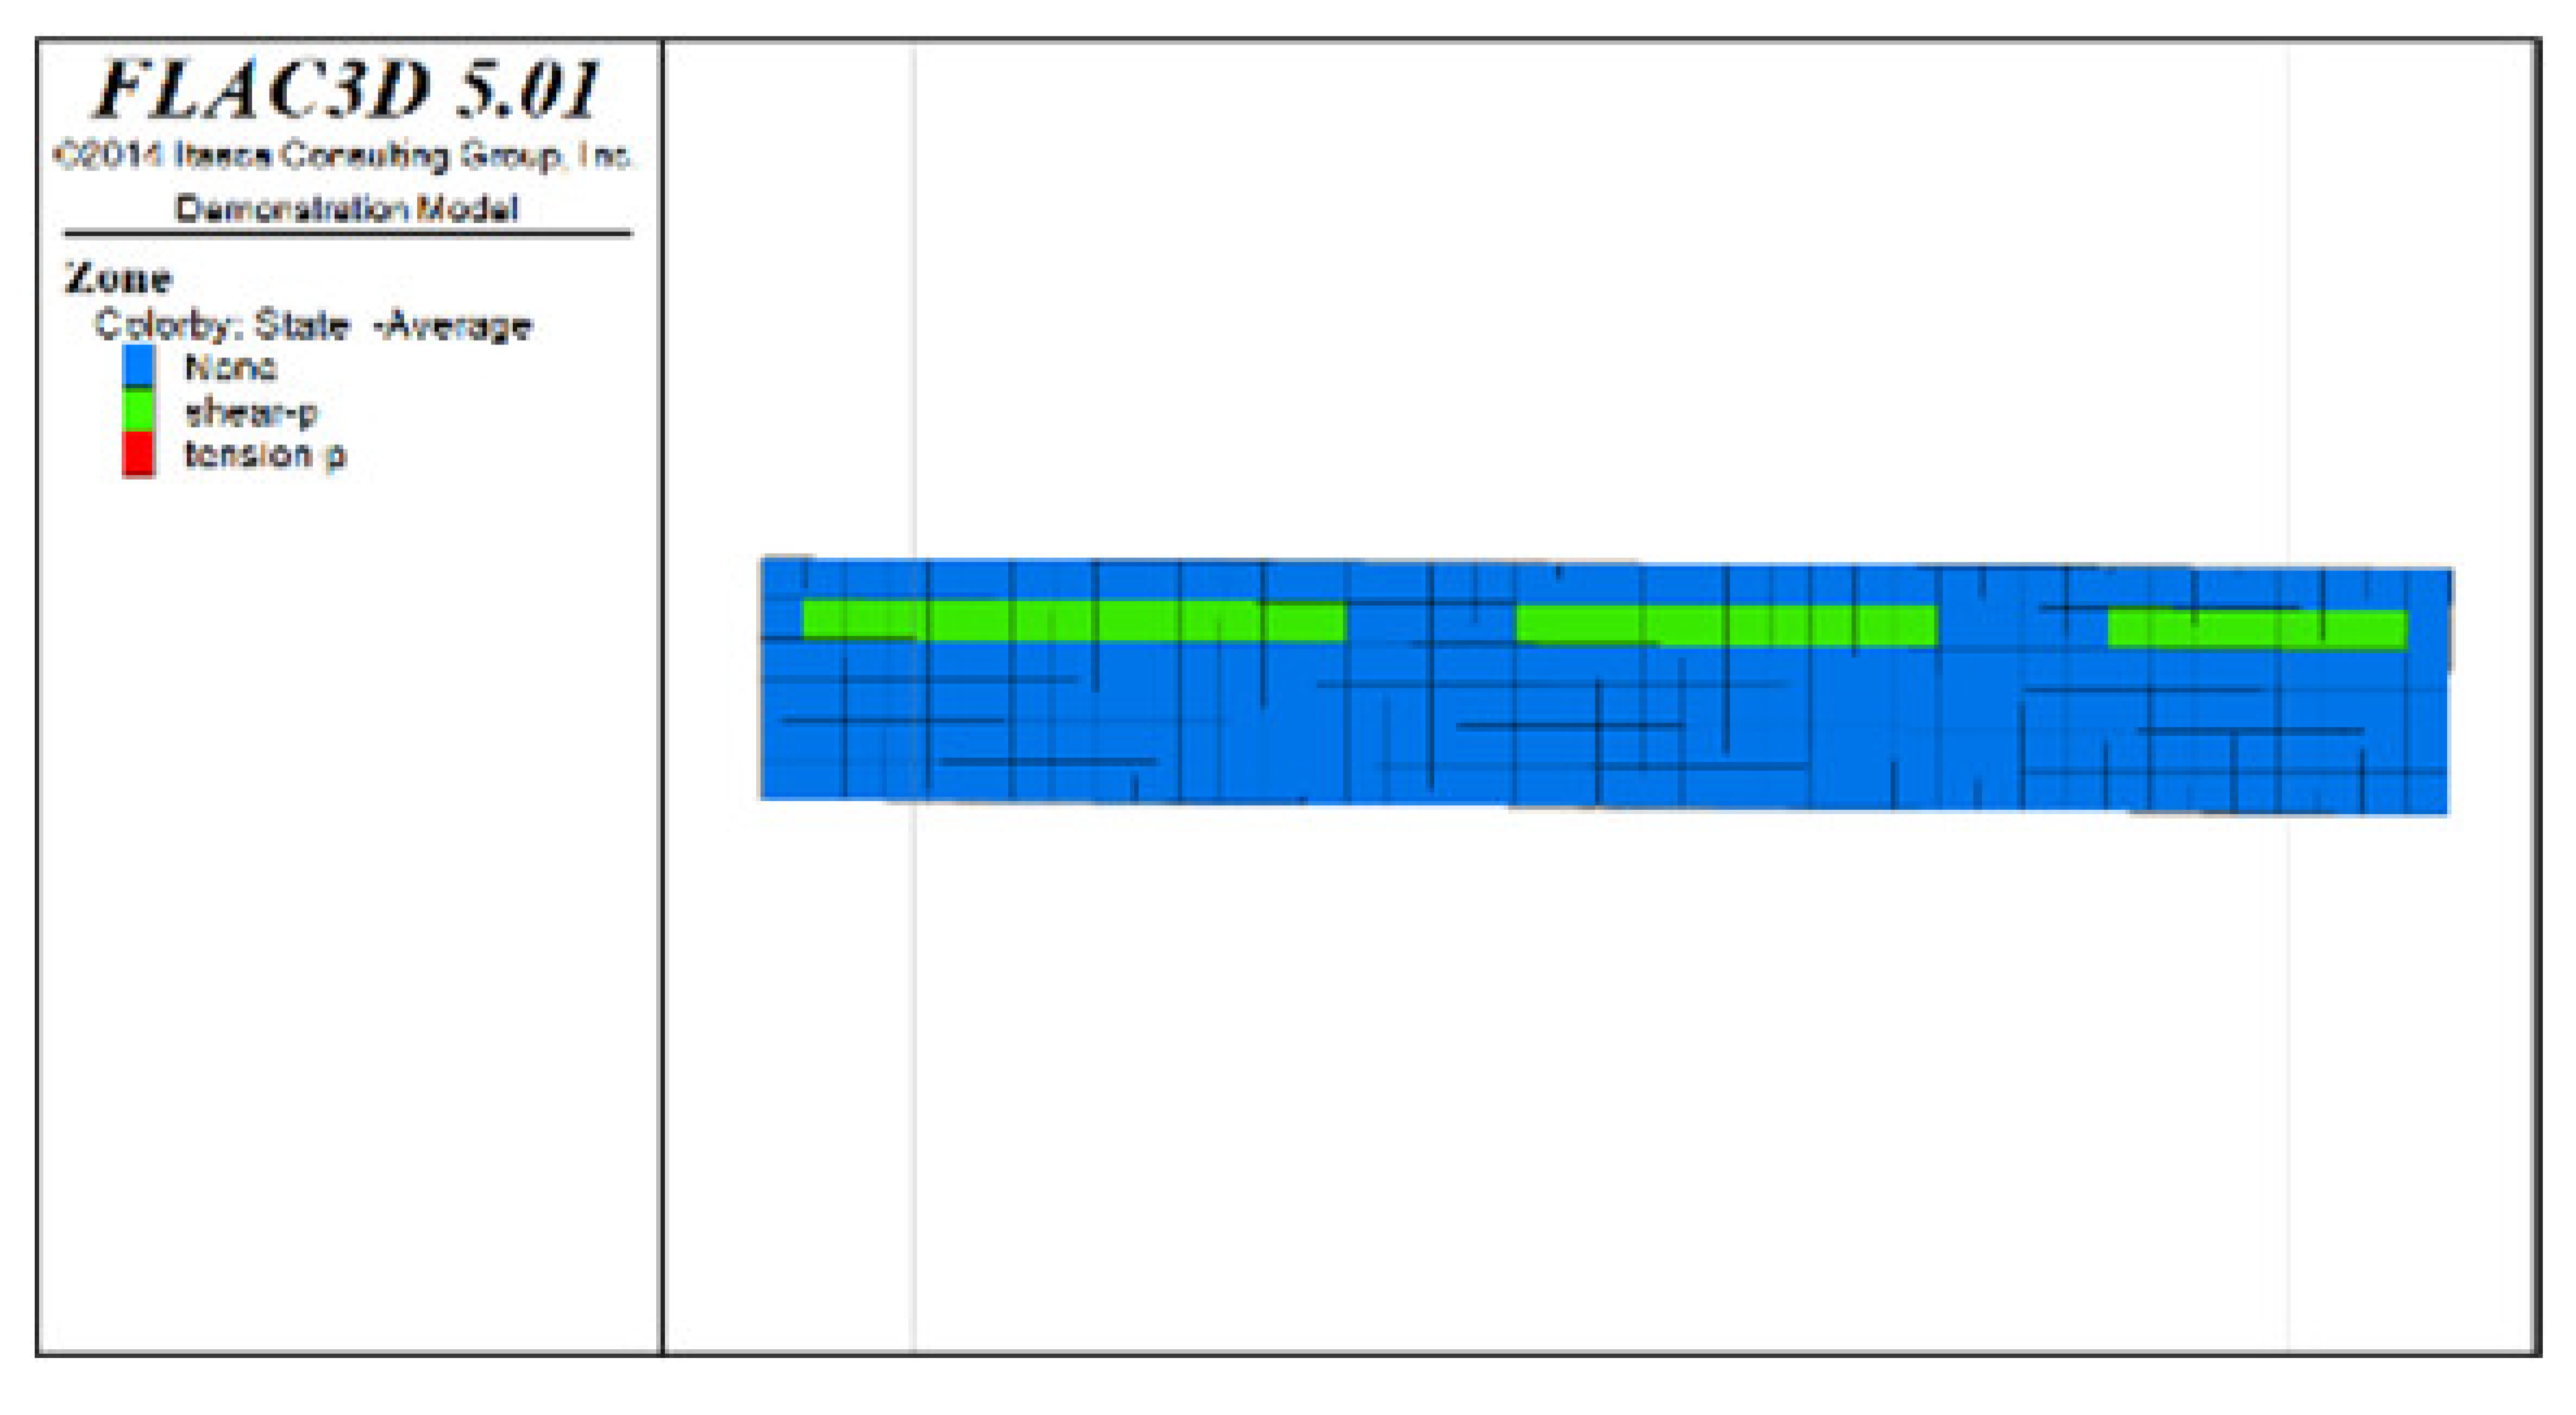
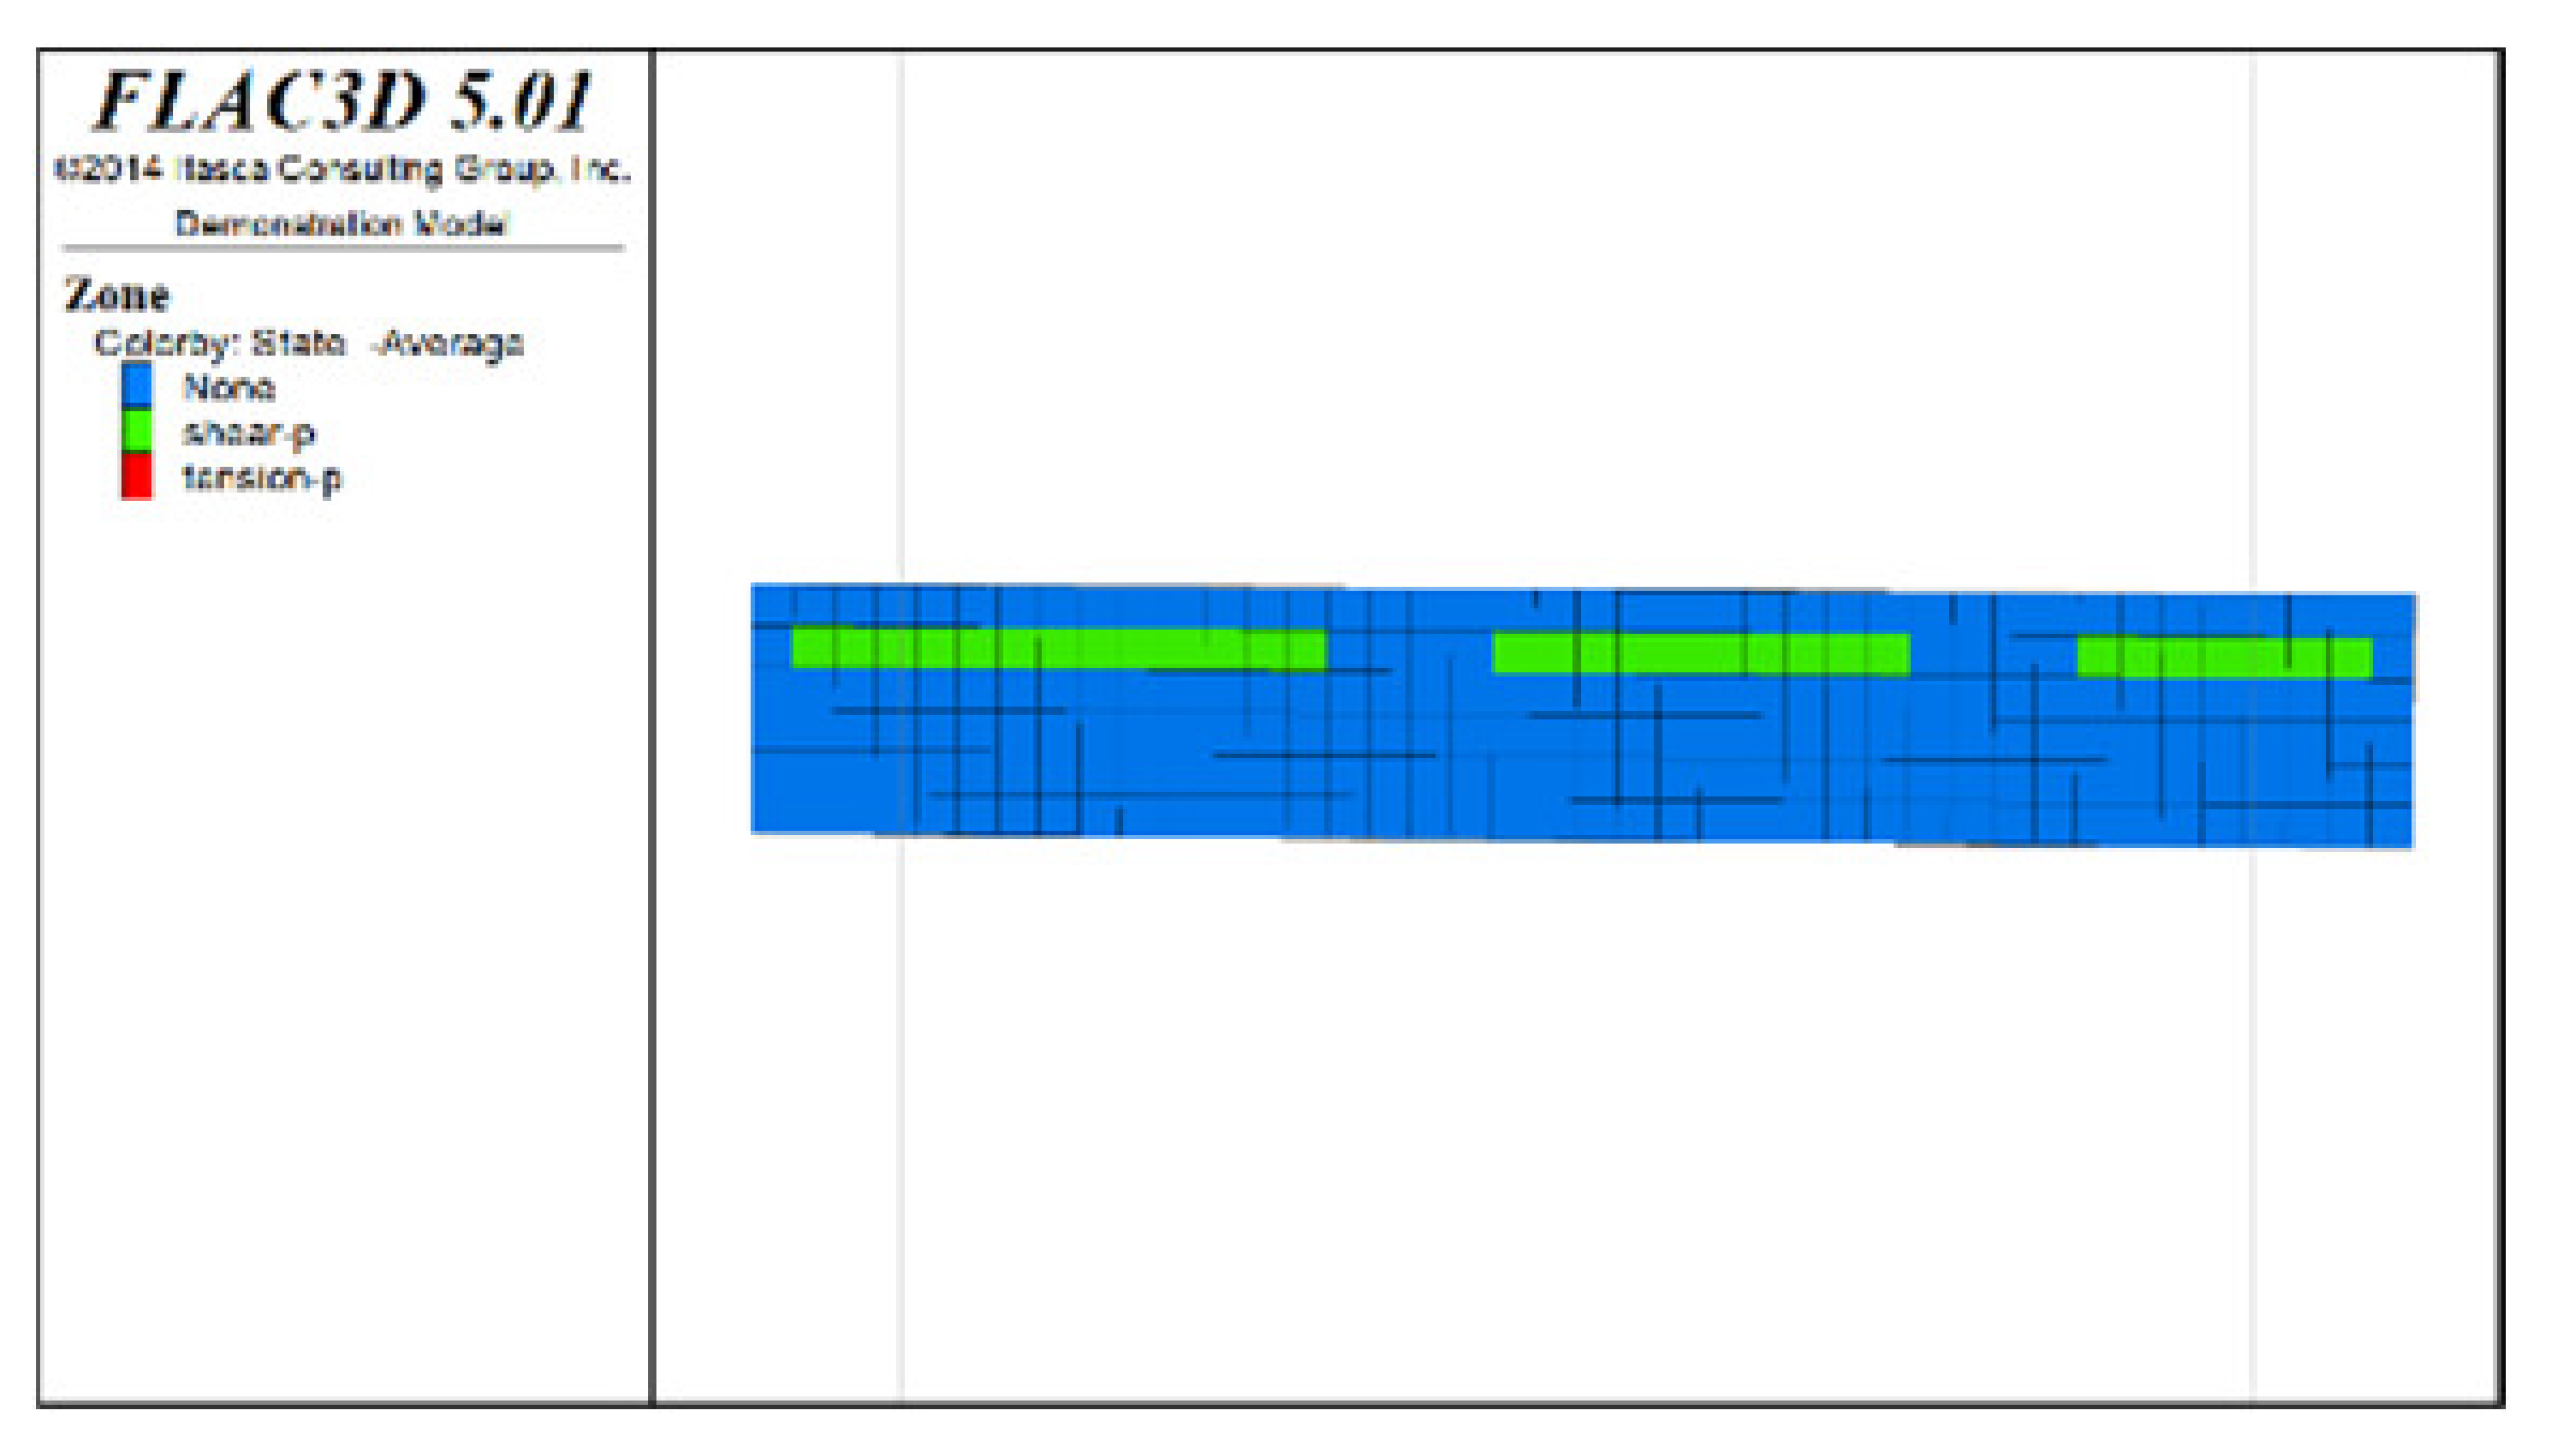
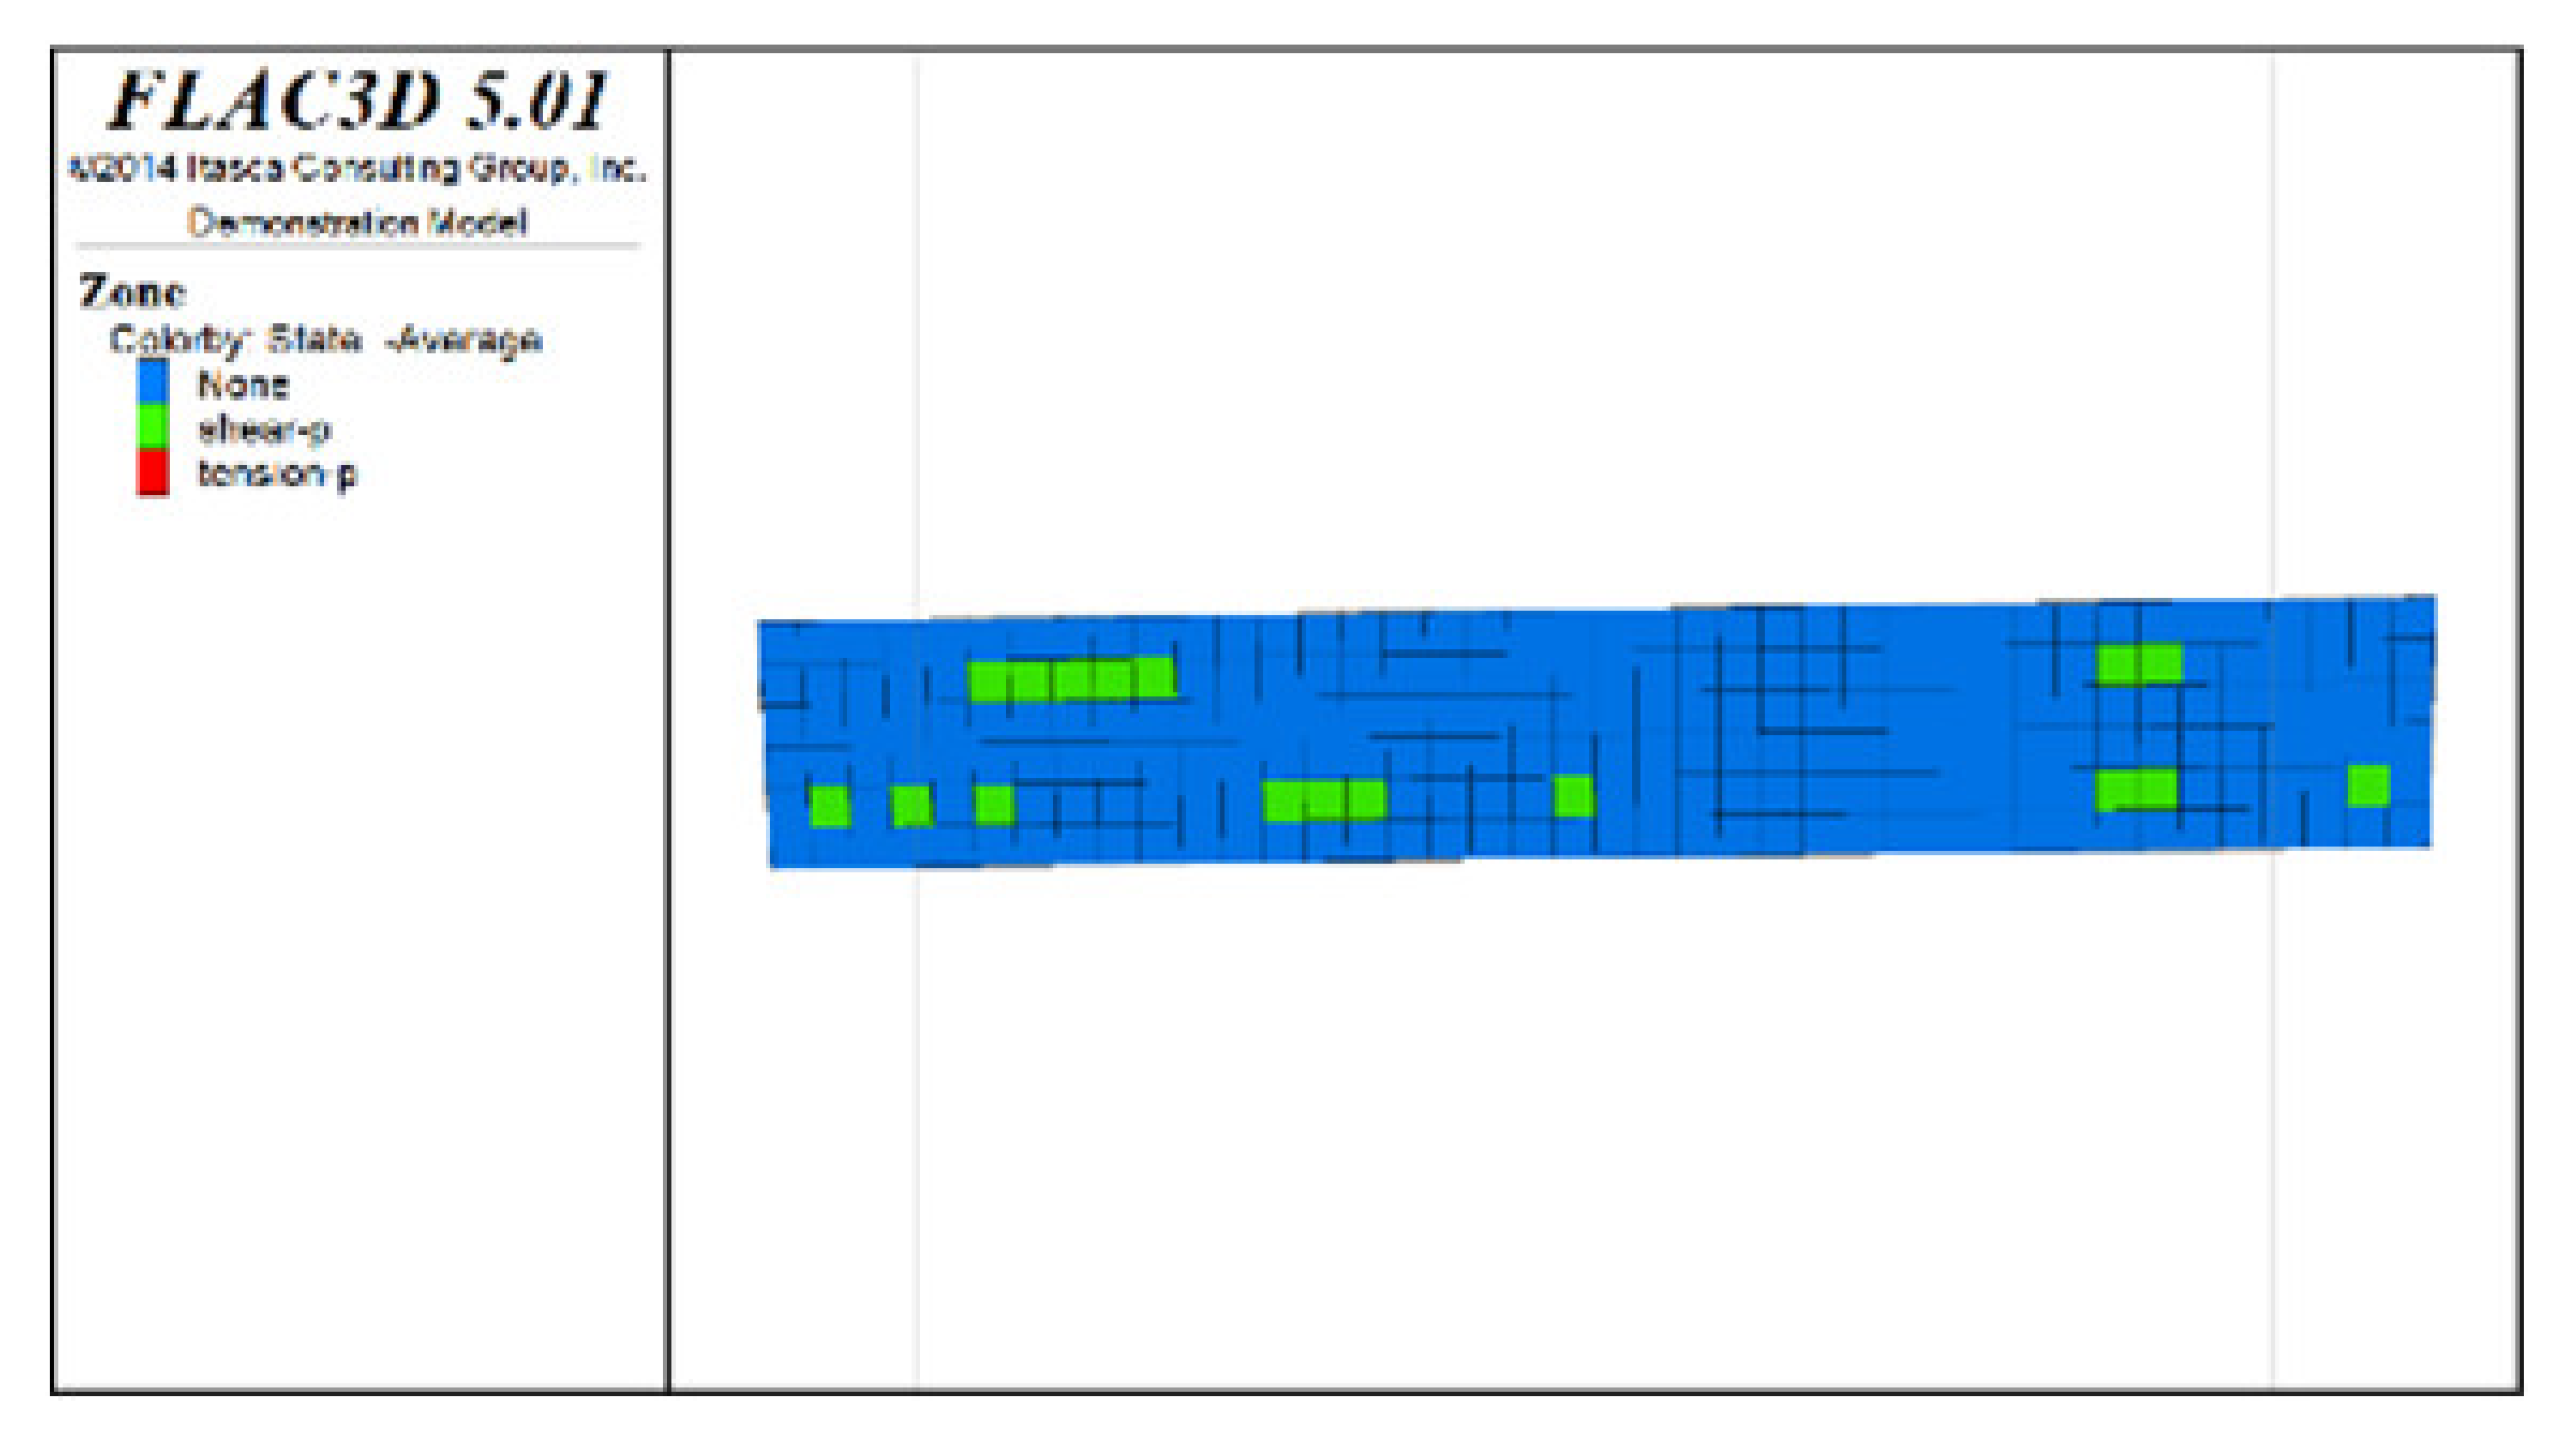
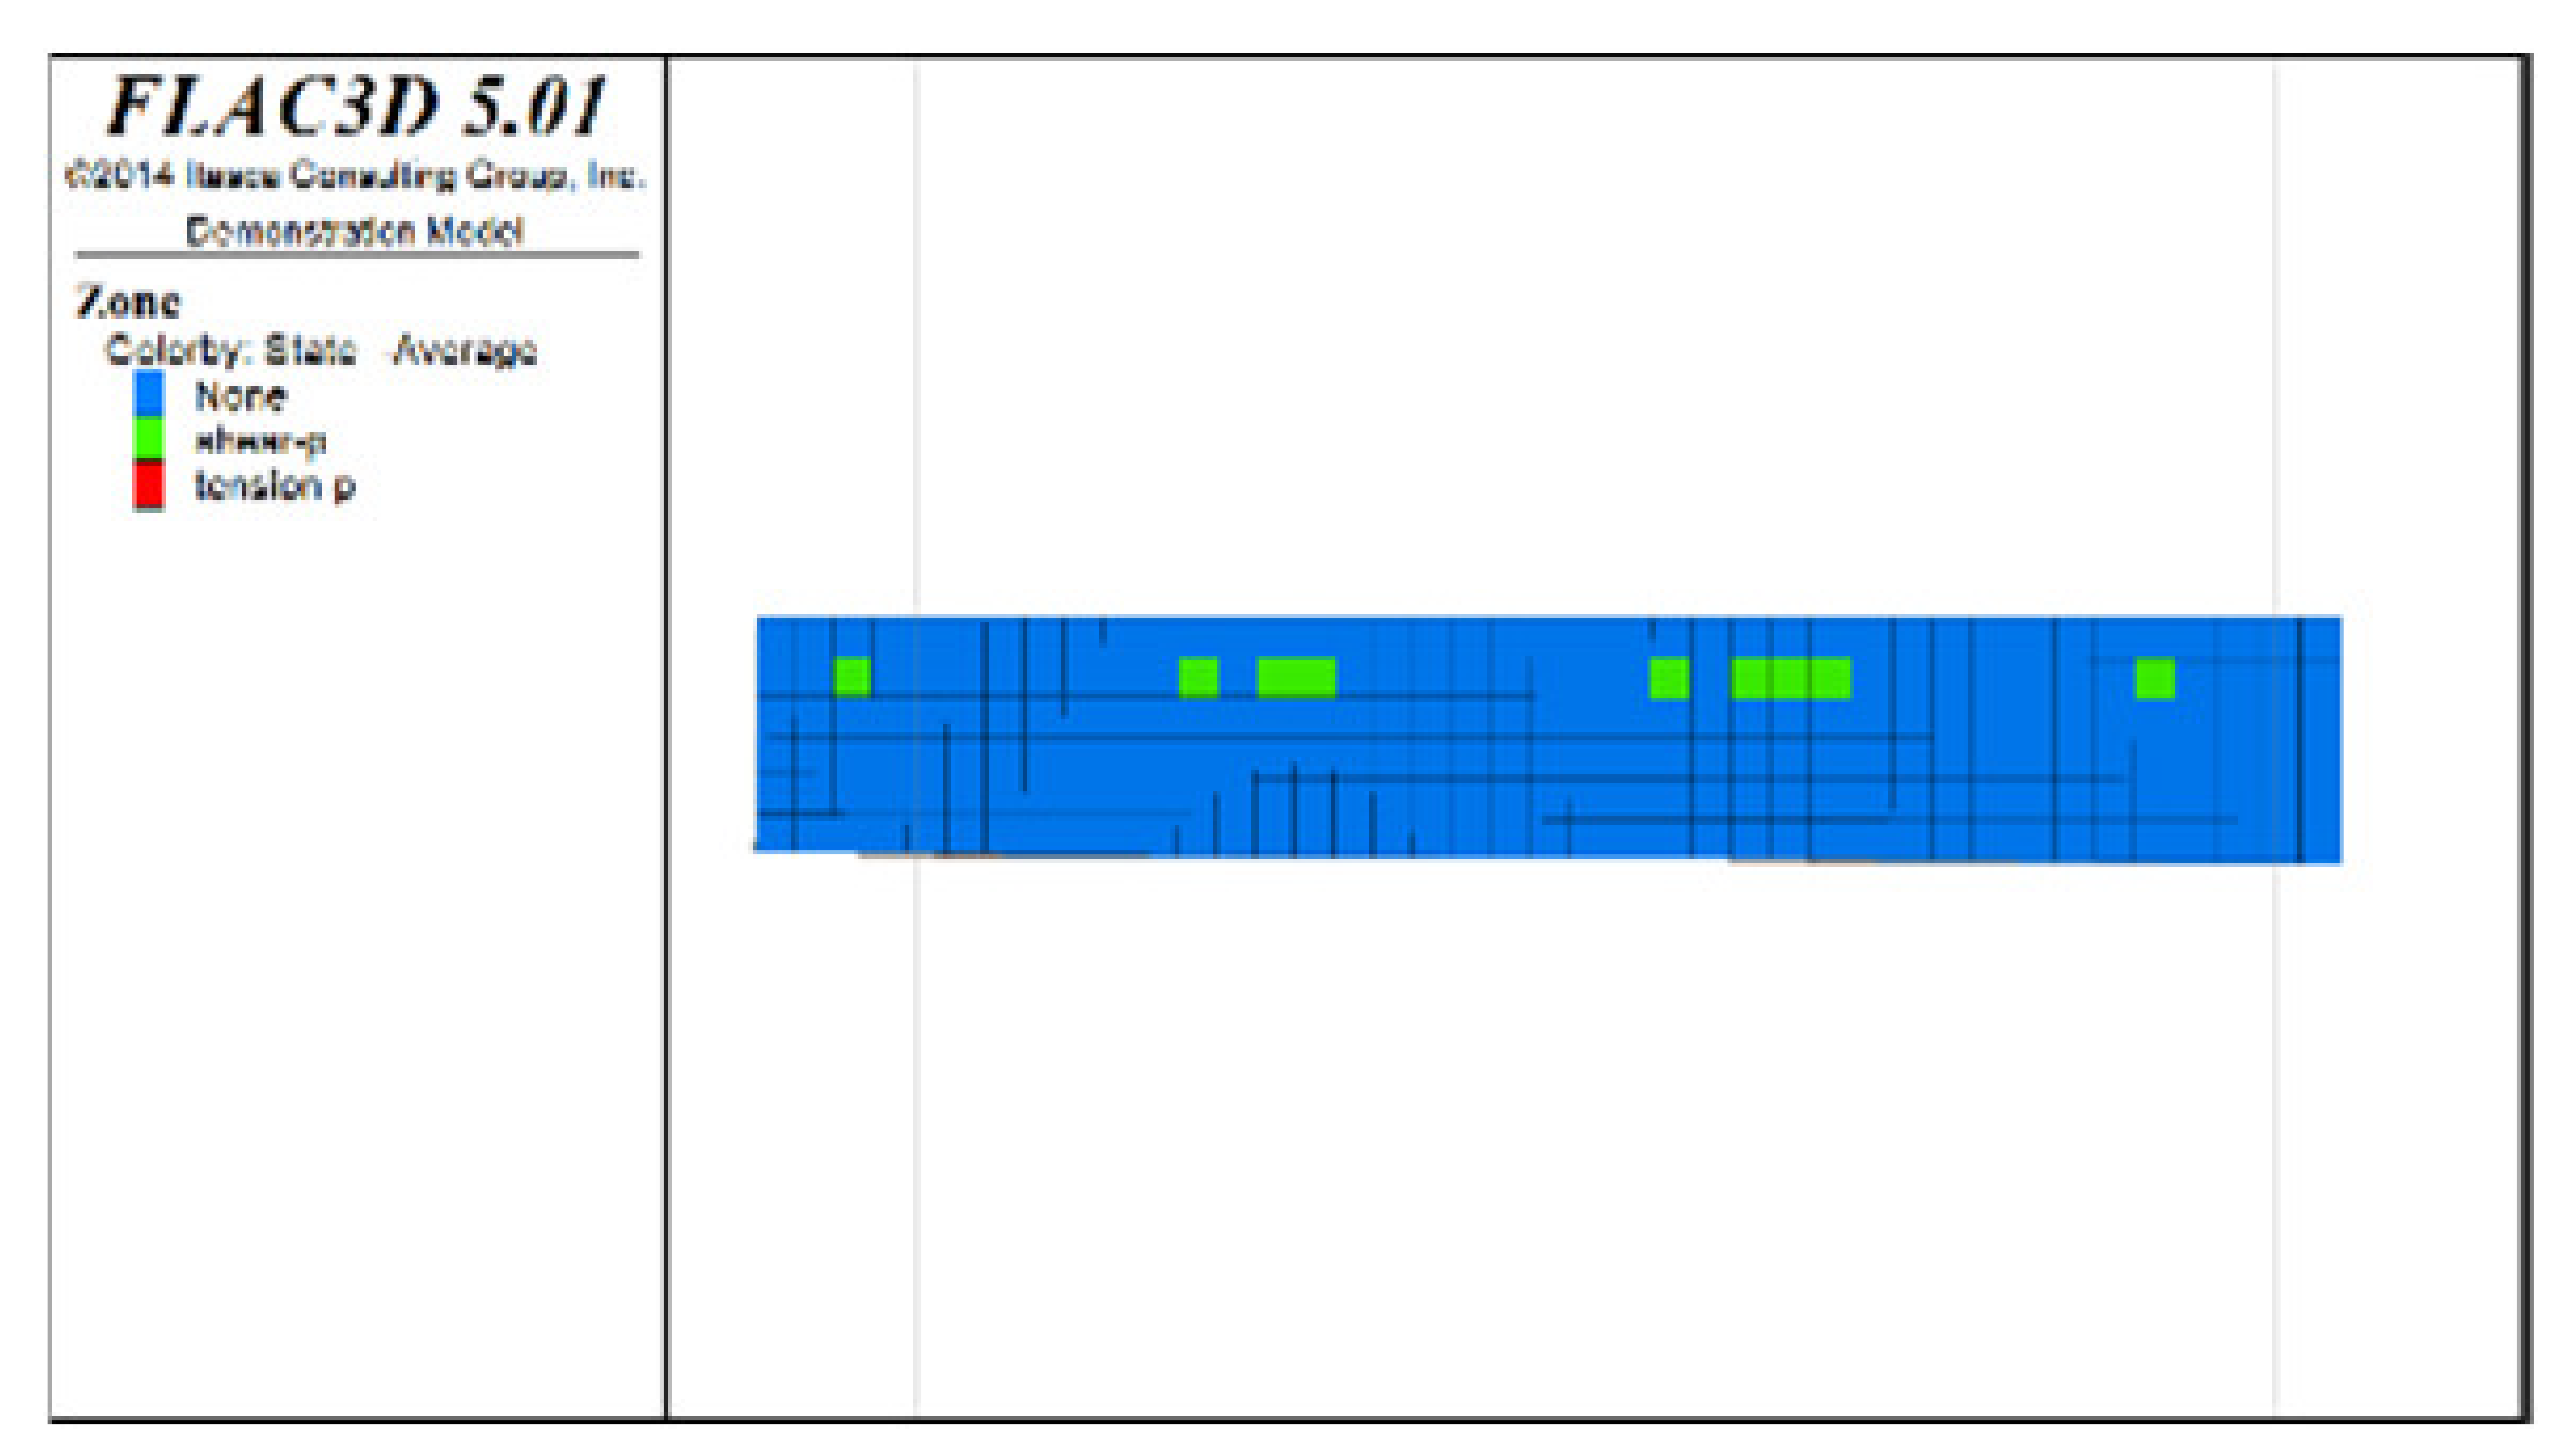
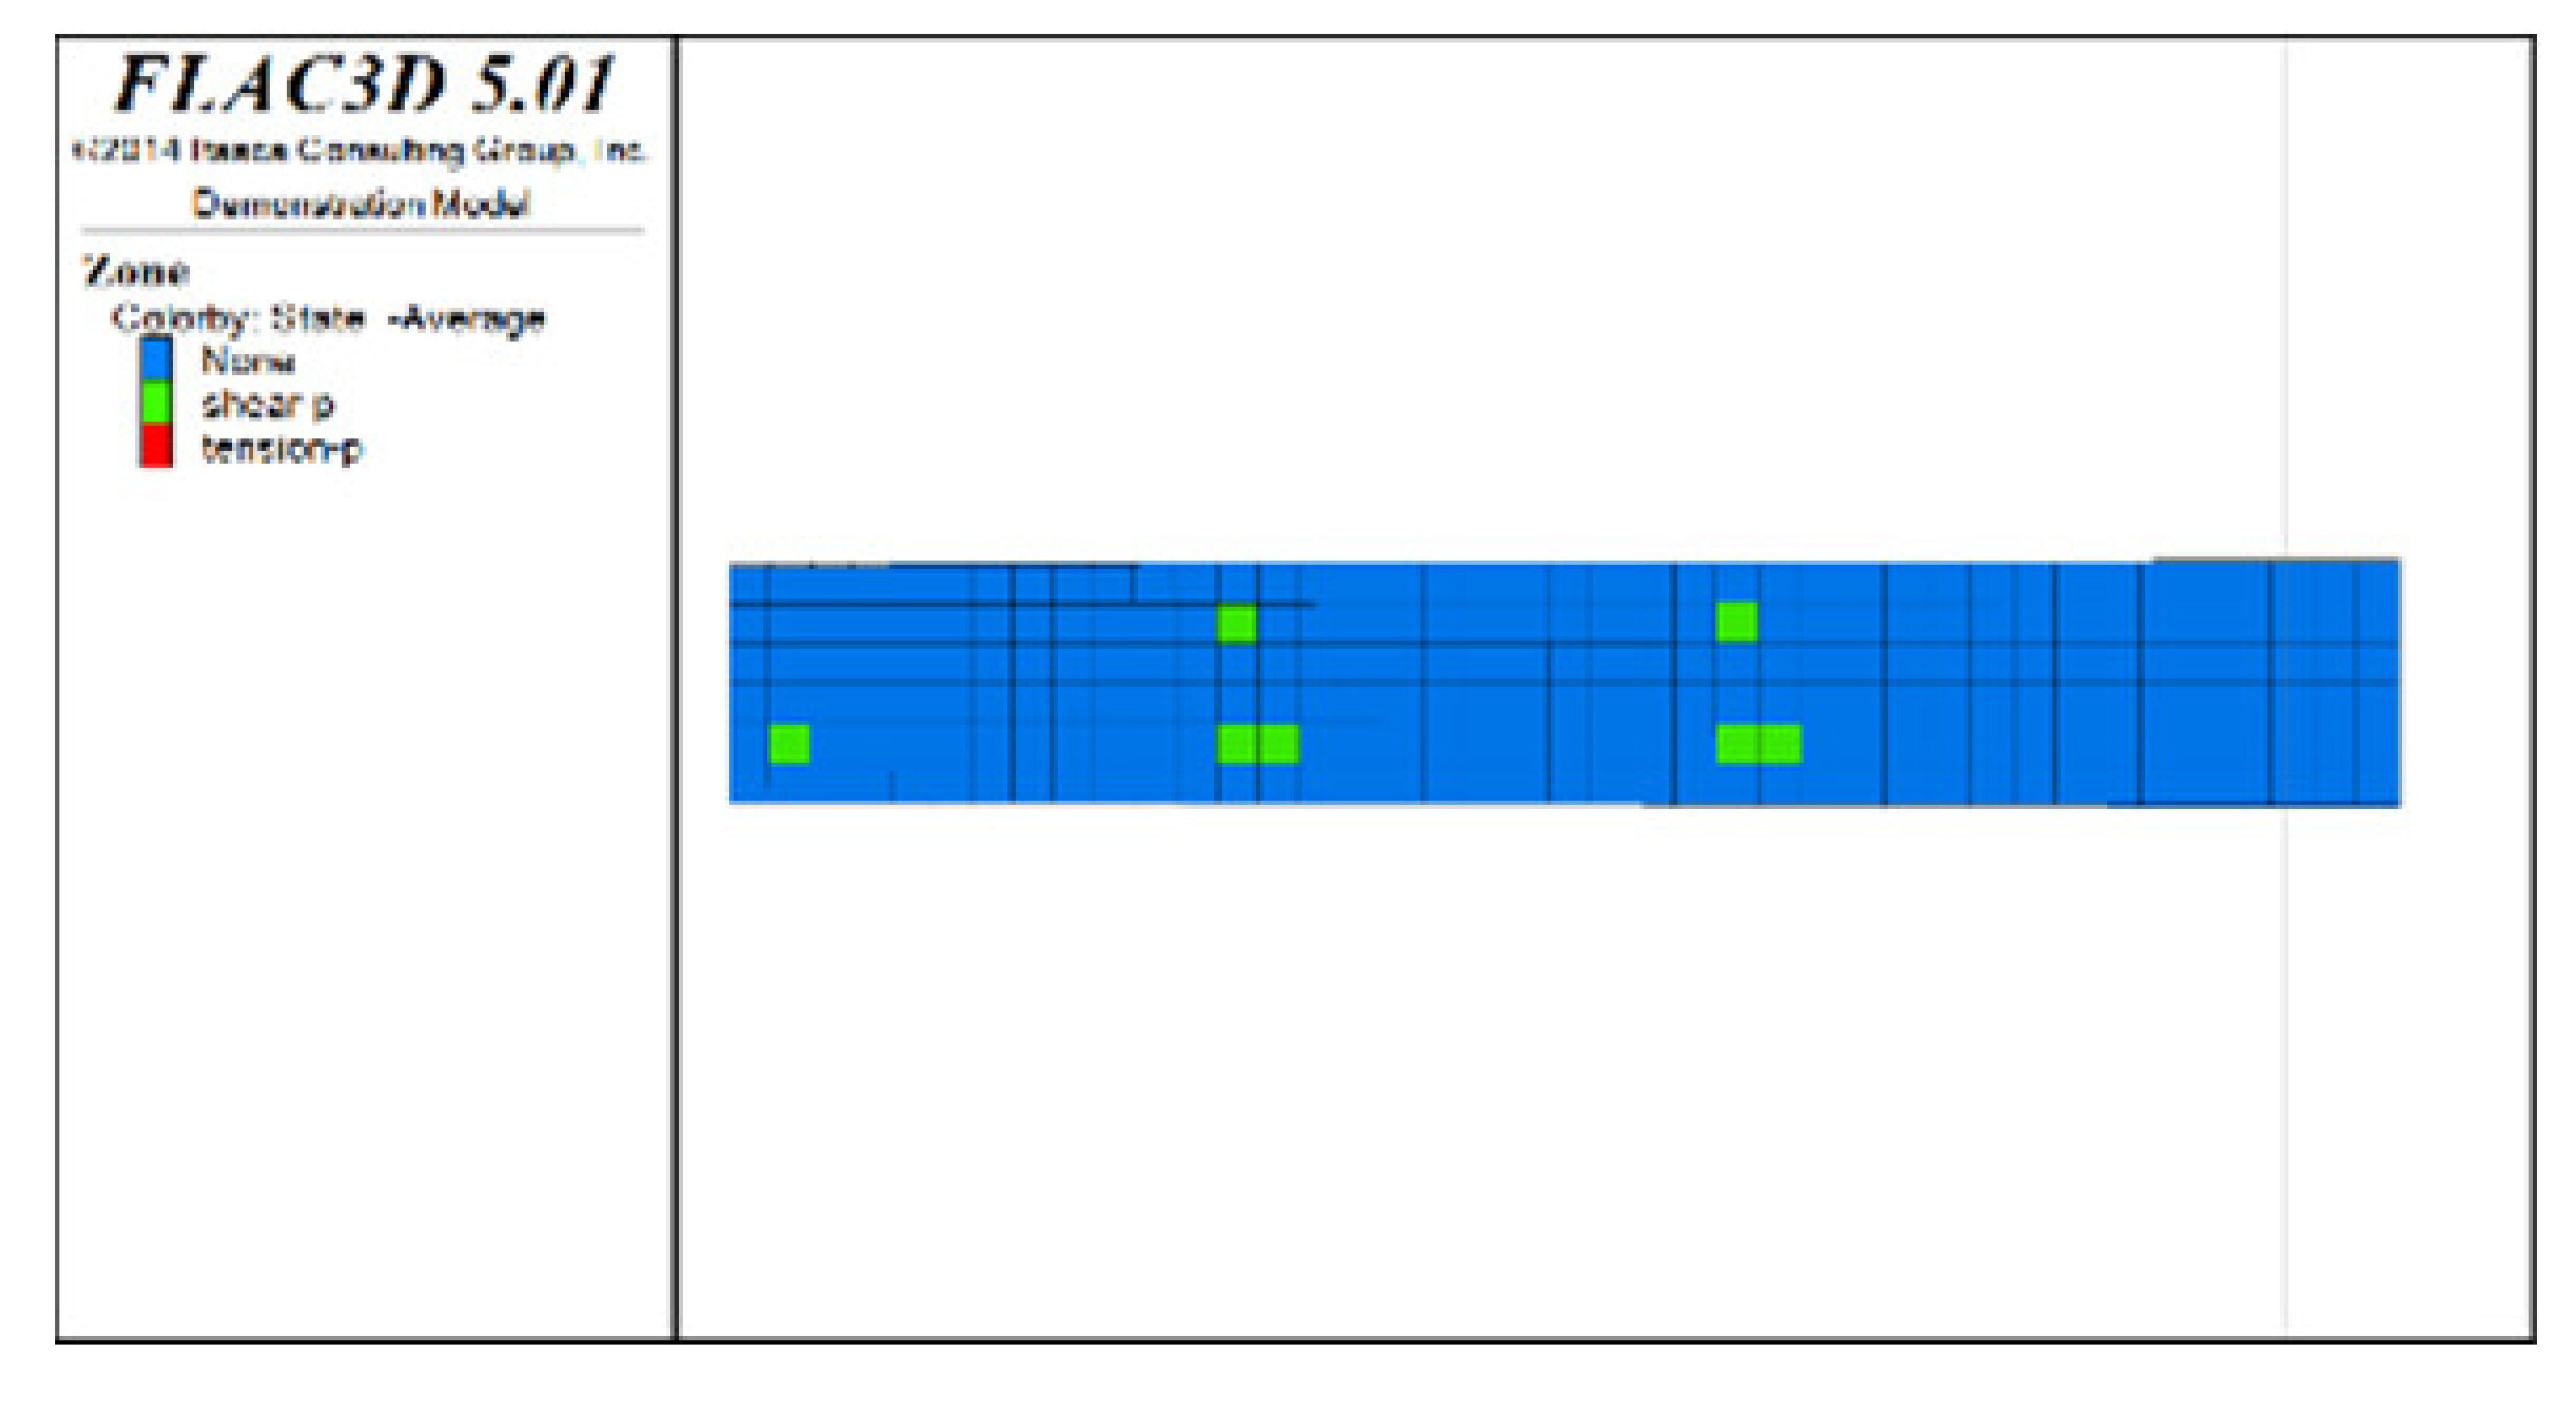
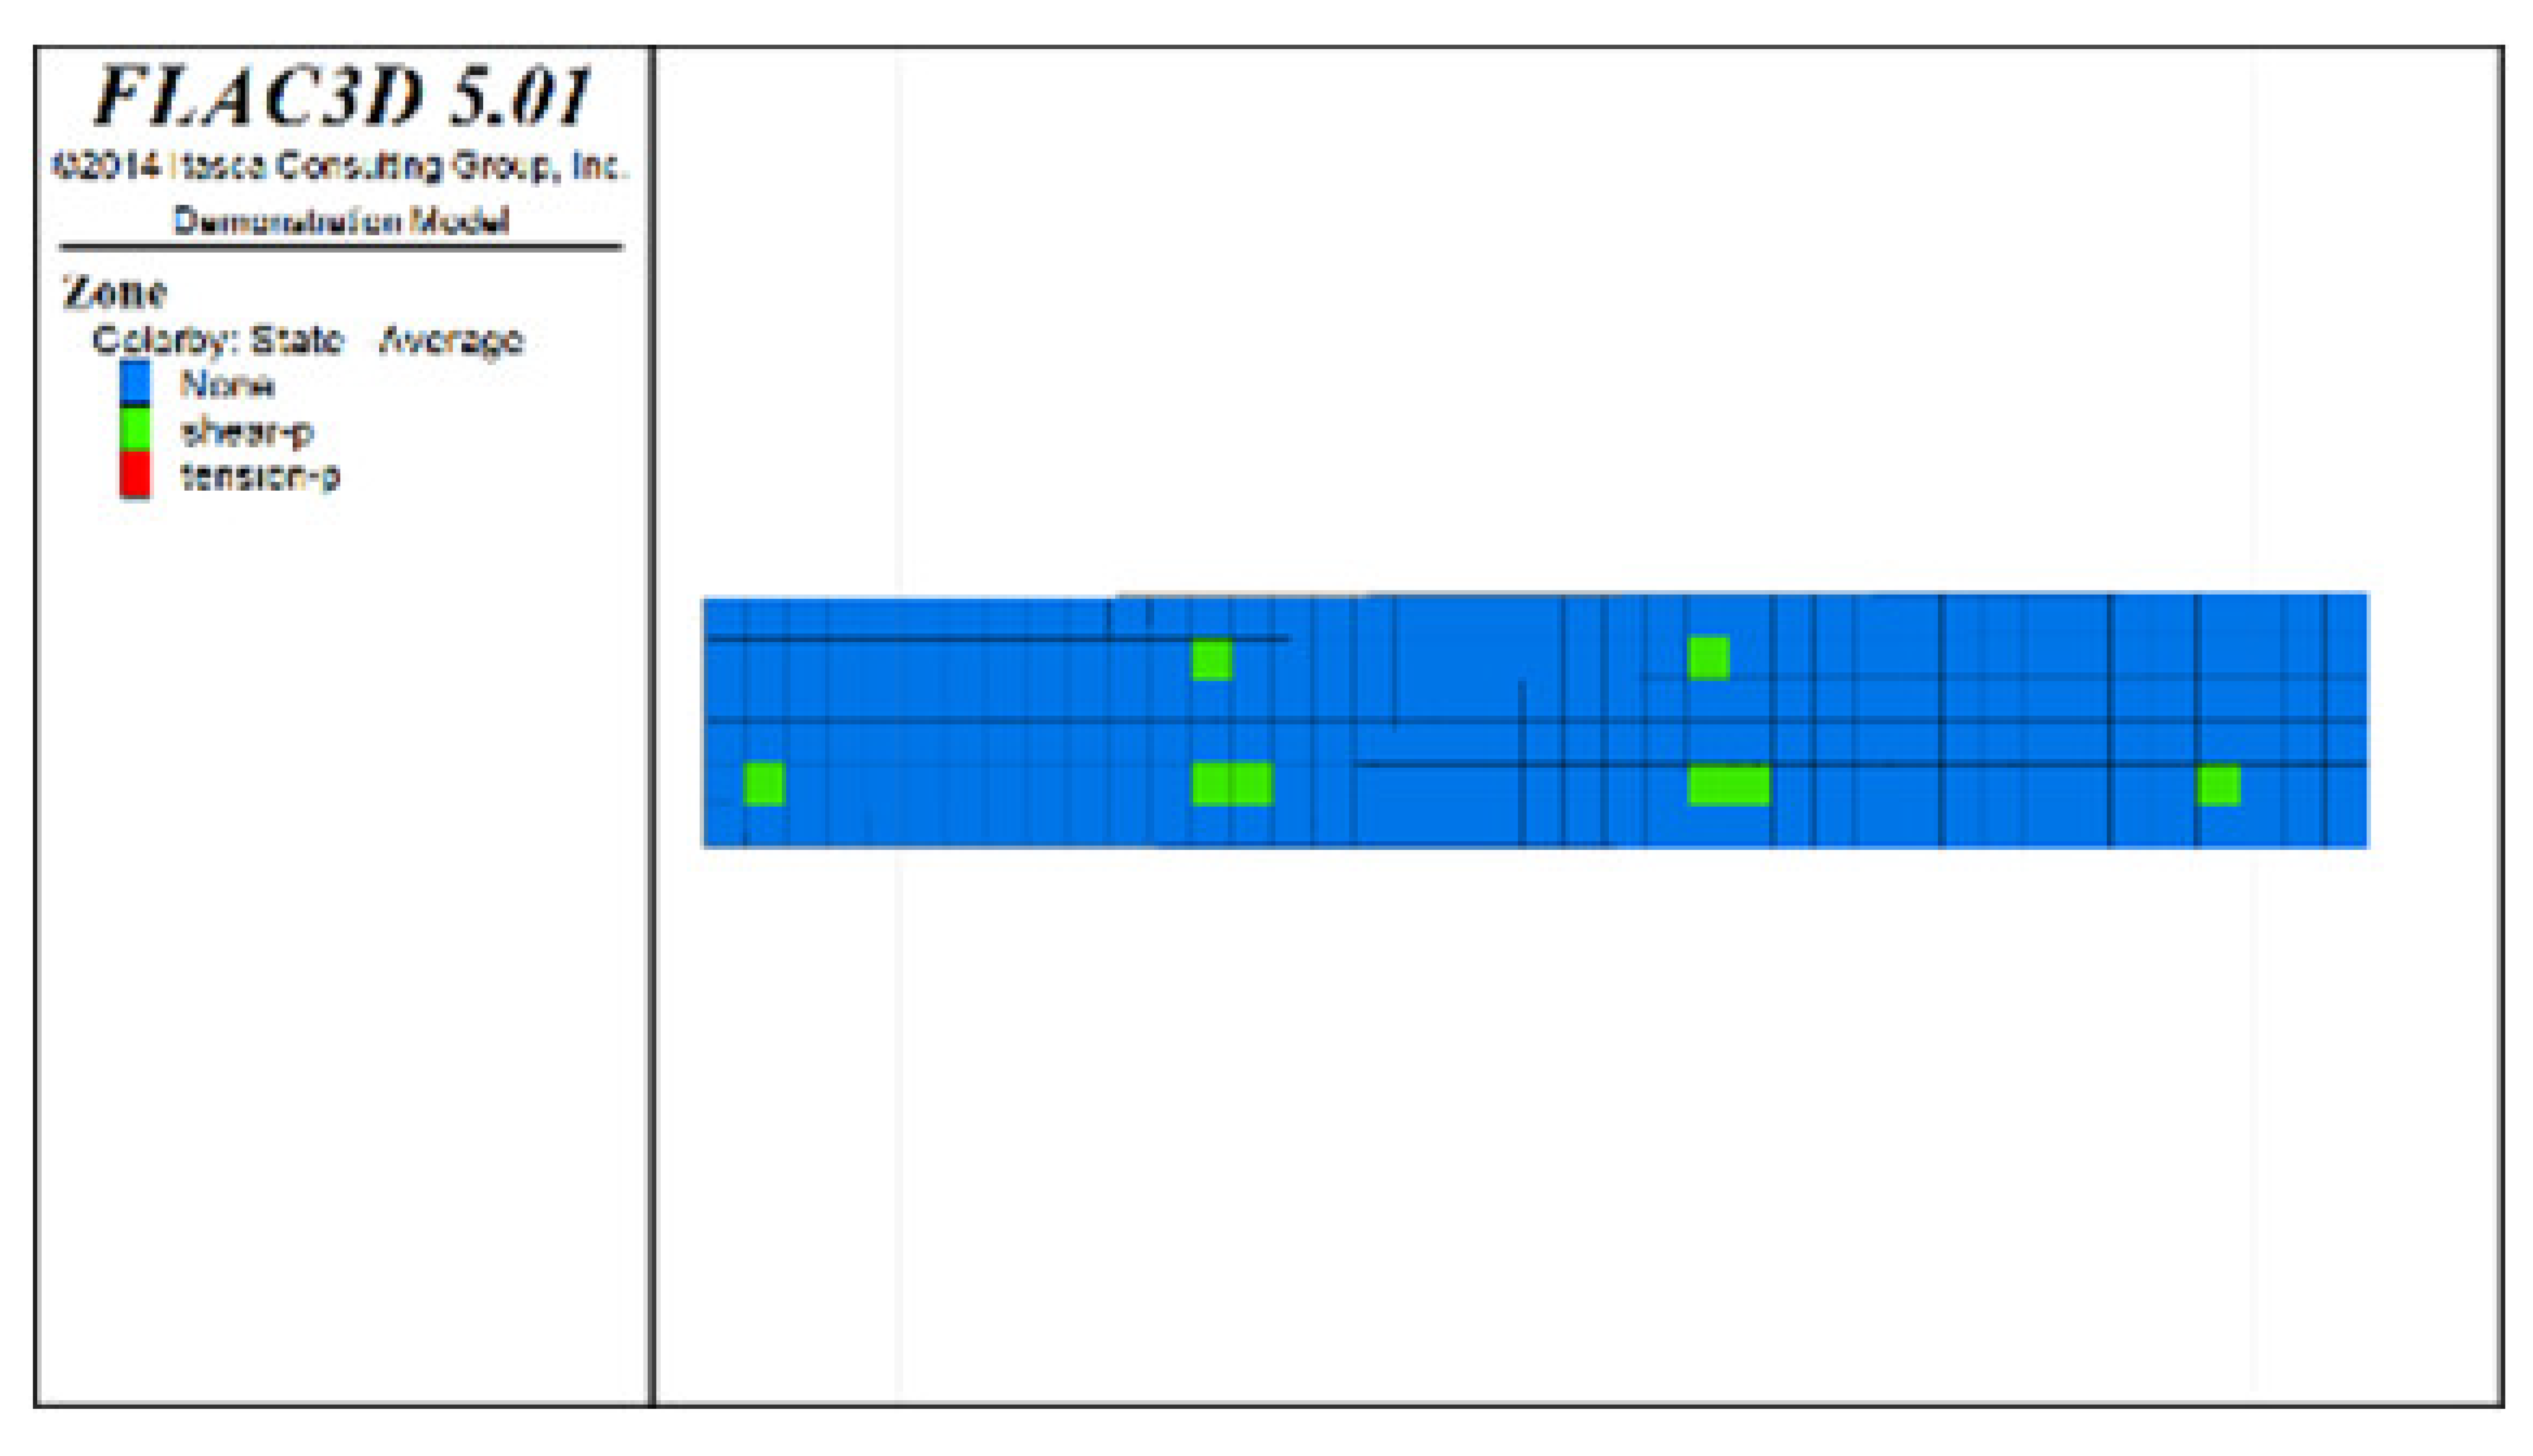
Figure 6, Figure 7 and Figure 8 show the distribution characteristics of the plastic zones produced at different roof protection layer thicknesses (Schemes B, D, and F) using the spaced extraction sequence following full completion of pit backfill and extraction. It is seen from the figures that plastic zones account for 60, 4.7, and 0.6% of the final overall layers under Schemes B, D, and F, respectively. The percentage of plastic zones showed a monotonically decreasing trend with increasing roof protection layer thickness. Under Scheme B, plastic zones appeared in most of the areas in the roof protection layer. They penetrated each other, indicating that complete failure had occurred in the roof protection layer. Under Schemes D and F, plastic zones appeared only within small ranges of the roof protection layer and failed to penetrate the upper and bottom parts of the layer (this was particularly true under Scheme F), indicating that the roof protection layers were relatively stable. These results indicate that thickening the roof protection layer reduces the likeliness of plastic zone appearance and is more conducive to the stability of the pit. Furthermore, increasing the thickness of the roof protection zone from 0.5 to 1 m decreased the plastic zone coverage by 55.2%, whereas an increase from 1 to 1.5 m resulted in a plastic zone decrease of only 4.3%, indicating that increasing the protection layer thickness beyond 1 m results in diminishing returns in terms of plastic zone coverage reduction.
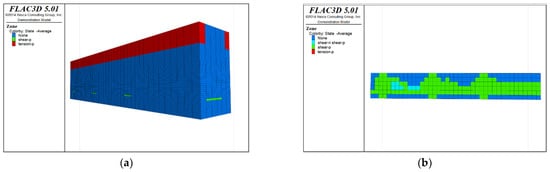
Figure 6.
Distribution of plastic zones in the roof protection layer under Scheme B. (a) 3D drawing. (b) plan of roof protection layer.
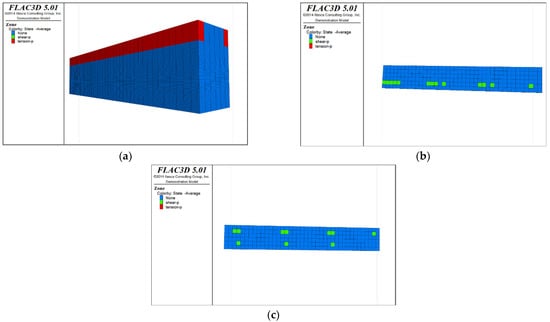
Figure 7.
Distribution of plastic zones in the roof protection layer under Scheme D. Note that the heigt of each slice is 0.5m. (a) 3D drawing. (b) plan of roof protection layer (the first slice). (c) plan of roof protection layer (the second slice).
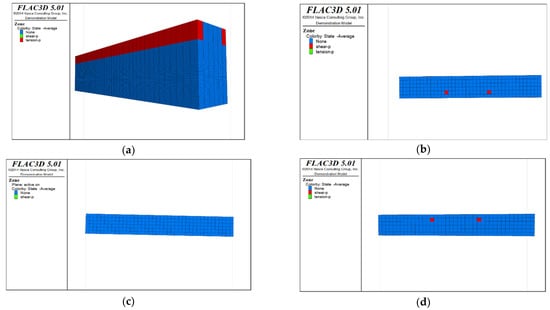
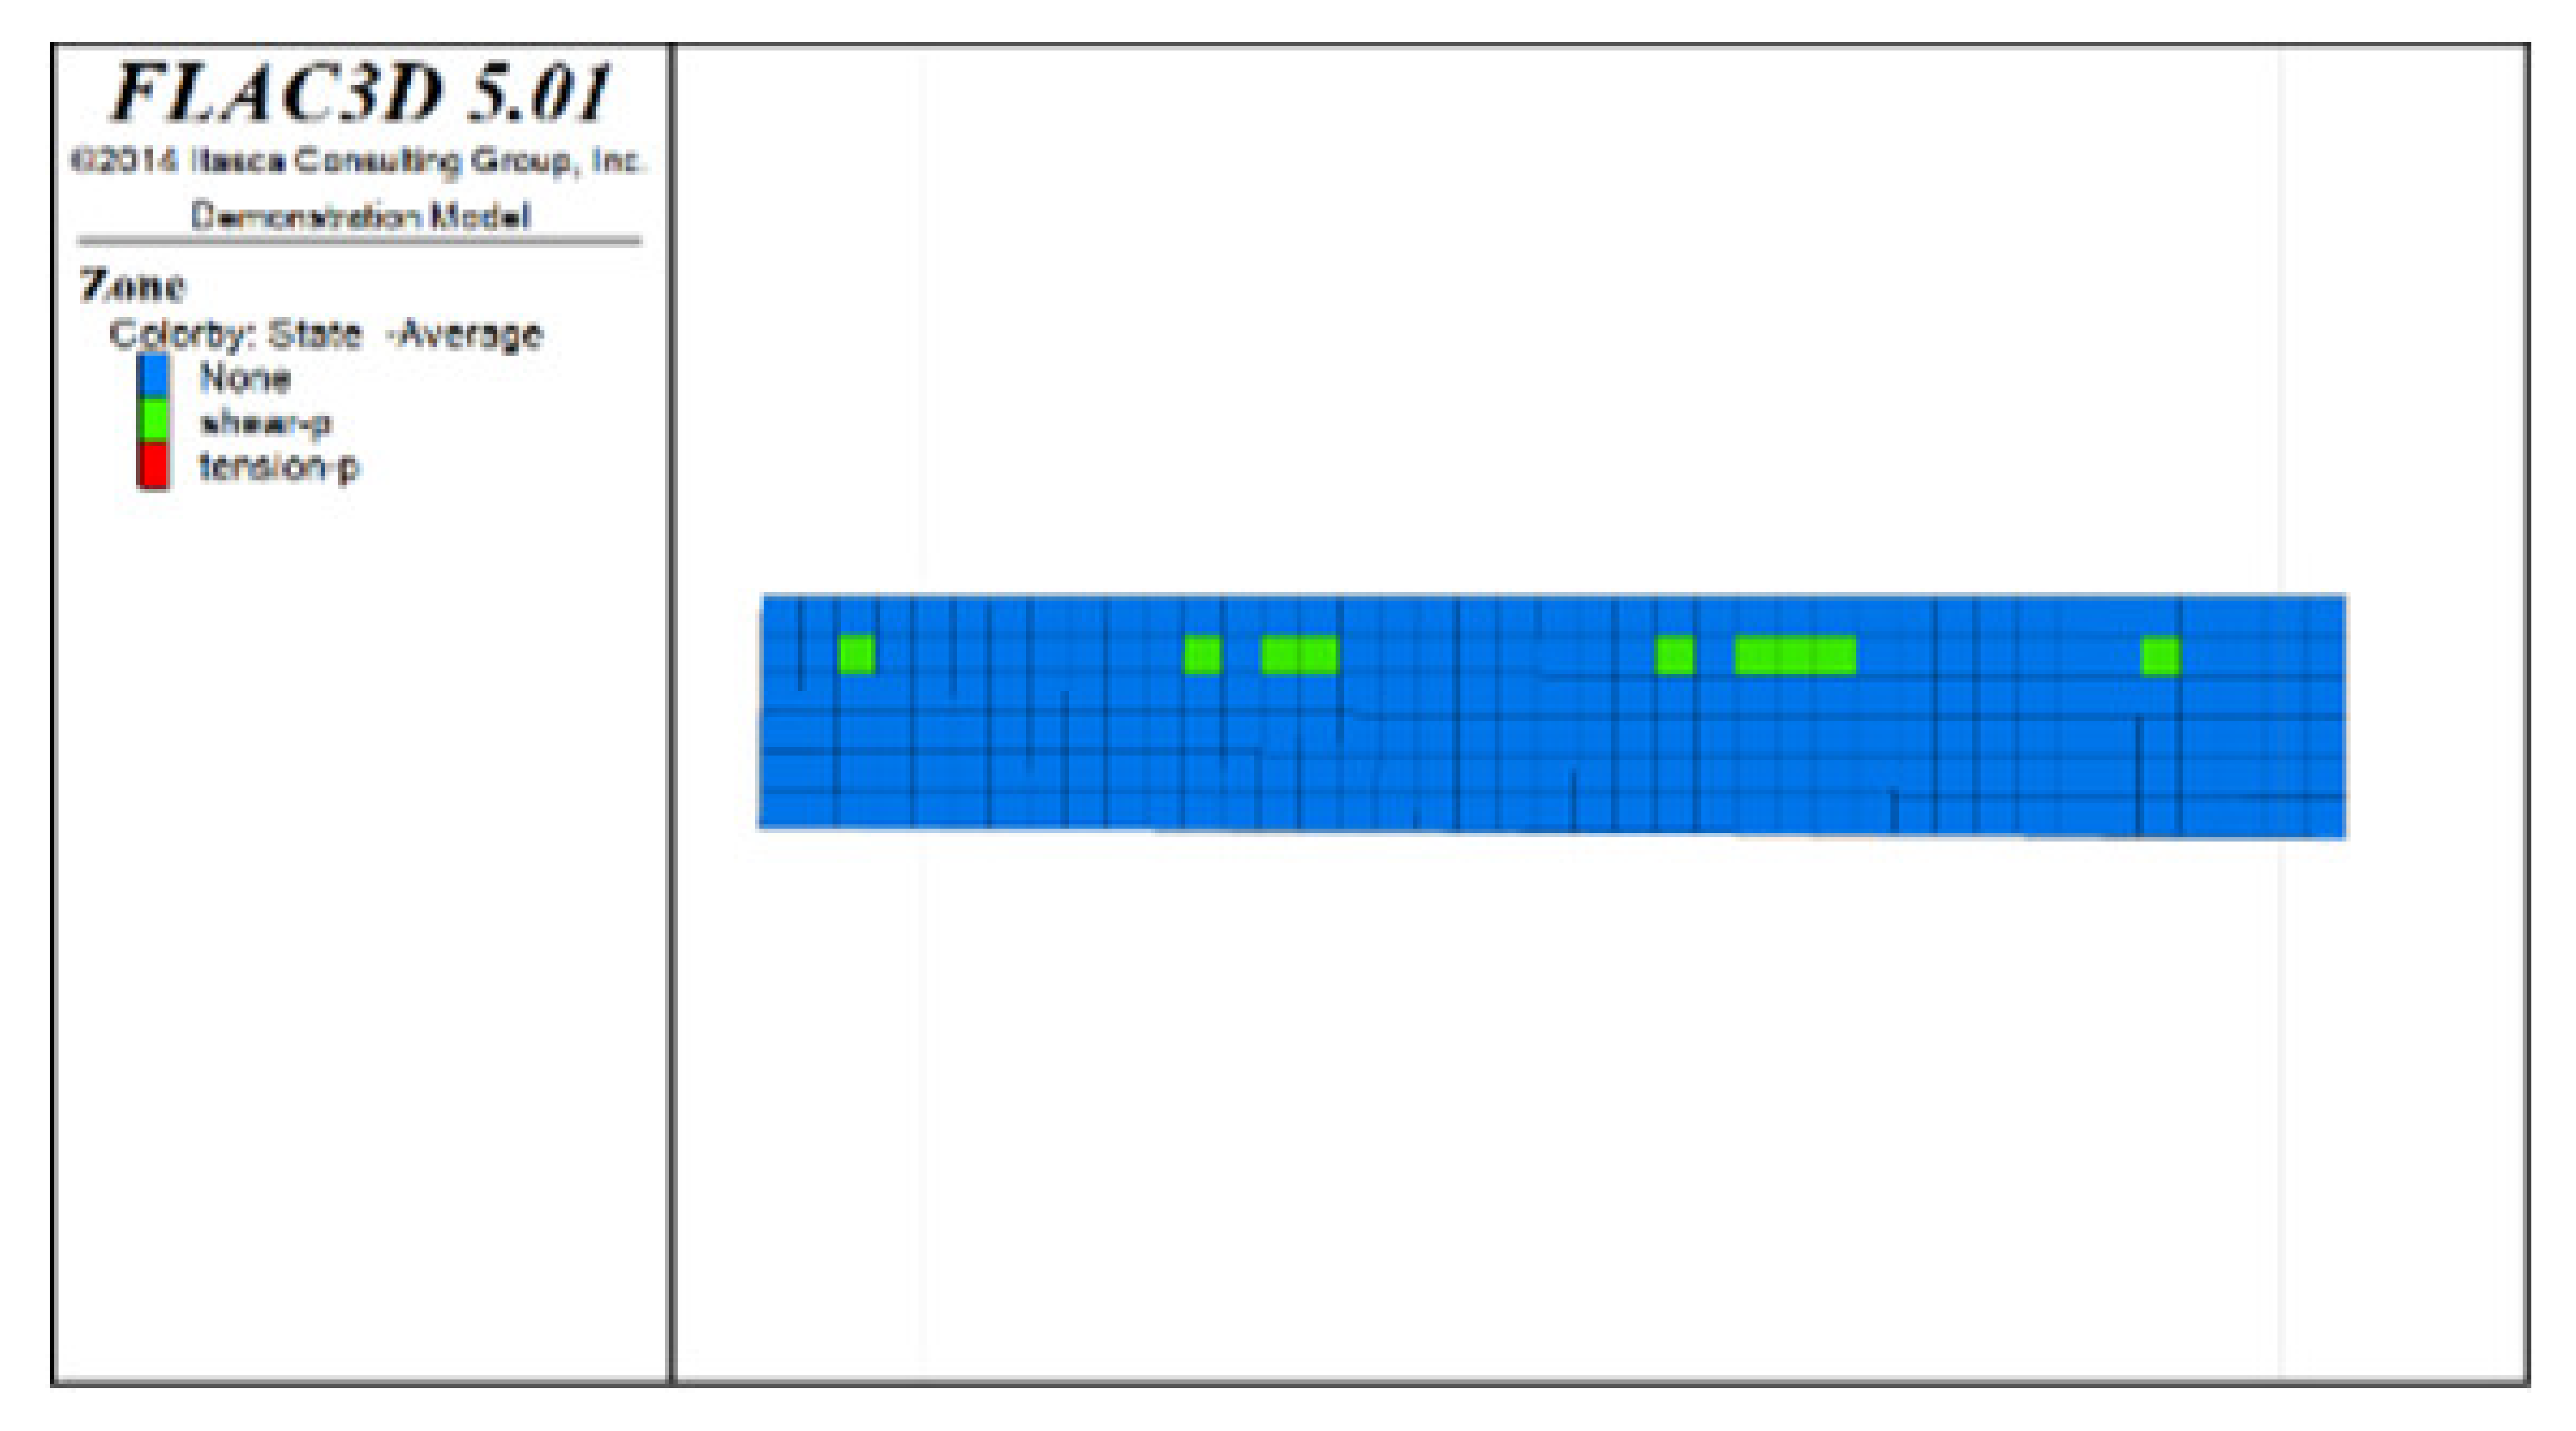
Figure 8.
Distribution of plastic zones in the roof protection layer under Scheme F. Note that the heigt of each slice is 0.5m. (a) 3D drawing. (b) plan of roof protection layer (the first slice). (c) plan of roof protection layer (the second slice). (d) plan of roof protection layer (the thirdslice).
The roof protection layer plastic zone volumes and percentages obtained under different extraction schemes are listed in Table 10. As the numerically simulated plastic zones under Schemes A and B reach 82 and 60%, respectively, indicating that complete failure occurred in the roof protection layers, these two schemes can be excluded first. Although the differences among Schemes C, D, E, and F in terms of the percentage of plastic zones are not significant, Schemes C and D and E and F differ by 750 m3 in terms of ore production. To fully evaluate the safety and economics (ore recovery rate) of pillar extraction under the four remaining schemes, we further optimized them using the analytic hierarchy process.
Table 10.
Volumes and percentages of plastic zones under different extraction schemes.
6. Optimization of the Schemes for the Preservation of Roof Protection Layer and Extraction Sequence Based on Analytic Hierarchy Process
The optimized fuzzy mathematics method was used to transform various fuzzy or subjective factors in the mining process into mathematical form as evaluation indices, which were then quantified and analyzed for each scheme, to produce a scheme selection approach that was scientific, reasonable, and reliable. The analytic hierarchy process was used to quantify and analyze the evaluation index achieved by each scheme [,], synthesize the safety and economy of the scheme, and use the results to determine an optimal preserved roof protection layer thickness and extraction sequence.
6.1. Establishment of Optimized Fuzzy Mathematics Model
In general, modeling using the application of the analytic hierarchy process to solve practical problems can be implemented through the following four steps:
Step 1: Hierarchical modelling
In applying the analytical hierarchy process to analyzing a decision-making problem, the problem should be organized so a hierarchical structure model can be built. Such hierarchies can be divided into three categories: top hierarchies (target hierarchies), middle hierarchies (criterion hierarchies), and bottom hierarchies (scheme hierarchies). The number of hierarchies used in a hierarchical structure will reflect the complexity of the problem and the level of detail required for analysis. In general, an unlimited number of hierarchies can be used, but the number of elements dominated by each element in a hierarchy should not exceed nine.
Step 2: Construction of judgment matrices for each hierarchy
The individual criteria within a criterion hierarchy will not necessarily have the same proportions of importance for target measurement; however, each will have a proportion of importance in the mind of the decision maker. Here, the integers from 1–9 and their reciprocals are used as scales to define judgment matrices (see Table 11).
Table 11.
Definition of judgment matrix scales.
Step 3: Single ranking of hierarchies and consistency checking
(1) A consistency index (CI) is calculated for matrices of dimension n.
(2) A consistency index RI corresponding to n is then obtained from Table 12.
Table 12.
Average random consistency index.
(3) Calculation of consistency ratio (CR)
The consistency of a judgment matrix is considered acceptable when CR < 0.1; otherwise, the judgment matrix should be corrected as appropriate.
Step 4: After a reasonable judgment matrix is derived, its weight vector ω is obtained using the geometric mean method (square root method). All weights in each row of the judgment matrix are multiplied to obtain the row product of all elements; this extraction is repeated four times for each row product to obtain ω for each judgment matrix.
Step 5: Equations 5 are applied to normalize the judgment matrices, and their weight vectors are multiplied to obtain the scheme membership of each scheme.
Step 6: To obtain a total ranking of hierarchies, the scheme membership of each scheme is ranked to obtain the ranking weight of each element—particularly for the elements of the schemes within a bottom hierarchy—to produce a target for the selection of schemes.
6.2. Determination of the Optimal Scheme for the Preservation of Roof Protection Layer and the Extraction Sequence
A membership matrix of roof protection layer preservation methods was developed based on the preservation method selection principle. Four indices were used to select the optimal scheme from Schemes C, D, E, and F. The selected indices were the maximum mean stress value along the Z direction in the roof protection layer, the maximum mean sedimentation value along the Z direction in the roof protection layer, the degree of plastic failure in the roof protection layer, and the lost ore tonnage following extraction, as shown in Table 13.
Table 13.
Quantitative indicators of each top protection layer retention scheme.
The weight matrix R of the four indices was obtained using the analytic hierarchy process:
Using the obtained maximum eigenvalue, λmax = 4.1189, the consistency index was derived as
where n = 4, i.e., CR = CI/RI = 0 < 0.1 (RI = 0.89 was selected from Table 11), satisfying the consistency test. The weight vector affecting the selection of the roof protection layer preservation scheme, ω = [0.06, 0.08, 0.20, 0.66], was then obtained using the root method.
Using Table 12, the eigenvector matrix was obtained as
This matrix for smaller and better indices (all four of the indices used here are smaller and better indices) was normalized using the following equation:
where rij is the index normalized, minyij is the minimum-valued index in each row, and the yij correspond to the indices in each row. Applying this normalization produced the following matrix:
From this matrix, the scheme membership S = ω×R1–4 = (0.8041, 0.8175, 0.7030, 0.7784) was obtained, corresponding to the following priority ranking: Scheme D > Scheme C > Scheme F > Scheme E.
Based on this ranking, Scheme D—preservation of a 1.0-m-thick roof protection layer combined with mining at an interval of one strip—was selected as the optimal roof protection layer preservation scheme for the 855 middle sublevel.
7. Conclusions
- (1)
- Based on the existing technical conditions of mining and ore body reserve characteristics of the crown pillar in the 855 middle sublevel, the cut-and-fill stoping of drift vertical to ore body strike was proposed to be the optimal recovery scheme for the crown pillar in the 855 middle sublevel.
- (2)
- Based on the results of a site survey and information query, a preliminary reasonable isolated layer preserved thickness was obtained using seven classical theories. In conformance with the existing technical conditions of mining, three potential roof protection layer thicknesses were proposed: 0.5 m, 1 m, and 1.5 m.
- (3)
- Based on the numerical simulation results, it was found that for each scheme, the displacement field of the roof protection layer and the change rule of the plastic zones were analyzed, the results revealing that the extraction sequence and the thickness of the roof protection layer both have a significant influence on the stability of the pit. By mining at intervals of one strip, the range of the plastic zones in the roof protection layer can be effectively controlled in the early stage of mining, which enhances the overall stability of the roof protection layer in the later stages. It was further shown that the proportion of plastic zones in the roof protection layer monotonically decreases as the thickness of the protection layer increases. However, there are significant reductions in the changes in sedimentation value and proportion of plastic zones once the roof protection layer thickness exceeds 1 m.
- (4)
- Based on the scheme-ranking membership vector produced in the analytic hierarchy process, the optimal extraction scheme for the preservation of the roof protection layer in the 855 middle sublevel was determined to be cut-and-fill stoping of the drift vertical to ore body strike combined with a preserved roof protection layer thickness of 1 m and a spaced mining sequence.
Author Contributions
Conceptualization, F.F. and J.Z.; methodology, F.F.; software, Z.Y.; investigation, F.F. and Y.S.; resources, Y.W.; data curation, Z.Y.; writing—original draft preparation, F.F. and X.C.; writing—review and editing, Z.X.; All authors have read and agreed to the published version of the manuscript.
Funding
Funded by the National Natural Science Foundation of China (No. 52004143), the open fund for Laboratory of Mining Response and Disaster Prevention and Control in Deep Coal Mines (No. SKLMRDPC21KF06).
Data Availability Statement
Data available on request due to privacy restrictions.
Conflicts of Interest
The authors declare no conflict of interest.
References
- Li, X.B.; Qiu, J.D.; Zhao, Y.Z.; Chen, Z.H.; Li, D.Y. Instantaneous and long-term deformation characteristics of deep room-pillar system induced by pillar recovery. Trans. Nonferrous Met. Soc. China 2020, 30, 2775–2791. [Google Scholar] [CrossRef]
- Kaiser, P.K.; Kim, B.H.; Bewick, R.P.; Valley, B. Rock mass strength at depth and implications for pillar design. Min. Technol. 2014, 120, 170–179. [Google Scholar] [CrossRef]
- Hu, G.J.; Yang, T.H.; Zhou, J.R.; Yu, Q.L.; Xie, L.K.; Liu, H.L.; Zhao, Y. Mechanism of surrounding rock failure and crack evolution rules in branched pillar recovery. Minerals 2017, 7, 96. [Google Scholar] [CrossRef]
- Rybak, J.; Khayrutdinov, M.M.; Kuziev, D.A.; Kongar-Syuryun, C.B.; Babyr, N.V. Prediction of the geomechanical state of the rock mass when mining salt deposits with stowing. J. Min. Inst. 2022, 253, 61–70. [Google Scholar] [CrossRef]
- Christopher, M.; Michael, G. Preventing roof fall fatalities during pillar recovery: A ground control success story. Int. J. Min. Sci. Technol. 2017, 27, 107–113. [Google Scholar]
- Wang, F.F.; Ren, Q.Y.; Chen, B.; Zou, P.; Peng, Z.J.; Hu, W.J.; Ma, Z. Numerical investigation on safe mining of residual pillar in goaf: A case study of Panlong lead–zinc mine. Geotech. Geol. Eng. 2020, 38, 4269–4287. [Google Scholar] [CrossRef]
- Ley, G.M.M.; Steed, C.M. Recovery of pillars under backfill. World Min. Express 1999, 15, 40–45. [Google Scholar]
- Xia, K.Z.; Chen, C.X.; Liu, X.M.; Song, X.G.; Jiang, X.W.; Zhou, Y.C. Rheological mechanical model of pillar-protective roof supporting system in gypsum mines. Rock Soil Mech. 2017, 38, 2923–2930. (In Chinese) [Google Scholar]
- Jiang, L.C.; Yang, C. Safety thickness of bauxite goaf protective roof in hard clay roof. Journal of Central South University. Sci. Technol. 2020, 51, 445–452. [Google Scholar]
- Auvary, C.; Homand, F.; Sorgi, C. The aging of gypsum in underground mines. Eng. Geol. 2004, 74, 183–196. [Google Scholar] [CrossRef]
- Liu, Z.Y. Stability Analysis of Mining of Roof and Bottom Pillars under the Backfill in Xinli Area of Sanshandao Gold Mine. Master’s Thesis, Central South University, Changsha, China, 2014. (In Chinese). [Google Scholar]
- Zhu, H.X.; Han, L.J.; Meng, Q.B.; Tian, M.L.; Meng, L.D.; Zhao, Z.L. Determining the minimum thickness of a crown pillar and optimizing the cross-sectional size of point pillars for the safe exploitation of a subsea gold mine. Arab. J. Geosci. 2021, 14, 1275. [Google Scholar] [CrossRef]
- Zhao, X.D. Stability analysis of insulating pillar of excavation of Chambishi copper mine in depth. Chin. J. Rock Mech. Eng. 2010, 29, 2616–2622. [Google Scholar]
- Ajayi, S.A.; Ma, L.Q.; Spearing, A.J.S. Ground Stress Analysis and Automation of Workface in Continuous Mining Continuous Backfill Operation. Minerals 2022, 12, 754. [Google Scholar] [CrossRef]
- Huang, Y.G.; Yang, W.X.; Li, Y.Y.; Guo, W.B. Spatial distribution characteristics of plastic failure and grouting diffusion within deep roadway surrounding rock under three-dimensional unequal ground stress and its application. Minerals 2022, 12, 296. [Google Scholar] [CrossRef]
- Safonov, A.; Filippi, M.; Mašín, D.; Bruthans, J. Numerical modeling of the evolution of arcades and rock pillars. Geomorphol. 2020, 365, 107260. [Google Scholar] [CrossRef]
- Chen, S.J.; Feng, F.; Wang, Y.J.; Li, D.Y.; Huang, W.P.; Zhao, X.D.; Jiang, N. Tunnel failure in hard rock with multiple weak planes due to excavation unloading of in-situ stress. J. Cent. South Univ. 2020, 27, 2864–2882. [Google Scholar] [CrossRef]
- Feng, F.; Li, X.B.; Rostami, J.; Peng, D.X.; Li, D.Y.; Du, K. Numerical investigation of hard rock strength and fracturing under polyaxial compression based on Mogi-Coulomb failure criterion. Int. J. Geomech. 2019, 19, 04019005. [Google Scholar] [CrossRef]
- Ebrahim, G.; Mohammad, A.; Kourosh, S. An intelligent approach to predict pillar sizing in designing room and pillar coal mines. Int. J. Rock Mech. Min. Sci. 2014, 65, 86–95. [Google Scholar]
- Saffet, Y.; Candan, G. Application of fuzzy inference system and nonlinear regression models for predicting rock brittleness. Expert Syst. Appl. 2020, 37, 2265–2272. [Google Scholar]
- Hyunjun, I.; Huongdoo, J.; Erkan, T.; Micah, N. Long- and short-term strategies for estimation of hydraulic fracturing cost using fuzzy logic. Minerals 2022, 12, 715. [Google Scholar]
- Sławomir, B.; Stanisław, P. Numerical study of pressure on dams in a backfilled mining shaft based on PFC3D code. Comput. Geotech. 2015, 66, 230–244. [Google Scholar]
- Janssen, H.A. Versuche über Getreidedruck in Silozellen. Z. Des. Ver. Dtsch. Ing. 1895, 39, 1045–1049. [Google Scholar]
- Feng, F.; Li, X.B.; Chen, S.J.; Peng, D.X.; Bian, Z. Rational size and stability analysis of horizontal isolated pillars in deep mining from caving to filling method. E3S Web Conf. 2021, 303, 01040. [Google Scholar] [CrossRef]
- Swift, G.M.; Reddish, D.J. Stability problems associated with an abandoned ironstone mine. Bull. Eng. Geol. Environ. 2002, 61, 227–239. [Google Scholar]
- Hoek, E.; Brown, E.T. The Hoek–Brown failure criterion and GSI—2018 edition. J. Rock Mech. Geotech. Eng. 2019, 11, 445–463. [Google Scholar] [CrossRef]
- Yang, J.H.; Dai, J.H.; Yao, C.; Jiang, S.H.; Zhou, C.B.; Jiang, Q.H. Estimation of rock mass properties in excavation damage zones of rock slopes based on the Hoek-Brown criterion and acoustic testing. Int. J. Rock Mech. Min. Sci. 2020, 126, 104192. [Google Scholar] [CrossRef]
- Li, X.B.; Peng, D.X.; Feng, F.; Li, X.S. Stability analysis of horizontal insulating pillar in deep mining from caving to filling method on the basis of refined plate theory. J. China Univ. Min. Technol. 2019, 48, 484–494. [Google Scholar]
- Philip-Mark, S.; Christos, R.; Francis, P. A Methodology combining IDEF0 and weighted risk factor analysis for the strategic planning of mine reclamation. Minerals 2022, 12, 713. [Google Scholar]
- Fatemeh, K.; Ataallah, B.; Jafar, A.S. Mineral processing plant site selection using integrated fuzzy cognitive map and fuzzy analytical hierarchy process approach: A case study of gilsonite mines in Iran. Miner. Eng. 2020, 147, 106143. [Google Scholar]


Publisher’s Note: MDPI stays neutral with regard to jurisdictional claims in published maps and institutional affiliations. |
© 2022 by the authors. Licensee MDPI, Basel, Switzerland. This article is an open access article distributed under the terms and conditions of the Creative Commons Attribution (CC BY) license (https://creativecommons.org/licenses/by/4.0/).