Abstract
Clarification of the source of the Eocene sediments filling the Huimin depression provides significant support for current and future oil and gas exploration in the Bohai Bay Basin, China. A comprehensive assessment of sediment provenance based on sandstone petrography, heavy mineral assemblages, seismic reflection data, and distribution of sandstone bodies of the Shahejie Formation (Es2) to the Dongying Formation (Ed) productive interval based on both its macroscopic and microscopic provenance aspects. This method of analysis has the advantages of easy data acquisition, high accuracy, strong flexibility, wide application range, and making the analysis of sedimentary provenances more systematic. Comprehensive analysis of the Huimin depression, Bohai Bay Basin has revealed further that the origin of the Eocene second member of the Shahejie Formation (Es2) to the Dongying Formation (Ed) provenance system was derived from the Linfanjia high, the Chengning uplift, and the Luxi uplift.
1. Introduction
Sediment provenance analysis plays an important role in determining sediment transport paths, the entire basinal depositional pattern, and prediction of the location of sand bodies in the basin []. Common provenance analytical methods include heavy mineral analysis, clastic petrography, geochemical analysis, and isotopic analysis []. Sedimentary models, such as the sand distribution system, mainly based on sedimentary principles, recognize that strata become thicker from the source area to the depositional center, thus determining the source of the sediments []. This method is maneuverable, and data are relatively easy to obtain, but due to the influence of the paleocurrent direction, provenance results can be limited and uncertain. Therefore, this method can only be used to judge the approximate direction of sediment transport near depositional areas, but not the actual location or the nature of the parent rock. Petrography can be used to infer the type of parent rocks in the source area based on the terrigenous clast assemblages in the basin []. Using Crook’s (1974) connection between specific provenance areas and sedimentary basins in various tectonic environments, Dickinson et al. (1979) and Dickinson (1985) collected further data on the detrital components of sandstones in typical tectonic environments around the world, divided and quantitatively counted them in detail, and created provenance determination model maps, i.e., the Dickinson diagram [,,,]. The Dickinson diagram uses QtFL, QmFLt, QpLvLs, and QmPK model maps to place the provenance region in one of three main tectonic units and seven secondary tectonic units in stable continental blocks, magmatic arcs, and recycling orogenic belts [,,,]. The Dickinson ternary diagram identifies the ancient tectonics of the source area of the clastic rocks, emphasizing that the tectonics in the source area control the source and nature of the framework grains comprising sandstones to a certain extent. Thus, this information can be used to analyze the tectonic history of the provenance area []. Because the parent rock information provided by terrestrial clastic rocks likely encompasses the mixing of sediment sources, weathering, transport, and diagenesis, petrographic analysis results can have a low accuracy for confirming source. The heavy mineral analysis concentrates heavy minerals, which can identify the provenance of the host rock []. Heavy mineral assemblage, particularly the ZTR (zircon, tourmaline and rutile) index and coefficient of stability, can be a more accurate indicator of the source area, especially for young sediments [,]. The ZTR index is the proportion of rutile, zircon, and tourmaline in the transparent minerals. The stability coefficient = (rutile + zircon + tourmaline + garnet + staurolite + monazite + corundum + titanite + cyanite + spinel)/(biotite + chlorite + epidote + zoisite + hornblende + tremolite + apatite + pyroxene + barite + bagrationite) []. However, the determination of sandstone provenance directly from heavy mineral data is not straightforward []. Geophysical methods use dip logging and seismic progradational reflection configuration to determine the sediment path [,]. Although geophysical methods are convenient and can be used to infer the direction of provenance quickly, the accuracy of these methods can be low. Practice shows that the use of a single method possesses inevitable limitations. Consequently, current research typically applies more than two methods to determine provenance.
In order to more accurately determine provenance and provide data for oil and gas exploration, we present a comprehensive provenance analysis method, which is relatively complete, convenient for data acquisition, and has high accuracy, a great flexibility, and a wide range of applications.
The Huimin depression is an important petroleum-bearing province in the Bohai Bay Basin. The Paleogene Shahejie Formation (Es), and its lower portion are the key target for petroleum exploration. Confirming the distribution and source of the second and first members of the Shahejie Formation (Es2–Es1), and the overlying Dongying Formation (Ed) sand-body is still an ongoing problem for exploration. Previous studies concluded that the provenance of the Shahejie Formation (Es) is the Luxi uplift and the Chengning uplift [,]. Gao et al. concluded that the provenance of the Es2 in the Huimin depression are Cambrian strata to the northwest []. The sedimentary provenance of the Ed and the upper part of the Es interval in the Huimin depression has not been determined, and the sediment provenance of the Es2 to the Ed interval is not fully understood either. In addition, the Linfanjia high, which could be a source of sediment, has not been analyzed.
In this paper, based on the results of the various analytical methods, the sedimentary provenances of the Es2, Es1, and Ed intervals in the Huimin depression have been determined.
2. Materials and Methods
The mineralogical analyses were carried out using petrographic microscopes (Axioskop 40, ZEISS, Oberkochen, Germany). For this study, 182 thin sections and 471 heavy mineral concentrates prepared from clastic rocks were analyzed. Samples were collected from 13 wells in the study area. The 126 related sandstone thicknesses for various wells were determined after processing by using Gxplorer software (Version 3.0.3.0, Xi’an Gxplorer Software company, Xi’an, China). The 2D seismic profiles from 3D seismic data were analyzed at multiple angles, and three profiles with obvious reflection characteristics were selected for interpretation.
The comprehensive analysis method proposed in this paper can be used to extract provenance information by using microscopic analysis methods and macroscopic analysis methods (Figure 1). We are performing assessment of sediments’ sources. Compositional analysis of the clastic rocks was first determined using thin section, followed by lithologic assignment from compositional screening. The Gazzi–Dickinson counting method [] was used to count, then, plot the compositional data on the Dickinson diagram to determine the tectonic setting history of the provenance. The main stable and unstable heavy minerals preserved in strata of the study area were screened from the target layer for analysis. The variation of the ZTR index and the stability coefficient of the heavy minerals are indicators of the distribution of provenance exposures and can be used to identify those areas. According to the heavy mineral assemblage characteristics at different locations, the sedimentary regions can be subdivided and the parent rock lithologies identified. Based on the above results, we can deduce the sedimentary source regions. In order to prevent the omission of the source area, we need to discuss the results of analysis before proceeding with the macroanalysis. The analysis of the sandstone geometry (based on seismic reflections and bed thickness measured in drilling wells) provides complementary tools to establish sediment sources and dispersal paths in the basin sediment sources macroscopically. Based on the results of microscopic determination of the clastic rock composition and associated heavy minerals, the specific provenance can be verified by its progradation reflection characteristics on 2D seismic profiles. In addition, the progradation reflections on 2D seismic profiles with different angles further define the provenance direction and help to identify the provenance depositional system for the study area. With the aid of the planar variations in sandstone thickness, the range of influence of each provenance area on sedimentation can be determined (Figure 1). Finally, the method identifies the provenance system for the study area.
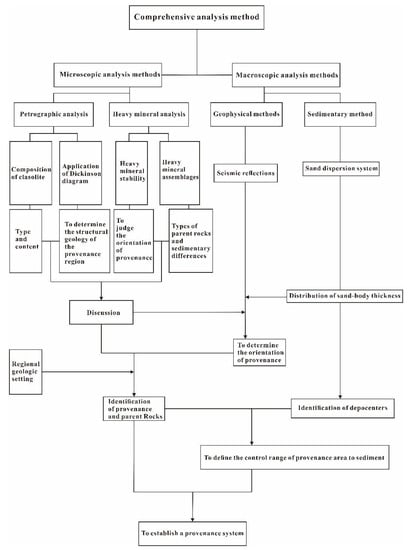
Figure 1.
Flowchart of comprehensive provenance analysis method.
The comprehensive provenance analysis method combines the advantages of petrology, heavy minerals, geophysics, and sedimentology, based on the microscopic provenance analysis of the clastic rock components and heavy minerals.
3. Regional Geologic Setting
The Huimin depression covers an area of about 5940 km2. It is bordered by the Shenxian depression to the west, the Dongying depression to the east, the Luxi uplift to the south, and the Chengning uplift to the north. The major axis of the depression is roughly NNE-trending and can be divided further into six fourth-level structural units: Linnan, Zizhen, Yangxin, Miaobei, Lizezhen, and Xiaozhuang (Figure 2). Subsags and convex structures alternate within the Huimin depression, inclined from the south northward. The sedimentary succession in the Huimin depression mainly includes strata of Paleogene, Neogene, and Quaternary age. The Paleogene strata are the main oil-bearing interval, which include the Kongdian Formation (Ek), the Shahejie Formation (Es), and the Dongying Formation (Ed) (ascending order). The Shahejie Formation and the upper part of the Dongying Formation are exposed along the boundaries but are well preserved in the center of the subsidence zone, and the Neogene is unconformable with the Paleogene []. Among them, the Es, which is the main oil-producing interval, can be divided into four members: Es1, Es2, Es3, and Es4 (Figure 3). The lithologic successions are mainly siltstone and fine and medium grain sandstone.
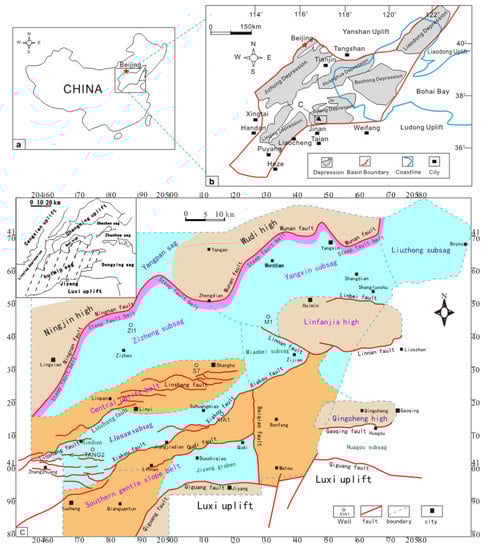
Figure 2.
A map showing (a) the location of the Bohai Bay Basin and (b) the boundaries of the Huimin depression. (c) A map showing the structural unit divisions of the Huimin depression and the dashed area in the upper left corner is a thumbnail of the map [].
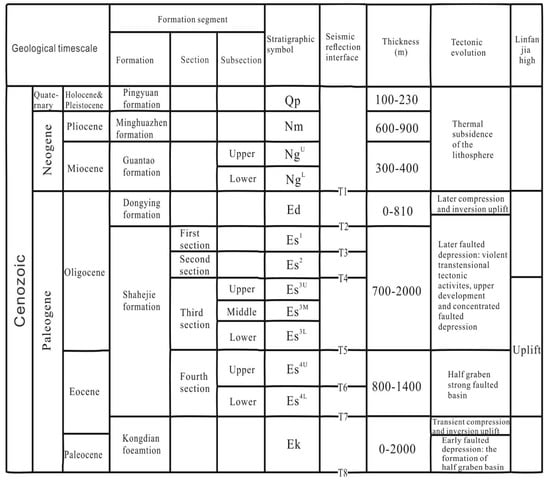
Figure 3.
Stratigraphic sequence and structural events in the Huimin depression. Diagram was revised from Feng (2017) [].
The basement structure of the Huimin depression is a tilted fault block, and the entire structure is an asymmetrical graben with a steep dip in the north, and a gentle dip in the south []. The Huimin depression has undergone four stages of deformation: (1) Initial rifting and subsidence in the Ek–Es4 stage, (2) intense, deep subsidence in the Es3–Es2 stage, (3) a second rifting stage, and (4) a shrinking in the Es1–Ed stage. The evolution of the Huimin depression is controlled by regional tectonics. During the Neogene Period, the Luxi uplift and Chengning uplift were denuded due to the influence of fault activity.
An Early–Middle Triassic stable craton sedimentary stage was followed by denudation and uplift in the Late Triassic. From the Late Jurassic to the Cretaceous, the Yangxin area entered a stage of faulted basin development. The movement on all the faults in the Yangxin and Linnan subsags began the Linfanjia uplift and its associated denudation in the Paleogene (Figure 3). Due to uplifting, strata from the Es2 to Ed were not developed on the Linfanjia high and deposition did not return until the Guantao formation (Ng) [,].
4. Application of the Method
4.1. Sandstone Petrography
4.1.1. Type and Content
Based on the thin section analysis, the clastic rocks from Es2 to Ed in the Huimin depression are mainly lithic feldspathic sandstones with less frequent feldspathic sandstones and feldspathic lithic sandstones (Figure 4). The clastic rocks of the Es2, Es1, and Ed are similar, and there is no obvious vertical variation in rock type or detrital content. The quartz fraction volume is 30–60%, with an average volume of 44.22%. Most of the quartz is as single crystals, with a small amount of polycrystalline quartz. The plagioclase content is slightly higher than the K-feldspar content, and the total integral of the plagioclase is 17–45%, with an average volume fraction of 32.51%. The lithics include metamorphic rocks, magmatic rocks, and a very small amount of sedimentary debris, contributing a volume that varies from 8–50% with an average of 23.10%.
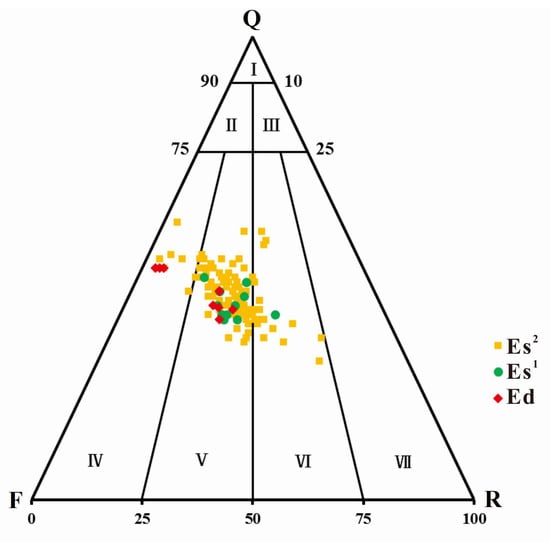
Figure 4.
Triangular plot of the rock type. Es2, Es1, and Ed in the diagram represent stratigraphic intervals. Q = quartz; F = feldspars; R = rock fragment. I—quartz sandstone; II—feldspar quartz sandstone; III—lithic quartz sandstone; IV—feldspar sandstone; V—lithic feldspathic sandstone; VI—feldspathic lithic sandstone; and VII—lithic sandstone.
From Es2 to Ed, in order of decreasing abundance, the clastic rocks are mainly lithic feldspathic sandstones, feldspathic sandstones, and feldspathic lithic sandstones. The average mineral maturity (feldspar/quartz) is about 0.732 and the clastic rock grains exhibit medium sorting and secondary prismatic roundness in a particle support structure. Therefore, the detrital material did not undergo long-distance aqueous transport. According to its geological history, the uplift around the Huimin depression is likely to be the source area of the sediment.
4.1.2. Tectonic Setting of the Provenance Area
In this paper, five Dickinson ternary diagrams (QFL, QmFLt, QpLvLs, QmPK, and Lm (Lv + Lu) Ls) were plotted using the characteristics of the composition of the clastic rocks and their tectonic setting (Figure 5).
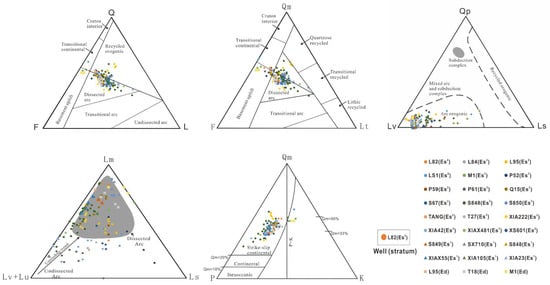
Figure 5.
Rock constituent Dickinson diagrams. Q = quartz; F = feldspars; L = unstable lithic grain; Qm = monocrystalline quartz (>0.0625 mm); Lt = total lithic fragments (Lt = L + Qp); Qp = polycrystalline quartz (including chert); Lv = volcanic, metavolcanics, and mafic metaigneous lithic grains; Ls = sedimentary lithic grain fragments; Lu = ultramafic lithic grains (serpentinite, serpentine schist); P = plagioclase grains; K = potassium feldspar grains. The tectonic setting of the provenance area is an island arc orogenic belt.
Most of the samples on the QmPK ternary diagram fall into the strike-slip continental margin tectonic zone, which agrees with the geologic background of the Bohai Bay Basin and provides evidence of the accuracy of the other diagrams. Based on the QFL, Lm (Lv + Lu) Ls, and QmFLt ternary diagrams, most of the samples from the three study horizons fall in the dissected arc area and a small number of the samples fall in the basement uplift and mixed source areas. However, the QpLvLs ternary diagram show that all the samples fall into the dissected arc area. Therefore, we indicate that the provenance is the magmatic rock area. It is noteworthy that the QmFLt ternary diagram indicates the existence of a mixed source for the Huimin depression. Combined with the geologic background of the Huimin depression, the magmatic rock area which agrees with the Dickinson ternary diagrams, includes the Chengning uplift to the north and the Luxi uplift to the south of the Huimin depression, while the Linfanjia high could be the sediment source of the Es2, Es1, and Ed.
4.2. Heavy Mineral Data
Garnet, zircon, titanomagnetite, tourmaline, titanite, hornblende, pyroxene, chlorite, epidote, zoisite, and barite are the main heavy minerals recovered from strata with the Huimin depression. Stable heavy minerals account for more than 70% of the total heavy mineral content of the depression’s clastic rocks. They have a high garnet and titanomagnetite content, and their stable heavy mineral assemblages are mainly garnet + zircon + titanomagnetite, indicating that the parent rocks were mainly magmatic and metamorphic.
Vertically, the ZTR index, the stability coefficient of the heavy minerals, and the heavy mineral assemblages in different layers of the same well do not change significantly from the Es2 to the Ed. In the plane, the ZTR indices and the stability coefficients of wells P34, P3, P2, and P1 in the northwestern part of the depression (Area A) are lower than those of other parts (Figure 6a). Well XIA4 is located in the middle of the depression (Area C); the stability coefficient and the ZTR index in this well are the highest. For well M1, located in the northeastern part of the Huimin depression (Area D), both the ZTR index and the stability coefficient are lower than 20. From well L19 to well T3 to well T1 to well XIA4, from well S4 to S7 to XIA4, from M1 to XIA4, and from XIA1 to XIA4, the stability coefficient and the ZTR indices of the heavy minerals increase (Figure 6). Thus, there may be five sedimentary supply directions: (1) A sedimentary source in the northwest represented by wells P34 and P3, (2) a NNW-trending provenance represented by the sediments of wells L19 and T3, (3) a northern provenance represented by the sediments of wells S4 and S7, (4) an eastern provenance represented by the sediments of well M1, and (5) a southern provenance represented by the sediments of well XIA4.
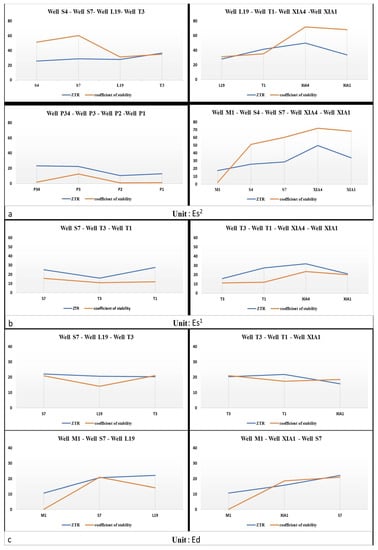
Figure 6.
ZTR (zircon, tourmaline, and rutile) index and stability coefficient of the heavy minerals in the Huimin depression. Diagrams showing (a) the ZTR index and stability coefficient of the heavy minerals in the Es2, (b) the ZTR index and stability coefficient of the heavy minerals in the Es1, and (c) the ZTR index and stability coefficient of the heavy minerals in the Ed. The X-axis represent wells. The Y-axis represent ratio. The locations of the samples are shown in Figure 7.
Combined with the tectonic setting, six sedimentary regions are defined based on their heavy mineral assemblages and mineral contents (Figure 7).
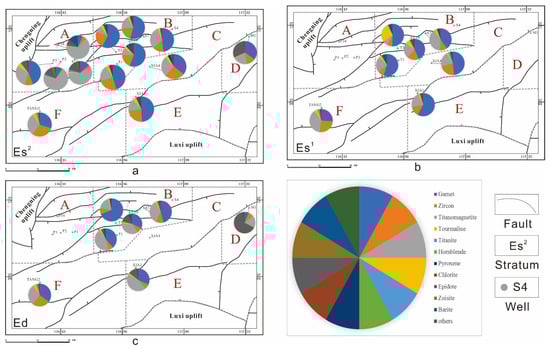
Figure 7.
Characteristic planar distribution map of the heavy mineral assemblages of the Huimin depression. (a) Distribution of the heavy mineral assemblage of the Es2. (b) Distribution of the heavy mineral assemblage of the Es1. (c) Distribution of the heavy mineral assemblage of Ed. Based on the characteristics of its heavy mineral assemblage, the Huimin depression can be divided into six sedimentary areas: A, B, C, D, E, and F.
• Area A
It is represented by well P34. Its heavy mineral assemblage is garnet + zircon + titanomagnetite + tourmaline + titanite + epidote + zoisite. The titanomagnetite content of this area is >50%, the zircon content is 5%.
• Area B
Located in the northern part of the Huimin depression, Area B is represented by wells S4, T3, and L19. Its heavy mineral assemblage is garnet + zircon + titanomagnetite + tourmaline + chlorite + epidote + barite. The garnet content is the highest in this area, with an average content of 45%, while the average content of barite is 4%. The epidote and zoisite contents of Area B are lower than Area A. The Es2 in wells 19 and S4 contains about 3% pyroxene. There are about 3% hornblende in the Es1 and the Ed in well S7. In this area, when the pyroxene and hornblende contents increase, the chlorite content decreases.
• Area C
It is represented by well XIA4. Its heavy mineral assemblage is garnet + zircon + titanomagnetite + tourmaline + titanite + epidote + barite. The zircon content increases, and it contains about 23% titanite.
• Area D
This is the Yangxin subsag, a fourth-level tectonic unit located in the eastern part of the Huimin depression, which is represented by well M1. Its heavy mineral assemblage is garnet + zircon + titanomagnetite + tourmaline + titanite + epidote + barite. The epidote content is very high, accounting for about 30% of the heavy minerals in each stratum, and the average content of garnet is less than 20%.
• Area E
Located in the southern part of the Huimin depression, Area E is represented by well XIA1. Its heavy mineral assemblage is garnet + zircon + titanomagnetite + tourmaline + titanite + epidote + barite. The heavy mineral assemblage from this area is similar to that of Area D, but the epidote content is lower, and the titanomagnetite, zircon, and garnet contents are higher. Areas B and E are can be distinguished by their titanite content.
• Area F
Located in the western part of the Huimin depression, Area F is represented by well TANG2. Its heavy mineral assemblage is garnet + zircon + titanomagnetite + tourmaline + titanite + epidote + barite. Area F is distinguished from Area C by its mineral assemblage of garnet, titanomagnetite, and zircon almost of equal abundance, with each mineral accounting for about 30% of the total heavy mineral content.
According to heavy mineral assemblages, their contents and five sedimentary supply directions, we can conclude that the sediments in Area B are mainly sourced from north, Area E is mainly sourced from the south, and Area C is a mixed sedimentary area controlled by both the northern and south provenances. The sediments in Area A are controlled by the west of the Chengning uplift. The heavy mineral assemblage of Area F points to a mixed source. In well M1, from Area D, it indicates a provenance from the Linfanjia high, to the east of the depression. These data suggest that the Linfanjia high controls the sedimentation in the Yangxin subsag, but the influence of the Wudi high remains unclear.
4.3. Seismic Reflections
The progradation direction was sketched based on these seismic reflection features. There are obvious progradational reflection configurations in several of the seismic profiles of the target stratum in the study area (Figure 8). The sediments from the east, west, and south migrated to and accumulated in the depocenter of the Huimin depression.
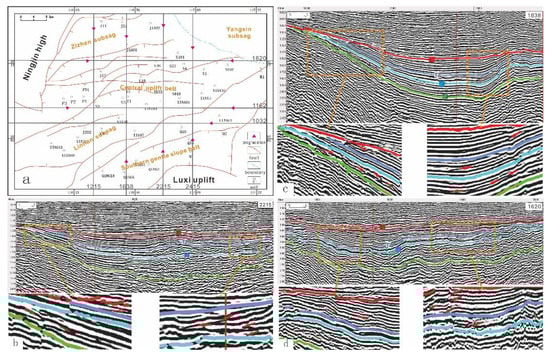
Figure 8.
(a) Seismic survey lines in the Huimin depression and the planar position of the main progradation reflection points of each survey line. The diagrams show the (b) progradation reflection characteristics of the Es2 to the Ed in north–south trending seismic section 2215, (c) progradation reflection characteristics of the Es2 to the Ed in north–south trending seismic section 1638, and (d) the progradation reflection characteristics of the Es2 to the Ed in west–east trending seismic section 1620. T1—bottom reflection of the Ng; T2—bottom reflection of the Ed; T3—bio-limestone reflection in the Es1; T4—bottom reflection of the Es2.
2D seismic lines, 1620, 1162, and 1032, strike EW. Based on progradational reflection configurations, there are two directions of sediment supply, i.e., east and west. In the western part of 2D seismic section 1032, the characteristics of the progradation reflection are not obvious. The area of the source region to the east of the Huimin depression might be larger than the western provenance area. The eastern provenance area is the Linfanjia high, and the western provenance area is the west of the Chengning uplift.
2D seismic lines, 1215, 1638, 2215, and 2415, strike NS. Seismic profiles 1638 and 2215 have obvious progradational reflection configurations. From west to the east, debris was supplied to the sedimentary center from the southern and northern parts of the Huimin depression. The provenance of the depression is multidirectional. Overall, the southern provenance system has the western part of the Luxi uplift as its core, and the northern provenance system has the Chengning uplift as its core. These two provenances are the main sediment source areas for the Huimin depression.
4.4. Distribution of Sandstone Bodies
Isopach maps of the sandstone bodies were drawn (Figure 9). From the Es2 to the Ed, the sedimentary center of the sand body migrated westward. The thickness of the Es2 sand body gradually increases from the northwest, east, southwest, and south to the center of the depression. The Es1 sand body in the mid-western part of the Huimin depression has obviously been thickened. The thickness of the sand body, which is centered on well XIA28, decreases gradually from west to east. Compared with Es1, the sand body in Ed is thickened in the mid-western part of the depression. The sand body is thickened from the northwest, north, east, and south to the mid-western part of the depression in the form of a leaf. In general, there are four directions of sediment supply: Northwest, north, south, and east. The thickness of the sand body in the northern part of the Huimin depression spreads toward the center in the form of a leaf, so there should be many subordinate provenances to the north of the Huimin depression. There is a thicker sand body in the northeastern part of the depression, which should be the sedimentary sand body controlled by the provenance to the east of the depression.
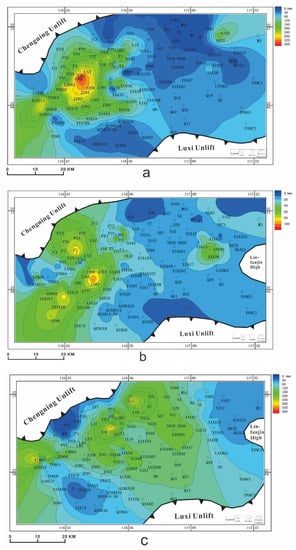
Figure 9.
Isopach map of sandstone in the Huimin depression. Isopach maps of (a) sandstone thickness in Ed, (b) sandstone thickness in Es1, and (c) sandstone thickness in Es2.
5. Discussion
As has been mention above, lithologically, the clastic rocks of the Huimin depression are mainly lithic feldspathic sandstones exhibiting low maturity and a short distance of fluvial transport, the Chengning and Luxi uplifts conform to the tectonic setting of a dissected arc belt indicated by Dickinson diagrams, and, depositionally, the sediments from Chengning and Luxi uplifts entered the depocenter from different angles. Therefore, we conclude that there should be multiple source outlets and multiple watercourses in the north and south of the Huimin depression and there are two source areas, i.e., the Luxi uplift and the Chengning uplift. Due to the influence of faults, the provenance system to the north is both complex and multidirectional. The northern provenance area can be divided into two secondary provenance systems based on six areas of sedimentation. These are the western secondary system to the west of the Chengning uplift, and the middle secondary system represented by the Chengning uplift. The northern provenance of system-controlled sedimentation is subdivided into the Xiaozhuang, Tangzhuang, Linyi, Jishan, Shanghe, and Zizhen regions. The dip of strata to the south of the Huimin depression is relatively gentle, and its provenance system mainly controls sedimentation in the Linnan subsag. The Yangxin subsag in the eastern part of the Huimin depression is weakly influenced by both northern and southern provenance systems.
In addition, the amount of erosional denudation suffered by the Ningjin high is about 50% of the total sedimentary volume of the entire Ek, Es, and Ed intervals in the northwestern part of the Huimin depression []. The Dickinson ternary diagram indicates that there are other provenances in addition to the dissection island arc area. The east–west 2D seismic section across the middle of the depression shows that there is a provenance system to the east. The stability of the heavy minerals gradually increases from the eastern part of the depression to the central part of the depression, and the unstable heavy mineral epidote accounts for a large proportion of the eastern sediments. The sedimentary sand body has another depocenter in the northeastern part of the Huimin depression. Therefore, there is the other sediment source area except the Luxi and Chengning uplifts for the basin-fill. The Linfanjia high to the east of the Huimin depression gradually became involved in the sedimentation of the Shahejie Formation and reached stability in the Es2. The sedimentary strata affected by the Linfanjia high are mainly the lower member of the Es2, so it could be the sediment source of the Es2, Es1, and Ed. The early sediments of the Linfanjia high were derived from the Chengning uplift to the north and the Luxi uplift to the south. Therefore, the tectonic setting may show a dissection arc, which agrees with the results of the Dickinson ternary diagrams. By combining the comprehensive provenance analysis method with the geological background, we identify the Linfanjia high, which is located to the east of the Huimin depression, as the third largest provenance area of the Huimin depression. The sand of well S971 is thick, and 158 meters of sand was deposited during the Ed period. The thickness of sand to the east of well S971 is thinner, so we conclude that the Linfanjia controls the sedimentation of the Yangxin subsag. The influences of the Wudi high on the Yangxin subsag are not clear.
Wang (2007) analyzed the provenance of the Es3 in the Huimin depression using the ratios of characteristic elements []. The analysis shows that the Mg/Mn ratio of the sedimentary strata is high, which is consistent with the characteristic element ratios of the Precambrian gneiss and some of the Ordovician strata in the Chengning and the Luxi uplifts. The Mg/Mn ratio of the sediments in the Es2 is high, like that of the Precambrian magmatic and metamorphic rocks of the Chengning uplift and the Luxi uplift []. Furthermore, in accordance with the results of that analysis, we can conclude that the provenance of the Es2, Es1, and Ed in the Huimin depression is mainly magmatic and metamorphic rocks. Thus, the Precambrian and Ordovician strata in the Chengning and Luxi uplifts might be the sedimentary source of sedimentary strata of units Es2, Es1, and Ed in the Huimin depression. In order to further explore the age information of the parent rock, zircon can be used for dating.
6. Conclusions
Based on the geological background, the comprehensive analysis of the rock composition, heavy minerals, sand distributed system, and seismic reflection characteristics, three conclusions can be drawn.
The sediment sources of the Es2, Es1, and Ed in the Huimin depression were analyzed using comprehensive provenance analysis method. We concluded that there are two provincial areas, i.e., the Luxi uplift to the south and the Chengning uplift to the north of the Huimin depression.
The provenance system of the Chengning uplift to the north is the more complex multi-directional source. The Chengning system can be divided into two major provenance systems, the western and central systems. The system has two main provenance directions, northwest and north, and contains multiple secondary provenance directions. The western sub-provenance system controls sedimentation in the Xiaozhuang and Tangzhuang areas of the northwestern part of the Huimin depression, while the central sub-provenance system controls sedimentation in the Linyi, Jishan, and Shanghe areas. The southern Luxi uplift provenance system consists mainly of the southwestern provenance system. The southwestern provenance system mainly controls sedimentation in the southern slope belt of the Huimin depression.
By applying the comprehensive provenance analysis method, we concluded that the provenance area is the Linfanjia high to the east of the Huimin depression. The Linfanjia high controls the sedimentation of the Yangxin subsag.
Author Contributions
As the corresponding author, H.W. made substantial contributions to the conception/design of the work; he has approved the final version to be published; and he agrees to be accountable for all aspects of the work in ensuring that questions related to the accuracy or integrity of any part of the work are appropriately investigated and resolved. Following H.W. designs, Z.Z. performed all the experiments, analyzed experimental results, and drafted the work. Z.Z. and H.W. provided important intellectual support in interpretation of the data and discussion; all authors critically revised the manuscript.
Funding
This research received no external funding.
Acknowledgments
We acknowledge financial support from the Sinopec Group. Thanks to the LetPub company for polishing the paper.
Conflicts of Interest
The authors declare no competing financial and non-financial interests. H.L.W. and Z.H.Z. declare no potential conflict of interest.
References
- Huang, C.Y.; Wang, H.; Zhou, L.H.; Ren, P.G.; Liu, J.; Bai, Y.F. Provenance system characters of the third member of Shahejie formation in the Paleogene in Beitang sag. Earth Sci. 2009, 34, 975–984. [Google Scholar]
- Zhao, H.G.; Liu, C.Y. Approaches and prospects of provenance analysis. Acta Sedimentol Sin. 2003, 3, 409–415. [Google Scholar]
- Jiao, Y.Q.; Li, Z.; Zhou, H.M. The integated study of sediment sources in sedimentary basins: An example from the Eogene Nanpu rift subbasin. J. Palaeogeo. 1998, 5, 16–20. [Google Scholar]
- Peng, Z.C.; Fu, X.H.; Liu, J.C.; Zhang, S.C.Q. Analysis methods and research progress of sediment source. J. Xi’an Univ. (Nat. Sci. Ed.) 2017, 1, 116–121. [Google Scholar]
- Crook, K.A.W. Lithogenesis and geotectonics: The significance of compositional variation in flyscharenites (graywackes). Soc. Econ. Paleontol. Mineral. 1970, SP19, 304–310. [Google Scholar]
- Dickinson, W.R.; Helmold, K.P.; Stein, J.A. Mesozoic lithic sandstones in Central Oregon. J. Sediment. Res. 1979, 49, 501–516. [Google Scholar]
- Dickinson, W.R. Interpreting provenance relations from detrital modes of sandstones. In Provenance of Arenites; Zuffa GG, Ed.; D. Reidel: Dordrecht, The Netherlands, 1885; pp. 333–361. [Google Scholar]
- Ma, S.X.; Meng, Q.R.; Qu, Y.Q. Development on provenance analysis of light minerals. Acta Pet. Sin. 2014, 30, 597–608. [Google Scholar]
- Garzanti, E.; Doglioni, C.; Vezzoli, G.; Andò, S. Orogenic Belts and Orogenic Sediment Provenance. J. Geol. 2007, 115, 315–334. [Google Scholar] [CrossRef]
- Weltje, G.J. Quantitative analysis of detrital modes: statistically rigorous confidence regions in ternary diagrams and their use in sedimentary petrology. Earth Sci. Rev. 2002, 57, 211–253. [Google Scholar] [CrossRef]
- Ingersoll, R.V.; Kretchmer, A.G.; Valles, P.K. The effect of sampling scale on actualistic sandstone petrofacies. Sedimentology 2010, 40, 937–953. [Google Scholar] [CrossRef]
- Garzanti, E.; Canclini, S.; Foggia, F.M.; Petrella, N. Unraveling Magmatic and Orogenic Provenance in Modern Sand: The Back-Arc Side of the Apennine Thrust Belt, Italy. J. Sediment. Res. 2002, 72, 2–17. [Google Scholar] [CrossRef]
- Jiang, Z.X.; Xing, H.Q.; Li, R.W.; Luo, D.X. Research on provenance and paleocurrents in the Meso-Cenozoic Hefei basin. Geoscience 2005, 19, 247–252. [Google Scholar]
- Li, S.J.; Wang, Q.C.; Li, Z. Characteristics of Mesozoic and Cenozoic heavy minerals from Kuche River section in Kuche depression and their geological implications. Acta Pet. Miner. 2005, 24, 53–61. [Google Scholar]
- Morton, A.C.; Whitham, A.G.; Fanning, C.M. Provenance of Late Cretaceous to Paleocene submarine fan sandstones in the Norwegian Sea: Integration of heavy mineral, mineral chemical and zircon age data. Sediment. Geol. 2005, 182, 3–28. [Google Scholar] [CrossRef]
- Shen, L.Q. Important concepts and applications of heavy minerals in sedimentary rocks. Sci. China Ser. B Chem. 1985, 1, 70–78. [Google Scholar]
- Fu, L.; Guan, P.; Zhao, W.Y.; Wang, M.; Zhang, Y.; Lu, J.W. Heavy mineral feature and provenance analysis of Paleogene Lulehe formation in Qaidam basin. Acta Pet. Sin. 2013, 29, 2867–2875. [Google Scholar]
- Morton, A.; Hallsworth, C.; Chalton, B. Garnet compositions in Scottish and Norwegian basement terrains: a framework for interpretation of North Sea sandstone provenance. Mar. Pet. Geol. 2004, 21, 393–410. [Google Scholar] [CrossRef]
- Dong, Y.L.; Zhu, X.M.; Geng, X.J.; Luo, J.Q.; Liu, G.L.; Jiang, Q. Provenance analysis of the Paleogene Hetaoyuan formation in southeastern Biyang sag of Nanxiang basin, Henan Province. Acta Pet. Sin. 2014, 16, 115–124. [Google Scholar]
- Liu, T.; Chen, G.; Chen, G.; Xu, X.G.; Kang, Y.; Lan, F. Methods and development trend of provenance Analysis. Northwest Geol. 2016, 49, 121–128. [Google Scholar]
- Wang, R.G.; Li, W.H.; Zheng, Y.; Liu, J. Source analysis and sedimentary facies research of member III of Shahejie formation in Qudi oil field in Huimin Sag. Sci-Tech. Inf. Dev. Econ. 2010, 20, 141–144. [Google Scholar]
- Wang, C.F. Study on sedimentary characteristics of Es3 and Es4 member in the south slope belt of Linnan sub-depression. Ph.D. Thesis, China University of Petroleum, Qingdao, China, 2013. [Google Scholar]
- Gao, L.H.; Han, Z.Z.; Dang, G.Y.; Fan, A.P.; Yang, R.C.; Xu, X.B. Provenance of the lower Es2 in the Shanghe area of the Huimin sag. Min. Sci. Technol. 2010, 20, 453–459,477. [Google Scholar] [CrossRef]
- Suttner, L.J.; Basu, A.; Ingersoll, R.V.; Bullard, T.F.; Ford, R.L.; Pickle, J.D. The effect of grain size on detrital modes; a test of the Gazzi-Dickinson point-counting method. J. Sediment. Res. 1985, 54, 616–618. [Google Scholar] [CrossRef]
- Feng, D. Evolution of the transtensional structure in Huimin sag of Bohai Bay basin, eastern China. Arab. J. Geosci. 2017, 10, 60. [Google Scholar] [CrossRef]
- Ma, S.Z. The study of Paleogene tectonic-sedimentary evolution and hydrocarbon reservoir formation model in Huimin Sag. Ph.D. Thesis, China University of Geosciences, Beijing, China, 2007. [Google Scholar]
- Hou, X.B.; Wu, Z.P.; Li, W. Tectonic history of Linfanjia area and analysis of coal-formed gas reservoir forming conditions in upper Paleozoic. In Proceedings of the 5th International Symposium on Hydrocarbon Accumulation Mechanisms and Petroleum Resource Evalution, China University of Petroleum, Beijing, China, 17–19 October 2009; pp. 900–905. [Google Scholar]
- Wang, Y.B.; Zhang, J.; Liu, Q.L.; Yang, J. Cenozoic tectonic evolution of Yangxin sag. Sci Technol. Vis. 2016, 7, 266–267. [Google Scholar]
- Wang, G.G. Study on the characteristics of provenance and the distribution of sedimentary system of Sha-III member of Paleogene in Huiming depression. Ph.D. Thesis, China Academy of Science, Guangzhou, China, 2007. [Google Scholar]
© 2019 by the authors. Licensee MDPI, Basel, Switzerland. This article is an open access article distributed under the terms and conditions of the Creative Commons Attribution (CC BY) license (http://creativecommons.org/licenses/by/4.0/).