Abstract
As the near surface deposits are being mined out, underground mines will increasingly operate at greater depths. This will increase the challenges related to transporting materials from deeper levels to the surface. For many years, the ore and waste transportation from most deep underground mines has depended on some or all of the following: truck haulage, conveyor belts, shafts, rails, and ore pass systems. In sub-level caving, and where ore passes are used, trains operating on the main lower level transport the ore from ore passes to a crusher, for subsequent hoisting to the surface through the shaft system. In many mines, the use of the ore pass system has led to several problems related to the ore pass availability, causing production disturbances and incurred cost and time for ore pass rehabilitation. These production disturbances have an impact on the mining activities since they increase the operational costs, and lower the mine throughput. A continued dependency on rock mass transportation using ore passes will generate high capital costs for various supporting structures such as rail tracks, shaft extensions, and crushers for every new main level. This study was conducted at an existing underground mine and analyzed the transport of ore from loading areas at the lower levels up to the existing shaft points using trucks without employing ore passes. The results show that, when the costs of extending ore passes to lower levels become too great or ore passes cannot be used for production, haul trucks can be a feasible alternative method for transport of ore and waste up the ramp to the existing crusher located at the previous main level. The use of trucks will avoid installing infrastructure at the next main level and extending the ore passes to lower levels, hence reducing costs.
1. Introduction
As resources near the surface are being mined, underground mines worldwide are operating at increasing depths. The cost and time required for rock mass transportation increases with increased mining depths, and with the aim to increase mined volumes and reduce production costs, the rock mass transportation from deeper levels to the mine surface presents challenge for the underground mines. Despite the existence and availability of several haulage options, production in most deep underground mines depends on the safe and continuous operation of the ore pass system. Ore passes are used for material transportation, and can also serve as a means to store ore in underground mines [1]. However, in order to design a well-functioning ore pass, it is necessary to examine the entire ore handling system of the mine, from the production areas to the shaft points [2].
In sub-level caving, ore is mined on each sub-level from the hanging wall to the forefront of the footwall, starting with overlying sub-levels and proceeding downwards. As the ore is mined from a sub-level, the hanging wall collapses and covers the mining area with broken waste rock [3]. The ore is transported to the desired destination by either the use of ore passes, or by other hauling methods. When ore passes are used, trains operating on the main level transport the ore from the ore passes to the crusher, for subsequent hoisting to the surface through the shaft system. This incurs a high capital cost for various structures such as rail tracks, shaft extensions, and crushers for every new main level. Despite the existence of design guidelines, ore pass problems, including hang-ups and wall failures still persist in underground mines. These problems result in threats to the safety of personnel, loss of production, and an increase in the costs of repairs and production [4,5]. Even when the ore passes are carefully designed, the ore pass system is susceptible to several problems over its design life, including stability, wear, and material flow [6]. These problems increase delays in mining operations [7], and delays have an impact on the mining activities since they increase the operational costs and reduce the mine throughput. A study of more than 200 ore passes conducted in South African mines observed that more than 50 percent of these ore passes had stability problems, and 16 percent of them had been abandoned [8]. Several methods can be employed to restore the ore passes, such as the use of long-hole drilling and blasting, flushing a blocked ore pass with water, pushing rods, and the use of appropriate block size infrastructure to prevent the passage of oversized boulders [9]. In most cases, the actual cost of restoring ore passes is extremely high compared with the initial cost of development [8]. If ore pass restoration is not possible, and the ore pass therefore will not be used for production, and alternative transportation methods must be considered.
The aim of this study is to evaluate a conceptual future haulage method at an existing underground sub-level caving mine by comparing different haulage equipment of various sizes operating from the production drifts to the crushers, enabling rock mass transportation without using ore passes. Discrete event simulation was used for the analysis, and the study is based on data from an operating mine.
2. Haulage Systems for Deeper Levels
Existing transport methods that are feasible for deep mines include truck haulage, shaft systems, and conveyor belts. Trucks are highly flexible in travel routes and fleet size, and provide high productivity [10]. Shaft systems may be inflexible because of their limited number of fixed feed points, but once installed they offer low operational costs [11,12,13]. Conveyor belts typically provide the most economic method for material transportation due to their high carrying capacity [13]. The choice of conveyor parameters is influenced by the nature of the material to be conveyed, the available tunnel space, and the overall economics of the system. Normally, all of these various haulage systems work in combination with other ore-handling components, such as Load-Haul-Dump (LHD) machines, ore passes and crushers. The haulage process is one of the most cost-intensive activities in a mining operation, and thus, one of the main contributors to operational costs [10,14]. The expected increase in transportation costs for deeper mines makes the choice of hauling equipment essential when seeking cost reductions for deeper level operations. The high cost of developing a new main level when a mine operates at great depth necessitates the technological innovation of an alternative haulage system. Frequent problems with ore pass failures, and the significant costs involved in managing these ore passes, make the continuation of the current ore handling approach questionable. While these challenges continue, mining operations seek to optimize the haulage system so that the desired production rates are achieved on time, and at minimum cost. This study evaluates the use of trucks to transport ore from the loading areas directly to the dumping point at the shaft without using ore passes. The use of trucks will help avoid new main level development and infrastructure costs, and hence reduce capital costs.
3. Simulation of Haulage Systems
Underground haulage systems are complex, and involve high investment costs. For many years, analytical methods have been used to evaluate the performance of the system. These methods produce useful information on the system being analyzed, but their application is limited; for example, when the systems involve non-steady state conditions, or when operations involve uncertainties [14,15,16]. Under these conditions, an alternative method for analyzing a system is discrete event simulation. The random and dynamic nature of the haulage systems of mining operations makes them very difficult to model using analytical models. For that reason, in this work we have chosen to use discrete event simulation as the technique to evaluate the mine operations. When simulation is employed, model input can be based on appropriate probability distributions that characterize the input variables. The process of designing a model of a real system usually takes into account a set of assumptions for the operating system [17]. These assumptions are expressed in mathematical, logical, and symbolic relationships between the objects of the system of interest, and they can be solved analytically or by using simulation. With the aim of optimizing, improving, analyzing and planning of existing and future systems, various mining operations can be analyzed using simulation. These include: fleet requirements, the mine scheduling, and mine planning [14,17]. There are a number of simulation tools available in the market, such as SimMine, SLAM, SIMAN, ARENA, and AUTOMOD. In this study, the SimMine simulation software, which is based on discrete event simulation principles and has been developed specifically for the simulation of mining operations [18,19], is used.
4. Case Study
4.1. Mine Description
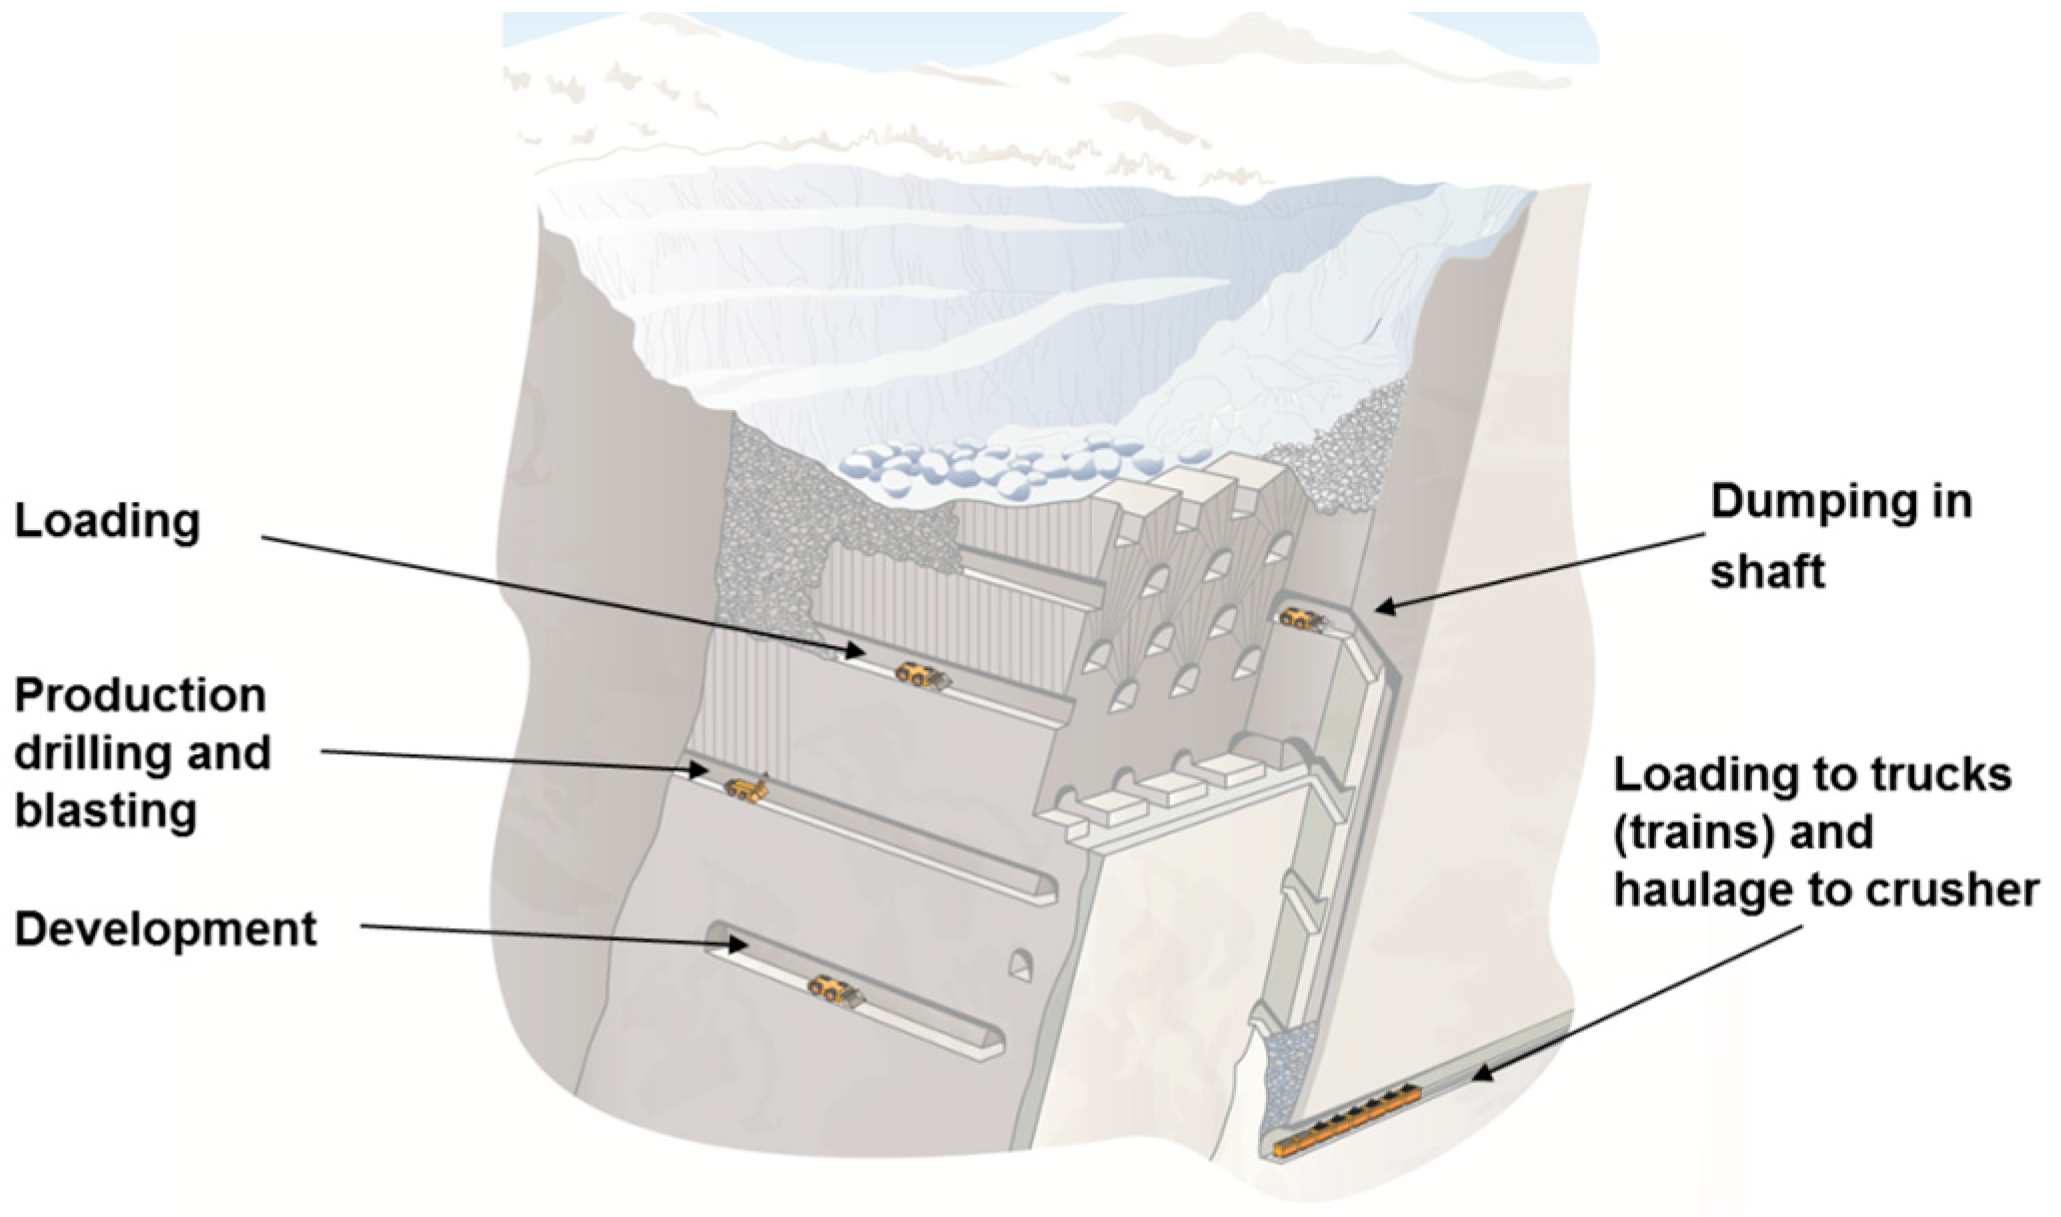
This study was carried out in one of the largest underground mines in Sweden. The mine consists of a high-grade magnetite deposit approximately four kilometers long running in the northeasterly direction, with an average thickness of between 80 and 100 m. The mine uses the sub-level caving method (see Figure 1). In this method, development drifts are opened first, followed by the drilling of the ore passes. The ore passes extend vertically from the current mining area down to the bottom of a new mining area, where a transportation level is located. Horizontal sub-levels are created, including crosscuts that provide access to the production drifts. The self-supported crosscuts are drilled through the orebody, perpendicular to the access routes. The spaces between sub-levels are about 28.5 m, while spaces between crosscuts are 25 m. At the crosscuts, near-vertical rings of holes are drilled in a fan-shaped pattern. Each ring contains around 10,000 t of ore and waste. The ore is mined on each sub-level, starting with overlying sub-levels and proceeding downwards; in each sub-level, the ore is removed from the hanging wall to the forefront of the footwall. As the ore is mined from a sub-level, the hanging wall collapses by design, and covers the mining area with broken waste rock [3].
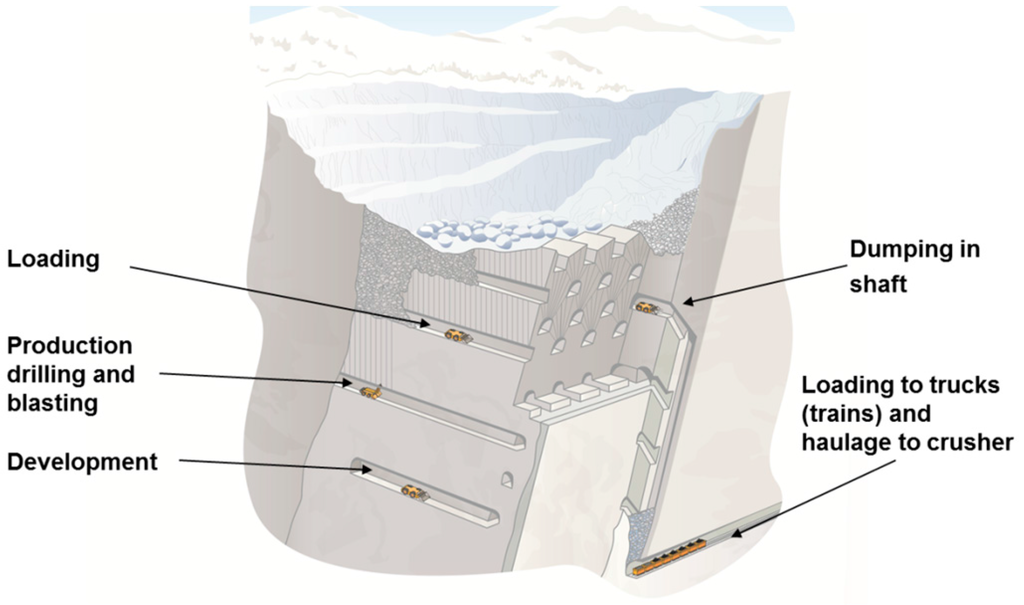
Figure 1.
Sub-level caving mining method (Courtesy of Atlas Copco).
4.2. The Current Haulage System in the Mine
The mine is divided into 10 main production areas, called blocks, which extend from the uppermost mining level down to the current main level. Each mine block currently consists of 10 sub-levels. Each block is 400 to 500 m in length, and has its own group of ore passes located at the center of the production area and extending down to the main haulage level. Currently, the main haulage level is at 1365 m. Mining continues in each block using electric LHDs with a capacity of 25 t that operate from 6 a.m. until 10 p.m., while semi-automated diesel LHD machines with a capacity of 21 t operate from 10 p.m. to 6 a.m. Blasting normally occurs at around 00:00 every day. The LHDs load the ore from draw points within each production drift, and transport the ore to the ore passes. Large trains, operating on the main level, transport the ore from ore passes to a crusher. The crushed material is stored in the ore bins, and after that transported on a small conveyor belt to the hoisting system. To conform to mining restrictions, once mining begins in a block, it must be maintained until all available ore is removed before starting to mine the next one. The current loading operation from each block results in an average daily production of 6035 t. The future plan is to increase production to 37 Mt of crude ore per year from all ten blocks, which means a daily production of 10,000 t from each block.
4.3. Conceptual Haulage System
The next main level at the mine will be at the depth of 1685 m, followed by another level 2005 m deep. With increasing depth, stresses increase, creating higher risk for geomechanical problems such as ore pass failures. If ore pass restoration is not possible, and the ore passes cannot be used for production, alternative transportation methods have to be applied. In this study, a conceptual truck haulage system for transport of the material from the production areas to the crusher on the previous main level located at 1365 m was modeled and simulated. By using a truck haulage system, the installation of a rail-mounted track system can be avoided and the hoisting system will not have to be extended, thus reducing infrastructure costs.
4.4. Simulation Model
In order to identify the number and size of the trucks needed to reach the future production target, a simulation model was developed. The model formulation was done using the SimMine simulation software (SimMine AB, Malå, Sweden), which uses a full graphical user interface for model set up. It utilizes statistical distribution functions to model variations in process times. For verification purposes, and to increase understanding, the tool has a three-dimensional environment that offers animated visual feedback of the model, allowing viewing of the dynamic system as it operates [19,20].
4.5. Model Settings
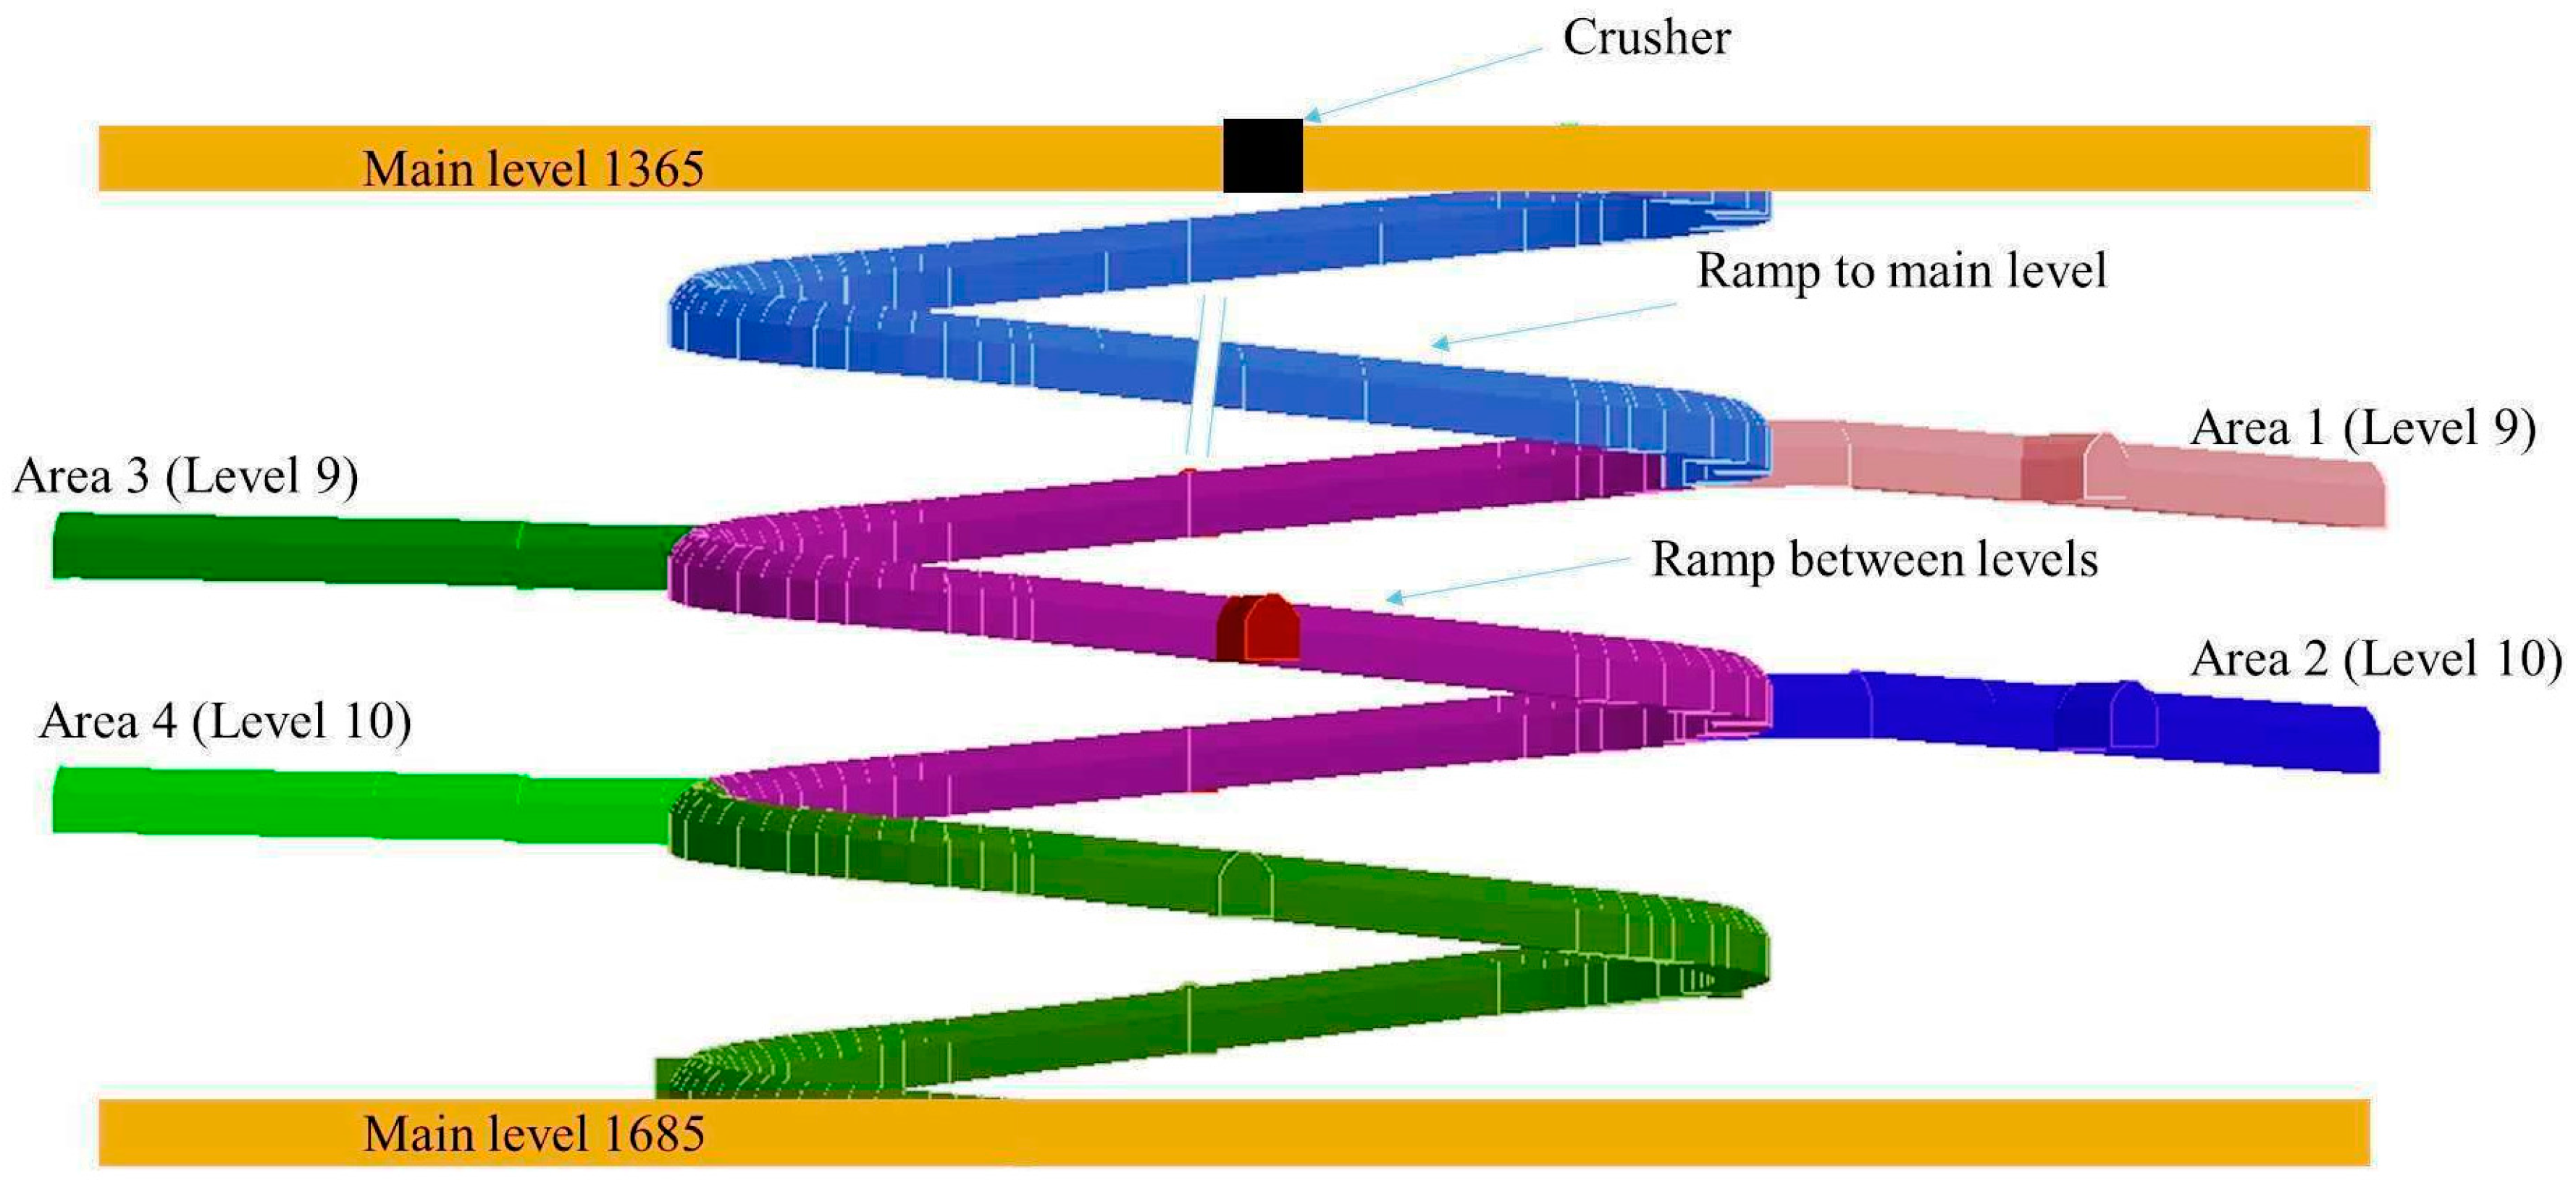
The conceptual mine layout modeled in the simulation is shown in Figure 2. The modeled area consists of the current main level (1365 m) where the crusher is located, and a series of ramps connecting the production areas with the main level. In this study, two simulations were run, and can be described as follows:
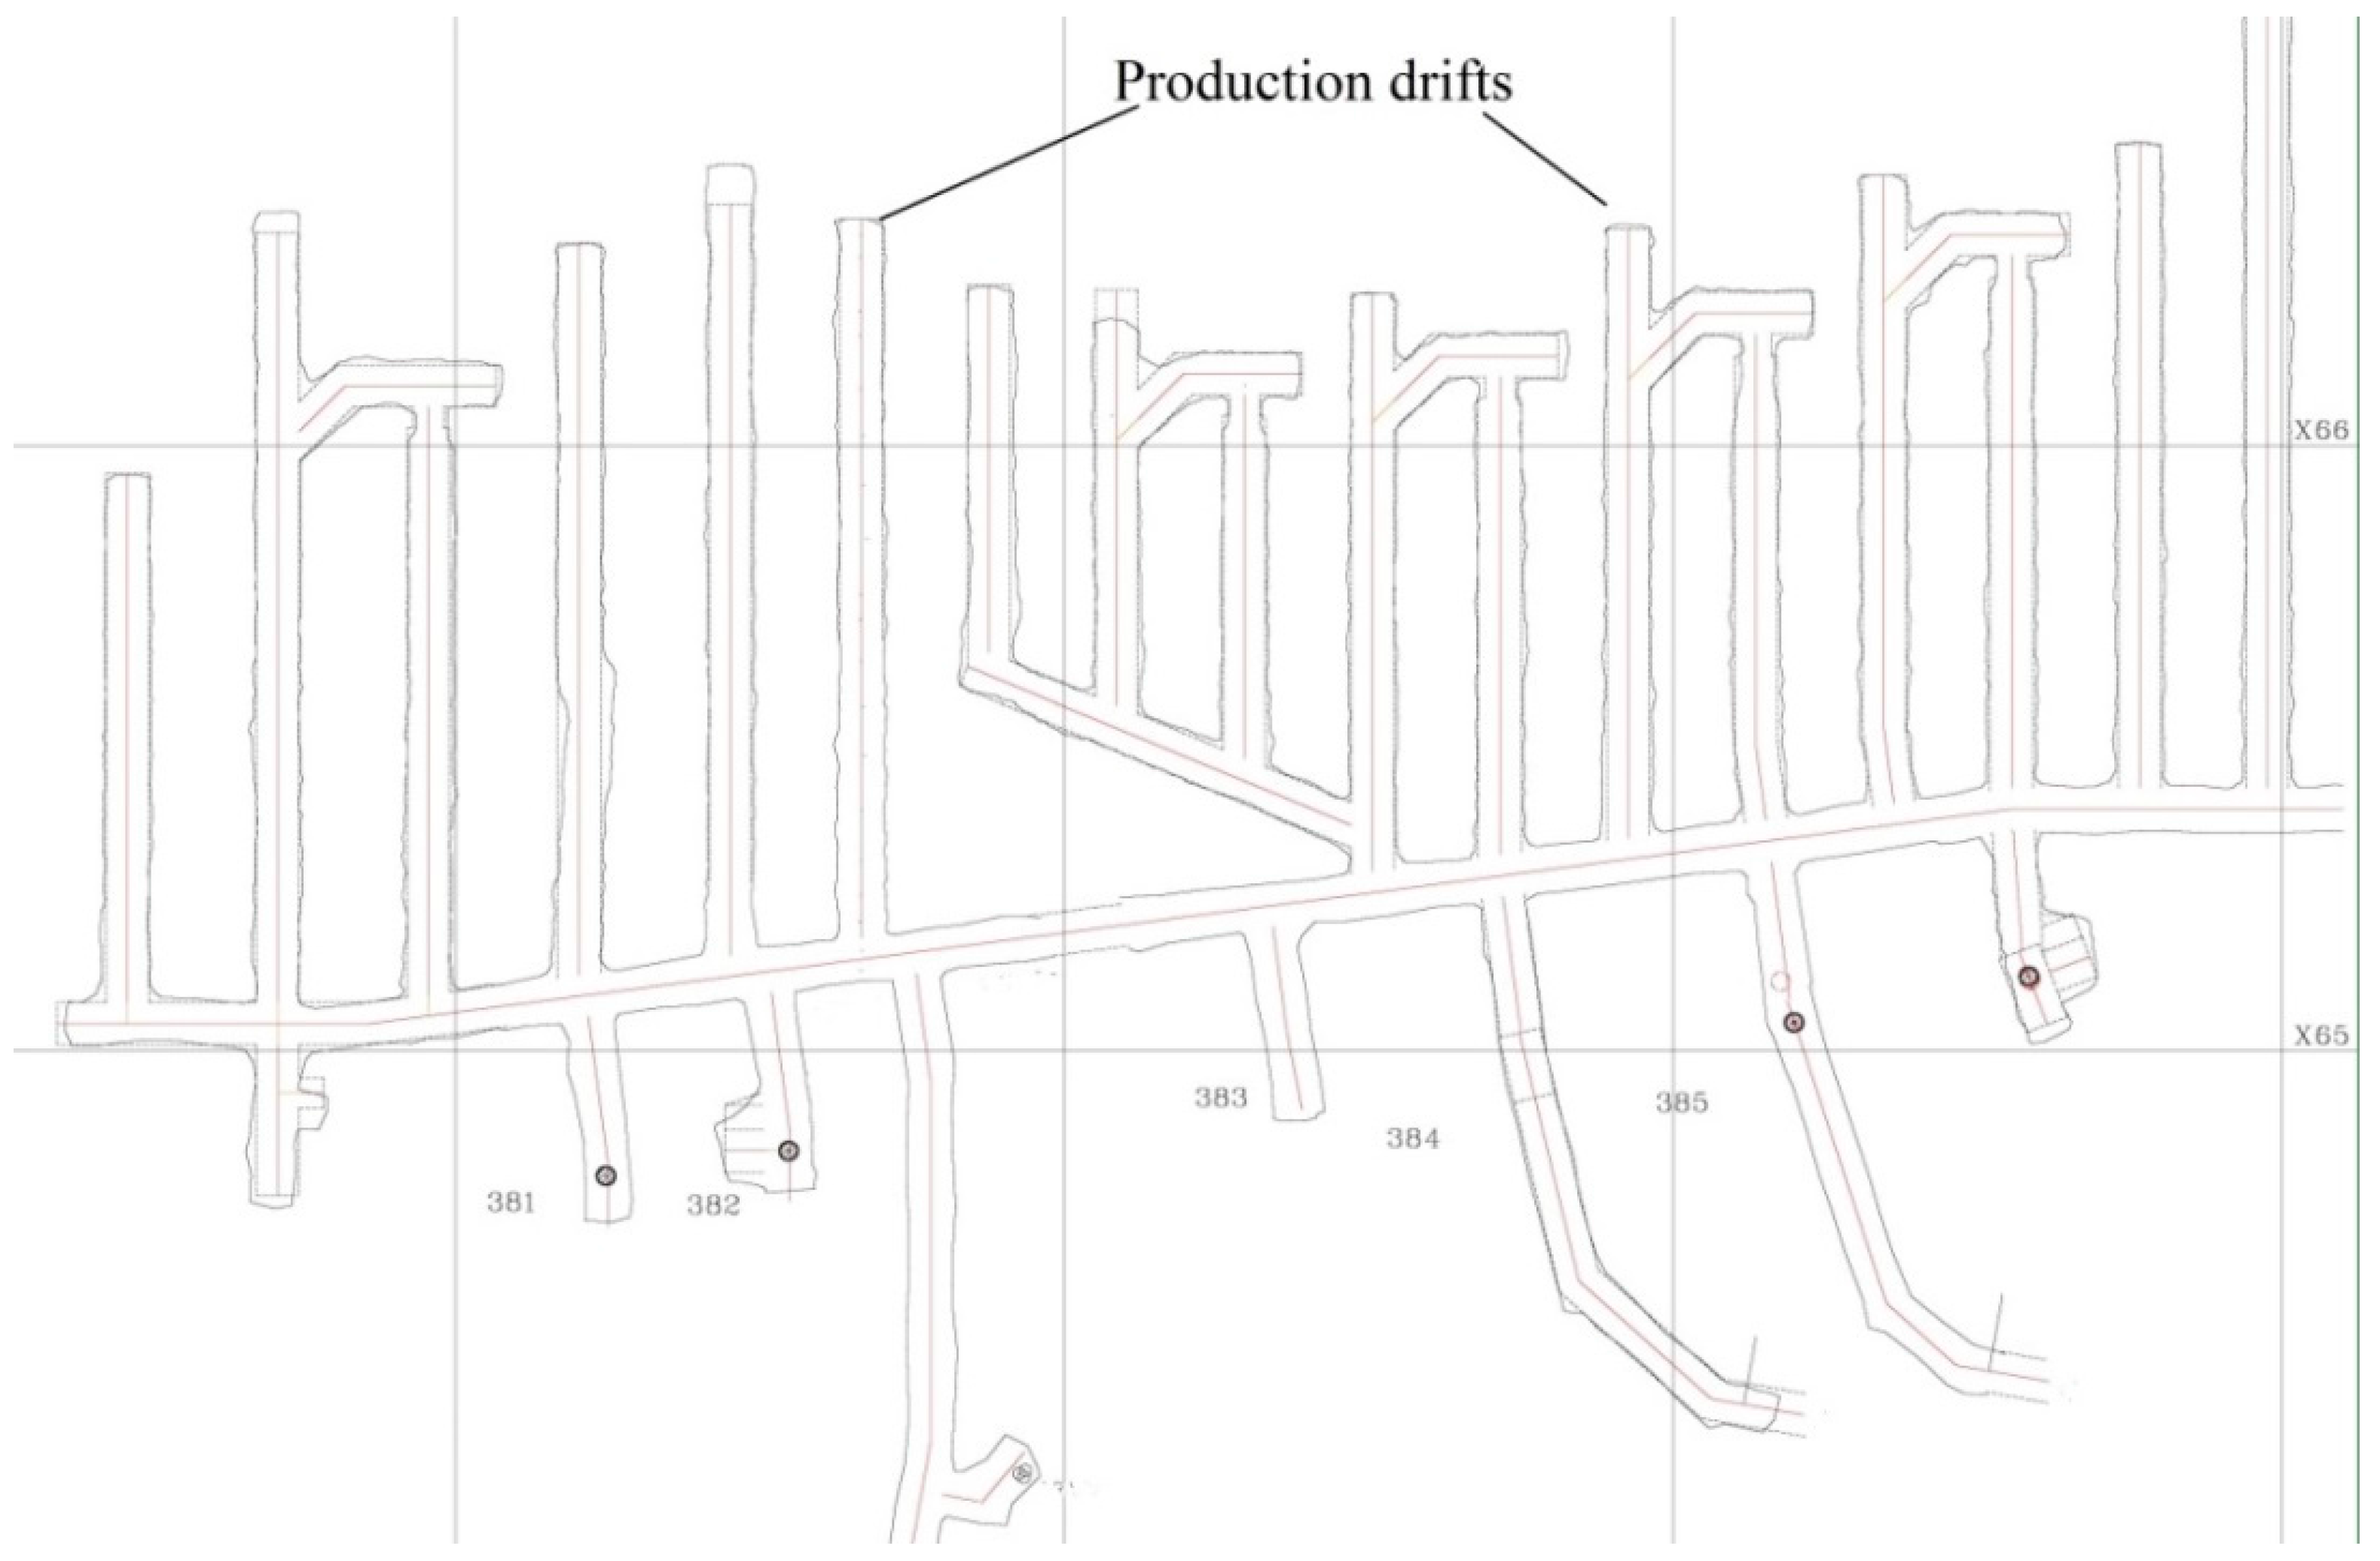
- Two sub-levels (located closest to the next main level at 1685 m) with two production areas in each level was considered. These two levels were selected for modeling since they are the levels located furthest away from the crusher on the previous main level, and hence require the largest number of trucks and the most time spent in queuing. These can be seen in Figure 3 as sub-levels 9 and 10.
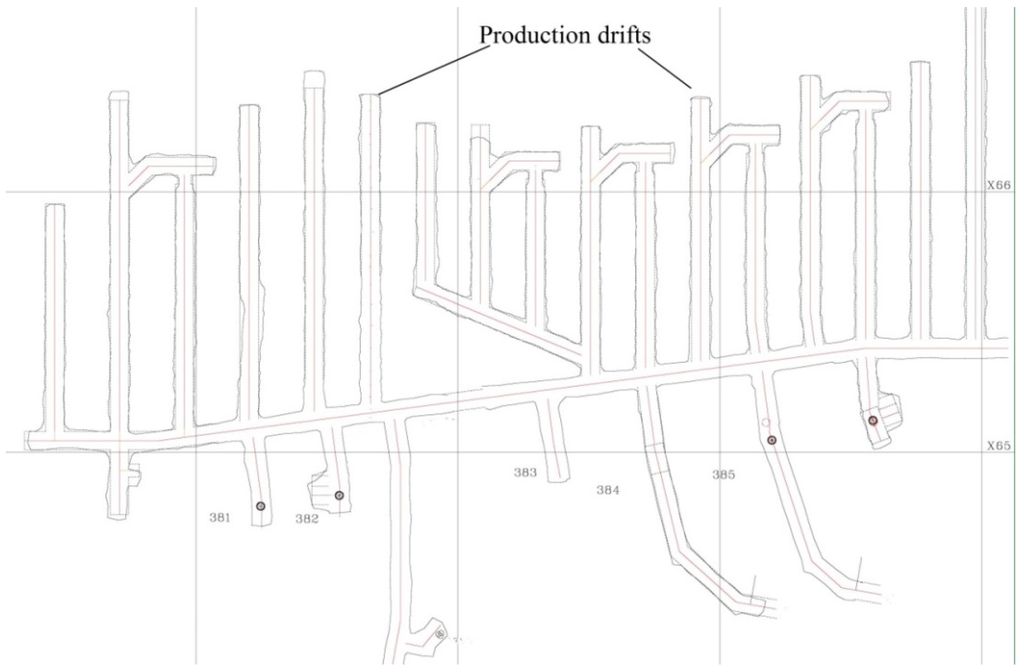 Figure 3. The production area considered in this study.
 - Two other sub-levels (levels 14 and 15) situated below the main level at 1685 m were also simulated. This was done to analyze the effects of further increasing the distance to the existing crusher at the main level of 1365 m.

Figure 2.
The conceptual mine layout.
For the sub-levels above the main level at 1685 m, the modeled production areas (indicated as areas 1, 2, 3, and 4 in Figure 2) were chosen for the purpose of the truck modeling and simulation. Due to mining restrictions, this is the maximum number of production areas that can be used at the same time. Areas 1 and 3 are in the same production level, which for this study is called level 9, while areas 2 and 4 are on the level below, which is here called level 10. We also simulated four production areas (two at each level) for levels 14 and 15. The vertical distance between two production levels is 28.5 m.
Each of the modeled production areas in the simulation consists of 17 productions drifts (see Figure 3), the total expected amount of ore to be mined being 6.17 Mt. According to the mine’s regulations, production at level 10 starts when level 9 is 75 percent completed. This means that 1.54 Mt remains to be hauled from level 9, while 6.17 Mt will be hauled from level 10. There is no sub-level below level 10 to commence production when the lower level is 75 percent complete, so the results that originate from the last 25 percent of level 10 will show less traffic disturbance. The reason is that the next level below it is the new main level at 1685 m.
Haulage is done by trucks from all production areas to a crusher at the main level (1365 m). Trucks are loaded at the loading chamber and use a ramp to transport material to the crusher. The simulation model also includes the time loss when trucks meet to give way to each other, when they meet at intersection points between ramp and crosscuts, and when they meet at the corner points. The model logic applies the rule that when trucks meet, the empty truck gives way to the loaded truck at the nearest waiting zone. The haulage distances from each ramp to the entry point at the main level (1365 m) are 2320, 2610, 4060 and 4350 m for levels 9, 10, 14 and 15 respectively. The length of the main level is 2150 m, measured from the entry of the ramp to the crusher. This makes the total haulage distances traveled by trucks 4470, 4760, 6210 and 6500 m for levels 9, 10, 14 and 15 respectively. The crusher can be fed from two dumping points. During simulation, it was assumed that the crusher would never break down. The simulation was run until the machines in operation finished removing all the available ore from the simulated production areas. All ramps have an inclination of 1:10.
4.6. Scenarios
Seven scenarios were evaluated and analyzed, all aiming at meeting the stated production target of 10,000 t per day per production area (Table 1). Different combinations of machines were used for each scenario. Two sizes of LHDs with capacities of 10 and 21 t and five different sizes of trucks, with capacities of 20, 21, 40, 42 and 63 t were used.

Table 1.
Scenarios.
For all scenarios, both electric and diesel trucks were used, the number of electric LHDs was limited to two at each production area. When two LHDs were employed, each one of them worked on a different side of the production area, meaning that there was no interaction between the LHD machines during production. The LHDs were used to load the trucks at each working area. The rationales behind the selection of the different scenarios are as follows:
- Scenario 1 was selected to analyze the haulage system when two LHDs serve smaller sized trucks (with capacities of 21 t).
- Scenarios 2 and 3 were selected to analyze the effect of traffic and queuing on loading and dumping points for each production area when bigger units (trucks with capacities of 42 and 63 t) are employed.
- Scenarios 4 and 5 were selected to simulate the effects of increases in depth when having to transport the ore from deeper levels (14 and 15) to the existing dump station at the current main level at 1365 m.
- Scenarios 6 and 7 were selected to allow for smaller drift sizes, such that larger trucks cannot fit. Therefore, two electric LHDs, each with a bucket capacity of 10 t, were used to load trucks with box capacities of 20 and 40 t.
In all scenarios, the aim was to determine the number of trucks needed to reach the desired production goals. In scenarios 1 to 5, operations with large drifts/openings (5 m wide) were modeled and analyzed, whereas in scenarios 6 and 7, operations with small drifts/openings (less than 5 m wide) were modeled and analyzed. Note that in scenarios 1 and 4, one bucket is assumed to fill the truck. This would in the real operation create a risk of overloading the truck. Still, these scenarios are presented here since they are used to illustrate what happens when a smaller truck is used.
4.7. Input Data
The cases were analyzed considering variations in the availability of trucks and production areas, and also disturbance from other mining vehicles on their way to and from the production haul areas. The truck availability was assumed to be 90 percent. The production area availability was set at 100 percent for areas with fewer interactions, and 80 percent for areas with several other mining activities. The availability of LHD machines was set at 100 percent for two of the cases, since the LHD was immediately replaced after breakdown with another during the course of production, and 90 percent when down time was considered. Keeping a back-up unit can be a costly strategy especially for a small mining operation. However, for a large mining operation like the one presented in this paper, this is a feasible strategy and therefore used in this study.
According to the data obtained from the mine, the disturbance from other mine vehicles to the trucks was modeled as somewhere between zero percent and two percent. This means that up to two percent of the total available time is lost due to traffic disturbance, and hence the delay for trucks increases when the mine vehicles are driving up or down the ramp and along the main level. The term ‘traffic disturbance’ refers to the percentage of time assumed to be lost when trucks meet in the haul ways (the main drift and the ramp). No traffic disturbance occurs inside production areas because within the production drifts, only LHDs are travelling to transport material from production faces to a hauling point. Input data for the simulation were collected from the mine, and from the equipment manufacturers. Five different cases were studied for each scenario (Table 2).
Table 2.
Input parameters for each case.
The assumed truck parameters (Table 3) used in the simulation are based on data from the mine and from manufacturers. The data for the 21 t truck were obtained from a different mine since the 21 t truck was not used in the studied mine. There is a great variability in the loading time of the hauling units. To determine the proper distribution function, a statistical analysis was performed and a triangular distribution was selected to model the loading times. The size of the production drifts does not accommodate the truck size and therefore, during loading, the trucks wait at the access point that connects the main level and the production drifts. The loading time includes the time taken by the LHDs to travel from the production drifts to the truck loading point. The loaded truck moves up the ramp, which has an incline of 1:10, while the empty truck moves down the ramp decline to the loading points.
Table 3.
Truck parameters.
4.8. Verification and Validation
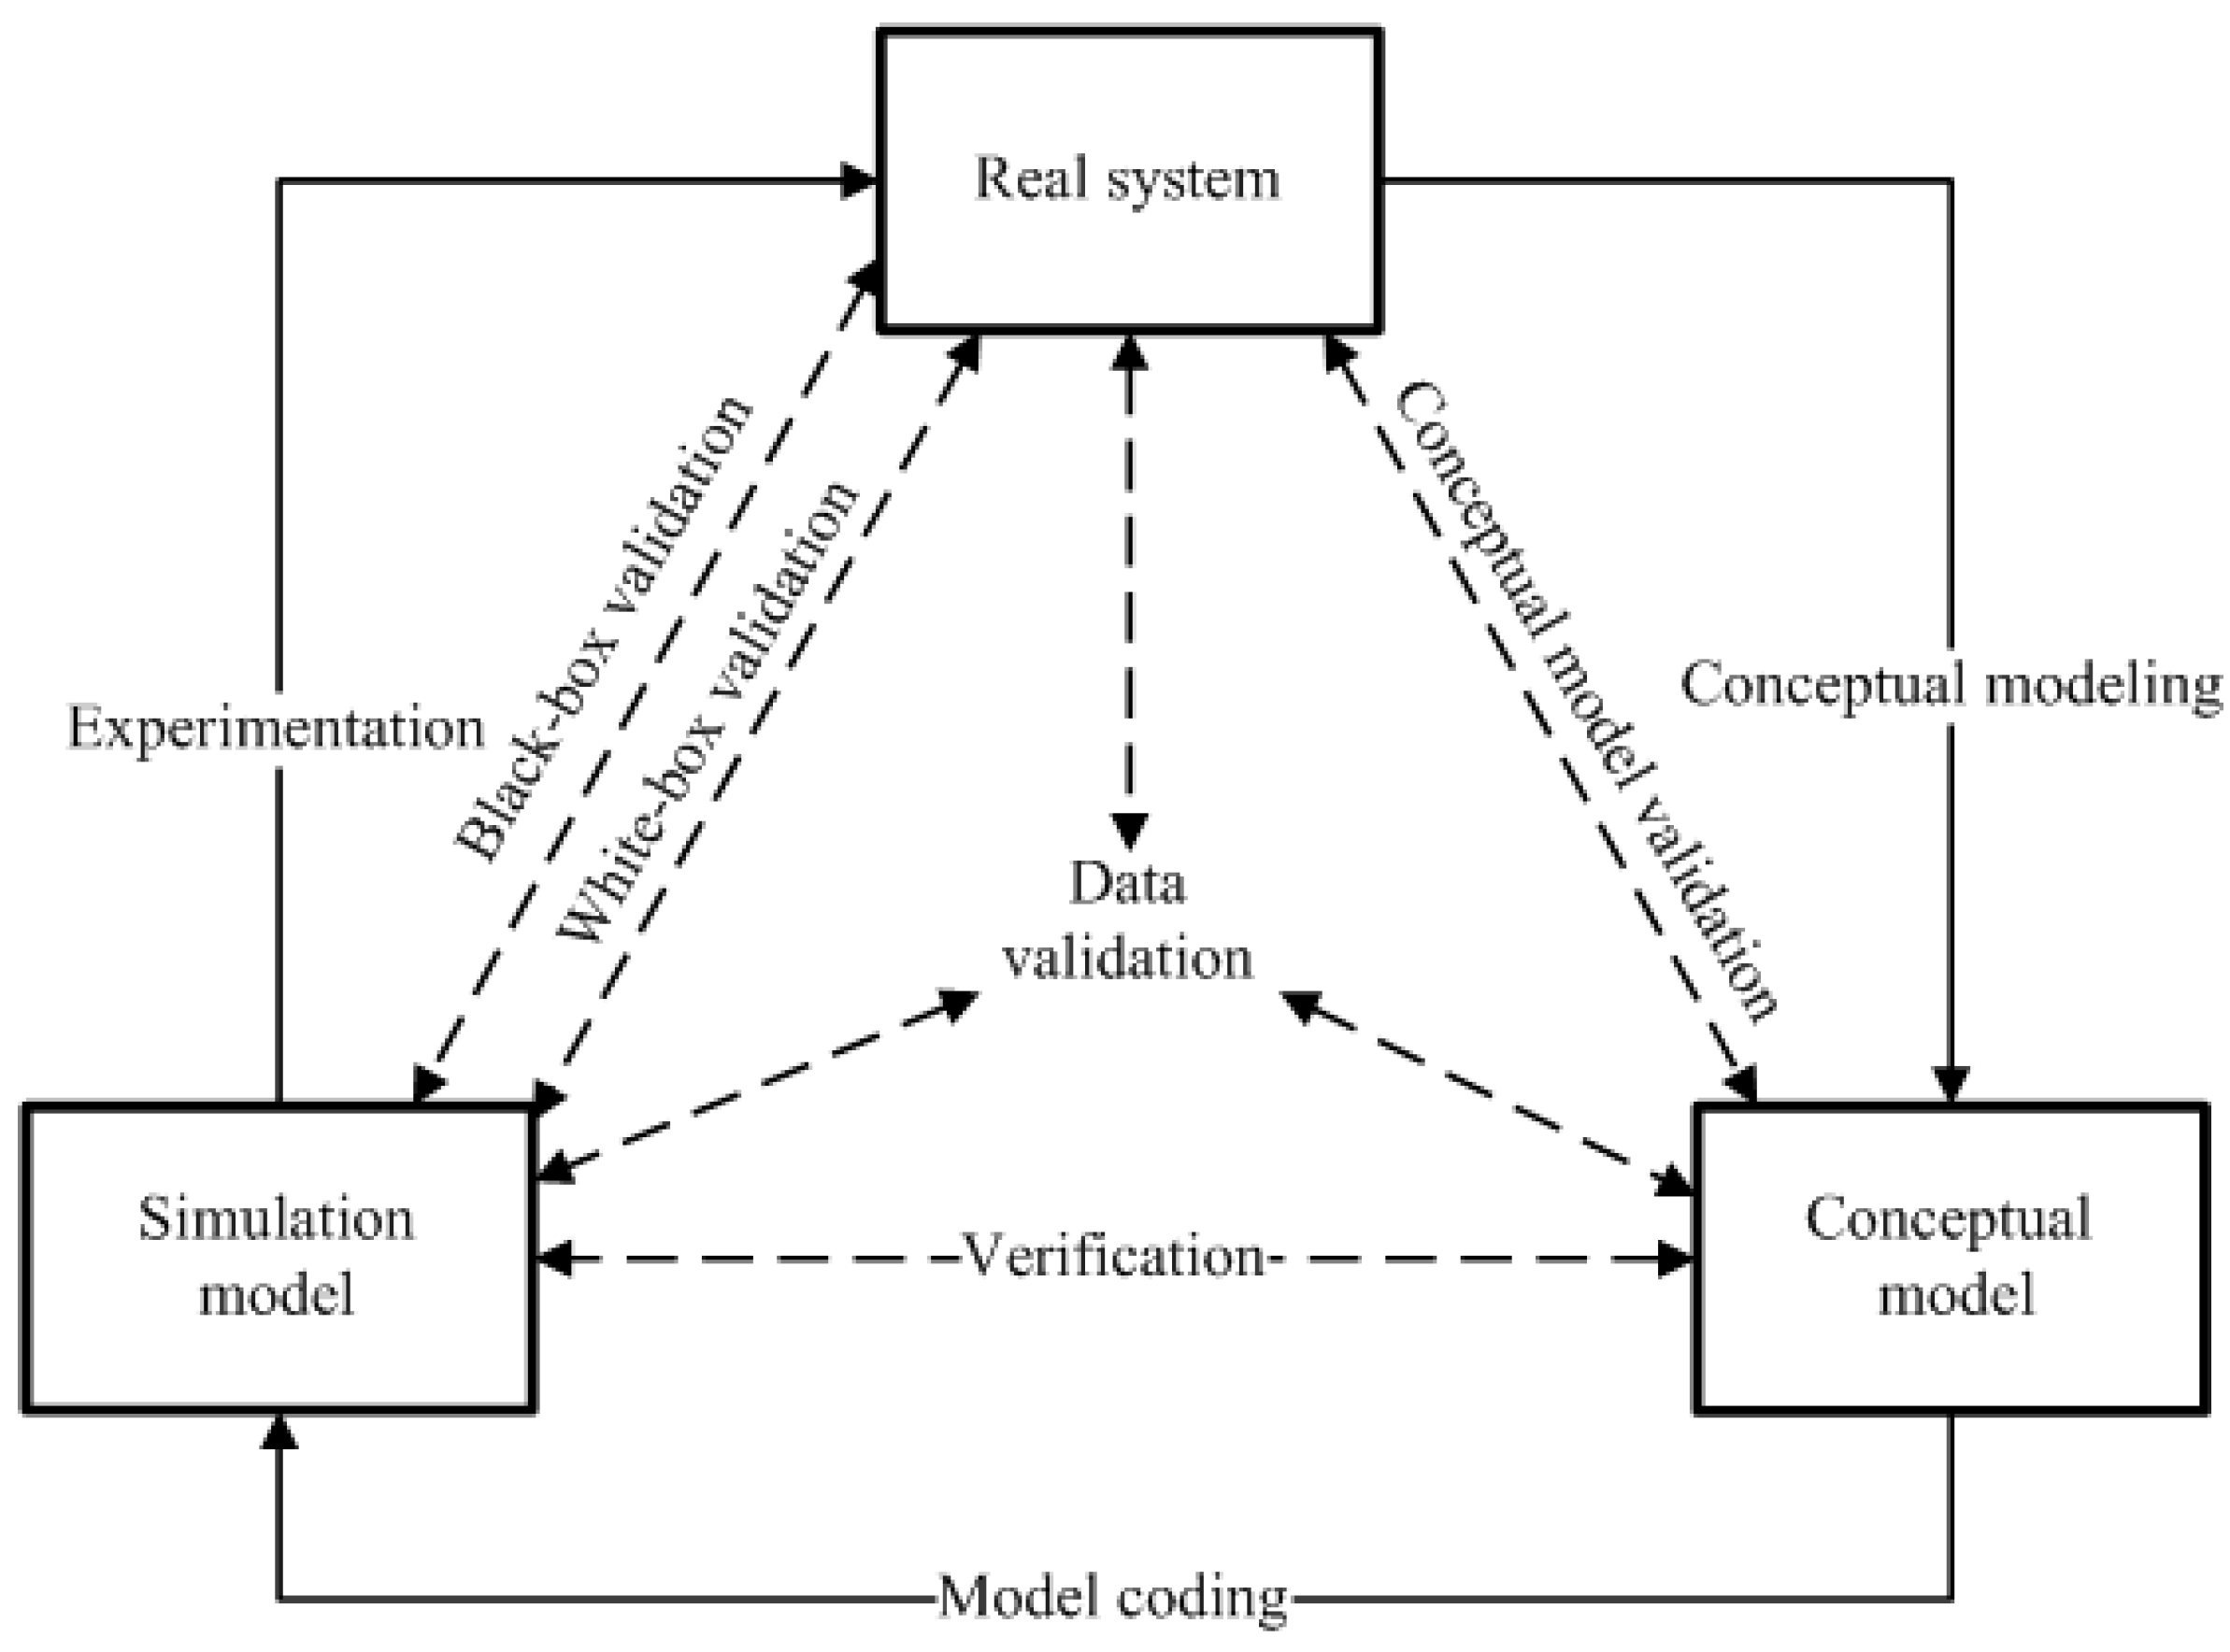
Simulation model verification is the process of ensuring that the model design has been transformed with sufficient accuracy into a computer model [21]. Validation is the process of ensuring that the model is sufficiently accurate for the purpose intended [21]. The stages for verification and validation processes used in this study are based on the one proposed by Robinson [22]. As seen in Figure 4, the stages included in the process are:
- Conceptual model validation. This stage determines if the scope and level of detail of the proposed model are sufficient for the purpose intended, and that the assumptions are correct.
- Data validation. This stage determines that the data used for building the model, for validation and for experimentation, are accurate.
- White box validation. This stage determines that the components of the computer model accurately represent the corresponding real world elements.
- Black box validation. This stage determines that the overall model represents the real world with sufficient accuracy.

Figure 4.
Verification and validation in the modeling process (modified from source [22]).
The model is considered “valid” when the assumptions underlying the conceptual model are correct, and when it has been determined that the model represents the real system [15,21,23].
The data validation was performed according to the steps described below:
- Production data from the operating mine together with machine specifications were used to derive and calculate output parameters of interest. The data used were actual t/h, shift schedule, equipment availability. The calculations resulted in specific values for number of working hours required to load the ore from a production area, number of required days required to load the ore from a production area and number of hours the equipment were unavailable.
- The next step was to run a simulation using the same input data and boundary conditions as for the calculations in step 1. The simulation model uses more detailed equipment data (speed, time to load, time to dump, as presented in Table 3) based on the mine operating data and data from the manufacturer.
- The results from the simulation were then compared with the results from the calculation in step 1, ensuring that the simulation model gave similar output results.
A mathematical analysis was also done when calculating and verifying the theoretical cycle time for trucks (drive to the dump location, dump, and drive back again), to verify the upper limit of the trucks.
Black box validation was then carried out by comparing the output from the simulation model with the output from the real system. This was done by comparing the actual hourly production of the mine with the simulation output for one mine block (shown in Figure 3). The average actual hourly production for this block is 4147 t/h with the 21 t loader. The output from the simulation model resulted in an hourly production of 41,474 t/h with the 21 t loader, which validated the model and proved that it behaved like the real system.
White box validation was carried out by using debugging techniques, animations, model inspections by specialists, and by running the model under varying conditions.
5. Results and Discussion
The simulation was run based on mining in the 9th, 10th, 14th, and 15th levels in the mine (see Figure 2). At each level, trucks were used to transport the material from loading areas to the crusher, which is located at the current main level at 1365 m. Each level consists of two production areas. Two electric LHDs, with bucket capacities of 21 and 10 t, were used to load the trucks at each production area. The 21 t LHDs were used to provide in the case of the large openings, while 10 t LHDs were used for smaller openings. The aim of the simulation was to determine the number of trucks needed to meet the production target of 10,000 t when the ore pass system is not used.
5.1. Trucks Needed
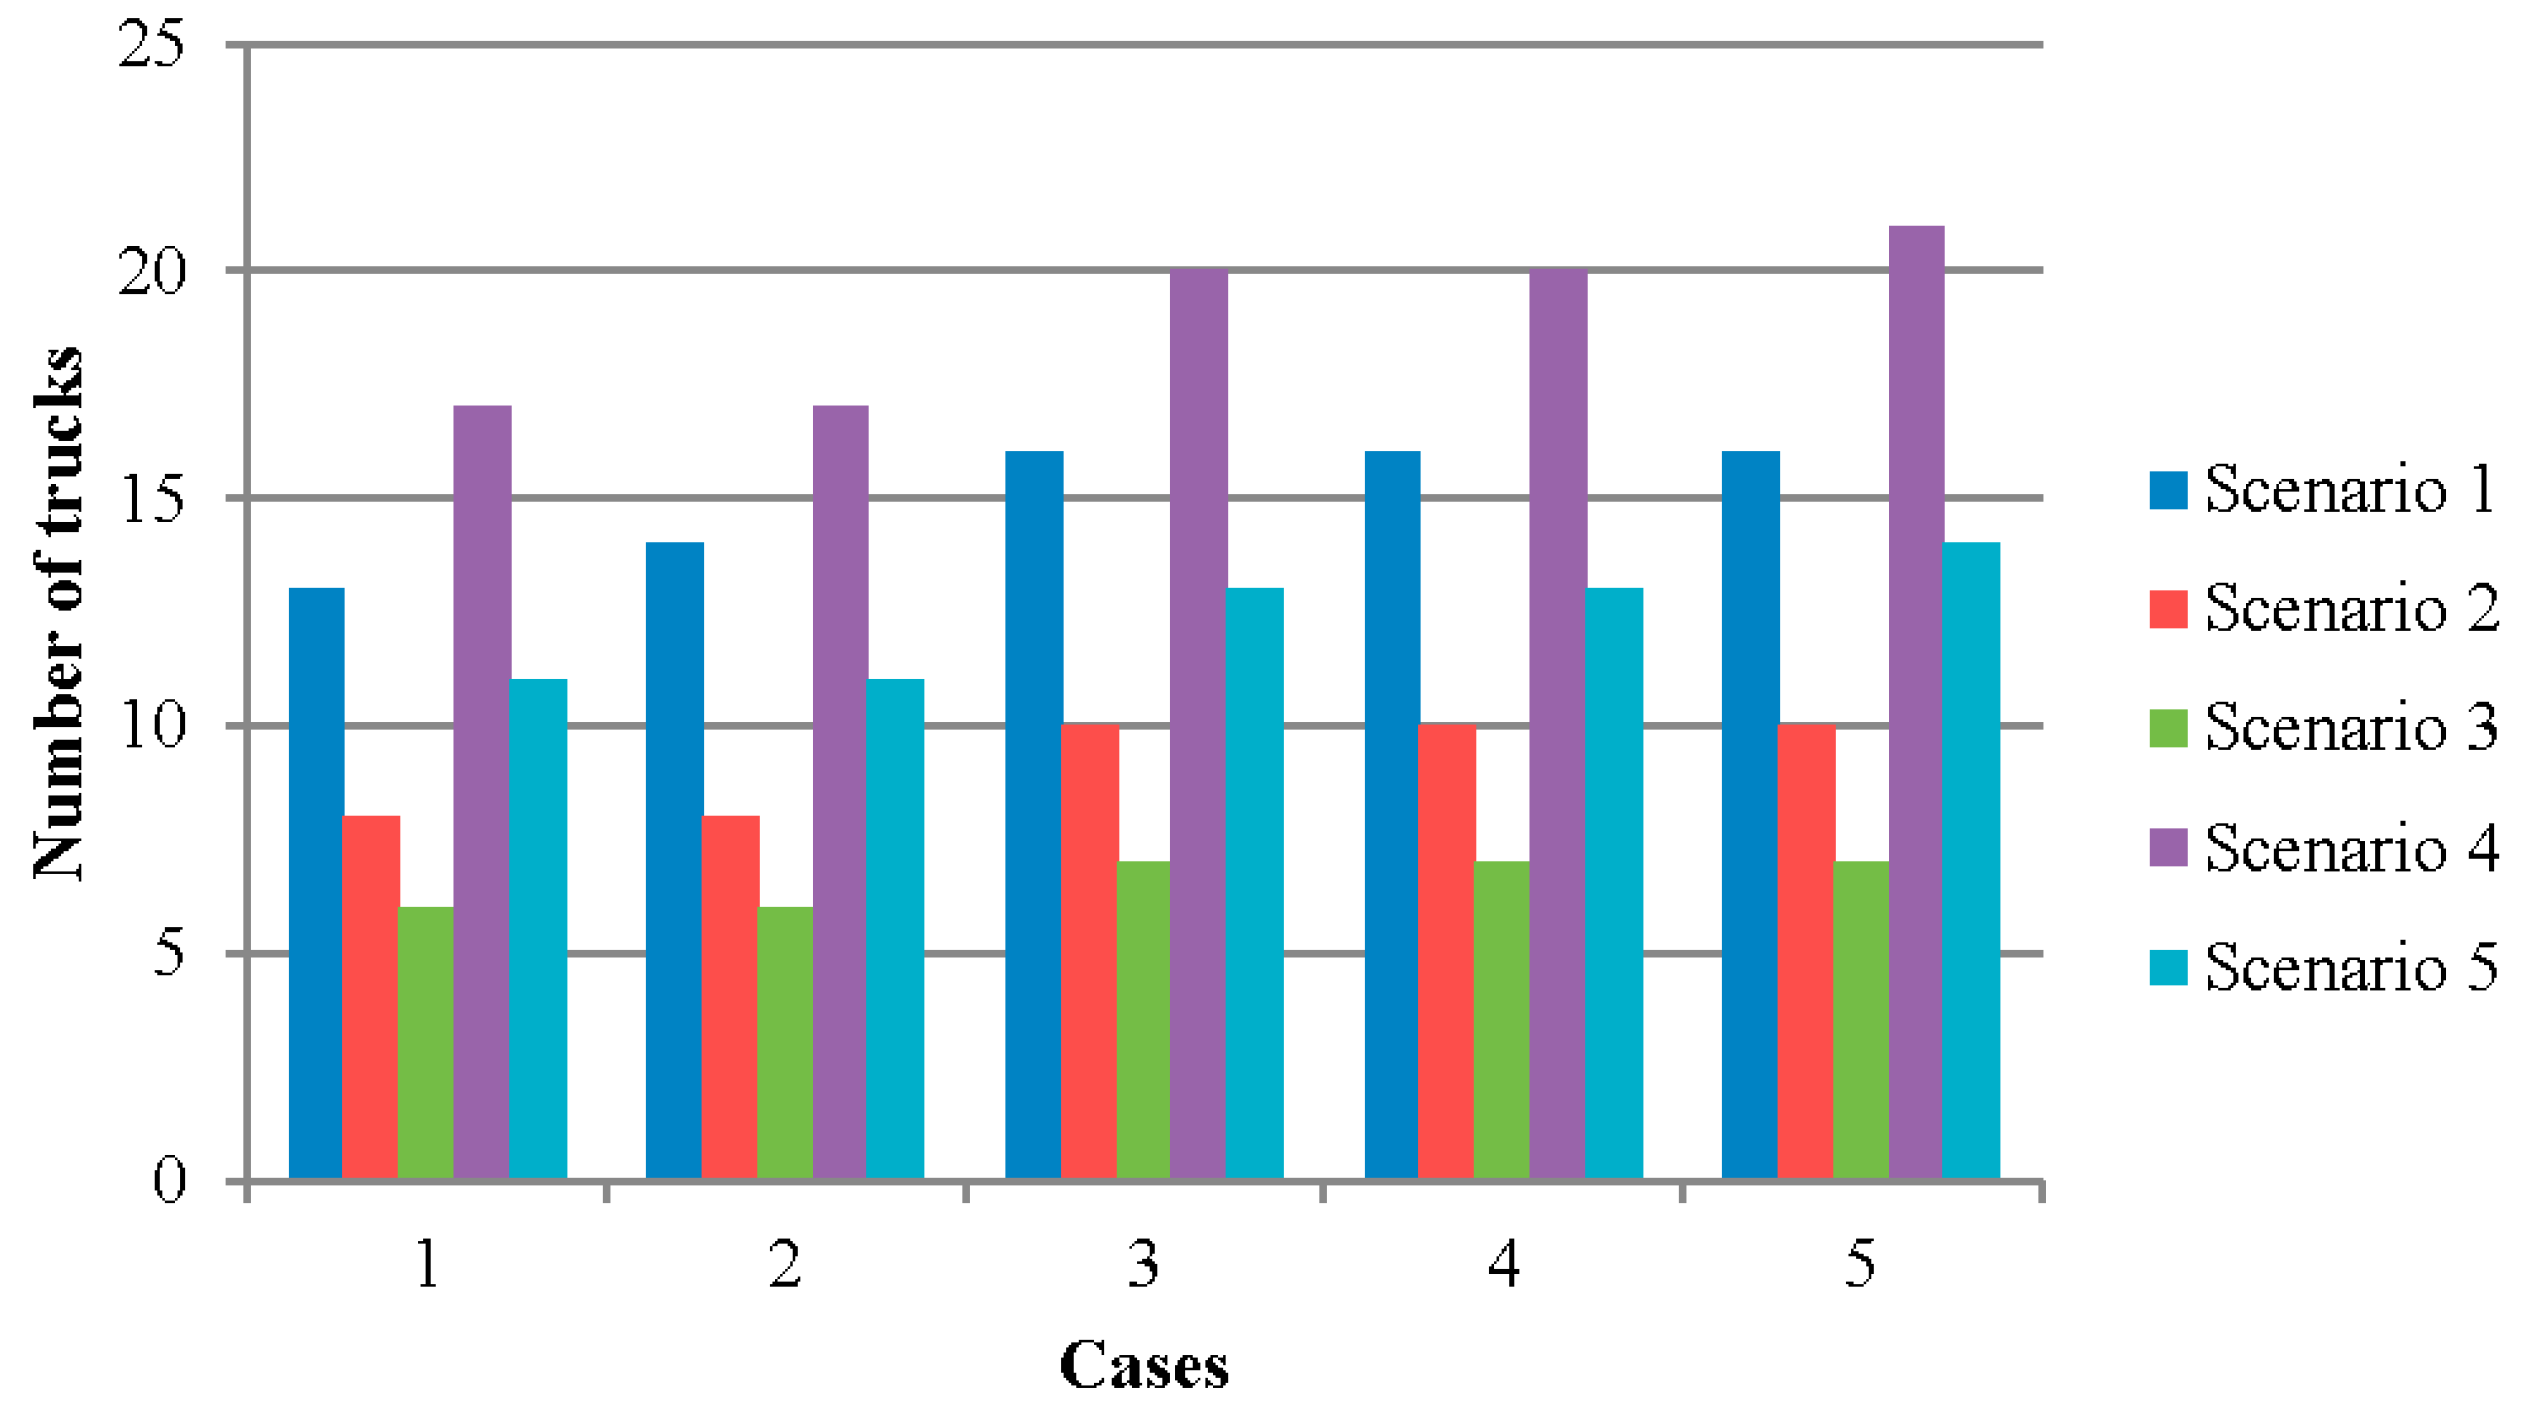
The simulation was first conducted for the case of 21 t LHDs loading 21 t trucks (scenario 1). After the first simulation, the model was adjusted, and the other scenarios shown in Table 1 were simulated. The results for scenario 1 show that, when using smaller sized LHDs to load onto smaller sized trucks, between 13 and 16 trucks are needed, depending on the case being analyzed (see Figure 5). In case one, fewer trucks (13) are required to meet the target compared with the other cases. This is because, for this case, we assumed that LHDs were immediately replaced with another after breakdown during production, and we also assumed that there could be no disturbances from other mine operations in the production area or with other mine vehicles on the ramp.

Figure 5.
Truck requirements for large openings.
The results for scenarios 2 and 3 show that, when larger trucks are used, fewer machines (between eight and ten for scenario 2, and between six and seven for scenario 3) are required to achieve the production goal. For these scenarios, the truck sizes used were 42 and 63 t, respectively. The reason for requiring fewer trucks is that, although the bigger trucks have a slightly slower speed, over the same time period they dump more material than smaller sized trucks.
The results for scenarios 4 and 5 show that more trucks are needed when mining deeper: between 17 and 21 trucks for scenario 4, and between 11 and 14 trucks for scenario 5. The reason for this is that, under these scenarios, trucks have longer cycle times since they have a longer distance to travel to the dump station (6210 m for level 14 and 6500 m for level 15). Compared with scenarios 1 and 2, more trucks were required to achieve the daily production under scenarios 4 and 5, despite the fact that the compared scenarios use the same truck sizes. Cases 3 and 4 result in similar number of trucks for all scenarios despite the difference in truck and loader sizes. This is because for these cases, area availability was reduced to 80%, which leads to more idle time for loading and haul units.
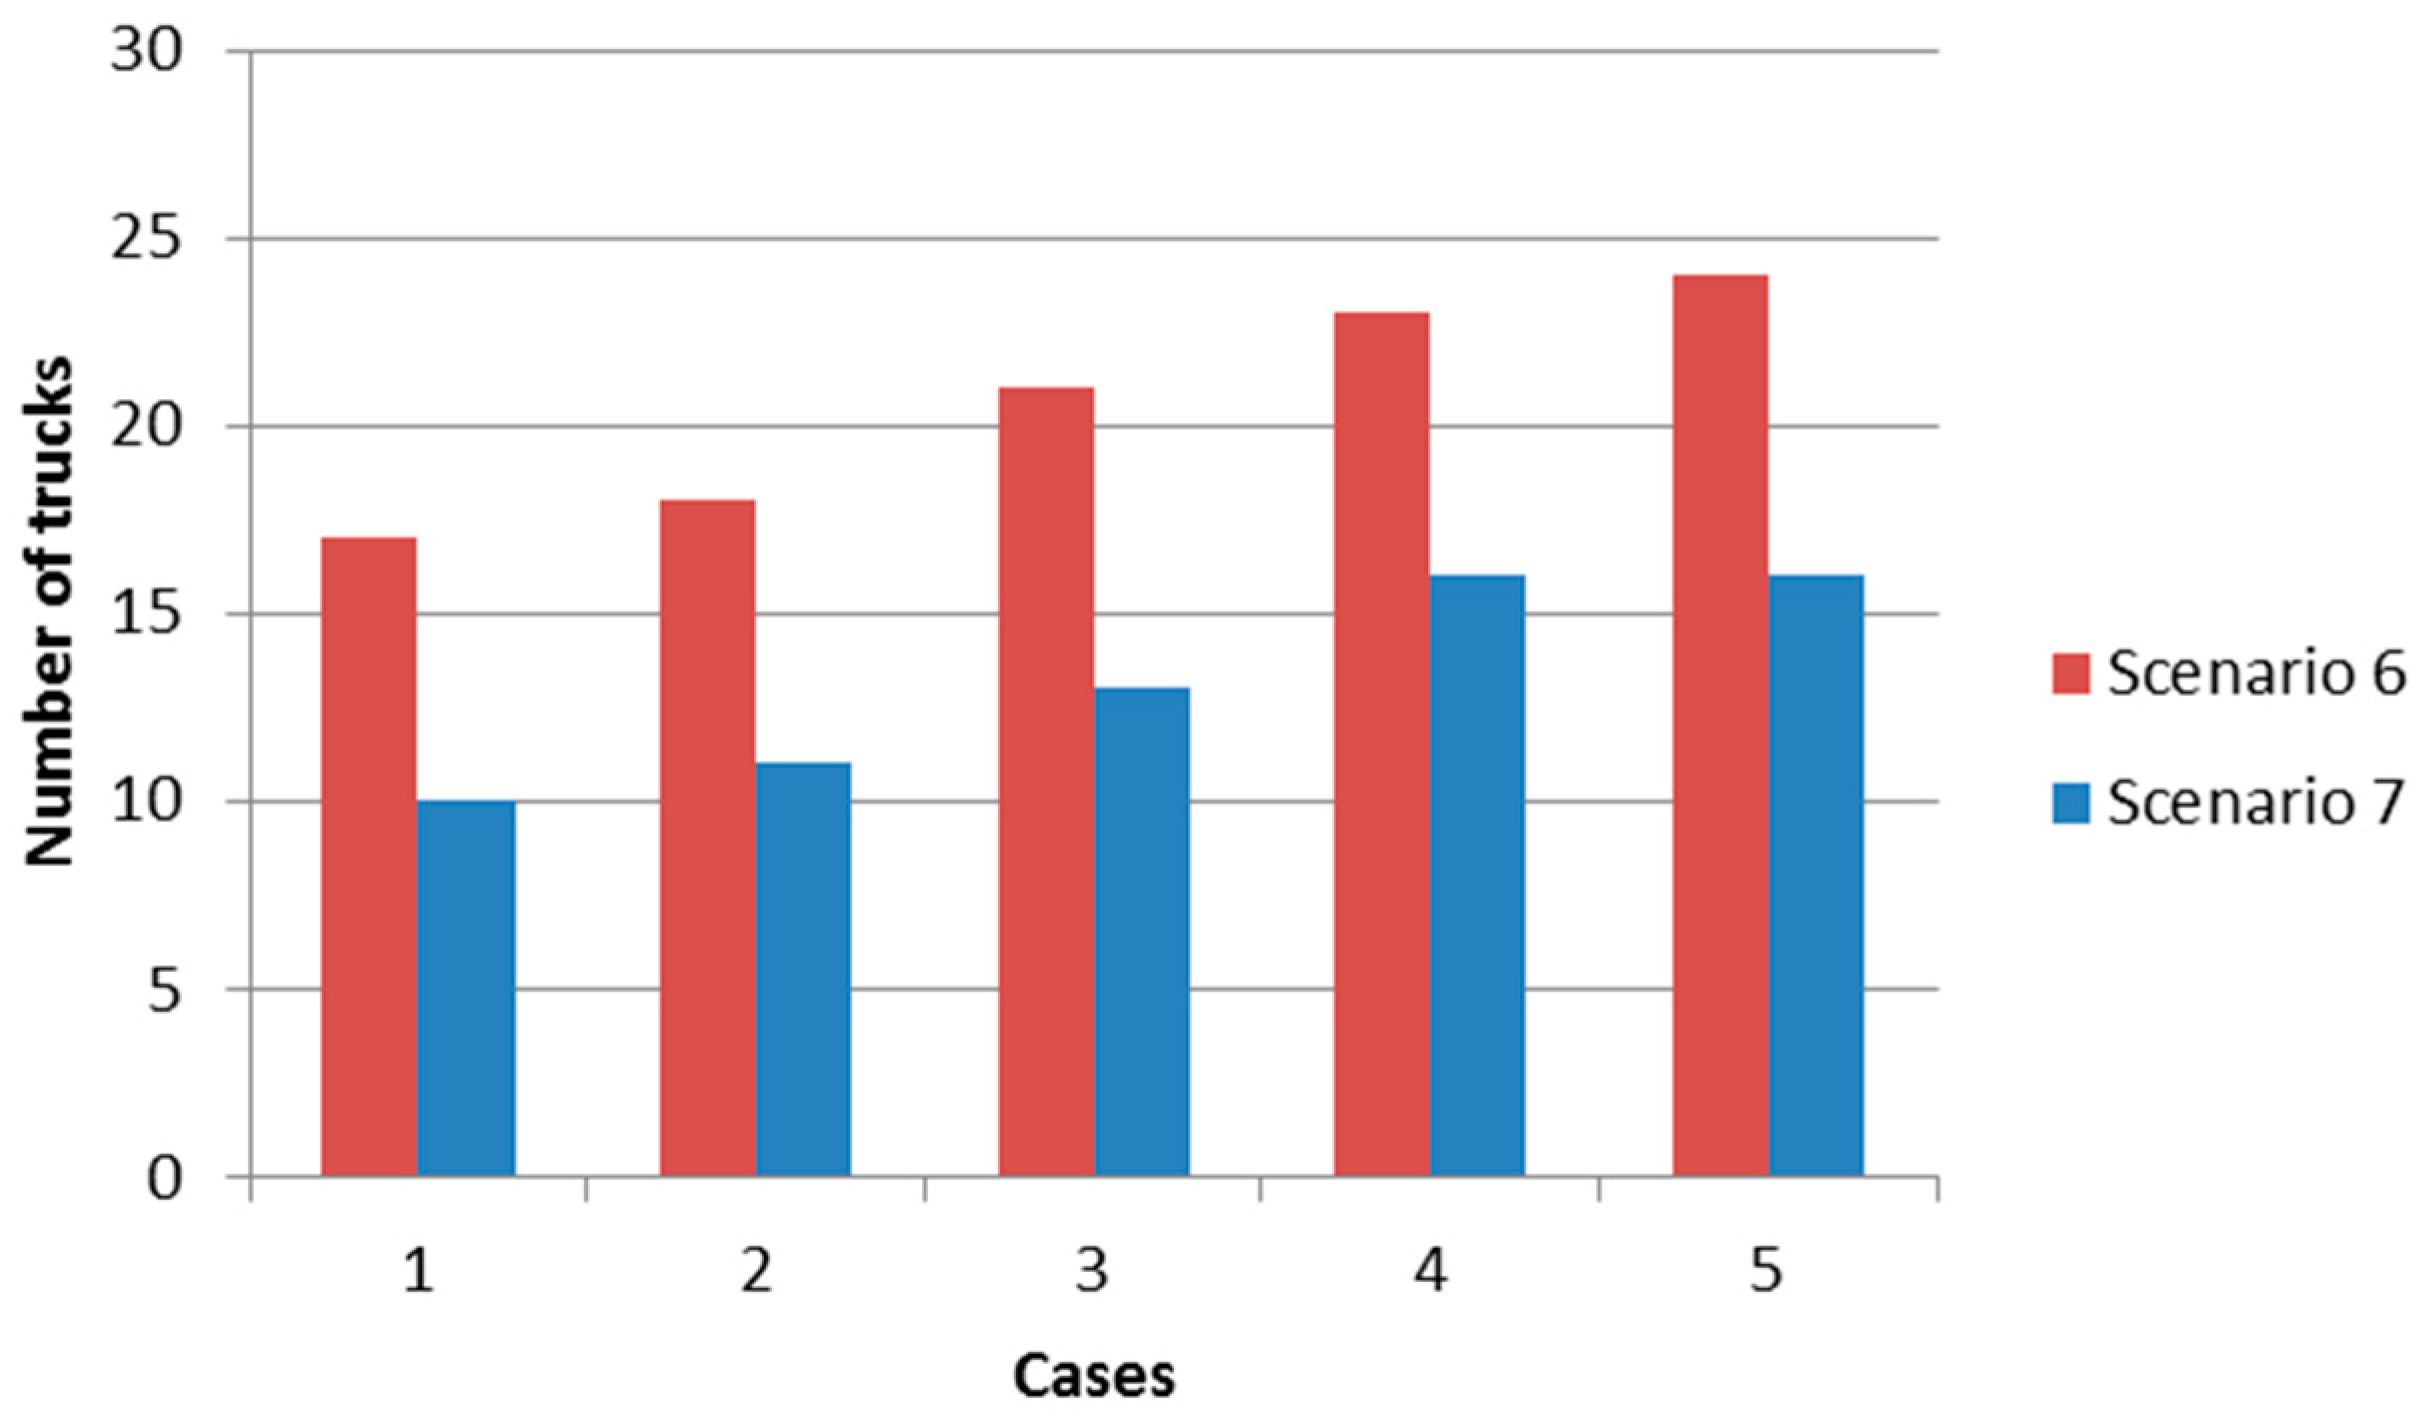
The results for scenarios 6 and 7 are shown in Figure 6. In these scenarios, electric LHDs with a capacity of 10 t were used to load the trucks with capacities of 20 and 40 t. It shows that a higher number of 20 t trucks were needed (between 17 and 24) compared with 40 t trucks (between 10 and 16).
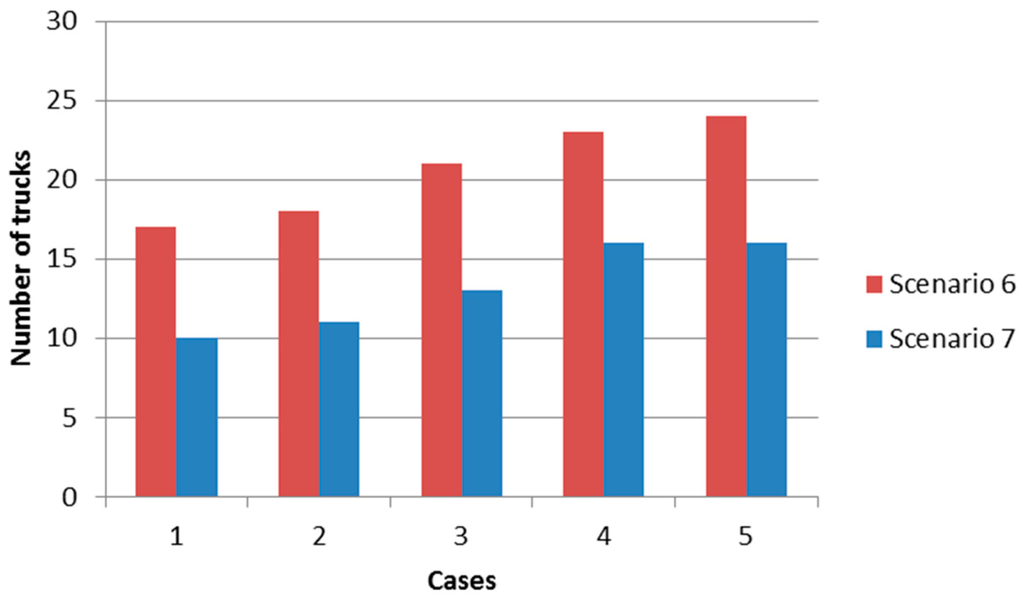
Figure 6.
Truck requirements for small openings.
For example, in scenario 6, case 5, more than 20 trucks were required to attain the production target due to presence of higher traffic disturbance when a large number of trucks are in operation. For scenario 7, although case 5 also allows for two percent of time loss due to traffic, fewer trucks were needed to meet the target. The reason for this is that, when production goes ahead in this case, no trucks are available for production in other areas. This, therefore, reduces the congestion of trucks on the ramp.
Comparing all the scenarios, the one requiring the fewest trucks to achieve the daily production target was scenario 3. This is because trucks with the highest capacity were used for this scenario. For cases 3, 4 and 5, since the area availability is lower, a large number of trucks is needed to meet the daily production target. Furthermore, based on the results from scenarios 4 and 5, it can be shown that, the deeper the mine gets, the more trucks are needed.
5.2. Truck Traffic on the Ramps
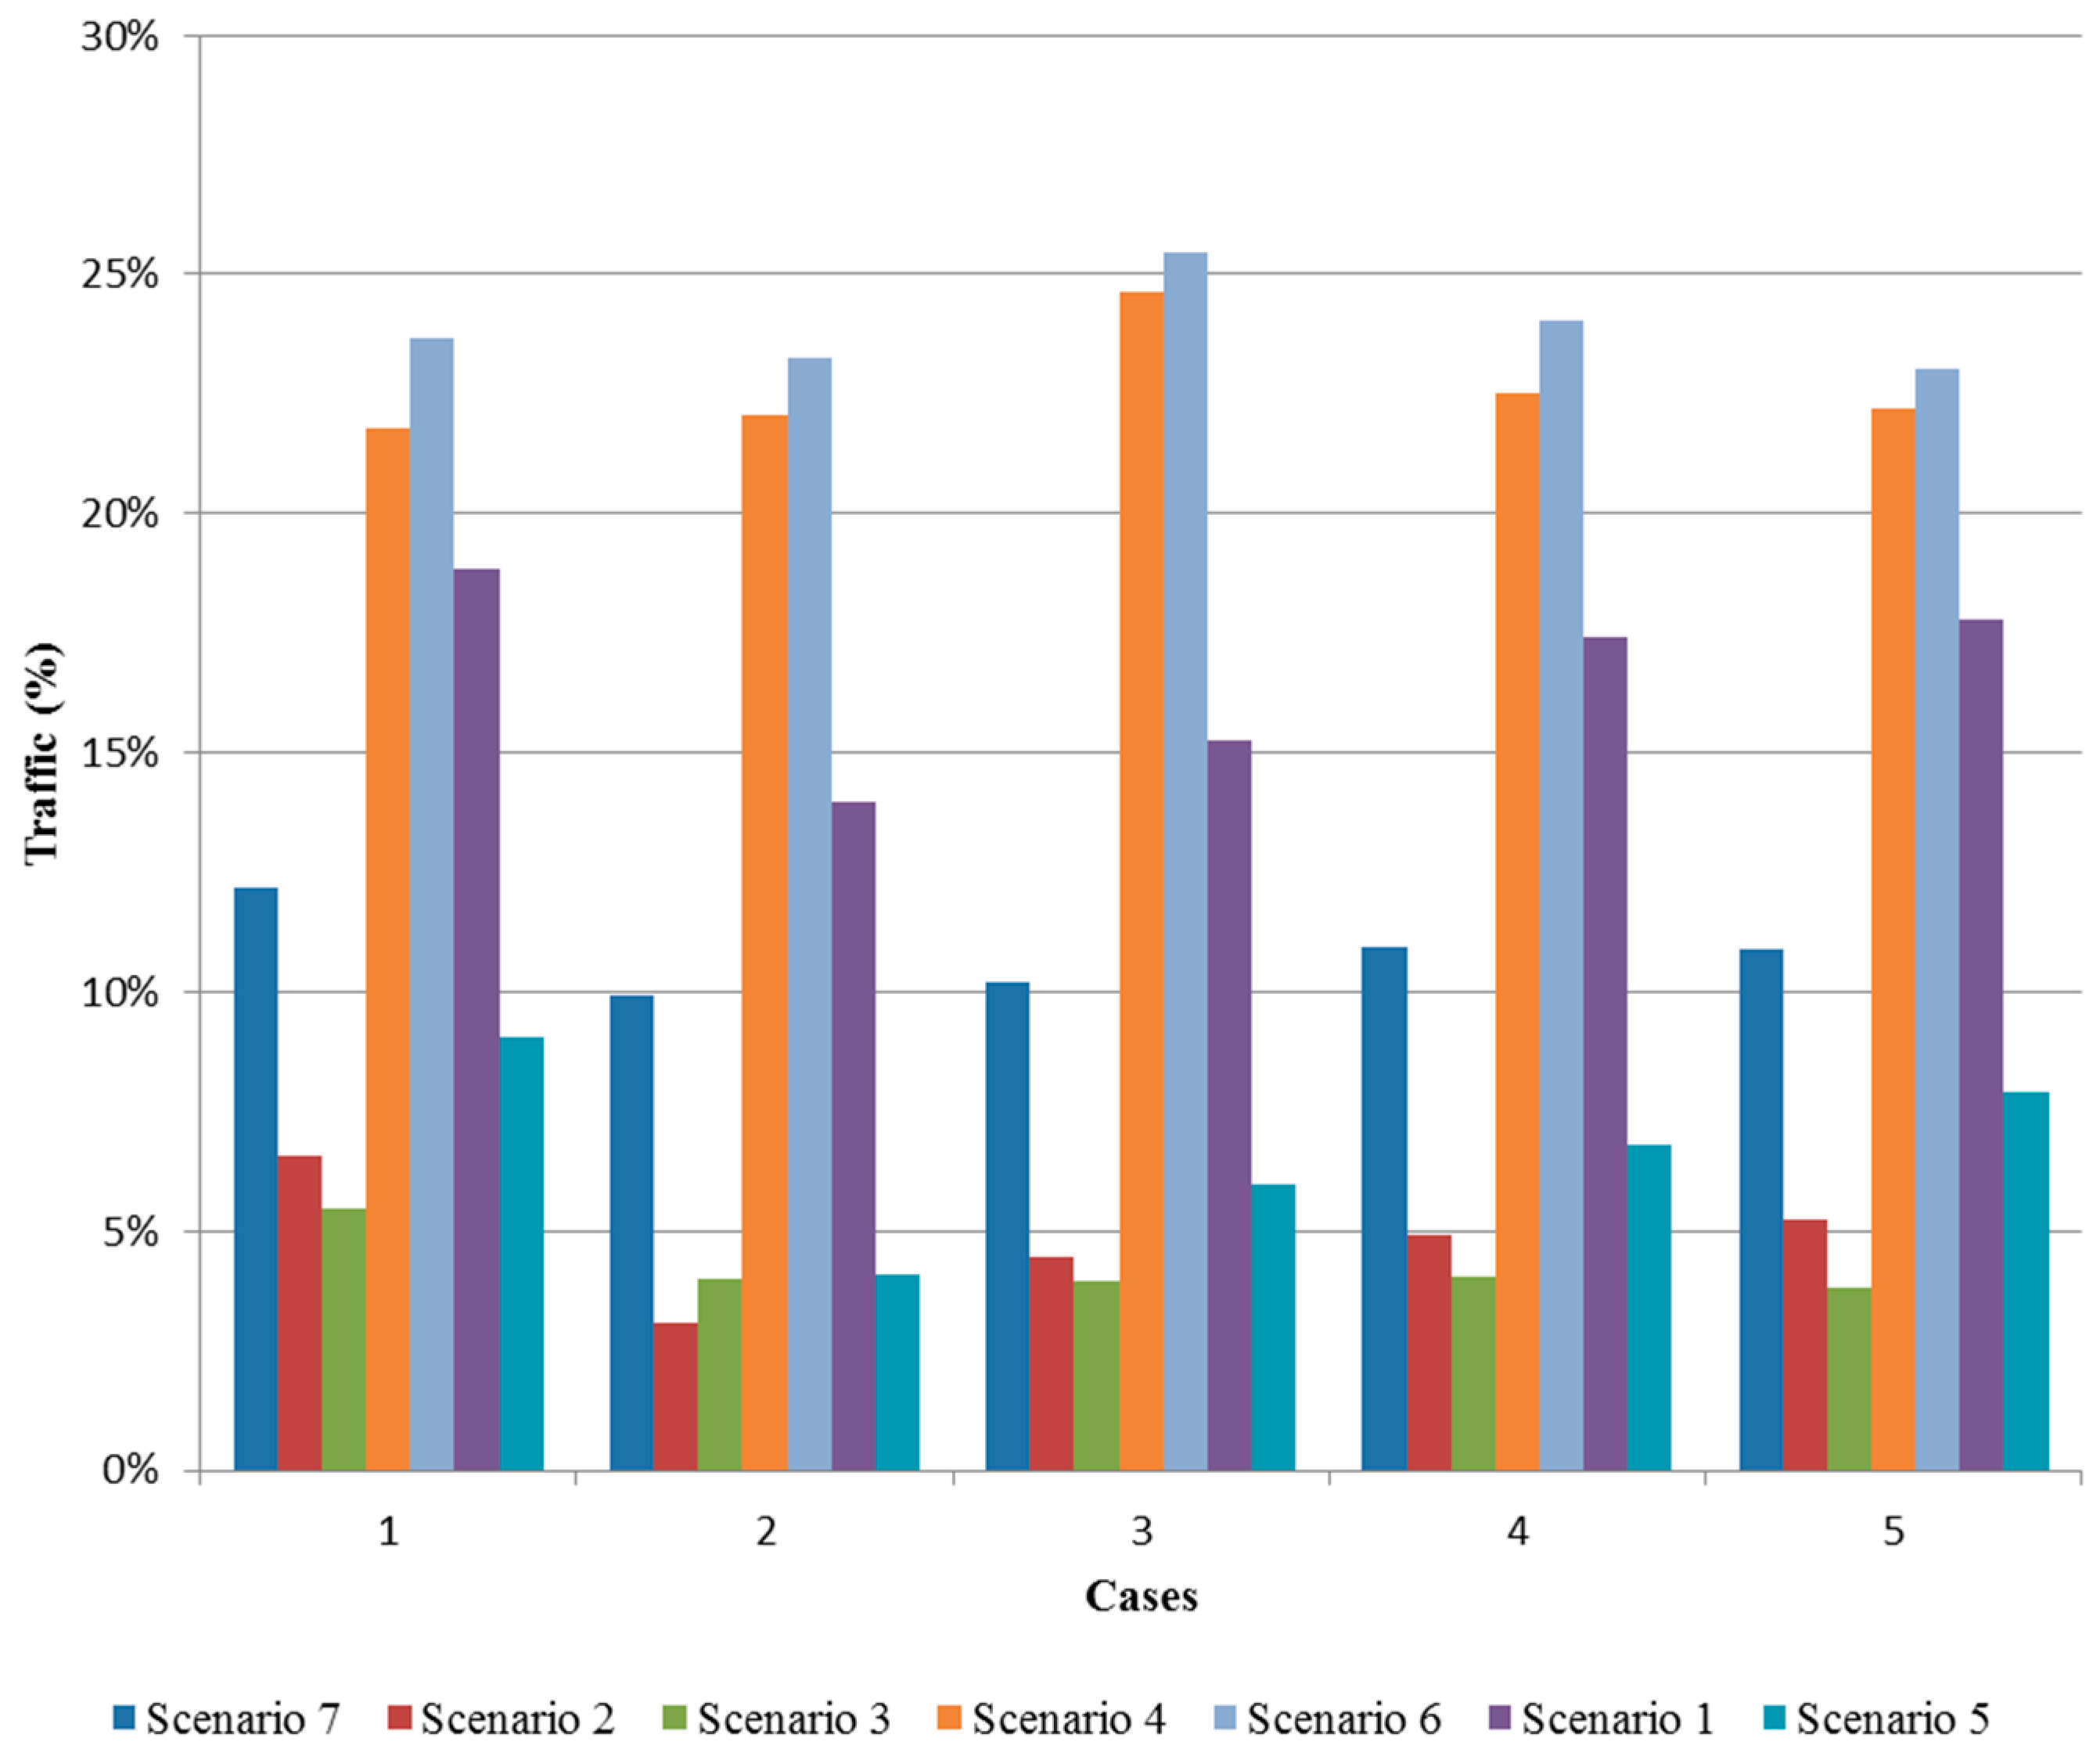
During simulation, the different haulage options were evaluated by determining the truck traffic at each production area depending on which level the trucks were working. The term traffic refers to the percentage of time lost when trucks meet in the haul ways (the main drift and the ramp). When trucks meet at the intersection points between ramp and crosscuts, or at the corner points, the empty truck gives way to the loaded truck at the nearest wait zone. As seen in Figure 7 for levels 9 and 10 (scenarios 1, 2, 3, 6 and 7), the average time loss due to queuing and waiting for trucks on the ramps is 8.17 percent. Scenario 6 generates higher truck traffic on the ramps due to the depth of levels 9 and 10, and also due to the large number of trucks in operation compared with other scenarios. The third scenario generates less traffic on the ramps since it requires the fewest trucks to meet the required production target. The average transportation time rose to over 23 percent of the total working time when the smaller sized LHDs were used to load the trucks (levels 9 and 10).

Figure 7.
Truck traffic for all scenarios.
Since more trucks are needed at levels 14 and 15 due to increased depth, the truck traffic on the ramps increases, and hence results in increased idle time for each truck due to queuing problems. This shows that, when deeper levels are in operation, a lot of time is lost due to queuing and waiting time for trucks on the ramps.
An analysis of the results indicates that the most favorable option for large openings is the haulage system using trucks with a capacity of 63 t. The results also show that the favored option for smaller openings is to use trucks with a capacity of 20 t. To achieve the planned production target of 10,000 t per day from each mine block, the option with large openings requires about seven trucks to be in operation, whereas more than 20 trucks would be required for smaller openings. This shows that, for smaller production drifts, hauling using trucks will not be an economical option in order to attain the target of 10,000 t per day.
Diesel truck haulage systems are highly flexible in terms of travel routes and fleet size, and present no electrical hazards. However, the use of a large number of trucks underground increases the risks from flammable fuel, results in higher heat emissions and noise levels, and emits toxic gases into the mine environment. This results in higher costs because of the additional energy needed for longer haul distances, and the need for additional ventilation to mitigate geothermal heat and exhaust gas emissions.
Based on the ratio of emissions and the amount of fuel used, the diesel machines emit 2.68 kg of CO2 gas for every liter of diesel fuel used [24]. The need for ventilation to mitigate engine heat and emissions will be higher, and this will lead to increased operating costs. One of the possible alternatives when using smaller trucks is to develop two ramps: one ramp will be used by loaded trucks (incline) and the other by empty trucks (decline).
For large openings, the analysis shows that seven trucks can be employed to attain the planned production target. More than seven trucks will increase traffic congestion, result in longer idle times, higher operating costs, and lower the production rate.
Due to increased depth, and hence increased rock stresses, problems with ore passes failure are expected, which will lead to further delays in material transportation. In sub-level caving, when ore passes and trains are used to transport the ore to a crusher, ore pass management is necessary in order to avoid interruptions to material flow. When the costs of managing the ore passes become too high, or when ore passes cannot be used for production, haul trucks can be employed as an alternative method to transport ore and waste up the ramps to the existing crusher located at the previous main level. If truck haulage is adopted, a crusher and a rail-mounted track system at the lower main level will no longer be required, and there will be no need to extend a shaft from the previous levels. This will reduce the reinvestment costs for the new main level infrastructures.
5.3. General Discussion of the Results and Method
The choice of using simulation to solve problems is sometimes disputable and in many cases analysis using simulation is too complex and time consuming given the nature of the study. For this specific study, using simulation was the preferred option, and the results presented above could not have been generated with the same accuracy through manual calculations alone. Analyses of the given problem include more input information than could be handled by manual calculation and still generate results with the same degree of detail and accuracy as possible with a simulator. In the simulations concerning level 9 and 10, the output results also showed important information on how the traffic disturbances affected the overall performance and the variance in total time each truck was working in one area until it started to drive on the ramp (the trucks driving time and loading time) which affects the frequency at which trucks entered the ramp. The number of trucks also affected queuing, both inside each area and at the dump location, and the availability of the loaders is another important factor that affects how the trucks work.
All of these factors, which are hard to describe and calculate since they are not deterministic values or constants, require a dynamic model that behaves like reality to obtain a reliable result. For the purpose of investigating a possible future scenario, the most appropriate tool possible should be used, which in this case is a simulator.
6. Conclusions
This study was conducted in an existing deep underground mine that uses sub-level caving. Discrete event simulation was used to evaluate options for future haulage from the lower mine levels without the use of ore passes by comparing different haulage equipment with various sizes operating from the production drifts to the crushers. The results indicated the following:
- Haul trucks can be employed as an alternative haulage method when the costs of managing the ore passes become too high, or the ore passes cannot be used for production.
- For large openings, the favored option for this case is a haulage system using trucks with a capacity of 63 t.
- For smaller production drifts, hauling using trucks will not be economical in order to attain the desired production target.
The study showed that discrete event simulation together with verification and validation processes to develop a model for analysis is a suitable tool for investigating and analyzing mine operations prior to new investments or implementation of new systems. There are, however, many additional considerations that analysis by simulation may not be able to resolve. To evaluate additional costs and considerations when using trucks, discrete event simulation can be combined with economic analysis models to improve understanding and reduce risk related to the selection of the operational systems.
Future research in this area will focus on combining discrete event simulation and mixed integer programming to study the following: ore pass management costs, additional truck operating costs, new haulage systems for deeper levels, and the capital costs required for installation of the necessary infrastructures in the new main level. Future work on comparison of the capital and operational cost of electric versus diesel trucks is also suggested.
Acknowledgments
This study is part of the I2 Mine Project (Innovative Technologies and Concepts for the Intelligent Deep Mine of the Future), WP 2 subtask 2.1.1, and has been carried out at the Division of Mining and Geotechnical Engineering at Luleå University of Technology. The project is funded by EU 7th framework programme.
Author Contributions
Jenny Greberg and Abubakary Salama conceived and designed the experiments/simulation. Abubakary Salama, Jenny Greberg and Bartlomiej Skawina performed the experiments by simulation. Jenny Greberg, Abubakary Salama, Bartlomiej Skawina and Anna Gustafson analyzed the data. Jenny Greberg and Abubakary Salama were the main authors of the paper, assisted by Anna Gustafson and Bartlomiej Skawina.
Conflicts of Interest
The authors declare no conflict of interest.
References
- Stacey, T.R.; Wesseloo, J.; Bell, G. Predicting the stability of rock passes from the geological structure. J. S. Afr. Inst. Min. Metall. 2005, 105, 803–808. [Google Scholar]
- Stacey, T.R.; Swart, A.H. Investigation into Draw Points, Tips Orepasses and Chutes; Technical Report Report to the Safety in Mines Research Advisory Committee, Project OTH 303; Mine Health and Safety Council: Johannesburg, South Africa, 1997; Volume 1. [Google Scholar]
- Kuchta, M.; Newman, A.; Martinez, M. Long- and short-term production scheduling at LKAB’s Kiruna mine. In Handbook of Operations Research in Natural Resources; Weintraub, A., Romero, C., Bjørndal, T., Epstein, R., Eds.; Springer: New York, NY, USA, 2007; pp. 579–593. [Google Scholar]
- Iverson, S.R.; Jung, S.J.; Biswas, K. Comparison of orepass computer simulations for design against dynamic load. In Proceedings of the SME Annual meeting, Cincinnati, OH, USA, 26–28 February 2003.
- Brummer, R. Design of Ore Passes Methods for Determining the Useful Life of Ore-Passes Based on Previous Experience and Case Studies; Technical Report CAMIRO; Mining Division Limited: Sudbury, ON, Canada, 1998. [Google Scholar]
- Hadjigeorgiou, J.; Esmaieli, K.; Harrisson, R. Observation of ore pass system performance at Brunswick Mine. CIM Bull. 2008, 101, 1–13. [Google Scholar]
- Hadjigeorgiou, J.; Stacey, T.R. The absence of strategy in ore pass planning, design and management. J. S. Afr. Inst. Min. Metall. 2013, 133, 795–801. [Google Scholar]
- Joughin, W.C.; Stacey, T.R. Risks associated with rock passes in deep-level tabular mines based on historical pass performance. J. S. Afr. Inst. Min. Metall. 2005, 105, 795–802. [Google Scholar]
- Hadjigeorgiou, J.; Lessard, J.F. Strategies for restoring material flow in ore and waste pass systems. Int. J. Min. Reclam. Environ. 2010, 24, 267–282. [Google Scholar] [CrossRef]
- Kecojevic, V.; Komljenovic, D. Haul truck fuel consumption and CO2 emission under various engine load conditions. Miner. Eng. 2010, 62, 44–48. [Google Scholar]
- Atkinson, T. Selection and sizing of excavating equipment. In SME Mining Engineering Handbook, 2nd ed.; Hartman, H.L., Ed.; SME: Littleton, CO, USA, 1992; pp. 1311–1333. [Google Scholar]
- McCarthy, P.L. Selection of shaft hoisting or decline trucking for underground mines. In Driving Down Haulage Costs; AMC Reference Library: Kalgoorlie, Australia, 1999. [Google Scholar]
- Pratt, A.G.L.; Ellen, P.J. Selection of an ore haulage system for Telfer deeps. In Proceedings of the Hoist and Haul Conference, Melbourne, Australia, 5–7 September 2005; Australasian Institute of Mining and Metallurgy: Perth, Australia, 2005; pp. 131–140. [Google Scholar]
- Salama, A.; Greberg, J.; Schunnesson, H. The use of discrete event simulation for underground haulage mining equipment selection. Int. J. Min. Miner. Eng. 2014, 5, 256–271. [Google Scholar] [CrossRef]
- Banks, J.; Carson, J.S.; Nelson, B.L.; Nicol, D.M. Discrete Event System Simulation; Pearson Education: Upper Saddle River, NJ, USA, 2010. [Google Scholar]
- Raj, M.G.; Vardhan, H.; Rao, Y.V. Production optimization using simulation models in mines: A critical review. Int. J. Oper. Res. 2009, 6, 330–359. [Google Scholar] [CrossRef]
- Sturgul, J.R. Discrete mine system simulation in the United States. Int. J. Min. Reclam. Environ. 1999, 13, 37–41. [Google Scholar] [CrossRef]
- Salama, A. Haulage Systems Optimization for Underground Mines: A Discrete Event Simulation and Mixed Integer Programming Approach. Ph.D. Thesis, Luleå University of Technology, Luleå, Sweden, 2014; pp. 1402–1544. [Google Scholar]
- Greberg, J.; Sundqvist, F. Simulation as a tool for mine planning. In Proceedings of the 2nd International Future Mining, Sydney, Australia, 22–23 November 2011; pp. 273–278.
- SimMine, Version 1.19. Available online: http://simmine.com/ (accessed on 29 June 2016).
- Sargent, R.G. Verification and validation of simulation models. In Proceedings of the 37th Winter Simulation, Syracuse, NY, USA, 4–7 December 2005; pp. 130–143.
- Robinson, S. Simulation model verification and validation: Increasing the user’s confidence. In Proceedings of the 29th Winter Simulation Conference, Atlanta, GA, USA, 7–10 December 1997; IEEE Computer Society: Washington, DC, USA, 1997. [Google Scholar]
- Balci, O. Validation, verification, and testing techniques throughout life cycle of a simulation study. Ann. Oper. Res. 1994, 53, 121–173. [Google Scholar] [CrossRef]
- Salama, A.; Greberg, J.; Skawina, B.; Gustafson, A. Analysis of energy consumption and gas emissions for loading equipment in underground mining. CIM J. 2015, 6, 179–188. [Google Scholar] [CrossRef]
© 2016 by the authors; licensee MDPI, Basel, Switzerland. This article is an open access article distributed under the terms and conditions of the Creative Commons Attribution (CC-BY) license (http://creativecommons.org/licenses/by/4.0/).