Abstract
This study addresses the limitations of conventional evaluation methods caused by low porosity, strong heterogeneity, and complex pore structures in tight sandstone reservoirs. Through integrated rock physics experiments and multi-physical field modeling, the research systematically investigates the coupled response mechanisms between electrical and elastic parameters. The experimental approach includes pore structure characterization, quantitative mineral composition analysis, resistivity and polarizability measurements under various saturation conditions, P- and S-wave velocity testing, and scanning electron microscopy (SEM) imaging. The key findings show that increasing porosity leads to significant reductions in resistivity and elastic wave velocities, while also increasing surface conductivity. Specifically, clay minerals enhance surface conductivity through interfacial polarization effects and decrease rock stiffness, which exacerbates wave velocity attenuation. Furthermore, resistivity exhibits a nonlinear negative correlation with water saturation, with sharp increases at low saturation levels due to the disruption of conductive pathways. By integrating the Modified Generalized Effective Medium Theory of Induced Polarization (MGEMTIP) and Kuster–Toksöz models, this study establishes quantitative relationships between porosity, saturation, and electrical/elastic parameters, and constructs cross-plot templates that correlate elastic wave velocities with resistivity and surface conductivity. These analyses reveal that high-porosity, high-saturation zones are characterized by lower resistivity and wave velocities, coupled with significantly higher surface conductivity. The proposed methodology significantly improves the accuracy of reservoir evaluation and enhances fluid identification capabilities, providing a solid theoretical foundation for the efficient exploration and development of tight sandstone reservoirs.
1. Introduction
Tight sandstone reservoirs, serving as a critical carrier for unconventional oil and gas resources, have garnered significant global attention in recent years. However, their complex geological and physical properties present substantial challenges to reservoir evaluation and hydrocarbon exploration. Characterized by low porosity, low permeability, high heterogeneity, and complex pore structures, these reservoirs exhibit severely limited fluid flow capacity. Consequently, conventional fluid flow theories and evaluation methodologies prove inadequate, substantially increasing the complexity of reservoir assessment [1,2,3,4,5,6].
Electrical parameters constitute one of the core methods for reservoir evaluation, and their characterization techniques have achieved significant progress in recent years. The Archie equation, as a classical electrical-property relationship model, is widely applied in tight sandstone reservoir evaluation [7]. However, its applicability faces challenges in complex pore systems. Yin Junqiang et al. experimentally demonstrated that under low porosity and permeability conditions, saturation models require modification to enhance the prediction accuracy of oil saturation [8]. Xiang Kui et al. further discovered that the complex resistivity of rocks exhibits a non-linear response to oil saturation: at high water saturation, resistivity is low and polarization is gradual, while as oil saturation increases, resistivity rises and polarization shows a unimodal characteristic [9]. This complexity originates from the induced polarization (IP) effect at mineral–fluid interfaces, making it difficult to precisely characterize reservoir properties relying solely on the single parameter of resistivity. To overcome the limitations of the Archie equation, researchers have developed IP models to extract multi-dimensional electrical parameters, thereby reducing the non-uniqueness in porosity and saturation inversion. Pelton first introduced the Cole–Cole model into the study of electrical frequency dispersion in rocks, quantifying dispersion characteristics through relaxation time spectra [10]. Subsequently developed models, such as the Dias model [11] and the spectral Debye model [12], progressively improved the characterization of multiple polarization mechanisms. The Generalized Effective Medium Theory of Induced Polarization (GEMTIP) model proposed by Zhdanov rigorously derives the effective resistivity of heterogeneous media from Maxwell’s equations [13]. The Modified GEMTIP (MGEMTIP) model developed by Tong et al. optimized its applicability for high-resistivity media and enhanced the quantitative correlation between IP parameters and structural parameters [14]. This model also enables dynamic parameter inversion via the Debye decomposition algorithm [15]. Building on the correlation between IP parameters and organic matter content, the complex resistivity technique developed by Xiang Kui et al. further expands the dimensionality of electrical characterization [16]. However, in tight sandstones, factors such as the interfacial polarization of clay minerals, strong pore structure heterogeneity, and the complexity of fluid distribution make it difficult for any single electrical parameter to simultaneously constrain mineral composition, pore geometry, and fluid phase state. This non-uniqueness fundamentally arises because the electrical response is governed by coupled multi-physical processes, while one-dimensional electrical measurements provide insufficient information to decouple the multi-dimensional reservoir parameter space.
Elastic parameters serve as a core means for petrophysical characterization of reservoirs, and the development of their evaluation models has significantly enhanced reservoir prediction capabilities. Although the Gassmann model is widely applied for fluid substitution in conventional sandstones [17,18], it faces fundamental constraints in tight sandstones: the scale disparity between the high-frequency fluid inertial effects revealed by Biot theory and the low-frequency seismic wavefield response prevents the model from being directly applicable for predicting broadband elastic responses [19]. The Differential Effective Medium (DEM) model simulates the elastic evolution of rocks by incrementally adding inclusions, but its results are affected by path dependency in the order of inclusion addition, necessitating reliance on experimental data to constrain pore geometry and suppress non-uniqueness [20,21]. While the self-consistent (SC) model can characterize inclusion interactions in fractured-porous media, its computational complexity hinders real-time inversion applications [22]. The Kuster–Toksöz model, owing to its advantage in explicitly characterizing the influence of pore morphology, has become a mainstream framework for elastic modeling in tight sandstones [23]. Berryman extended its quantitative description of non-spherical pores using a self-consistent approach [24]. Leravalec and Gueguen validated its applicability in low-porosity fractured rocks (though modifications for pore interactions are needed at high porosity) [25]. Mavko et al. enhanced its predictive capability for multi-scale pores by integrating it with DEM theory [26]. Subsequent research further revealed its applicability boundaries: Guéguen et al. confirmed its ability to predict shear wave anisotropy in media containing flat pores [27]. Grana et al. improved its computational efficiency in tight sandstones through inversion workflow optimization [28]. Despite the continuous evolution of elastic models, the coupled interaction of mineral composition and pore fluids on the elastic response in tight sandstones still makes it difficult for any single elastic parameter to distinguish between changes in frame modulus and fluid substitution effects.
In recent years, scholars have overcome the limitations of traditional single-physics models by establishing multi-physics coupling models based on microscopic pore structures. Gao et al. proposed a joint electromagnetic-seismic rock physics inversion model. This model synergistically constrains petrophysical parameter conversion based on the Archie equation and rock physics fluid substitution equations, enabling the direct and simultaneous inversion of porosity and fluid saturation [29]. Han et al. developed a pressure-controlled elastic-electrical co-evolution model. Through experiments controlled by dual parameters-confining pressure and water saturation, this model revealed the binary flow mechanism involving compliant/rigid pores, establishing the physical foundation for joint seismic–electromagnetic inversion in partially saturated rocks [30]. This study integrates rock physics experiments and scanning electron microscopy (SEM) analysis with the MGEMTIP model and the Kuster–Toksöz (KT) effective modulus model. We construct a joint elastic-electrical rock physics template that dynamically couples electrical and elastic parameters. This approach achieves multi-physics collaborative characterization of reservoir microstructure and fluid saturation, significantly enhancing the evaluation of heterogeneity and fluid identification accuracy in tight sandstone reservoirs.
2. Theoretical Models of Electrical and Elastic Properties in Rocks
2.1. Rock Induced Polarization Models
The MGEMTIP model [14] revises the definition of effective conductivity in the original GEMTIP (Generalized Effective Medium Theory of Induced Polarization) model. Under the assumption of one-dimensional spherical inclusions, the reformulated MGEMTIP model can be expressed in a form analogous to the Cole–Cole model:
where is the effective volume fraction of the background medium; is the relaxation time associated with the discontinuous polarizable medium; is the polarizability of the inclusion, where represents the conductivity of the background medium; and , and correspond to the volume fraction, conductivity, surface polarization factor, and equivalent spherical radius of the -th type of inclusion, respectively. The parameter exhibits frequency-dependent characteristics. When the interface is modeled as a capacitive element, can be expressed as .
2.2. Rock Kuster–Toksöz Model
The Kuster–Toksöz effective modulus model, rooted in effective medium theory, provides a rock physics framework to quantitatively characterize the effects of multi-mineral compositions, pore structures, and fluid saturation on elastic properties. By explicitly incorporating parameters such as pore aspect ratios and orientation distributions, this model captures the anisotropic effects induced by complex pore geometries and microstructures. Notably, it eliminates path dependence, as results are determined solely by the final volumetric fractions and geometric configurations. These capabilities enable precise modeling of elastic responses in tight sandstone reservoirs with complex pore-fracture networks, rendering it particularly effective for characterizing heterogeneity in low-porosity, high-stiffness media.
Here, represents the equivalent bulk modulus and shear modulus of the rock; denotes the bulk modulus and shear modulus of the rock matrix; corresponds to the bulk modulus and shear modulus of the pore inclusions; and signifies the volume fractions of multiple inclusion types.
The coefficients and describe the results of incorporating inclusion material into the background medium .
2.3. Modeling of Elastic and Electrical Parameter Joint Response in Tight Sandstone Reservoirs
To jointly characterize the electrical parameters (resistivity, polarizability, surface conductivity) and elastic parameters (P-wave and S-wave velocities) of tight sandstone reservoirs, this paper employs the MGEMTIP model to describe the electrical response mechanism and combines it with the Kuster–Toksöz (K-T) equivalent modulus model to characterize the propagation characteristics of elastic waves.
2.3.1. MGEMTIP Model
According to Archie’s law [7], the low-frequency electrical conductivity of saturated rocks can be characterized as:
where and correspond to the pore fluid conductivity and the formation factor, respectively, and φ and m correspond to porosity and the cementation exponent, respectively. The pore fluid serves as the primary conducting medium. The influence of clay on the model requires analysis based on its spatial distribution: High clay content with continuous distribution may form effective electrical conduction, potentially contributing to low-frequency conductivity at the core scale through an additional conductivity term. Discontinuous clay distribution results in a polarizable medium that conducts at high frequencies but ceases to conduct at low frequencies. By incorporating the clay and pore fluid conductivity into Equation (1) via Equation (4), the rock conductivity can be derived as:
where represents the high-frequency additional equivalent conductivity, corresponds to the relative clay content, and represents the cementation exponent for clay minerals. When clay minerals are spatially uncorrelated with the fluid-filled pore space, . When clay minerals exhibit positive spatial correlation with the fluid-filled pore space, .
corresponds to the effective clay mineral fraction across multiple scales.
Equations (1)–(3) satisfy the high-frequency regime and the low-frequency regime .
Based on Equation (5), for rock samples exhibiting fluid-dominated conduction and clay polarization characteristics, the complex resistivity model of saturated rocks can be derived and the corresponding polarizability calculated by directly calibrating the cementation exponents of the pore fluid and clay minerals, without requiring analysis of the clay mineral fraction across multiple scales or their associated time constants.
The low-frequency electrical conductivity of rocks under unsaturated conditions can be expressed by Archie’s law:
where I is the resistivity index, and and n correspond to the water saturation and saturation exponent, respectively. The unsaturated conditions also influence the clay-induced excess conductivity, leading to a significant decrease in the conductivity of dry clay. Formally consistent with Equation (6), Equation (5) can characterize the frequency dispersion characteristics of the electrical conductivity in unsaturated rocks.
The surface conductivity of the rock under unsaturated conditions can be expressed as:
Here, and correspond to the fluid resistivity index and clay resistivity index, respectively. Under different fluid saturation conditions, the clay saturation state will also change, a variation related to the wettability characteristics of minerals. Simultaneously, unsaturated fluids may generate new fluid/air interfaces, creating additional interfacial conductivity. This process involves the combined effects of multiple polarization mechanisms, which also require calibration through experimental measurements.
2.3.2. Kuster–Toksöz Model
After a comprehensive analysis of the sandstone pore structure, it is found that the main types of pores in the sandstone are intergranular dissolution pores, primary intergranular pores, and intergranular fissures. Based on this, the pore fillings can be regarded as equivalent inclusions of two shapes: spherical and coin-shaped fissures.
When the inclusions are penny-shaped cracks:
where is the pore aspect ratio.
3. Geological Overview of the Kuqa Foreland Basin in the Tarim Basin
3.1. Geological Background of the Kuqa Foreland Basin
Kuqa Foreland Basin is situated on the northern margin of the Tarim Basin, forming a Meso-Cenozoic composite foreland basin superimposed on Paleozoic marine cratonic basement (Figure 1). Its northern boundary connects with the South Tianshan Orogen via thrust faults, while adjoining the Tabei Uplift to the south. Extending from the Wushi Sag in the west to the Yangxia Sag in the east, it exhibits a distinct “four belts and three sags” structural framework. N-S trending belts (north to south): Northern Structural Belt, Kelasu Structural Belt, Qiulitag Structural Belt, and Southern Slope Belt. W-E trending sags (west to east): Wushi Sag, Baicheng Sag, and Yangxia Sag. The basin underwent complex tectonic evolution controlled by continuous uplift of the South Tianshan and northward thrust-nappe emplacement. This generated a wedge-shaped sedimentary body thickening northward, with the depocenter migrating southward over time toward the Kelasu Structural Belt. Large-scale thrust fault systems developed in this region, causing localized stratigraphic thickening (e.g., Triassic) through imbricate duplication.
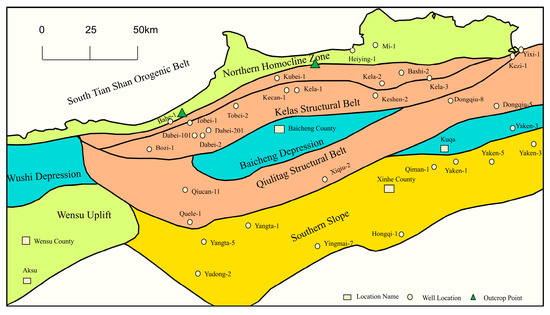
Figure 1.
Location map of three-dimensional gravity, magnetic, and electrical data acquisition area in northern structural belt of Kuqa Depression in Tarim Basin (changed from Liu, C.; Zhao, J.L.; Zhang, X.Q.; Wang, J.P.; Zhou, P. and Zeng, Q.L. [31]).
3.2. Stratigraphic Framework of the Kuqa Foreland Basin
The stratigraphic column of Kuqa Depression (Figure 2), demonstrates the sequence from top to bottom: Quaternary (Q), Neogene Kuche Fm (N2k), Kangcun Fm (N1–2k), Jidike Fm (N1j); Paleogene Suweiyi Fm (E2–3s), Kumugeliemu Group (E1–2km); Cretaceous Bashijiqike Fm (K1bs), Baxigai Fm (K1bx), Shushanhe Fm (K1s), along with Jurassic, Triassic and Paleozoic strata, constrained by Well Kubei-1 and Dabei-2.
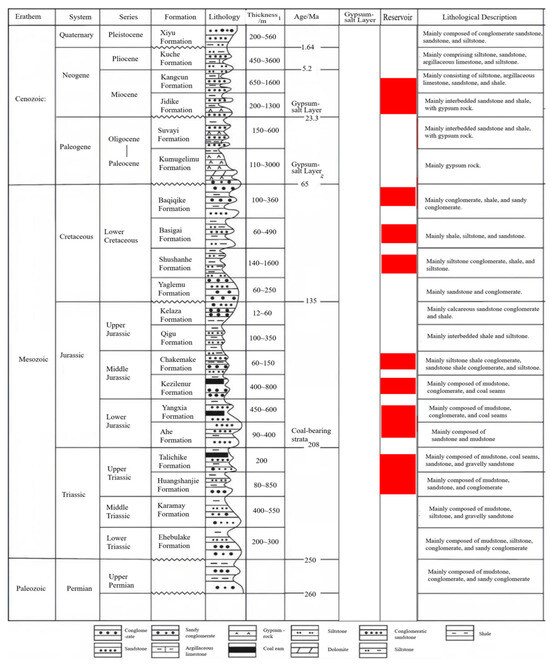
Figure 2.
Stratigraphic column of Kuqa Depression (changed from Duan, Y.J.; Huang, S.Y.; Luo, C.M.; Zhou, S.Y.; Kang, Q.; Wang, X and Wei, H.X. [32]).
Cenozoic: The Quaternary system features thick gravel, sandy gravel, and mudstone interbeds of fluvial–fan–lacustrine facies, indicative of an oxidizing-weakly reducing environment. It can be subdivided into four sections from bottom to top, with lithologies gradually changing from sand–mud interbeds to gravel-dominated strata. The Neogene includes the Kuqa Formation (progradational fluvial-deltaic sand–mud interbeds), the Kangcun Formation (shore–shallow lake mudstone and siltstone), and the Jidike Formation (shallow lake–fluvial mudstone and sandy gravel interbeds).
Paleogene: The Suwei’yi Formation consists of shallow lake-lagoon mudstone and siltstone interbedded with gypsum. The Kumugulemu Group represents shallow lake-gypsum lake deposits under arid climatic conditions, divided from top to bottom into mudstone, gypsum, and basal sandstone sections.
Cretaceous: Widespread development, it is an important reservoir location. The Bashiqiqike Formation is composed of medium-fine sandstone and siltstone interbedded with thin mudstone in the braided delta front. The Bazhigai and Shushanhe formations belong to the delta front to shore–shallow lake facies, mainly consisting of siltstone, mudstone, and sand–mud interbeds. The sedimentary center is located in the Kelasu structural belt, with a thickness exceeding 1800 m.
Lower Mesozoic: The Jurassic and Triassic systems both present wedge-shaped bodies that are thicker in the north and thinner in the south, and thicker in the west and thinner in the east. Their maximum thicknesses exceed 3000 m and 1924 m, respectively, with the sedimentary center located at the northern piedmont. The Jurassic locally overlies the Permian.
Vertically, lithologies frequently alternate, such as the gravel–sandstone–mudstone cycles within the Quaternary, the interbeds of gypsum and clastic rocks in the Paleogene, and the thin interbeds of sandstone and mudstone in the Cretaceous. Laterally, controlled by sediment sources and depositional facies, the subsidence centers like the Kelasu structural belt develop thicker and coarser clastic rocks, while the depression areas are more commonly characterized by fine-grained lacustrine mudstone and gypsum. The Cretaceous sandstone often contains calcareous and argillaceous cements, and the Paleogene is rich in evaporite minerals, further exacerbating the spatial differences in reservoir properties. The sandstone has a dense structure, with generally low porosity and permeability, representing a typical tight reservoir. This set of strata was formed in the braided delta front environment, with extensive lateral distribution of sand bodies but strong heterogeneity, significantly controlled by depositional microfacies and diagenetic processes. The reservoir thickness is greatest at the subsidence center, with greater burial depth, and is strongly influenced by the thrust fault system in terms of structure, developing fault anticlines, fault blocks, and other trapping types [33,34].
4. Experimental Design and Results
4.1. Experimental Design and Testing
To simulate the in-situ conditions of the tight sandstone reservoirs in the Tarim Basin, 54 rock samples from different stratigraphic levels were selected. The samples were processed into cylindrical cores with a diameter of approximately 25 mm and a length of 30-50 mm, and were successively subjected to oil washing, salt washing (using distilled water), and drying (to constant weight).
The rock physics tests were conducted in the AutoLab 1000 (New England Research (NER), Junction, VT, USA) high-temperature and high-pressure rock physics experimental system (Figure 3). The experimental settings included a temperature of 100 °C, a confining pressure of 44 MPa, and a pore pressure of 2 MPa, in order to simulate the environment of the target formation depth. The cores were measured in a saturated state with 5% salinity NaCl solution (to simulate the salinity of the formation fluid).
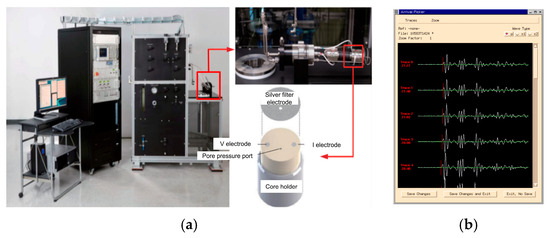
Figure 3.
High-temperature, high-pressure petrophysical experimental system. (a) AutoLab1000 experimental system and core holder. (b) Schematic diagram of first-arrival wave selection.
While in the saturated state, the complex resistivity of the core was measured using the symmetrical four-pole method within the frequency range of 10−2 to 104 Hz to obtain the electrical response of the rock at high frequencies (conductivity) and low frequencies (polarization effect). Concurrently, the P-wave and S-wave velocities of the samples were measured using the ultrasonic first-arrival wave method. The measurement process was automatically controlled by the testing system. The experiment directly obtained the complex resistivity and its phase of the rock. The relationship between the real and imaginary parts of the complex conductivity and the complex resistivity can be expressed as [35]:
where corresponds to the real and imaginary parts of both the complex conductivity σ(ω) and complex resistivity ρ(ω) of the rock.
In addition, twelve samples from different strata were selected for scanning electron microscopy (SEM) analysis and mineralogical composition analysis. Based on the porosity measurement results, twenty samples with representative pore structure characteristics (covering a range of high and low porosities) were chosen to conduct experiments on rock resistivity, polarizability, and P-wave and S-wave velocities under different water saturation conditions.
4.2. Microstructural Analysis
The scanning electron microscopy (SEM) analysis (Figure 4) illustrates the complex pore system characteristics of the tight sandstone reservoir in the study area. The results show that intergranular pores are the main type of reservoir space, but their development and morphology are significantly controlled by calcite cementation and clay minerals. Numerous samples show that calcite, in the form of granular to crystalline particles, is the primary cement filling the intergranular pores (Figure 4a–d). This intense calcite cementation has resulted in the substantial occupation of original intergranular pores, significantly reducing the original porosity and permeability. However, in some samples, residual intergranular pores are observed between calcite crystals or at the contact points between calcite crystals and particles, and intergranular pore fractures are formed after calcite fills the pores (Figure 4a–d). Notably, in some areas, calcite itself or its edges may have undergone post-depositional dissolution, creating secondary dissolution pores that partially restore reservoir space (Figure 4c,d). This dissolution-induced porosity has a positive impact on improving the reservoir quality. Clay minerals are present in the form of platy kaolinite aggregates (Figure 4c) and fibrous illite–smectite mixed layers (Figure 4d). The kaolinite aggregates often fill the intergranular pores, and their platy structure is prone to dissolution under fluid action, creating micropores and increasing the roughness of the pore surface. The illite–smectite mixed layers mainly adhere to the particle surfaces (Figure 4d), forming clay mineral coatings that significantly increase the specific surface area of the pores. These clay minerals, especially the fibrous illite–smectite mixed layers with a high specific surface area, play an important role in the electrical response of the rock, such as surface conductivity and induced polarization effects. In some samples, bitumen is observed filling the intergranular pores, indicating the presence of organic matter and its occupation of pore space.
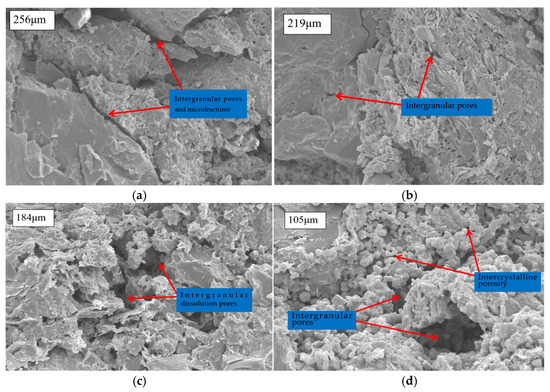
Figure 4.
SEM imaging of pores and microfractures in the study area. Intergranular pores and microfractures. (a) N1k-5 light grey-green sandstone. (b) T3t-6 fine-grained conglomerate. (c) C-9 grey sandstone. (d) J1y-1 conglomeratic coarse sandstone.
The pore system of the tight sandstone in the study area is primarily characterized by intergranular pores that are strongly influenced by calcite cementation. Calcite filling severely restricts the development of original pores, but later dissolution (including dissolution of calcite and clay minerals) can create secondary pores that improve pore connectivity. The clay minerals, such as platy kaolinite and fibrous illite–smectite mixed layers, not only fill the pores but also play a key role in controlling pore structure and the rock’s electrical properties, especially surface conductivity related to interface polarization. The presence of bitumen further increases the heterogeneity of the reservoir.
5. Analysis of Experimental Results
5.1. Experimental Results
5.1.1. Basic Measurement Data
Through experimental measurements, the parameters of porosity, density, resistivity, polarizability, and P-wave and S-wave velocities of the rock samples from the Tarim Basin are obtained as shown in Table 1.

Table 1.
Basic measurement data of rock samples from Kuqa Foreland Basin in Tarim Basin.
5.1.2. Measurement Results of Rock Samples at Different Saturation Levels
In this study, rock samples with high porosity (φ > 10%) and low porosity (φ < 10%) were selected to measure the resistivity, polarizability, and P-wave and S-wave velocities of tight sandstone under different water saturation conditions. The measurement results are shown in Table 2 and Table 3.
Table 2.
Measurement of rock resistivity and polarizability under different saturation conditions.
Table 3.
Measurement of P-wave and S-wave velocities of rocks under different saturation conditions.
5.1.3. Measurement of Rock Mineral Composition
As shown in Figure 5, During the analysis of the mineral composition of rock samples from different strata, it was found that these samples mainly contain quartz, feldspar, calcite, dolomite, and clay minerals. Among them, the content of clay minerals is significant, ranging from 8.8% to 18.9%. Under normal circumstances, since minerals such as quartz, feldspar, calcite, and dolomite are non-conductive, they can be regarded as background minerals in the analysis. However, the situation with clay minerals is different. Clay minerals have a significant impact on the resistivity and polarizability of rocks, which means that they play a key role in the electrical properties of rocks. Therefore, we cannot simply classify them as background minerals, but need to conduct a separate in-depth analysis of the clay minerals.
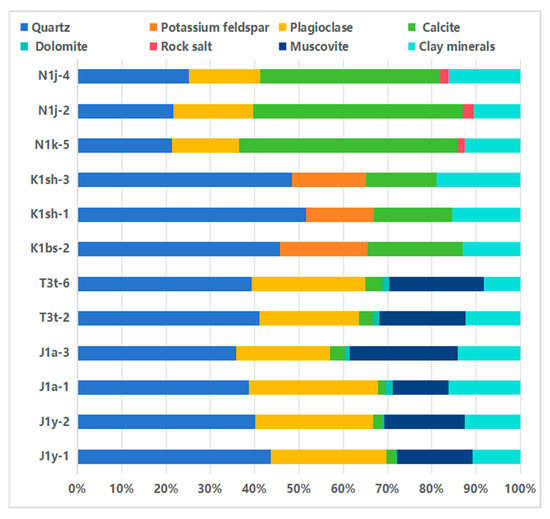
Figure 5.
Results of mineral composition analysis.
5.2. Effects of Clay Minerals on Elastic and Electrical Parameters
5.2.1. Influence of Clay Minerals on Elastic Parameters
Mineral composition analysis of the rock samples reveals high clay content that substantially impacts their electrical and elastic properties. As shown in Figure 6, increased clay mineral fraction leads to significant reductions in compressional (P-wave) and shear (S-wave) velocities, consistent with the dilution effect of low-stiffness minerals (clay minerals have significantly lower moduli compared to quartz/feldspar). The compressional wave velocity exhibits a greater reduction magnitude than the shear wave velocity, indicating that compressional wave velocity demonstrates higher sensitivity to clay mineral content.
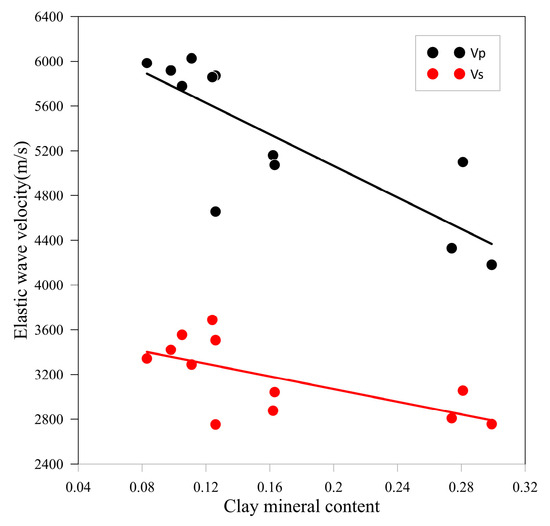
Figure 6.
Relationship between clay minerals and elastic wave velocities.
5.2.2. Influence of Clay Minerals on Porosity and Surface Conductivity
Based on the analysis of experimental data, a significant positive correlation between clay mineral content and porosity is observed, as shown in Figure 7. This relationship reveals a tripartite synergistic mechanism of “clay content–dissolution intensity–pore development” in tight sandstone reservoirs, providing a crucial basis for reservoir quality evaluation. Clay minerals are not only important components of the pore space, directly contributing to pore volume, but also act as catalytic media for pore modification, promoting dissolution through interfacial effects.
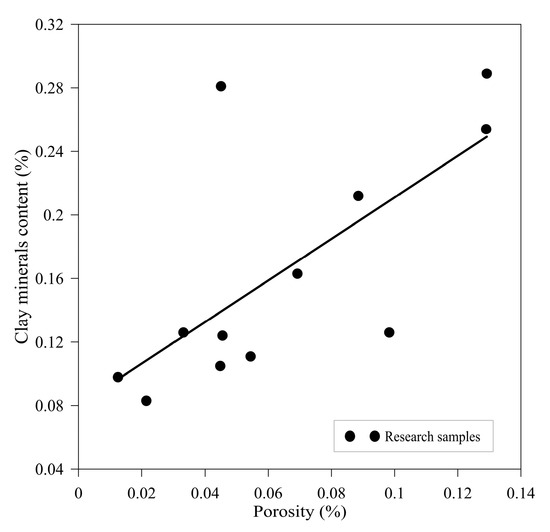
Figure 7.
Relationship between clay minerals and porosity.
Scanning electron microscopy analysis further shows that clay minerals, with their flake-like structure, cover grain surfaces, significantly increasing the specific surface area of the pore interface. Additionally, the synergistic effect of secondary micropores and rough interfaces enhances the efficiency of interfacial reactions. According to the MGEMTIP model, clay minerals, acting as a polarizing medium, directly affect the frequency dispersion characteristics of the rock’s conductivity. Specifically, Equation (5) indicates that the relative proportion of clay minerals to fluid space and their cementation index jointly determine the contribution to additional conductivity. When the clay mineral content increases and their distribution is continuous, their high specific surface area enhances the interfacial polarization effect, significantly increasing surface conductivity by elevating the concentration of charge carriers within the electric double layer, as shown in Figure 8.
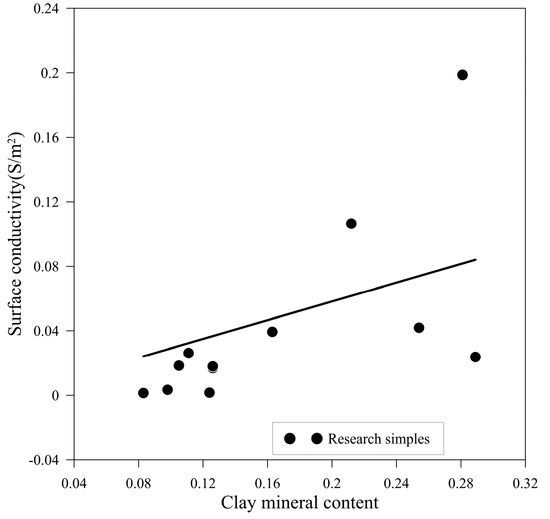
Figure 8.
Relationship between clay minerals and surface conductivity.
Furthermore, Archie’s law states that an increase in porosity decreases the overall resistivity of the rock. The additional conductive effect of clay minerals further strengthens this trend by increasing surface conductivity. These findings not only enhance our understanding of the role of clay minerals in tight sandstone reservoirs but also provide significant theoretical support for reservoir evaluation and fluid identification.
5.3. Analysis of Experimental Results for Rock Density and Elastic Wave Velocity
The measured density of the samples ranges from 2.2–2.7 g/cm3, with compressional wave velocities (Vp) of 4000–7200 m/s and shear wave velocities (Vs) of 2000–4000 m/s. As shown in Figure 9, density exhibits a significant positive correlation with both Vp and Vs (R2 > 0.85), indicating that the types and content of cementing materials critically influence the elastic properties of the rocks. High-density samples (ρ > 2.5 g/cm3) correspond to higher Vp and Vs values, primarily due to the higher content of rigid minerals such as quartz and feldspar. In contrast, low-density samples (ρ < 2.4 g/cm3) show increased proportions of clay minerals, leading to reduced wave velocities.
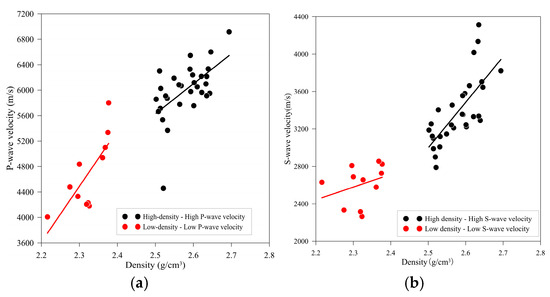
Figure 9.
Relationship between density and elastic wave velocities. (a) Density–P-wave velocity relationship. (b) Density–S-wave velocity relationship.
5.4. Analysis of Experimental Results for Porosity, Elastic Parameters, and Electrical Parameters
5.4.1. Response of Elastic Parameters
Based on the quantitative analysis and experimental verification of the Kuster–Toksöz equivalent medium theory (Figure 10), the coupling relationship between porosity (φ) and elastic wave velocity reveals a significant differentiated response. When the porosity increases from 0% to 16%, the P-wave velocity (Vp) shows a sharp attenuation from 7200 m/s to 4000 m/s (a decrease of 3200 m/s), while the S-wave velocity (Vs) decreases from 4400 m/s to 2400 m/s (a decrease of 2000 m/s). The decline slope of the P-wave velocity is significantly greater than that of the S-wave velocity, which is essentially due to the differential control mechanism of the pore system on the bulk modulus and shear modulus of the rock. According to the explicit characterization of the K-T model (Equations (9) and (10)), the newly added pores, as low-modulus inclusions embedded in the mineral framework, dominate the modulus attenuation path with their geometric shapes: spherical pores have a much stronger weakening effect on the bulk modulus than on the shear modulus. Since the P-wave velocity is more significantly affected by the bulk modulus, the dominant role of the bulk modulus leads to a greater decline slope of Vp. Although scanning electron microscopy reveals that microcracks have a strong potential to weaken the shear modulus, the 44 MPa confining pressure promotes partial closure of the cracks, significantly suppressing their actual impact.
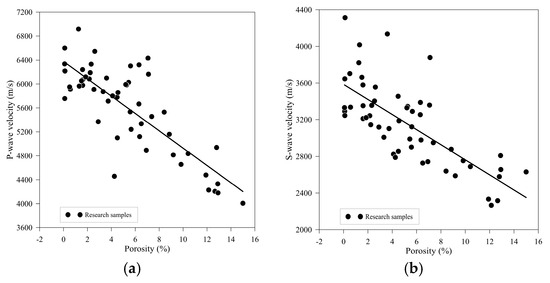
Figure 10.
Relationship between porosity and elastic wave velocities. (a) Porosity–P-wave velocity relationship. (b) Porosity–S-wave velocity relationship.
5.4.2. Response of Electrical Parameters
Influence of Porosity on Electrical Parameters
As shown in Figure 11a,b the negative correlation between porosity and resistivity in tight sandstone, as well as the positive correlation with surface conductivity, align with predictions from Archie’s law. According to experimental data, as porosity increases from 0% to 16%, the significant enhancement of interfacial conductivity can be attributed to: reduced lattice activation energy and enhanced surface ion mobility induced by elevated temperatures, thermal activation effects promoting increased charge carrier concentration within the electric double layer and intensifying interfacial polarization, high-pressure conditions driving densification, and restructuring of the microstructure at grain contact surfaces. These mechanisms synergistically optimize interfacial charge transport pathways through multi-physics coupling effects.
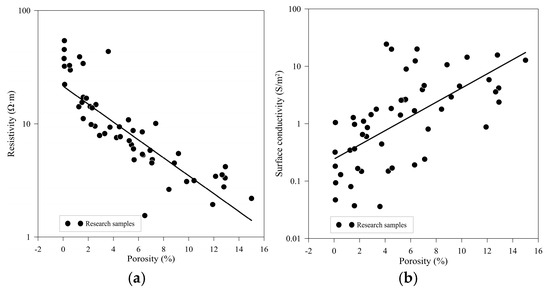
Figure 11.
Cross-plots of porosity versus resistivity and surface conductivity. (a) Relationship between porosity and resistivity. (b) Relationship between porosity and surface conductivity.
Influence of Saturation on Electrical Parameters
Resistivity characterization tests on rock samples pretreated with oil and salt removal (Figure 12) reveal a significant negative correlation between rock resistivity and water saturation. When water saturation decreases from 75% to 10%, the resistivity increase exhibits a nonlinear accelerating trend, reaching 210 Ω·m at 10% saturation—a 3.8-fold increase compared to the 75% saturation state. The complex and heterogeneous pore structure of the rocks governs this behavior: At high water saturation (>40%), interconnected water in pores and fractures forms a continuous conductive network, resulting in lower resistivity. Below 15% saturation, water becomes trapped in isolated large pores or pore corners, leading to sparse and discontinuous conductive pathways and a nonlinear accelerated increase in resistivity [29].
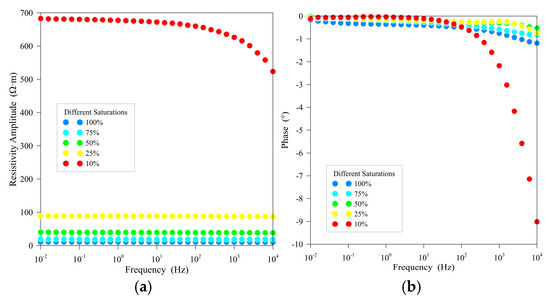
Figure 12.
Test results for rock sample T3h-2. (a) Resistivity amplitude; (b) phase angle.
Phase response displays distinct frequency dispersion characteristics: At high saturation (>40%), phase-frequency curves remain flat. At low saturation (10%), a marked divergence occurs: Phase angles rise significantly in the high-frequency range (>102Hz), while remaining relatively stable in the low-frequency range (<101 Hz). This behavior arises from interfacial polarization between fluids and the solid matrix in rock pores. Variations in water saturation alter the magnitude and frequency-dependent responses of interfacial polarization. At low saturation, the inhomogeneous distribution of water enhances interfacial polarization effects, which exhibit frequency-dependent variations, thereby inducing the observed phase dispersion [30].
Further analysis of the electrical response of clay minerals reveals that the clay resistivity index and water saturation (Sw) conform to the following power-law relationship (Figure 13):
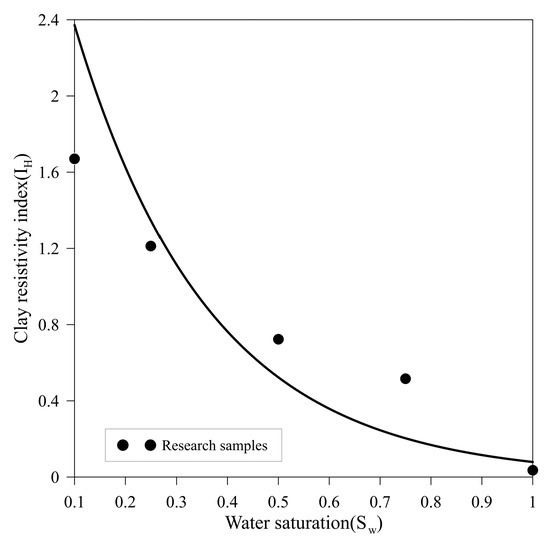
Figure 13.
Relationship between rock water saturation and clay resistivity average index.
Taking the logarithm of both sides yields:
where a is the proportionality coefficient, determined through data fitting as a = 2.6; n is the saturation exponent; and Sw is the water saturation.
6. Model Development
6.1. Relationships Between Electrical Parameters and Reservoir Petrophysical Properties
Based on the MGEMTIP (Modified Generalized Effective Medium Theory of Induced Polarization) model and experimental data, this study establishes a quantitative relationship model between electrical parameters and reservoir petrophysical parameters. As expressed in Equation (7), the rock resistivity can be characterized as a comprehensive response to pore fluid conductivity, clay-induced additional conductivity, and saturation:
where is the rock resistivity and is the pore fluid conductivity.
Based on experimental data (Figure 7), the clay mineral content (Vclay) and porosity (ϕ) exhibit a significant linear relationship, which can be mathematically expressed as:
By combining Equations (12), (14) and (15), we have established a comprehensive quantitative relationship model linking rock resistivity with porosity and saturation:
Equation (16) demonstrates that resistivity is dually controlled by porosity and saturation: increased porosity directly reduces rock matrix conductivity, while clay minerals enhance additional conductivity through interfacial polarization effects.
To further quantify the contribution of surface conductivity, the relationship between surface conductivity under saturated conditions and the clay mineral volume fraction (Vclay) was derived based on the MGEMTIP (Modified Generalized Effective Medium Theory of Induced Polarization) model:
By introducing the power-law relationship for the clay resistivity index under unsaturated conditions (Equation (12)), the surface conductivity model under varying saturation conditions can be extended as follows:
where is the pore fluid conductivity and is the clay mineral volume fraction.
A relationship model between surface conductivity and porosity under varying saturation conditions can be further established.
where is the clay dissolution coefficient, determined through data fitting; is the clay cementation exponent; and () is determined through data fitting.
The model demonstrates that surface conductivity is not only governed by pore fluid conductivity but also closely correlated with clay mineral content and their microscopic distribution characteristics. Under high-porosity conditions, the interfacial polarization effects of clay minerals are significantly amplified, resulting in a nonlinear increasing trend of surface conductivity with porosity.
6.2. Relationships Between Elastic Parameters and Reservoir Petrophysical Properties
In the model construction, the matrix mineral skeleton is treated as a continuous background medium, with pores and fractures embedded as inclusions. For fully brine-saturated pores, the inclusion bulk modulus () and shear modulus () are assigned values of brine bulk modulus ( = 2.2 GPa) and brine shear modulus (= 0 GPa). Under dry conditions, the pore inclusion moduli are assigned values of air bulk modulus ( = 0.101 GPa). For gas–water two-phase fluid-filled pores, the equivalent fluid bulk modulus is calculated using Wood’s equation:
Here, , , represent the equivalent fluid bulk modulus, brine bulk modulus, and gas bulk modulus, respectively, while denotes the water saturation.
The bulk modulus and shear modulus of the matrix are calculated using the Voigt–Reuss–Hill method:
where
Here, and denote the volume fraction and modulus of the i-th component, respectively.
Through the aforementioned models, the effective elastic moduli of the rock can be expressed as:
Here, and denote the bulk modulus and shear modulus of the inclusions, respectively. For 100% brine-saturated rocks, (brine bulk modulus) and ; for completely dry rocks, (air bulk modulus) and ; for rocks containing both water and gas in the pores, the equivalent fluid bulk modulus is determined using Wood’s equation.
Thus, the P-wave and S-wave velocities are calculated as:
6.3. Integrated Elastic-Electrical Petrophysical Chart
To address the limitations of relying on a single petrophysical parameter, this study constructs quantitative relationships between petrophysical and electrical parameters using the MGEMTIP model (Equations (16) and (19)). Combined with the Kuster–Toksöz effective modulus model, which characterizes the influence of pore geometry on elastic wave propagation (Equations (22) and (23)), we establish cross-parameter correlation templates for P-wave velocity vs. resistivity, S-wave velocity vs. resistivity, P-wave velocity vs. surface conductivity, and S-wave velocity vs. surface conductivity (Figure 14).
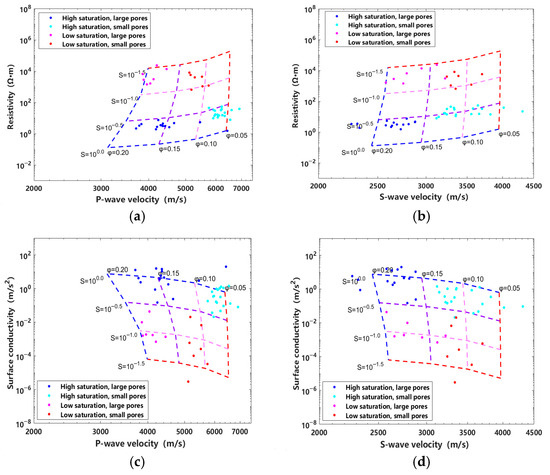
Figure 14.
Cross-plots of P- and S-wave velocity versus resistivity and surface conductivity. (a) P-wave velocity vs. resistivity. (b) S-wave velocity vs. resistivity. (c) P-wave velocity vs. surface conductivity. (d) S-wave velocity vs. surface conductivity.
The templates reveal that rocks with high porosity (>10%) and high saturation exhibit lower resistivity and acoustic velocities compared to those with low porosity (<5%) and low saturation. Surface conductivity becomes more pronounced under high-porosity and high-saturation conditions. Through integrated elastic-electrical analysis, reservoir petrophysical parameters can be predicted with enhanced accuracy, providing theoretical support for the efficient development of tight sandstone reservoirs.
7. Conclusions
This study investigates the response characteristics of electrical and elastic parameters in tight sandstone reservoirs through in-situ formation simulation experiments and SEM analysis on 54 tight sandstone samples from the Kuqa Foreland Basin, establishing an integrated elastic-electrical evaluation system. Key conclusions are as follows:
- (1)
- As porosity in tight sandstone increases, electrical resistivity and elastic wave velocities significantly decrease, while surface conductivity significantly increases. Clay minerals enhance surface conductivity through interfacial polarization effects and reduce rock stiffness, which exacerbates the attenuation of P-wave and S-wave velocities.
- (2)
- Resistivity exhibits exponential growth with decreasing water saturation (Sw), particularly when Sw < 40%, where disruption of conductive pathways causes a sharp resistivity increase. Surface conductivity is pore fluid-dominated at high saturations but relies on clay-induced interfacial polarization at low saturations, accompanied by reduced surface conductivity.
- (3)
- Based on the MGEMTIP and Kuster-Toksöz models, we established quantitative relationship models for porosity-saturation-electrical properties. These models indicate that in areas with high porosity and saturation, electrical resistivity and wave velocities are both low, while surface conductivity is significantly increased; we also developed a quantitative template for relationships between P-wave/S-wave velocities and electrical resistivity/surface conductivity.
- (4)
- The model and quantitative template established in this paper are based on sandstone experimental data from the specific geological background of the Tarim Kuqa Foreland Basin, and their conclusions may be constrained by regional strata conditions.
Author Contributions
Conceptualization: J.C., L.Y. and K.X.; Methodology: J.C., K.X. and X.T.; Validation: K.X., J.C. and X.T.; Investigation: J.C.; Resources: Y.S., Z.H., L.Y. and K.X.; Writing-original draft: J.C.; Writing-review & editing: K.X. and X.T. All authors have read and agreed to the published version of the manuscript.
Funding
This research was funded by the scientific and technological project of China National Petroleum Corporation: Research on Joint Monitoring and Evaluation Method of Multi-physical Fields for Oil and Gas Reservoirs (2023ZZ05-06), and the National Natural Science Foundation of China (Grant No. 42174083, 42204079, 42030805 and 42274087).
Data Availability Statement
The original contributions presented in this study are included in the article. Further inquiries can be directed to the corresponding author.
Acknowledgments
We thank the Department of Geophysical and Geochemical Prospecting, BGP, CNPC.
Conflicts of Interest
Authors Yanling Shi and Zuzhi Hu were employed by the company China National Petroleum Corporation. The remaining authors declare that the research was conducted in the absence of any commercial or financial relationships that could be construed as a potential conflict of interest.
References
- Li, J.; Wu, Z.Y.; Zeng, D.Q.; Chen, G.Y. Exploration and Development Technologies for Deep Tight Sandstone Gas Reservoirs; Petroleum Industry Press: Beijing, China, 2002. [Google Scholar]
- Spencer, C.W. Geologic aspects of tight gas reservoir in the Rocky Mountain Regions. J. Pet. Technol. 1985, 37, 1308–1314. [Google Scholar] [CrossRef]
- Spencer, C.W. Review of Characteristics of Low-Permeability Gas Reservoirs in Western United States. AAPG Bull. 1989, 73, 613–629. [Google Scholar] [CrossRef]
- Zhao, C.L.; Chen, L.H. China’s Natural Gas Reservoirs; Petroleum Industry Press: Beijing, China, 1999. [Google Scholar]
- Zeng, D.Q.; Li, S.Z. Types and geological characteristics of low-permeability sandstone reservoirs in China. Acta Pet. Sin. 1994, 15, 38–45. [Google Scholar] [CrossRef]
- Zhang, J.; Yin, Y.; Zhang, G. Rock physics modelling of porous rocks with multiple pore types: A multiple-porosity variable critical porosity model. Geophys. Prospect. 2020, 68, 955–967. [Google Scholar] [CrossRef]
- Archie, G.E. The electrical resistivity log as an aid in determining some reservoir characteristics. Trans. Aime 1942, 146, 54–62. [Google Scholar] [CrossRef]
- Yin, J.Q.; Zhao, Y. Optimization method for saturation models in medium-low porosity and permeability sandstone reservoirs of M6 fault block. Well Logging Technol. 2017, 41, 46–51. [Google Scholar] [CrossRef]
- Xiang, K.; Yan, L.J.; Hu, H.; Yang, H.; Wen, B.H.; Su, Z. Gravity-magnetic-electrical property modeling and reservoir induced polarization response characteristics of Precambrian strata in Tarim Basin. Chin. J. Geophys. 2023, 66, 1589–1602. [Google Scholar]
- Pelton, W.H.; Ward, S.H.; Hallof, P.G.; Sill, W.R.; Nelson, P.H. Mineral discrimination and removal of inductive coupling with multifrequency IP. Geophysics 1978, 43, 588. [Google Scholar] [CrossRef]
- Dias, C.A. Analytical Model for a Polarizable Medium at Radio and Lower Frequencies. J. Geophys. Res. Atmos. 1972, 77, 4945–4956. [Google Scholar] [CrossRef]
- Lesmes, D.P.; Morgan, F.D. Dielectric spectroscopy of sedimentary rocks. J. Geophys. Res. Solid Earth 2001, 106, 13329–13346. [Google Scholar] [CrossRef]
- Zhdanov, M. Generalized effective-medium theory of induced polarization. Geophysics 2008, 73, F197–F211. [Google Scholar] [CrossRef]
- Tong, X.; Yan, L.; Kui, X. Modifying the generalized effective-medium theory of induced polarization model in compacted rocks. Geophys. J. Soc. Explor. Geophys. 2020, 85, MR245–MR255. [Google Scholar] [CrossRef]
- Nordsiek, S.; Weller, A. A new approach to fitting induced-polarization spectra. Geophysics 2008, 73, F235–F245. [Google Scholar] [CrossRef]
- Xiang, K.; Yan, L.J.; Shi, Y.L.; Hu, Z.Z.; Yu, G. Complex resistivity response characteristics of marine shale and prediction of total organic carbon content in the Middle-Upper Yangtze Region. Chin. J. Geophys. 2024, 67, 4400–4416. [Google Scholar] [CrossRef]
- Cheng, C.H. Crack models for a transversely isotropic medium. J. Geophys. Res. Solid Earth 1993, 98, 675–684. [Google Scholar] [CrossRef]
- Hunt, C.P.; Moskowitz, B.M.; Banerjee, S.K. Rock Physics & Phase Relations: A Handbook of Physical Constants; American Geophysical Union: Washington, DC, USA, 1995. [Google Scholar] [CrossRef]
- Biot, M.A. Theory of propagation of elastic waves in a fluid-saturated porous solid: II. Higher frequency range. J. Acoust. Soc. Am. 1956, 28, 168–178. [Google Scholar] [CrossRef]
- Norris, A.N. A differential scheme for the effective moduli of composites. Mech. Mater. 1985, 4, 1–16. [Google Scholar] [CrossRef]
- Zimmerman, R.W. Compressibility of Sandstones; Developments in Petroleum Science; Elsevier: Amsterdam, The Netherlands, 1991. [Google Scholar]
- Sarout, J.; Guéguen, Y. Anisotropy of elastic wave velocities in deformed shales: Part 1—Experimental results. Geophysics 2008, 73, 91. [Google Scholar] [CrossRef]
- Kuster, G.T.; Toksöz, M.N. Velocity and attenuation of seismic waves in two-phase media: Part, I. Theoretical formulations. Geophysics 1974, 39, 581–595. [Google Scholar] [CrossRef]
- Berryman, J.G. Long-wavelength propagation in composite elastic media I. Spherical inclusions. Acoust. Soc. Am. J. 1980, 68, 1809–1819. [Google Scholar] [CrossRef]
- Leravalec, M.; Gueguen, Y. High- and low-frequency elastic moduli for a saturated porous/cracked rock-differential self-consistent and poroelastic theories. Geophysics 1996, 61, 1080–1094. [Google Scholar] [CrossRef]
- Mavko, G.; Mukerji, T.; Dvorkin, J. The Rock Physics Handbook; Cambridge University Press: Cambridge, UK, 2003. [Google Scholar] [CrossRef]
- Sarout, J.; Guéguen, Y. Anisotropy of elastic wave velocities in deformed shales: Part 2-Modeling results. Geophysics 2008, 73, D91–D103. [Google Scholar] [CrossRef]
- Grana, D. Bayesian linearized rock-physics inversion. Geophysics 2016, 81, D625–D641. [Google Scholar] [CrossRef]
- Gao, G.; Abubakar, A.; Habashy, T.M. Joint petrophysical inversion of electromagnetic and full-waveform seismic data. Geophysics 2012, 77, WA3–WA18. [Google Scholar] [CrossRef]
- Han, T.; Liu, S.; Xu, D.; Fu, L.Y. Pressure-dependent cross-property relationships between elastic and electrical properties of partially saturated porous sandstones. Geophysics 2020, 85, MR107–MR115. [Google Scholar] [CrossRef]
- Liu, C.; Zhao, J.L.; Zhang, X.Q.; Wang, J.P.; Zhou, P.; Zeng, Q.L. Control effect of vertical stress zonation on reservoirs: A case study of the Kuqa foreland thrust belt, Tarim Basin. Nat. Gas Explor. Dev. 2019, 42, 21–31. [Google Scholar]
- Duan, Y.J.; Huang, S.Y.; Luo, C.M.; Zhou, S.Y.; Kang, Q.; Wang, X.; Wei, H.X. Structural deformation characteristics of multi-detachment-layer in the Kuqa foreland thrust belt of the Tarim Basin. Nat. Gas Geosci. 2024, 35, 1544–1556. [Google Scholar]
- Lei, G.L.; Xie, H.W.; Zhang, J.Z.; Wang, Y.R.; Huang, S.Y.; Ye, M.L.; Zhang, G.W. Structural characteristics of the Kuqa Depression Kuqa structural zone and natural gas exploration. Pet. Nat. Gas Geol. 2007, 28, 816–820+835. [Google Scholar]
- Du, J.H.; Wang, Z.M.; Hu, S.Y.; Wang, Q.H.; Xie, H.W. Formation conditions and geological characteristics of deep-seated large-scale gas fields in the Kuqa foreland thrust belt. Pet. Explor. Dev. 2012, 39, 385–393. [Google Scholar] [CrossRef]
- Tong, X.L.; Yan, L.J.; Xiang, K. Characteristics analysis of low-frequency complex resistivity of shale under formation conditions. Oil Geophys. Prospect. 2020, 59, 9. [Google Scholar]
Disclaimer/Publisher’s Note: The statements, opinions and data contained in all publications are solely those of the individual author(s) and contributor(s) and not of MDPI and/or the editor(s). MDPI and/or the editor(s) disclaim responsibility for any injury to people or property resulting from any ideas, methods, instructions or products referred to in the content. |
© 2025 by the authors. Licensee MDPI, Basel, Switzerland. This article is an open access article distributed under the terms and conditions of the Creative Commons Attribution (CC BY) license (https://creativecommons.org/licenses/by/4.0/).