Abstract
The composition of platinum group minerals localized in sulfide droplets from peridotites of the Zhelos intrusion was studied on a scanning electron microscope and on an electron probe microanalyzer. As part of this study, also an analytical approach based on the variation in accelerating voltage, electron beam intensity and probe diameter is considered in order to estimate the X-ray generation region, when analyzing PGM microinclusions comparable in size to the radiation generation region or smaller. Estimates were made of the possibility of reducing the size of the local analysis area when the accelerating voltage was reduced. The influence of the matrix composition on the results of the local analysis of PGM microphases and accuracy of the Pd and Pt content determination was also evaluated. The findings of the experiments conducted allowed for the successful identification of elements belonging to the PGM microphases and the host matrix. This approach enabled the estimation of the precise levels of impurity elements in their composition. Using a scanning electron microscope in the automatic scanning mode for the detection of heavy elements, 10 single and composite grains of three platinum group minerals larger than 5 µm and 22 microphases ranging in size from 0.3 to 4 µm were detected in the sulfide droplets. The large phases are merenskyite, omeiite and michenerite, with merenskyite being predominant. Among the microscopic inclusions were identified Pd-Bi-Te, Os-Ru-As and Rh-As-S phases. The composition of the studied palladium bismuthotelluride samples indicates a formation temperature range of 489–700 °C.
1. Introduction
The platinum group minerals (PGMs) are among the most difficult to study. In addition to the platinum metals, more than 20 other elements are involved in the formation of these minerals. Depending on the particular platinum group element, a variety of combinations, stoichiometric ratios and structural types can be observed. In the last few decades, there has been a considerable increase in the knowledge of the mineralogy of the platinum group elements [1,2,3,4,5,6,7,8,9,10,11,12,13,14,15,16,17,18,19,20,21,22]. This expansion can be explained by considering two main factors. Firstly, the identification of an increasing number of geological sites with the potential for platinoid mineralization has led to further research in this area. Secondly, the introduction and subsequent development of electron probe techniques has led to a significant expansion in the understanding of PGE mineralogy.
The main challenge in identifying platinum group minerals and characterizing new species in rocks is due to the uneven and random distribution of these minerals, as well as their rarity and tiny size. Furthermore, the very act of detecting them can present significant difficulties. However, in recent decades, methods of automated image analysis based on scanning electron microscopy have replaced the traditional time-consuming methods of searching and analyzing platinum group minerals in situ [23,24,25,26,27,28,29,30,31,32,33]. At the same time, when determining the composition of phases whose size is comparable to the area of generation of the analyzed X-ray radiation (1–5 μm, depending on the excitation conditions), the analytical signal contains signals of inclusion elements (PGE) and elements of the surrounding sulfide or silicate matrix. This leads to difficulties in identifying whether the impurity elements belong to the microphase under investigation or to the surrounding matrix. The size of the X-ray generation region depends on parameters such as the accelerating voltage, the size of the focused electron beam and the average atomic number of the irradiated surface region. Some researchers suggest using a lower electron beam acceleration voltage—5 kV [34,35] instead of the 15–25 kV recommended by instrument manufacturers. This allows the size of the local area of analysis to be reduced. It is generally accepted that the sum of the obtained concentrations can be used as an indicator of the quality of the analysis, with a value close to 100 wt.% being optimal [36]. However, in the case of micron-sized particles, this parameter must be used with caution, unless the identity of the impurity elements from the particle or matrix has been established. Furthermore, despite numerous publications devoted to the analysis of PGE phase inclusions [14,29,37], the accuracy in determining the PGE contents of micro inclusions remains uncertain.
This study presents mineralogical data for primary magmatic sulfide droplets from peridotites of the Zhelos Massif, central Eastern Sayan, Russia. We have identified compositional heterogeneity in bismuthotellurides, which reflects the temperature regime under which they formed. As part of this study, also an analytical approach based on the variation in accelerating voltage, electron beam intensity and probe diameter is considered in order to estimate one of the important parameters, the X-ray generation region, when analyzing PGM microinclusions comparable in size to the radiation generation region or smaller. The measurements were performed for PdLα- and PtLα-lines using the electron probe microanalysis (EPMA) and the scanning electron microscope (SEM) methods. A comparison of Pd and Pt content determinations was performed in order to assess the uncertainty of the inclusion composition for elements with different atomic numbers, with different recording of analytical line intensities and with different methods of matrix effect correction and calculation of the content of elements being determined.
2. Geological Summary
The Neoproterozoic (ca. 720 Ma) Irkutsk Magmatic Province [38,39] is in southern Siberia. It consists of Ni-Cu-PGE ore-bearing ultrabasic complexes and dolerite dike swarms [40]. The intrusions of the central part of Eastern Sayan, including Zhelos, belong to these ore-bearing complexes.
The Zhelos intrusion is located in the central part of Eastern Sayan (South Siberia, Russia) (Figure 1a). Ultramafic intrusions are common in this region. Ultramafic rocks form lenticular and arcuate bodies with apparent widths of 20 to 700 m and lengths of 0.1 to 7 km, divided into separate blocks by a series of faults. The intrusions, previously dyke- and sill-shaped bodies, have been folded and metamorphosed together with the host rocks of the volcanogenic–sedimentary complex [41]. The host rocks are various gneisses, marbles and orthoamphibolites (Figure 1b). Contacts with the host rocks are mostly obscured by plicative deformation. The Zhelos intrusion consists of rocks ranging from lherzolite to olivine pyroxenite, with gradual transitions from one type to another. Lherzolite is the dominant rock type in the Zhelos intrusion, accounting for about 70% of its total volume. It is typically characterized by a lack of visible layering and consists mainly of an olivine-chromite mesocumulate with interstitial pyroxenes, sulfides and ilmenite. This rock is made up of 50–85 vol.% olivine, 10–20 vol.% clinopyroxene and 10–15 vol.% orthopyroxene. The chromite content does not exceed 5 vol.%. Olivine pyroxenite contains 15–40 vol.% olivine. The remaining minerals are mainly clinopyroxene and small amounts of sulfides and ilmenite. The spatial variation in rock types from lherzolite to olivine pyroxenite is expressed by regular changes in MgO, SiO2, Al2O3 and TiO2 contents within the intrusion.
Four types of sulfide ores are found in the intrusion: (1) disseminated with sulfide contents of 5–15 vol.%; (2) net-textured (15–30 vol.% sulfides); (3) massive with sulfide contents up to 80 vol.%; and (4) vein disseminated and massive in host rocks [41,42]. Pyrrhotite (troilite) + pentlandite ± chalcopyrite is the most common sulfide association in disseminated, net-textured and massive ores. The disseminated ores sometimes contain sulfide droplets consisting of aggregates of pyrrhotite, pentlandite and chalcopyrite. The vein ores in the host amphibolites consist of pyrrhotite or chalcopyrite.
Troilite forms thin lamellae in hexagonal pyrrhotite and anhedral polycrystalline aggregates. Monoclinic pyrrhotite occurs only in vein ores. Chalcopyrite and pentlandite occur mostly as anhedral polycrystalline aggregates, and pentlandite is present as exsolved flames in pyrrhotite. Pentlandite lamellae and flames are common in chalcopyrite, and mackinawite “worms” are ubiquitous in pentlandite. Cobaltite-gersdorffite is common in all types of ores. In addition, rhenium sulfides with a composition similar to tarkianite have been found in the vein ores [43].
PGMs are present in all ore types [41,42,44], although they are most abundant and diverse in the net-textured ore [45]. Analyses of the species composition of platinum group minerals selected from crushed ore samples with a net texture via density separation in water showed [46] that among the platinum group minerals, iridium and rhodium sulphoarsenides (~70%), irarsite (IrAsS) and hollingworthite (RhAsS), respectively, are abundant in this ore. The only platinum mineral, sperrylite (PtAs2), is the second most abundant (~10%). The remaining platinum group minerals are represented by compounds of Pd with Te, As, Bi and Sb (TABS). A few grains of omeiite ((Os, Ru)As2) are also present. Platinum group minerals increase in size from disseminated to net-textured ores. These minerals are usually found within sulfide aggregates or at the margins of silicates.
Sulfide droplets from the base of the massif have not previously been studied. Their structure and sulfide composition are presented below in Section 4.2.
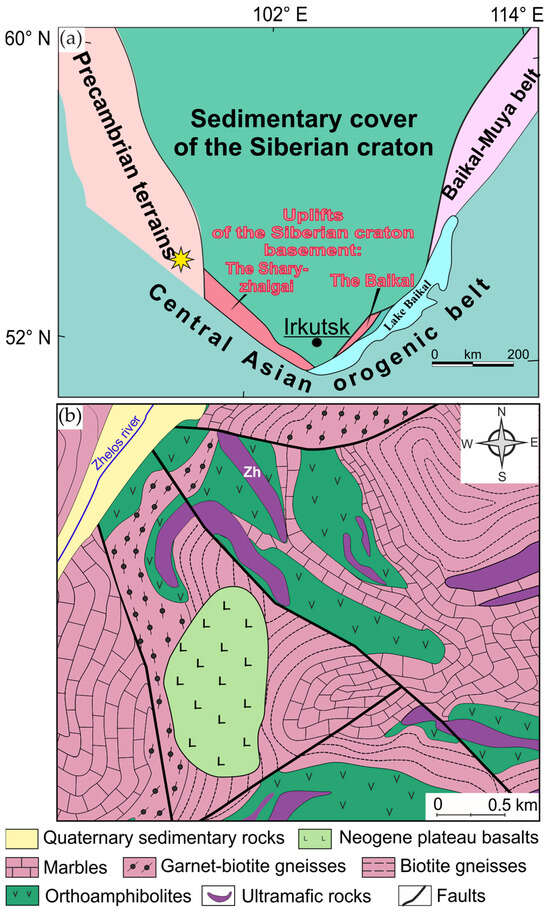
Figure 1.
(a) Location of the Zhelos intrusion (yellow star) in the tectonic structures of South Siberia. The data used to create this map are sourced from [46]; (b) simplified geological map of the area where the Zhelos intrusion (Zh) is located. The map is based on proprietary data.
3. Materials and Methods
3.1. Materials
The samples used for this study were collected from outcrops found in an exploration ditch (Figure 2). The microphases of platinum group minerals were studied in sulfide droplets from disseminated ore samples in peridotite from the basal part of the Zhelos intrusion.
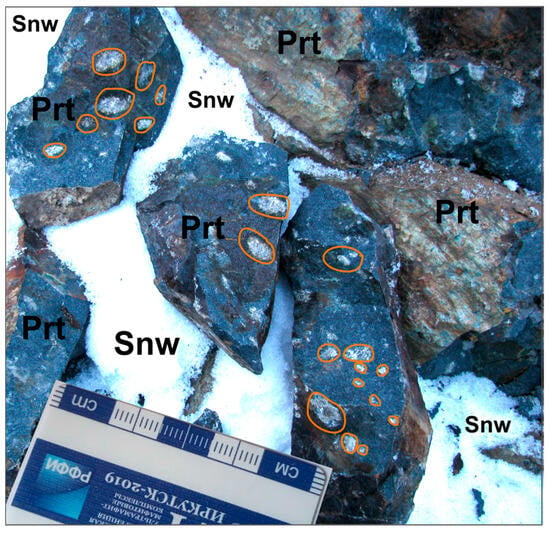
Figure 2.
The image depicts a peridotite (Prt) outcrop with sulfide drops (outlined in orange), visible within the exploration ditch wall. Snw—snow cover.
The composition of sulfides and PGMs was determined in situ on polished sections. Samples were polished with diamond paste with an abrasive size of 0.5 μm and then coated with a conductive carbon layer of ~20 nm thickness.
3.2. Equipment and Measurement Modes
The measurements were performed at the Center of Isotope and Geochemical Research for Collective Use (A. P. Vinogradov Institute of Geochemistry of the Siberian Branch of the Russian Academy of Sciences) [47]. The scanning electronic microscope (SEM) TIMA 3 LMH FEG (TESCAN, Brno, Czech Republic) equipped with PulseTor 30 (EDAX Element 30 in compatibility mode, TESCAN, Brno, Czech Republic) energy dispersive detectors in automatic scanning mode for heavy element detection (“bright phase search”) was used to identify the platinum group minerals and determine the element contents. The instrument was operated with an accelerating voltage of 25 kV, a working distance of 15 mm, a scan step (pixel size) of 0.2 µm and 1000 X-ray events per pixel.
The elemental composition was studied using an SEM MIRA 3 LMH (TESCAN, Czech Republic) and a Superprobe JXA-8200 X-ray spectral electron probe microanalyzer (JEOL Ltd., Tokyo, Japan). Scanning electron microscopy was used to study the surface and shape of the inclusions and to characterize their size and distribution in the sulfide mineral matrix based on both secondary (SE) and backscattered electron (BSE) imaging. The elemental composition of the inclusions and the basic surrounding matrix was determined using a MIRA 3 SEM equipped with an AztecLive Advanced Ultim Max 40 microanalysis system with an energy dispersive spectrometer (EDS) (Oxford Instruments Analytical Ltd., Abingdon, UK). The analysis was performed at accelerating voltages of 10, 15, 20 kV, an absorbed current of 4.4–4.6 nA and magnifications from 1690× to 18,130×.
Matrix correction was performed using the modification of the XPP method [48] implemented in the software of the Aztec Energy microanalysis system (version 2.0.20430.1.).
To calculate the concentrations, we used the production standardization for pure elements and reference samples of pure metals, as well as sulfide minerals of known composition, certified as Standard Reference Materials (SRM) at the Institute of Geology and Mineralogy of the Siberian Branch of the Russian Academy of Sciences, Novosibirsk. The standards used were as follows: pure metals (Pt, Pd, Te, Bi); pyrite FeS2 (Fe, S); chalcopyrite CuFeS2 (Cu); FeNiCo alloy (Co, Ni). At accelerating voltages of 15, 20 kV, the Kα line was used for the analysis of Fe, S, Co, Ni, Cu; the Lα line was used for the analysis of Pd, Te, Pt, and the Mα line was used for the determination of Bi. At an accelerating voltage of 10 kV, the Lα line was used to determine Cu.
The chemical composition of the inclusions was determined using a Superprobe JXA-8200 electron (Oxford Instruments Analytical Ltd., Abingdon, UK) probe microanalyzer with a crystal diffraction spectrometer. The instrument was operated at an acceleration voltage of 20 kV, beam current of 20 nA and beam diameter of 1 μm. The Fe, Co, Ni Kα lines were measured using a LIF crystal, the Cu Kα line was analyzed using a LIFH crystal, and the S Kα line was registered using a PETJ crystal. The Pd Lα line was analyzed using a PETJ crystal, the As Lα line was analyzed using a TAP crystal, and the PtMα-, BiMα- and TeLα-lines were measured using a PETJ crystal. The duration of the measurement at the peak of the analytical line was 10 s, and in the background position, the measurements lasted 5 s on both sides of the line peak. Matrix element correction was performed using the ZAF algorithm implemented in the software of the Superprobe JXA-8200 microanalyzer (Oxford Instruments Analytical Ltd., Abingdon, UK). The same pure metal and sulfide mineral samples mentioned above were used as comparison samples.
4. Results and Discussion
4.1. Assessing the Factors Influencing the Determination of Pt and Pd in Microphases in the Surrounding Sulfide Matrix
4.1.1. Estimation of the Generation Range of the Analyzed X-Ray Radiation
Model calculations of the shape of the X-ray generation region, performed using the Monte Carlo method, are given in [34,35,49]. Its shape can be described as almost spherical. Figure 3 and Figure 4 show images for PdSn and PtAs2 and PdLα- (2.838 keV) and PdLα-line intensities (9.442 keV) along the trajectory crossing the particle boundary in the chalcopyrite (CuFeS2) matrix. The results of the analysis were normalized to the maximum intensity in the particle. The point marks in the figure indicate the measurement results, and the approximation of a smooth hyperbolic sine function is shown by solid curves. The dotted lines approximately correspond to the particle boundary for three different trajectories at different voltages.
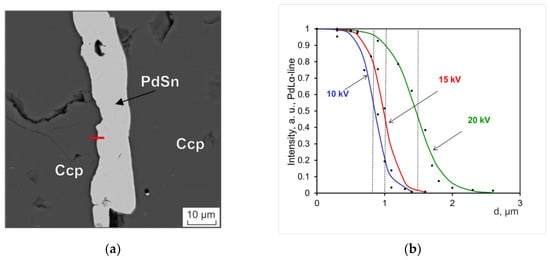
Figure 3.
(a) BSE image of the PdSn particle in the chalcopyrite matrix; (b) dependence of the PdLa-line intensity on the coordinate of the electron beam focus. Hereinafter, in the text, the abbreviations of mineral names are given according to [50].
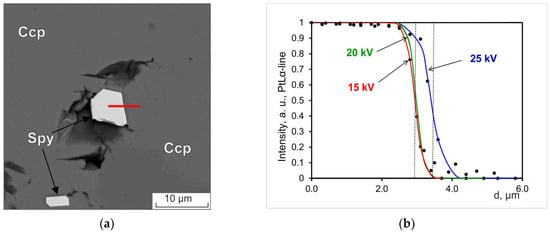
Figure 4.
(a) BSE image of the PtAs2 particle in the chalcopyrite matrix; (b) dependence of the PtLα line intensity on the coordinate of the electron beam focus.
The dependences of the intensity on the distance along the trajectory (d) were used to determine the size of the region of the analyzed X-ray radiation generation. The linear size of the generation region (D) corresponds to the distance from the point with the maximum intensity to the point with the minimum intensity, being close to zero. The measurements of the generation region obtained in this way are given in Table 1 and Table 2. They also include the estimates of the generation region in the point electron probe approximation of infinitesimal size calculated by using the Castaing formula given in [34,51] and by using the formula proposed in [52].

Table 1.
Estimation of the size of the generation region (D, μm) of the PdLα-line emission for a PdSn particle in a chalcopyrite matrix.

Table 2.
Estimation of the size of the generation region (D, μm) of the PdLα-line emission for the PtLα-line emission for a PtAs2 particle in a chalcopyrite matrix.
The electron beam diameter varied in the range of 4.2–9.1 μm depending on the voltage and beam intensity; its size was significantly smaller than the region of X-ray generation, and therefore, the focusing of a point electron probe can be regarded as satisfactory. The measured size D was larger than that calculated when focusing the point probe, particularly at an accelerating voltage of 10 kV for the PdLα line and 15 kV for the PtLα line. For the SEM MIRA 3, operation at a voltage of 20 kV provided the best conditions for focusing the electron beam. This may explain the larger difference between the measured and calculated generation region with the lowering of the accelerating voltage.
X-ray microanalysis analyzes the composition of microvolume in which the excitation of X-rays (the generation region) by an electron beam occurs. Particles whose size is larger than the X-ray generation region are considered to be “massive” particles. The particles of such a size provided better accuracy in determining the composition, since the matrix correction methods assume a “massive” sample. Therefore, at a voltage of 20 kV, Pd determinations in mineral particles larger than 5.2 μm and Pt determinations in particles larger than 5.4 μm were assumed as reliable. Lowering the accelerating voltage did not lead to the expected decrease in the size of the local analysis region, calculated using the formulae in [34,51,52]. For particles smaller than those above, the spectrum almost always contained lines from elements of the matrix surrounding the particle, due to the excitation by electrons, not absorbed in the particle.
4.1.2. Matrix Element Fluorescence Emission
When electrons interact with the analyzed inclusion in the microvolume, in addition to the characteristic X-ray radiation of the elements, a “continuous spectrum” of bremsstrahlung arises [34,35,52,53]. This excites the secondary fluorescent emission of the elements in the surrounding matrix, including those in underlying phases, provided the particle is relatively “thin”. Fluorescent emission can arise at a significantly large distance from the point where the probe hits the inclusion and will be present in the spectrum of the inclusion, even if its size exceeds the size of the generation region. For example, when determining the composition of a stibiopalladinite (PdxSby) inclusion in a pentlandite matrix (Figure 5), the bremsstrahlung emission produced in the particle will excite the fluorescence of the matrix elements Fe, Ni and S.
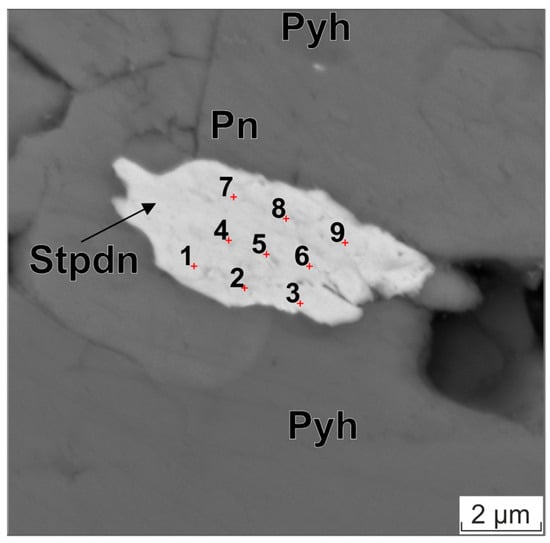
Figure 5.
BSE image of stibiopalladinite particle in pentlandite–pyrrhotite matrix. The red cross and Arabic numeral indicate the analysis points. Pyh—pyrrhotite, Pn—pentlandite, Stpdn—stibiopalladinite.
The free path length of a bremsstrahlung X-ray photon with an energy of 10 keV (corresponding to half the value of the accelerating voltage of 20 kV) in the particle substance and in the pentlandite matrix substance is approximately 10–15 μm. This radiation will escape from the particle and excite fluorescence of the elements Ni, Fe and S, which will be recorded by the detector. In the determination of Pt, the primary L-series radiation excited in the sperrylite particle in the energy range 9.44–11.25 keV will also excite fluorescence in the sulfide matrix elements. This circumstance complicates the identification of impurity elements belonging to the inclusion or surrounding matrix.
The results of the composition analysis of a Pd5Sb2 particle, measuring approximately 9 × 5 μm, are displayed in Table 3. The particle is surrounded by a pentlandite matrix. The image of this particle is presented in Figure 5. The measurements were conducted on an SEM MIRA 3 scanning electron microscope at 20 kV. Table 3 shows the elemental composition determined at nine points on the particle. It also shows estimates of the average content calculated from points 4–6, as well as the normalized composition, which was calculated without considering the matrix elements. The normalized particle composition was found to be stoichiometrically close to that of stibiopalladinite, whose ideal formula is Pd5Sb2 [54].

Table 3.
Composition of the stibiopalladinite particle, % wt.
Estimates of the fluorescence effect were performed using equations similar to those presented in [50]. Calculating the effect of fluorescence excited by bremsstrahlung radiation yields the following values: Ni: 3%, Fe: 5%, S: 1.5%, rms. These values are comparable to the level of “detectable” contents of matrix elements in the particle (see Table 3). Consequently, the categorization of these elements as impurities within the particle cannot be definitively established. High negative correlation coefficients (R ≈ −0.96) between the “detected” concentrations of pentlandite matrix elements (Ni, Fe, S) and Pd indicate that these elements are not part of the particle.
4.1.3. Evaluation of the Accuracy of Pd and Pt Determination
When the analysis results were considered, it was noted that the error in determining the composition of the stoichiometric phases of stibiopalladinite and sperrylite was less than 1% rel. However, the error in determining the contents of phases containing the heavy element Bi was significantly greater. Therefore, a comparison of the determination of the Pd and Pt contents was carried out to assess the uncertainty in the composition of inclusions for elements with different atomic numbers and different intensities of analytical lines, as well as different methods of correcting matrix effects and calculating the elemental contents. The accuracy of the determination of the Pd and Pt content in the inclusions was assessed by comparing them with the stoichiometric composition of the froodite and sperrylite inclusions.
In order to evaluate the uncertainty inherent in the analysis of the PGM microphases composition, a comparison was made between the results of Pd and Pt determinations obtained via the use of a Superprobe JXA-8200 microanalyzer (GEOL, Tokyo, Japan) with crystal diffraction channels at accelerating voltages of 20 kV and an SEM MIRA 3 at accelerating voltages of 10, 15 and 20 kV.
Table 4 presents the results of the compositional analysis of one of the mineral phases, which is a part of a two-phased intergrowth approximately 5 × 10 microns in size. The intergrowth is found within chalcopyrite, as shown in Figure 6. The composition of this phase (see Figure 6) corresponds to froodite. It was determined that the concentrations of Fe and Cu (approximately 1.5% by weight) as determined by the Kα-lines of the X-ray spectrum should be excluded from the calculations, since such levels are likely to have resulted from the fluorescence of elements contained within the matrix.

Table 4.
Froodite composition (wt.%) at an accelerating voltage of 20 kV (EPMA) and 20, 15 and 10 kV (SEM EDS).
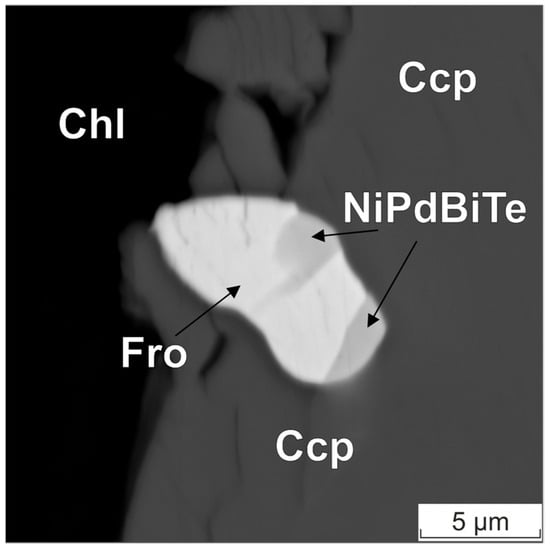
Figure 6.
BSE image of the froodite–NiPdBiTe intergrowth. Ccp—chalcopyrite, Fro—froodite, Chl—chlorite.
Table 4 presents the concentrations, which have been obtained by averaging four measurements taken at varying points in the particle, along with the standard deviation estimates. The table also provides the normalized concentration values and deviations from PdBi2 stoichiometry. The deviations from the stoichiometric composition are 1.2–1.8% wt., and the sign of the deviation is different for measurements performed using the JXA-8200 and SEM MIRA3 instruments (Oxford Instruments Analytical Ltd., Abingdon, UK).
The matrix correction methods employed by the software of both instruments result in close absolute systematic error for the studied substance and determination conditions. As predicted based on the evaluations of the X-ray generation area performed at different accelerating voltages and the evaluation of the influence of the fluorescence emission of the surrounding matrix elements, a decrease in the accelerating voltage does not improve the accuracy of determining the Pd and Pt content in the analyzed inclusions.
Table 5 shows the results of the analysis of several PGM grains with a size of approximately 5 × 10 microns, surrounded by chalcopyrite and clinopyroxene (Figure 7). Microprobe analyses were performed at an accelerating voltage of 20 kV and compared with the results of the SEM MIRA3 LMH obtained at different voltages of 10, 15, 20 kV. The analyses were conducted at 12 distinct points and areas of the minerals, with the greatest possible distance from the edge of the particles.

Table 5.
Michenerite composition (wt.%) at an accelerating voltage of 20, 15 and 10 kV.
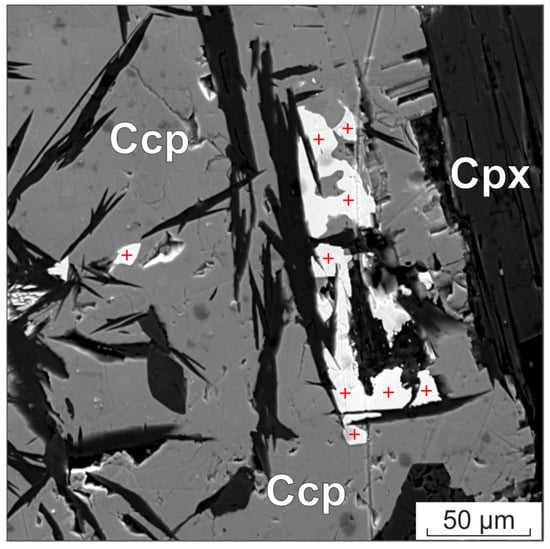
Figure 7.
BSE image of michenerite grains in an aggregate of chalcopyrite and clinopyroxene. The position of the analysis points is indicated by the red cross. Ccp—chalcopyrite, Cpx—clinopyroxene.
The results of the determination of the Pd, Te and Bi contents at different voltages on the SEM MIRA 3 showed minor differences compared to the standard deviation of the measurements. However, the systematic difference between the measurements made on the JXA-8200 microanalyzer and the SEM MIRA 3 significantly exceeds the standard deviation, at approximately 1.5 wt.% for Pd and Bi and approximately 0.9 wt.% for Te.
Table 6 presents the results of the study of the composition of a large homogeneous grain of sperrylite (Figure 8), which can be considered “massive” from the point of view of microanalysis. The study was carried out on the SEM MIRA 3 at 20 kV using PtLα-line and PtMα-line as the analytical line and on JXA-8200 at 20 kV using PtMα-line as the analytical line.

Table 6.
Sperrylite composition (wt.%).
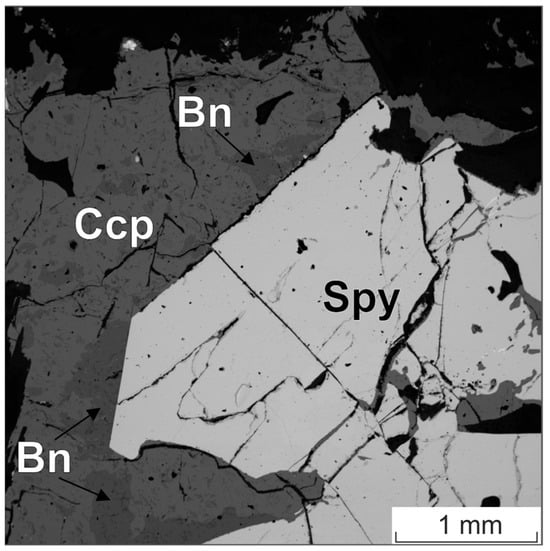
Figure 8.
BSE image of the sperrylite (Spy) grain in an aggregate of chalcopyrite (Ccp) and bornite (Bn).
The accuracy of Pt determination in the sperrylite stoichiometric phase (~0.3% wt.) was comparable to the accuracy of Pd determination in stibiopalladinite, and was several times better than that of Pd determination in the froodite PdBi2 particle (~1.5% wt.).
Thus, the SEM MIRA 3 operating mode recommended by the manufacturer with an accelerating voltage of 20 kV seems to be preferable also for small micron inclusions, as it allows a better focusing of the electron probe. Reducing the accelerating voltage to 15 kV or 10 kV does not improve the accuracy of the composition determination. Estimates of the composition uncertainty are independent of the accelerating voltage.
4.2. Results of the Zhelos Massif Sulfide Droplets Study
4.2.1. Base Metal Sulfide
The structure of sulfide droplets does not show clear zonation (Figure 9a). They mainly consist of iron monosulfides (hexagonal pyrrhotite and troilite or mackinawite), pentlandite and chalcopyrite (Figure 9b), with their percentages varying between 50%–60%, 30%–50% and 5%–10%, respectively. They also contain sphalerite, which does not exceed 0.5%, and magnetite. In most sulfide droplets, magnetite is present in small amounts, but in some cases, its share can reach up to 30%.
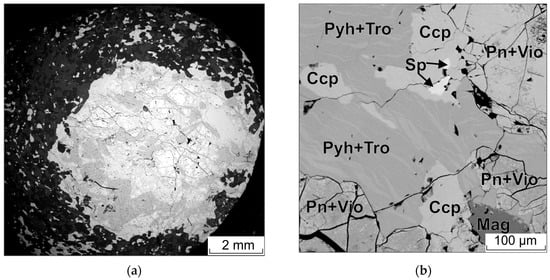
Figure 9.
(a) BSE image of a sulfide droplet; (b) enlarged portion of (a). Pyh—pyrrhotite, Tro—troilite, Pn—pentlandite, Vio—violarite, Ccp—chalcopyrite, Sp—sphalerite.
The composition of sulfides is presented in Tables S1–S3.
A mineral with a composition of FeS occurs as a flame-like exsolution in pyrrhotite (Figure 9b). The chemical composition of pyrrhotite is close to the theoretical formula of hexagonal pyrrhotite Fe11S12. In some cases, it contains up to 0.3 wt.% Ni.
There are two types of pentlandite. One is homogeneous, while the other contains thin lamellae (Figure 9b) whose composition corresponds to that of violarite. Homogeneous pentlandite contains cobalt (0.9–1.1 wt.%) and is occasionally distinguished by a S deficiency. In contrast, the composition of the second type of pentlandite is characterized by an absence of cobalt and an excess of S. The Fe/Ni ratio in both types of pentlandite varies within the range of 1.05–1.19. Violarite contains Co in the range of 1.0–1.3 wt.%, and is also characterized by a deficiency in S.
Chalcopyrite occurs mainly in pyrrhotite. It is less commonly found between aggregates of pyrrhotite and pentlandite. Chalcopyrite has an almost stoichiometric composition with the presence of Ni sometimes up to 0.9% by weight.
Sphalerite inclusions are found only within chalcopyrite. Their size varies from 5 × 5 to 10 × 20 microns. The composition is non-stoichiometric and corresponds to the formula (Zn0.89Fe0.12Cu0.01)1.2S0.98.
4.2.2. Platinum Group Minerals
A total of 10 platinum group mineral inclusions larger than 5 microns and 22 microinclusions ranging in size from 0.3 to 4 microns were found. Large inclusions were as follows: an intergrowth of michenerite, omeiite and merenskyite with hessite (Figure 10a,b); an intergrowth of merenskyite with hessite (Figure 10d); an intergrowth of omeiite with merenskyite (Figure S1); an intergrowth of merenskyite with gersdorffite (Figure S2); one grain of omeiite (Figure 10c); and five grains of merenskyite (Figures S1–S4). The mineral compositions are given in the Supplementary Materials, Tables S4–S10.
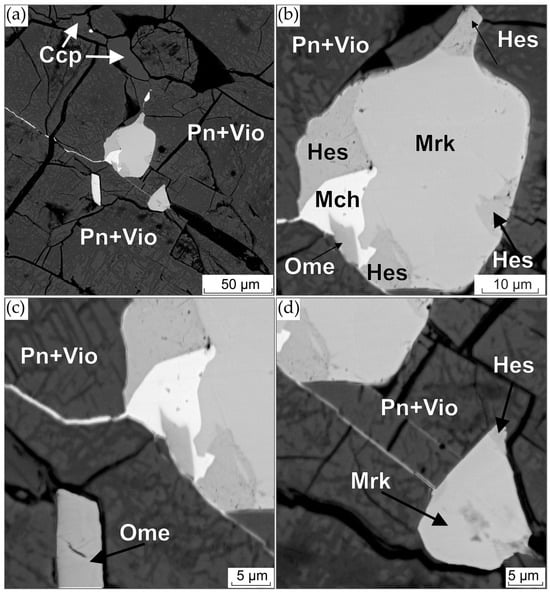
Figure 10.
(a) BSE image of PGM and hessite intergrowth in sulfides; (b–d) enlarged images of platinum group minerals from (a): (b) merenskyite (Mrk), michenerite (Mch), omeiite (Ome) and hessite (Hes) intergrowth; (c) lower left omeiite grain; (d) lower right merenskyite grain.
Merenskyite occurs as both idiomorphic and hypidiomorphic grains of 3 × 5, 7 × 10, 10 × 15, 15 × 20 and 20 × 30 µm, as well as intergrowths with hessite, omeiite, merenskyite and gersdorffite. In most cases, it is found in pentlandite of the second type and in one case, in magnetite on the border with pentlandite. Fe and Ni are always present in merenskyite with contents ranging from 0.2 to 1.8 and 2.5 to 4.0 wt.%, respectively. The higher values at some points, such as Table S8, point 15 and Table S10, points 9 and 10, are due to the effect of fluorescence emission of pentlandite and magnetite matrix elements, respectively. Merenskyite from the intergrowths with omeiite and michenerite (Figure 10b) is characterized by the lowest Fe and Ni contents. Merenskyite forming an intergrowth with omeiite (Figure S1) has the highest concentrations of these elements. The Fe and Ni content of the single grains is similar. The Bi and Te contents also vary considerably. In two grains of merenskyite from intergrowths with omeiite and gersdorffite, these elements make up 10.6 to 12.6 and 59.0 to 59.9 wt.%, respectively. Merenskyites of similar composition have been found in the Creighton mine of the Sudbury Area [55]. In other grains, the contents of Bi and Te vary from 9.0 to 10.2 and from 61.0 to 62.2 wt.%, respectively. All grains are characterized by the predominance of the sum of atomic quantities of Fe, Ni and Pd over the sum of atomic quantities of Bi and Te. In general, merenskyites from sulfide droplets have higher bismuth contents than merenskyites from net-textured ores (Figure 11a).

Figure 11.
(a) The ternary Pd-Te-Bi diagram for Pd bismuthotelluride from sulfide droplets (violet) and net-textured (green) ores [42,46]; (b) the ternary Os-Ru-Pd diagram for omeiite from sulfide droplets (violet) and net-textured (green) ores [42,46].
Michenerite is only found in one intergrowth with omeiite, merenskyite and hessite (Figure 10b). Maps of the approximate distribution of elements in this intergrowth are shown in Figure S6. Michenerite contains small amounts of Fe and Ni, 0.4 and 0.3 wt.%, respectively. Its formula can be expressed as (Pd1.01Fe0.03Ni0.02)1.06Bi0.82Te1.11. Like merenskyite, it is characterized by the predominance of the sum of the atomic quantities of Fe, Ni and Pd over the sum of the atomic quantities of Bi and Te and also has an excess of Te over Bi. Michenerite from sulfide droplets has a higher concentration of tellurium compared to michenerite from net-textured ores (Figure 11a).
As previously stated, omeiite was found in different forms, including intergrowth with palladium bismuthotellurides (see Figure 10b); intergrowth with merenskyite (see Figure S1); and as an idiomorphic grain measuring 7 × 12 microns (see Figure 10c). The content of the anduoite (RuAs2) end member in the composition of omeiite varies from 17 to 33 mol. %. The maximum ruthenium content (12 wt.%) was recorded in omeiite found in aggregate with merenskyite (see Table S8). A comparison of omeiite from sulfide droplets with that from net-textured ores reveals a wider range of ruthenium contents (Figure 11b) and higher concentrations of palladium and rhodium.
The composition of the phases smaller than 5 microns was only qualitatively determined. Among these microscopic inclusions, the following phases were identified: Pd-Bi-Te, Os-Ru-As and Rh-As-S. Their percentages are 46, 44 and 10%, respectively. Phases containing Pd, Bi and Te are most likely merenskyite; Os, Ru, As-omeiite; and Rh, As, S-hollingworthite.
Pd-Bi-Te phases have been identified within pentlandite and chalcopyrite (see Figure 12a,b). In certain instances, these phases have been observed to form intergrowths with Rh-As-S-containing phases (Figure 12a). Os-Ru-As-containing phases have been identified within pentlandite with violarite lamellae (Figure 12c). Additionally, these phases have been observed at the pyrrhotite–magnetite boundary (Figure 12d).
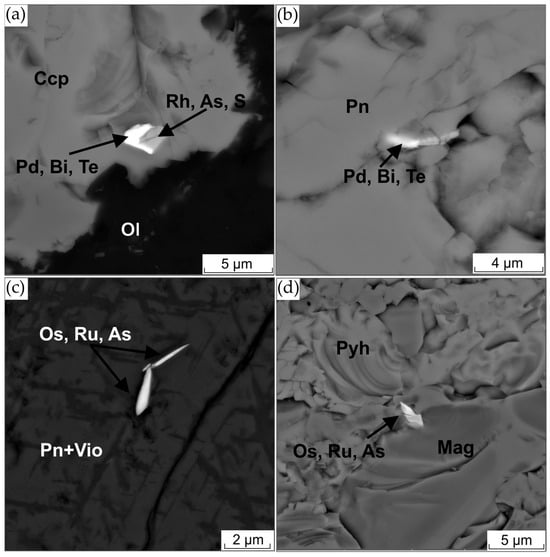
Figure 12.
(a) BSE image of Pd-Bi-Te and Rh-As-S phase intergrowth in chalcopyrite (Ccp); (b) Pd-Bi-Te; (c) Os-Ru-As phase in pentlandite; (d) Os-Ru-As phase at the contact between pyrrhotite and magnetite.
In addition to microinclusions containing platinum group elements, microinclusions containing rhenium were identified in pentlandite (Figure S6). The size of these inclusions varies from 0.3 × 2 microns to 2 × 4 microns.
4.3. Preliminary Ideas About the Genesis of Platinum Group Minerals in Sulfide Droplets of the Zhelos Massif
A number of difficulties are encountered during the study of platinum group minerals. These arise due to two factors: the small grain size of the minerals and the non-uniform distribution of the minerals within the surrounding matrix. The resolution of these issues is facilitated via X-ray microtomographic scanning [56,57]. This methodology facilitates the analysis of the composition and distribution of PGMs in three-dimensional space. However, this methodology was not employed in the present studies. Consequently, we are only able to propose preliminary hypotheses concerning the origin of the platinum group minerals in sulfide droplets from peridotites of the Zhelos massif.
In magmatic sulfide deposits, palladium and platinum occur as separate platinum group minerals that are closely related to base metal sulfides. The formation of such minerals can occur either as a consequence of a magmatic process or at lower temperatures as a result of exsolution [58]. This depends on the form in which platinum and palladium are distributed in magmatic sulfide phases. They can be cation substitutes or be present in the form of stable nanoparticles of Pd and Pt ligands [58,59,60]. The results from experiments conducted in recent years indicate that Pt and Pd minerals nucleate at magmatic temperatures and grow via the assembly of PGE–ligand nanoparticles rather than by exsolution of cationic and anionic metal species from the BMS [58,59,60]. Chalcophile elements such as Te, As, Bi and Sb play an important role in the formation of platinum minerals. They are essential ligands for noble metals and form a wide range of PGE minerals of different composition. According to experimental data [61], they are incompatible for monosulfide solid solution (Mss) at 950 °C. The composition and relationships of the platinum group minerals with the host BSM in sulfide droplets from peridotite of the Zhelos massif suggest that their formation occurs as a result of such assembling of PGE–ligand nanoparticles.
Merenskyite from sulfide droplets of the Zhelos intrusion has an unusual composition, slightly deviating from stoichiometry. In most cases, merenskyites from different deposits form a trend along the merenskyite–froodite line in the Pd-Te-Bi ternary diagram. In our case, the merenskyite compositions form a compact field between the points of ideal merenskyite and kotulskite compositions. This suggests that the observed phase is a solid solution of merenskyite and kotulskite. Experiments by Hofmann and McLean [59] showed that a complete solid solution exists between these minerals at temperatures between 575 ± 10 and 710 ± 10 °C. An increased tellurium content in some merenskyite grains indicates higher temperatures of their formation.
The composition of the michenerite studied shows a deficiency of bismuth and an excess of tellurium. The formation of such michenerite could occur in the temperature range of 489–500 °C [62].
5. Conclusions
The present study constitutes the first research to determine the composition of PGMs in sulfide droplets found in peridotites of the Zhelos intrusion. Prior to the analysis, all factors that could affect the accuracy of determining the composition of the microscopic phases of platinum group minerals in the sulfide base must be given due consideration. The following results were obtained:
It can be stated with a high degree of confidence that, at a voltage of 20 kV, the determination of palladium in mineral particles larger than 5.2 µm and platinum in particles larger than 5.4 µm will be reliable. Estimates of the generation region in Pd- and Pt-containing particles depend on the accelerating voltage, the diameter of the electron beam focus and the excitation energies of their analytical lines and can be extended to other similar equipment. It has been demonstrated that a reduction in accelerating voltage does not result in the anticipated reduction in the size of the local analysis area.
The estimation of the effect of fluorescence excited by bremsstrahlung radiation results in the following effect values: Ni-3%, Fe-5% and S-1.5%, rms. These values are comparable to the level of “detectable” contents of matrix elements in the particle. Consequently, the categorization of these elements as impurities within the particle cannot be definitively established.
The SEM MIRA 3 operation mode recommended by the manufacturer, with an accelerating voltage of 20 kV, appears to be optimal for small micron inclusions, as it facilitates enhanced electron probe focusing. It has been demonstrated that a reduction in accelerating voltage to 15 kV or 10 kV has no effect on the accuracy of the composition of platinum group minerals. Estimates of compositional uncertainty are independent of the accelerating voltage.
Ten single and composite grains of three platinum group minerals, each measuring over 5 µm, and 22 microphases ranging in size from 0.3 to 4 µm, were detected in the sulfide droplets. The larger phases are merenskyite, omeiite and michenerite, with merenskyite predominant. Among the microscopic inclusions, Pd-Bi-Te, Os-Ru-As and Rh-As-S phases were identified.
The presence of minerals of intermediate composition between kotulskite and merenskyite (solid solution), absence of merenskyite decomposition structures with the formation of kotulskite, and intergrowths of merenskyite and michenerite indicate that the studied palladium bismuthotellurides were formed at temperatures of 489–700 °C.
Supplementary Materials
The following supporting information can be downloaded at: https://www.mdpi.com/article/10.3390/min15060612/s1, Figure S1: BSE image of merenskyite (Mrk) grain and merenskyite-omeiite intergrowth in the pentlandite (Pn)-violarite (Vio) aggregate; Figure S2: BSE image of merenskyite (Mrk) grain and merenskyite–gersdorffite intergrowth in the pentlandite (Pn), violarite (Vio), magnetite (Mag) aggregate; Figure S3: BSE image of merenskyite (Mrk) in the pentlandite (Pn)-violarite (Vio), aggregate; Figure S4: BSE image of merenskyite (Mrk) in the sulfide aggregate; Figure S5: (a) BSE image of PGM and hessite intergrowth in sulfides from Figure 10b; (b–f) Element maps showing approximate distribution of: (b) Pd; (c) Bi; (d) Te; (e) Ag; (f) Os; Figure S6: BSE image of rhenium-containing (Re) microinclusions. Table S1: Representative SEM-EDS analyses of pyrrhotite and troilite (wt.%); Table S2: Representative SEM-EDS analyses of pentlandite and violarite (wt.%); Table S3: Representative SEM-EDS analyses of chalcopyrite (wt.%); Table S4: SEM-EDS analyses of PGM and hessite from Figure 10b, wt.%; Table S5: SEM-EDS analyses of omeiite from Figure 10c, wt.%; Table S6: SEM-EDS analyses of merenskyite and hessite from Figure 10d, wt.%; Table S7: SEM-EDS analyses of omeiite and merenskyite from Figure S1, wt.%; Table S8: SEM-EDS analyses of merenskyite from Figure S2, wt.%; Table S9: SEM-EDS analyses of merenskyite from Figure S1, wt.%; Table S10: SEM-EDS analyses of merenskyite from Figure S3, wt.%.
Author Contributions
Conceptualization, A.L.F. and T.B.K.; methodology, A.L.F., A.V.N. and O.Y.B.; validation, A.L.F., A.V.N. and O.Y.B.; investigation, A.S.M.; resources, A.S.M.; data curation, T.B.K., A.V.N. and O.Y.B.; writing—original draft preparation, A.L.F. and T.B.K.; writing—review and editing, A.L.F. and T.B.K. All authors have read and agreed to the published version of the manuscript.
Funding
The study was performed by the governmental assignment in terms of Projects 0284-2021-0006 and 0284-2021-0005.
Data Availability Statement
Data are contained within the article and Supplementary Materials.
Acknowledgments
We thank “Intergeoproject” LLC, “VSNK” LLC and “GPP-Geological Company” LLC and personally V.A. Durasov, A.V. Rozhnikov, A.V. Salaev, A.I. Stekhin, and Yu.N. Kiselev for their assistance in carrying out field work.
Conflicts of Interest
The authors declare no conflicts of interest.
Abbreviations
The following abbreviations are used in this manuscript:
| EPMA | Electron probe microanalysis |
| PGE | Platinum Group elements |
| PGM | Platinum Group Minerals |
| BSE | Backscattered electron |
| TABS | Te, As, Bi, Sb |
References
- Yu, Z.; Cheng, F.; Ma, H. Lisiguangite, CuPtBiS3, a New Platinum-Group Mineral from the Yanshan Mountains, Hebei, China. Acta Geol. Sin.-Engl. Ed. 2009, 83, 238–244. [Google Scholar] [CrossRef]
- Vymazalová, A.; Laufek, F.; Drábek, M.; Stanley, C.J.; Baker, R.J.; Bermejo, R.; Garuti, G.; Thalhammer, O.; Proenza, J.; Longo, F. Zaccariniite, RhNiAs, a new platinum-group mineral from loma peguera, Dominican Republic. Can. Mineral. 2012, 50, 1321–1329. [Google Scholar] [CrossRef]
- McDonald, A.M.; Cabri, L.J.; Stanley, C.J.; Good, D.J.; Redpath, J.; Lane, G.; Spratt, J.; Ames, D.E. Coldwellite, Pd3Ag2S, a new mineral species from the Marathon deposit, Coldwell complex, Ontario, Canada. Can. Mineral. 2016, 53, 845–857. [Google Scholar] [CrossRef]
- Vymazalová, A.; Laufek, F.; Sluzhenikin, S.F.; Stanley, C.J. Norilskite, (Pd,Ag)7Pb4, a new mineral from Noril’sk-Talnakh deposit, Russia. Min. Mag. 2017, 81, 531–541. [Google Scholar] [CrossRef]
- Sluzhenikin, S.F.; Kozlov, V.V.; Stanley, C.J.; Lukashova, M.L.; Dicks, K. Vymazalováite, Pd3Bi2S2, a new mineral from the Noril’sk-Talnakh deposit, Krasnoyarskiy region, Russia. Min. Mag. 2018, 82, 367–373. [Google Scholar] [CrossRef]
- Grokhovskaya, T.L.; Karimova, O.V.; Vymazalová, A.; Laufek, F.; Chareev, D.A.; Kovalchuk, E.V.; Magazina, L.; Rassulov, V.A. Nipalarsite, Ni8Pd3As4, a new platinum-group mineral from the Monchetundra Intrusion, Kola Peninsula, Russia. Min. Mag. 2019, 83, 837–845. [Google Scholar] [CrossRef]
- Subbotin, V.V.; Vymazalová, A.; Laufek, F.; Savchenko, Y.E.; Stanley, C.J.; Gabov, D.A.; Plášil, J. Mitrofanovite, Pt3Te4, a new mineral from the East Chuarvy deposit, Fedorovo–Pana intrusion, Kola Peninsula, Russia. Min. Mag. 2019, 83, 523–530. [Google Scholar] [CrossRef]
- Ma, C.; Förster, H.-J.; Grundmann, G. Tilkerodeite, Pd2HgSe3, a New Platinum-Group Mineral from Tilkerode, Harz Mountains, Germany. Crystals 2020, 10, 687. [Google Scholar] [CrossRef]
- Vymazalová, A.; Laufek, F.; Grokhovskaya, T.L.; Stanley, C.J. Viteite, Pd5InAs, a new mineral from the Monchetundra layered intrusion, Kola Peninsula, Russia. Can. Mineral. 2020, 58, 395–402. [Google Scholar] [CrossRef]
- Vymazalová, A.; Zaccarini, F.; Garuti, G.; Laufek, F.; Mauro, D.; Stanley, C.J.; Biagioni, C. Bowlesite, PtSnS, a new platinum group mineral (PGM) from the Merensky Reef of the Bushveld Complex, South Africa. Min. Mag. 2020, 84, 468–476. [Google Scholar] [CrossRef]
- Barkov, A.Y.; Tolstykh, N.D.; Martin, R.F.; McDonald, A.M. Tamuraite, Ir5Fe10S16, a New Species of Platinum-Group Mineral from the Sisim Placer Zone, Eastern Sayans, Russia. Minerals 2021, 11, 545. [Google Scholar] [CrossRef]
- Grokhovskaya, T.L.; Vymazalová, A.; Laufek, F.; Stanley, C.J.; Borisovskiy, S.Y.E. Palladothallite, Pd3Tl, a new mineral from the Monchetundra layered intrusion, Kola Peninsula, Russia. Can. Mineral. 2021, 59, 1821–1832. [Google Scholar] [CrossRef]
- Makvandi, S.; Pagé, P.; Tremblay, J.; Girard, R. Exploration for Platinum-Group Minerals in Till: A New Approach to the Recovery, Counting, Mineral Identification and Chemical Characterization. Minerals 2021, 11, 264. [Google Scholar] [CrossRef]
- McDonald, A.M.; Ames, D.E.; Kjarsgaard, I.M.; Cabri, L.J.; Zhe, W.; Ross, K.C.; Good, D.J. Marathonite, Pd25Ge9, and palladogermanide, Pd2Ge, two new platinum-group minerals from the Marathon deposit, Coldwell Complex, Ontario, Canada: Descriptions, crystal-chemical considerations, and genetic implications. Can. Mineral. 2021, 59, 1865–1886. [Google Scholar] [CrossRef]
- McDonald, A.M.; Kjarsgaard, I.M.; Cabri, L.J.; Ross, K.C.; Ames, D.E.; Bindi, L.; Good, D.J. Oberthurite, Rh3(Ni,Fe)32S32 and torryweiserite, Rh5Ni10S16, two new platinum-group minerals from the Marathon deposit, Coldwell Complex, Ontario, Canada: Descriptions, crystal-chemical considerations, and comments on the geochemistry of rhodium. Can. Mineral. 2021, 59, 1833–1863. [Google Scholar] [CrossRef]
- Sidorov, E.G.; Kutyrev, A.V.; Zhitova, E.S.; Agakhanov, A.A.; Sandimirova, E.I.; Vymazalova, A.; Chubarov, V.M.; Zolotarev, A.A. Kufahrite, PtPb, a new mineral from Ledyanoy Creek placer, Galmoenan ultramafic complex, Koryak Highlands, Russia. Min. Mag. 2021, 85, 254–261. [Google Scholar] [CrossRef]
- Barkov, A.Y.; Tolstykh, N.D.; Martin, R.F.; Tamura, N.; Ma, C.; Nikiforov, A.A. Kuvaevite, Ir5Ni10S16, a New Mineral Species, Its Associations and Genetic Features, from the Sisim River Placer Zone, Eastern Sayans. Russ. Geol. Geoph. 2022, 63, 1373–1387. [Google Scholar] [CrossRef]
- Nishio-Hamane, D.; Saito, K. Platinum–group minerals in the placer deposit in northwestern Hokkaido, Japan: Description of a new mineral, tomamaeite. J. Mineral. Petrol. Sci. 2022, 117, 009. [Google Scholar] [CrossRef]
- Vymazalová, A.; Welch, M.D.; Laufek, F.; Kozlov, V.V.; Stanley, C.J.; Plášil, J. Sluzhenikinite, Pd15(Sb7−xSnx)3≤x≤4, a new platinum group mineral (PGM) from the Oktyabrsk deposit, the Noril`sk deposits, Russia. Min. Mag. 2022, 86, 577–585. [Google Scholar] [CrossRef]
- Belogub, E.V.; Britvin, S.N.; Shilovskikh, V.V.; Pautov, L.A.; Kotlyarov, V.A.; Zaykova, E.V. Zaykovite, Rh3Se4, a new mineral from the Kazan placer, South Urals, Russia. Min. Mag. 2023, 87, 118–129. [Google Scholar] [CrossRef]
- Cabri, L.J.; McDonald, A.M.; Oberthür, T.; Tamura, N.; Vymazalová, A.; Ross, K.C.; Melcher, F. Andrieslombaardite, RhSbS, a new platinum-group mineral from the platiniferous Onverwacht Pipe, Republic of South Africa. S. Afr. J. Geol. 2023, 126, 151–160. [Google Scholar] [CrossRef]
- Vlasov, E.A.; Mochalov, A.G.; Vigasina, M.F.; Shcherbakov, V.D.; Plechov, P.Y. Platinum group minerals of the Baimka gold placer cluster, Western Chukotka: The new data. Mosc. Univ. Bull. Ser. 4 Geol. 2024, 79, 87–99. [Google Scholar] [CrossRef]
- Oberthür, T.; Melcher, F.; Sitnikova, M.; Rudashevsky, N.S.; Rudashevsky, V.N.; Cabri, L.J.; Lodziak, J.; Klosa, D.; Gast, L. Combination of novel mineralogical methods in the study of noble metal ores—Focus on pristine (Bushveld, Great Dyke) and placer platinum mineralisation. In Proceedings of the ICAM 2008, Kottayam, Kerala State, India, 18–21 February 2008; pp. 187–193. [Google Scholar]
- Miranda, P. Mineral Liberation Analysis of PGM, gold, and silver projects. In Proceedings of the 34th International Precious Metals Institute Annual Conference, Tucson, AZ, USA, 12–15 June 2010; pp. 452–466. [Google Scholar]
- Dzvinamurungu, T.; Viljoen, K.S.; Knoper, M.W.; Mulaba-Bafubiandi, A. Geometallurgical characterisation of Merensky Reef and UG2 at the Marikana Mine, Bushveld Complex, South Africa. Min. Eng. 2013, 52, 74–81. [Google Scholar] [CrossRef]
- Ford, F.D.; Wercholaz, C.R.; Lee, A. Predicting process outcomes for Sudbury platinum-group minerals using grade-recovery modeling from mineral liberation analyzer (MLA) data. Can. Mineral. 2011, 49, 1627–1642. [Google Scholar] [CrossRef]
- Rose, D.; Viljoen, F.; Knoper, M.; Rajesh, H. Detailed assessment of platinum-group minerals associated with chromitite stringers in the Merensky reef of the Eastern Bushveld Complex, South Africa. Can. Mineral. 2011, 49, 1385–1396. [Google Scholar] [CrossRef]
- Viljoen, F.; Knoper, M.; Rajesh, H.; Rose, D.; Greeff, T. Application of a Field Emission Mineral Liberation Analyser to the in-situ Study of Platinum-Group Element Mineralisation in the Merensky Reef of the Bushveld Complex, South Africa. In Proceedings of the 10th International Congress for Applied Mineralogy (ICAM); Springer: Berlin/Heidelberg, Germany, 2012; pp. 757–764. [Google Scholar] [CrossRef]
- Osbahr, I.; Krause, J.; Bachmann, K.; Gutzmer, J. Efficient and Accurate Identification of Platinum-Group Minerals by a Combination of Mineral Liberation and Electron Probe Microanalysis with a New Approach to the Offline Overlap Correction of Platinum-Group Element Concentrations. Microsc. Microanal. 2015, 21, 1080–1095. [Google Scholar] [CrossRef]
- Oberthür, T. The Fate of Platinum-Group Minerals in the Exogenic Environment—From Sulfide Ores via Oxidized Ores into Placers: Case Studies Bushveld Complex, South Africa, and Great Dyke, Zimbabwe. Minerals 2018, 8, 581. [Google Scholar] [CrossRef]
- Kaufmann, F.E.D.; Hoffmann, M.C.; Bachmann, K.; Veksler, I.V.; Trumbull, R.B.; Hecht, L. Variations in composition, texture, and platinum group element mineralization in the lower group and middle group chromitites of the northwestern Bushveld Complex, South Africa. Econ. Geol. 2019, 114, 569–590. [Google Scholar] [CrossRef]
- Wilton, D.H.C.; Saumur, B.M.; Gordon, A.; Williamson, M.C. Enigmatic massive sulphide mineralization in the high arctic Large Igneous Province, Nunavut, Canada. Can. J. Earth Sci. 2019, 56, 790–801. [Google Scholar] [CrossRef]
- Gritsenko, Y.D.; Kondrikova, A.P.; Gilbricht, S.; Schoneveld, L.; Barnes, S.J.; Godel, B.M.; Sluzhenikin, S.; Petrenko, D.; Seifert, T.; Yudovskaya, M.A. Quantitative assessment of the relative roles of sulfide liquid collection, magmatic degassing and fluid-mediated concentration of PGE in low-sulfide ores of the Norilsk intrusions. Ore Geol. Rev. 2022, 148, 105042. [Google Scholar] [CrossRef]
- Fournelle, J.; Cathey, H.; Pinard, P.T.; Richter, S. Low voltage EPMA: Experiments on a new frontier in microanalysis—Analytical lateral resolution. IOP Conf. Ser. Mater. Sci. Eng. 2016, 109, 012003. [Google Scholar] [CrossRef]
- Wuhrer, R.; Moran, K. Low voltage imaging and X-ray microanalysis in the SEM: Challenges and opportunities. IOP Conf. Ser. Mater. Sci. Eng. 2016, 109, 012019. [Google Scholar] [CrossRef]
- Lavrent’ev, Y.G.; Usova, L.V. The sum of component concentrations as a quality indicator in X-ray electron probe microanalysis of minerals. Rus. Geol. Geoph. 2018, 59, 1827–1835. [Google Scholar] [CrossRef]
- Nesterenko, G.V.; Zhmodik, S.M.; Belyanin, D.K.; Airiyants, E.V.; Karmanov, N.S. Micrometric Inclusions in Platinum-Group Minerals from Gornaya Shoria, Southern Siberia, Russia: Problems and Genetic Significance. Minerals 2019, 9, 327. [Google Scholar] [CrossRef]
- Ernst, R.E.; Hamilton, M.A.; Söderlund, U.; Hanes, J.A.; Gladkochub, D.P.; Okrugin, A.V.; Kolotilina, T.B.; Mekhonoshin, A.S.; Bleeker, W.; LeCheminant, A.N.; et al. Long-lived connection between southern Siberia and northern Laurentia in the Proterozoic. Nat. Geosci. 2016, 9, 464–472. [Google Scholar] [CrossRef]
- Mekhonoshin, A.S.; Ernst, R.; Söderlund, U.; Hamilton, M.A.; Kolotilina, T.B.; Izokh, A.E.; Polyakov, G.V.; Tolstykh, N.D. Relationship between platinum-bearing ultramafic-mafic intrusions and large igneous provinces (exemplified by the Siberian Craton). Russ. Geol. Geophys. 2016, 57, 822–833. [Google Scholar] [CrossRef]
- Pu, J.P.; Macdonald, F.A.; Schmitz, M.D.; Rainbird, R.H.; Bleeker, W.; Peak, B.A.; Hamilton, M.A. Emplacement of the Franklin large igneous province and initiation of the Sturtian Snowball Earth. Sci. Adv. 2022, 8, eadc9430. [Google Scholar] [CrossRef]
- Mekhonoshin, A.S.; Kolotilina, T.B.; Pavlova, L.A. First find of PGE minerals in sulfide ores related to ultrabasic rocks of the IIsk-Kuksher Trough, Southern Siberia. Dokl. Earth Sci. 2008, 419A, 435–437. [Google Scholar] [CrossRef]
- Kolotilina, T.B.; Mekhonoshin, A.S.; Orsoev, D.A. PGE distribution in sulfide ores from ultramafic massifs of the central East Sayan Mountains, Southern Siberia, Russia. Geol. Ore Depos. 2016, 58, 20–36. [Google Scholar] [CrossRef]
- Kolotilina, T.B.; Mekhonoshin, A.S.; Orsoev, D.A. Re Sulfides from Zhelos and Tokty-Oi Intrusions (East Sayan, Russia). Minerals 2019, 9, 479. [Google Scholar] [CrossRef]
- Orsoev, D.A.; Mekhonoshin, A.S.; Kanakin, S.V. PGE-Cu-Ni sulphide mineralization in the ultramafic rocks of the Zhelos and Tokty-Oy massifs (East Sayan). In Proceedings of the 12th International Platinum Symposium, Yekaterinburg, Russia, 11–14 August 2014. [Google Scholar]
- Tolstykh, N.D.; Podlipskiy, M.Y.; Orsoev, D.A. The PGE- mineralization of the net-textured Ni—Cu—Sulfide Ore of Zhelos intrusion. In Proceedings of the 12th international Ni-Cu- (PGE) Symposium, Guiyang, China, 16–21 June 2012. [Google Scholar]
- Buslov, M.M. Terrain tectonics of the Central Asian folded belt. Geodyn. Tectonoph. 2014, 5, 641–665. [Google Scholar] [CrossRef]
- Skuzovatov, S.Y.; Belozerova, O.Y.; Vasil’eva, I.E.; Zarubina, O.V.; Kaneva, E.V.; Sokolnikova, Y.V.; Chubarov, V.M.; Shabanova, E.V. Centre of Isotopic and Geochemical Research (IGC SB RAS): Current State of Micro- and Macroanalysis. Geod. Tectonoph. 2022, 13, 0585. (In Russian) [Google Scholar] [CrossRef]
- Pouchou, J.-L.; Pichoir, F. Quantitative Analysis of Homogeneous or Stratified Microvolumes Applying the Model “PAP”. In Electron Probe Quantitation; Heinrich, K.F.J., Newbury, D.E., Eds.; Springer Science+Business Media: New York, NY, USA, 1991; pp. 31–75. [Google Scholar]
- Llovet, X.; Proenza, J.A.; Pujol-Solà, N.; Farré-De-Pablo, J.; Campeny, M. Correction of Secondary Fluorescence across Phase Boundaries in Electron Probe Microanalysis of Mineral Inclusions. Micros. Microanal. 2020, 26, 895–905. [Google Scholar] [CrossRef]
- Warr, L.N. IMA–CNMNC approved mineral symbols. Min. Mag. 2021, 85, 291–320. [Google Scholar] [CrossRef]
- Castaing, R. Electron probe microanalysis. Adv. Electron. Electron Phys. 1960, 13, 317–386. [Google Scholar]
- Tatarinov, V.V.; Kuzakov, A.S. Evaluation of the Characteristics of X-Ray Excitation under the Electron-Probe Effect Using 2D and 3D Modeling by the Monte Carlo Method. J. Surf. Investig. 2020, 14, 245–252. [Google Scholar] [CrossRef]
- Buse, B.; Wade, J.; Llovet, X.; Kearns, S.; Donovan, J.J. Secondary fluorescence in WDS: The role of spectrometer positioning. Micros. Microanal. 2018, 24, 604–611. [Google Scholar] [CrossRef]
- Bowles, J.F.W. Platinum-Group Minerals. In Encyclopedia of Geology: Volume 1–6, 2nd ed.; Elsevier: Amsterdam, The Netherlands, 2020; Volume 1, pp. 473–483. [Google Scholar] [CrossRef]
- Cabri, L.J.; Laflamme, J.H.G. The mineralogy of the platinum group elements from some Cu-Ni deposits in the Sudbury area, Ontario. Econ. Geol. 1976, 71, 1159–1195. [Google Scholar] [CrossRef]
- Godel, B.; Barnes, S.J.; Barnes, S.-J.; Maier, W.D. Platinum ore in three dimensions: Insights from high-resolution X-ray computed tomography. Econ. Geol. 2010, 38, 1127–1130. [Google Scholar] [CrossRef]
- O’Driscoll, B.; González-Jiménez, J.M. Petrogenesis of the Platinum-Group Minerals. Rev. Mineral. Geochem. 2016, 81, 489–578. [Google Scholar] [CrossRef]
- Helmy, H.M.; Botcharnikov, R.; Ballhaus, C.; Wirth, R.; Schreiber, A.; Buhre, S. How Pt and Pd are hosted in magmatic sulfides, substitutions and/or inclusions? Contrib. Mineral. Petrol. 2023, 178, 41. [Google Scholar] [CrossRef]
- Helmy, H.M.; Ballhaus, C.; Berndt, J.; Bockrath, C.; Wohlgemuth-Ueberwasser, C. Formation of Pt, Pd and Ni tellurides: Experiments in sulfide-telluride systems. Contrib. Mineral. Petrol. 2007, 153, 577–591. [Google Scholar] [CrossRef]
- Helmy, H.M.; Ballhaus, C.; Fonseca, R.O.C.; Leitzke, F.P. Concentrations of Pt, Pd, S, As, Se and Te in silicate melts at sulfide, arsenide, selenide and telluride saturation: Evidence of PGE complexing in silicate melts? Contrib. Mineral. Petrol. 2020, 175, 65. [Google Scholar] [CrossRef]
- Helmy, H.M.; Ballhaus, C.; Wohlgemuth-Ueberwasser, C.; Fonseca, R.O.C.; Laurenz, V. Partitioning of Se, As, Sb, Te and Bi between monosulfide solid solution and sulfide melt application to magmatic sulfide deposits. Geochim. Cosmochim. Acta 2010, 74, 6174–6179. [Google Scholar] [CrossRef]
- Hoffman, E.; MacLean, W.H. Phase relations of michenerite and merenskyite in the Pd-Bi-Te system. Econ. Geol. 1976, 71, 1461–1468. [Google Scholar] [CrossRef]
Disclaimer/Publisher’s Note: The statements, opinions and data contained in all publications are solely those of the individual author(s) and contributor(s) and not of MDPI and/or the editor(s). MDPI and/or the editor(s) disclaim responsibility for any injury to people or property resulting from any ideas, methods, instructions or products referred to in the content. |
© 2025 by the authors. Licensee MDPI, Basel, Switzerland. This article is an open access article distributed under the terms and conditions of the Creative Commons Attribution (CC BY) license (https://creativecommons.org/licenses/by/4.0/).