Article

High-Frequency Oolitic Tidal Cycles and Their Geochemical Signatures in the Upper Ediacaran Qigebulake Formation, NW Tarim Basin (China)

1
School of Geoscience and Technology, Southwest Petroleum University, Chengdu 610500, China
2
Sinopec International Petroleum Exploration and Production Corporation, Beijing 100029, China
*
Authors to whom correspondence should be addressed.
Minerals 2025, 15(6), 613; https://doi.org/10.3390/min15060613
Submission received: 6 May 2025 / Revised: 2 June 2025 / Accepted: 3 June 2025 / Published: 6 June 2025
(This article belongs to the Section Mineral Geochemistry and Geochronology)

Abstract

:
The Qigebulake Formation in the northwestern Tarim Basin records high-frequency oolitic tidal flat cycles formed during the Upper Ediacaran, a period marked by tectonic, volcanic, and hydrothermal events. This study presents a detailed petrographic and geochemical characterization of these cycles, focusing on their lithofacies development and implications for regional geological processes. Seven microfacies were identified, ranging from oolitic dolostone and dolothrombolite to siliciclastic dolomudstone and mudstone. Elemental trends indicate a systematic decline in SiO2, Al2O3, and TiO2 content with decreasing siliciclastic input, suggesting a shallowing-upward sequence. Volcaniclastic quartz grains, exhibiting embayed textures and bright-blue cathodoluminescence, are reported here for the first time in the Ediacaran of Tarim, supporting synsedimentary volcanic input. Positive δEu anomalies, coupled with low Al/(Al+Fe+Mn) and elevated Fe2O3/TiO2 and MnO/TiO2 ratios, reveal hydrothermal influence in upper-cycle dolostones. These signatures, combined with regional stratigraphy, suggest that the Qigebulake tidal flat records the interplay between deposition, volcanism, and fluid migration during the late Ediacaran. The findings provide new constraints on the evolution of peritidal environments and inform deep carbonate reservoir assessments in Tarim and similar cratonic basins.

1. Introduction

The study of peritidal carbonate has long been a focus of industrial interest due to its rich hydrocarbon resources and metal/non-metallic mineral deposits. In the context of oil and gas exploration and development, peritidal zones have been shown to possess the unique capability to form source rocks, reservoirs, and caprocks, with excellent source–reservoir–caprock assemblages [1]. In recent years, significant discoveries of tidal zone-associated oil and gas fields have been discovered in the Leikoupo formation of the Middle Triassic in the Sichuan basin [2], the Majiagou formation of the Ordovician in the Ordos basin [3], and the Xiaoerbulake formation of the Lower Cambrian in the Tarim Basin [4] in China, etc.
The development of exploration techniques has enabled the identification of the Qigebulake Formation of the Upper Ediacaran as a priority target for the exploration of hydrocarbons in the Tarim Basin. It is comprised of three to four third-order sequences, with the middle–upper sections being dominated by peritidal microbial dolostones [5,6,7]. The predominant lithofacies include stromatolites, thrombolites, spongiomicrobialites, oolitic dolostones, and peloidal dolostones [8,9,10]. Among these, up to 12 types of ooids have been identified, formed in tidal channels, shoals, and other environments [11]. The Ediacaran Period was distinguished by a variety of geological processes, including tectonic movements, volcanic eruptions, and hydrothermal activities. The results of regional geological surveys indicate that the Nanhua–Cambrian strata along the northeastern margin of the Tarim Basin contain multiple volcanic interlayers. This finding is indicative of episodic volcanic eruptions. In contrast, volcanic interlayers in the northwestern Tarim Basin are less abundant and predominantly concentrated in early Ediacaran strata, suggesting weaker volcanic activity compared to the northeastern margin [12,13]. During the late Ediacaran Period, the Tarim Block experienced regional uplift driven by the Kalpin Movement, resulting in a regional unconformity between the Ediacaran and Cambrian systems [14,15]. This was accompanied by weathering and karstification of the uppermost Ediacaran dolostones. This event also triggered a transition in the depositional systems of the Tarim Basin from rift–sag to platform–basin configurations [16]. In the Ediacaran Period, the study area also experienced multiple phases of hydrothermal activity. The analysis of field sections and drilling cores has revealed the presence of abundant hydrothermal dissolution vugs, which are filled with minerals such as saddle dolomite, barite, and fluorite. The formation of these vugs is attributable to hydrothermal alteration of dolostone reservoirs, as evidenced by studies [17,18,19]. As stated previously, the lithological and geochemical characteristics of high-frequency oolitic tidal flat cycles and their implications for regional geological processes have not been documented. The present study thus focused on the oolitic cycles in the upper Qigebulake Formation, conducting detailed petrographic and geochemical analyses. The objective of this work was twofold: firstly to ascertain the lithotypes, geochemical signatures, and vertical variations of microbial carbonates within high-frequency oolitic tidal cycles, and secondly to examine the correlations between the petrographic/geochemical signatures of oolitic cycles and regional geological processes (e.g., tectonic activity, volcanism, hydrothermal processes). The findings enhance the comprehension of ultradeep hydrocarbon exploration in the Qigebulake Formation whilst concomitantly furnishing a microscale petrographic framework conducive to the deciphering basin-scale geological events.

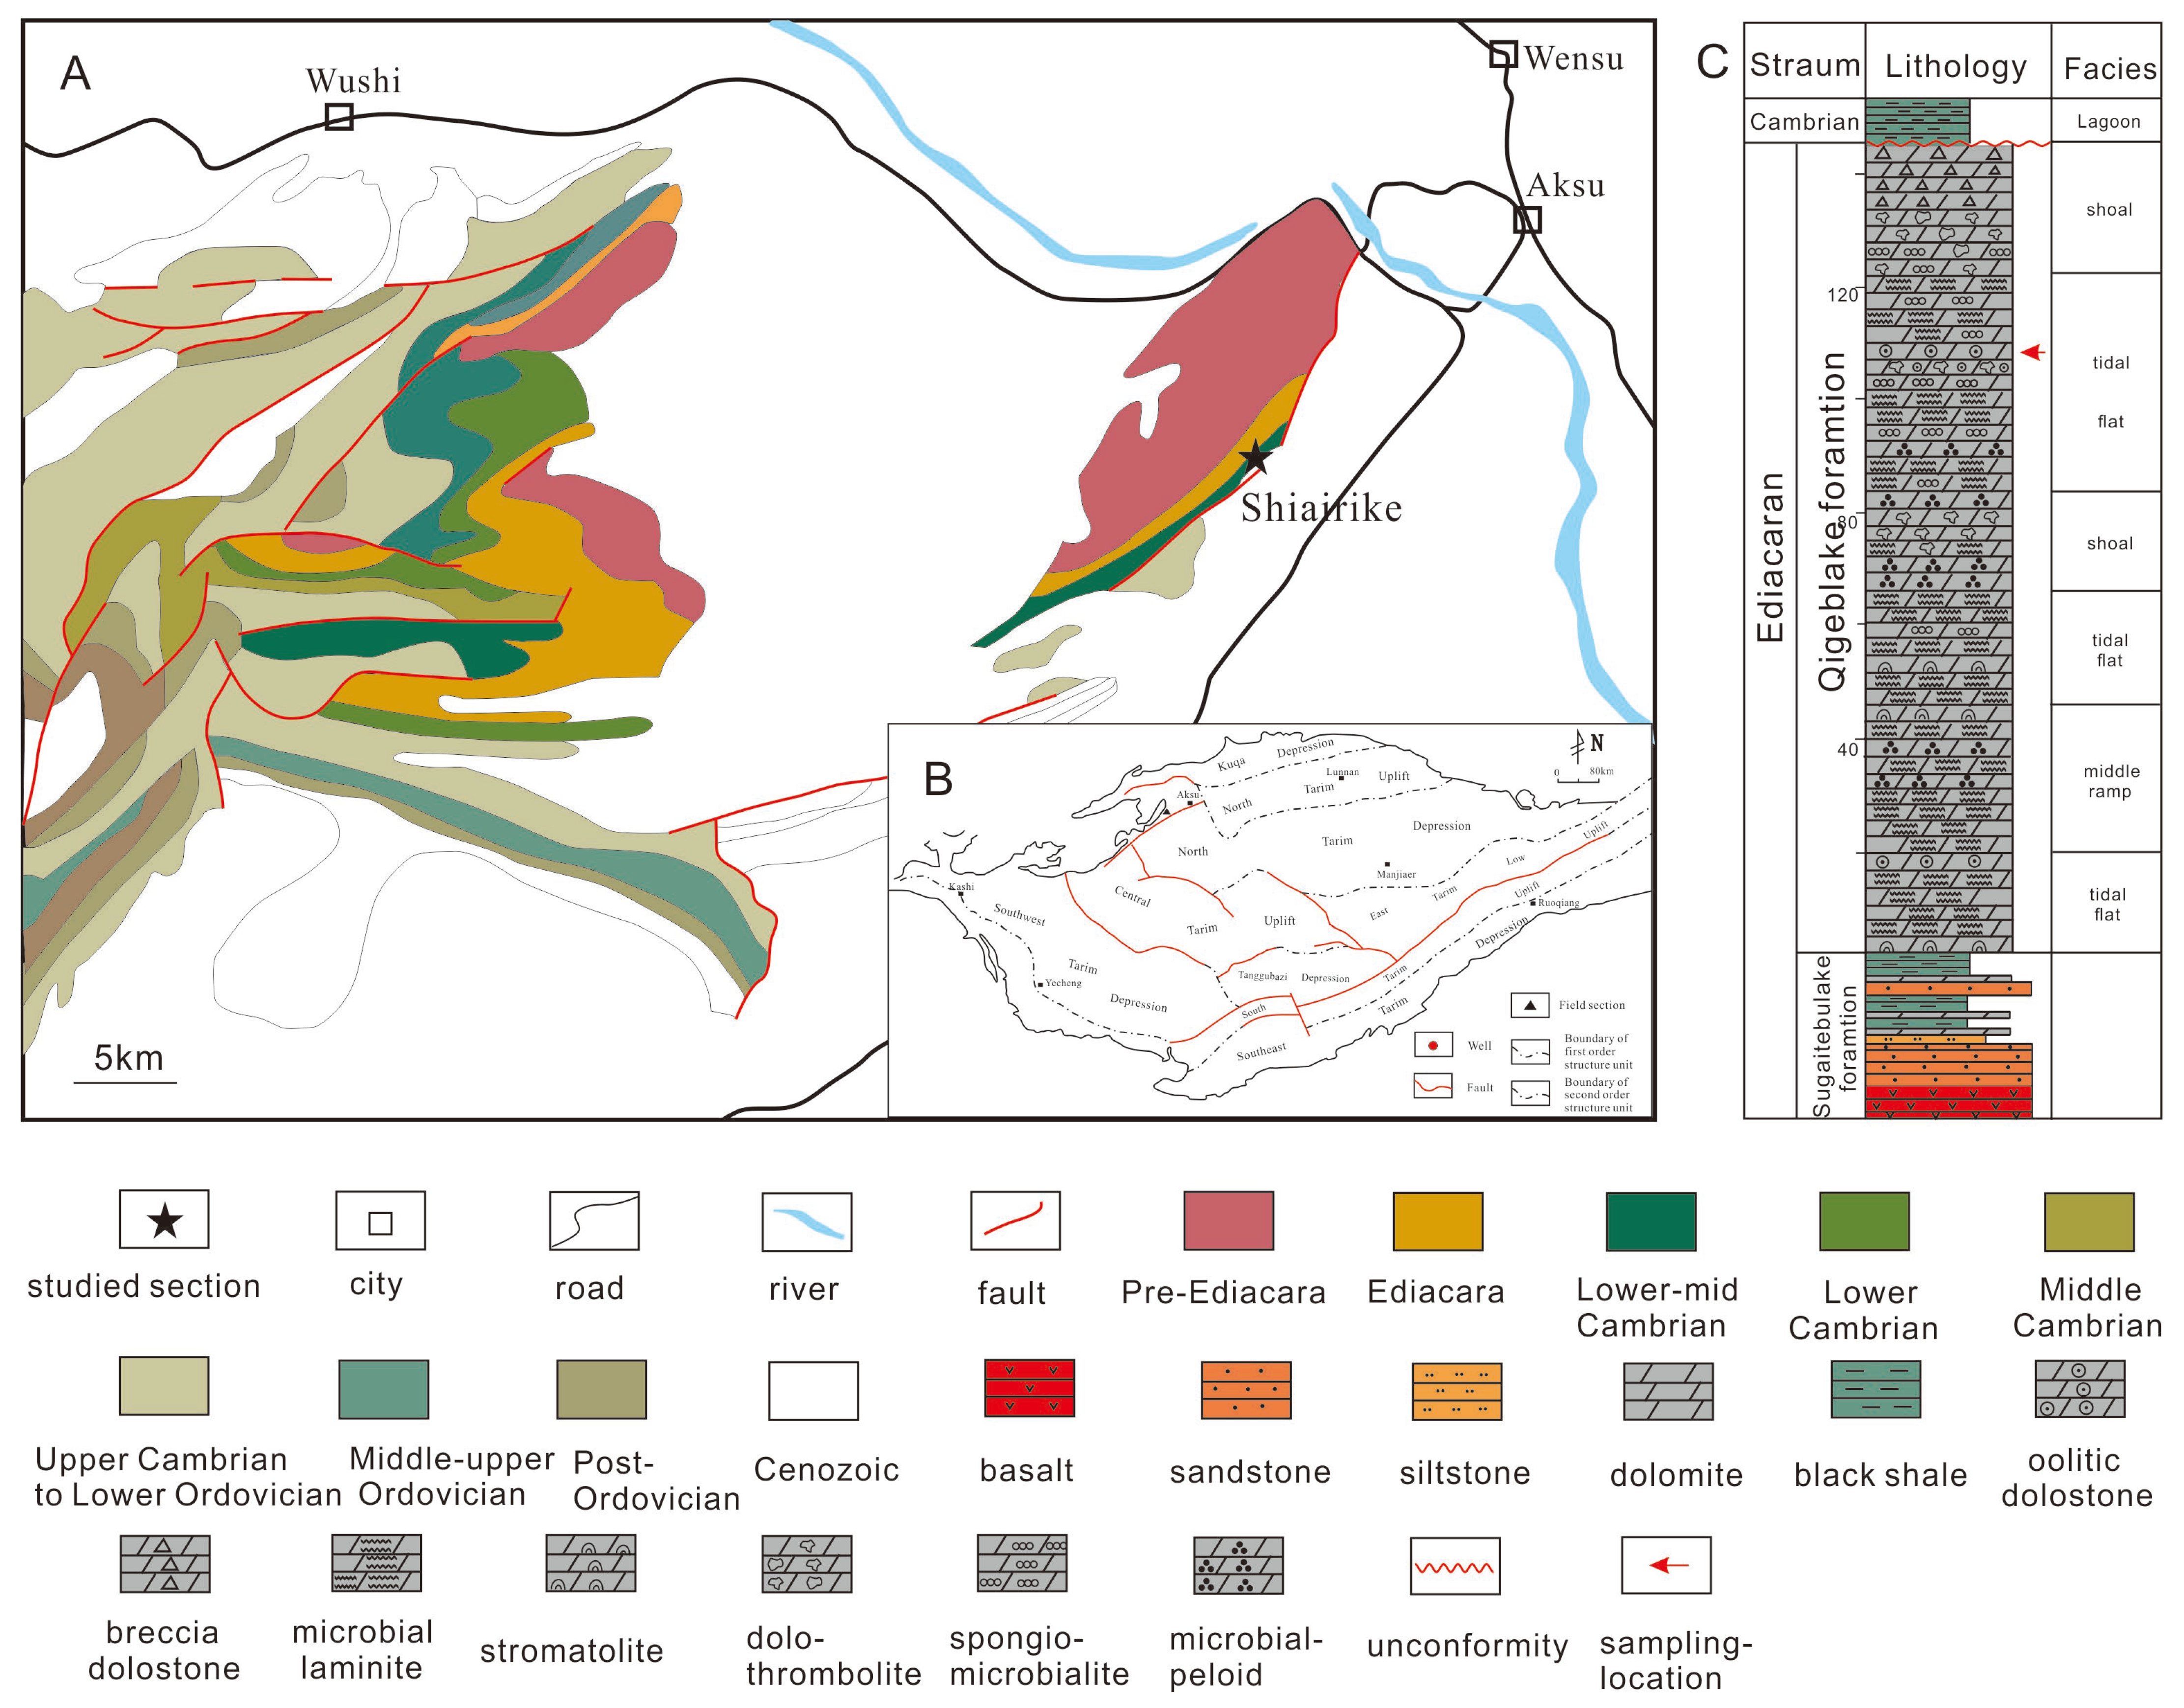
2. Geological Settings

The Tarim Basin, situated in the northwestern Chinese province of Xinjiang, extends approximately 1400 km east–west and 520 km north–south, encompassing an area of approximately 560,000 km2, which makes it the largest sedimentary basin in China. A giant superimposed basin, it developed on the Archean–Early Paleoproterozoic crystalline basement and metamorphic folded basement [20]. The basin is composed of major tectonic units, including the North Tarim Uplift, Central Tarim Uplift, South Tarim Uplift, Kuqa Depression, North Tarim Depression, Southwestern Tarim Depression, and Southeastern Tarim Depression. The Keping area, situated within the North Tarim Uplift, represents a favorable location for the study of high-frequency cycles within the peritidal zone.
The studied section, designated Shiairike, is situated approximately 40 km southwest of Aksu City (Figure 1A), where the Precambrian strata are extensively exposed. The sequence under consideration here is from bottom to top, and comprises the Sugaitebulake Formation and the Qigebulake Formation (Figure 1C). In accordance with the findings of preceding research, the Sugaitebulake Formation is characterized by a preponderance of clastic deposits in shelf–shore environments, underlain by crystalline basement and conformably overlain by the Qigebulake Formation. The Qigebulake Formation, with a thickness of approximately 140 m, exhibits interbedded clastic and carbonate rocks in its lower part, transitioning to peritidal zone microbial dolostones in the middle–upper sections. Its uppermost stratum exhibits angular unconformity contacts with mudstones, sandstones, and silicalite of the Lower Cambrian Yuritusi Formation.

3. Materials and Methods

The occurrence of oolitic tidal flat cycles has been identified in both the lower and middle–upper parts of the Qigebulake Formation at the Shiairike section. This paper employs the middle–upper oolitic high-frequency as a case in point, and the thickness of the cycle is approximately 1.6 m (Figure 2A). Based on differences in lithology and stratum thickness, the high-frequency cycle can be subdivided into nine sublayers, numbered sequentially from top to bottom as 1, 2, 3… 9 (Figure 2A,B). Furthermore, according to the characteristics of sedimentary structure and diagenetic characteristics in small layers, some small layers can be divided into 1-1, 1-2, etc. A total of 12 field samples were collected for analysis. Sublayer 1 yielded 3 samples, sublayer 2 provided 2 samples, and each of the remaining sublayers contributed one sample. The specific sampling locations are indicated in Figure 2B. The preparation of the samples comprised nine polished slabs, sixteen large thin sections, and thirty-two standard thin sections. Furthermore, six cathodoluminescence (CL) thin sections were analyzed. Thin sections were prepared for analysis and standardized by applying a staining solution comprising Alizarin red S and potassium ferricyanide. This was then used to differentiate between dolomite and calcite, as outlined by Dickson [23]. The observations and descriptions of field samples and thin sections primarily concentrate on petrology, the structures and textures of sedimentary rocks, and the sequence of their genesis.
Cathodoluminescence (CL) was conducted at the State Key Laboratory of Petroleum Resources and Engineering, China University of Petroleum (Beijing). The optical cathodoluminescence system utilized was the CL8200 MK5-2 model, manufactured by Cambridge Image Technology Ltd. (CITL, Hatfield, UK). Field-collected carbonate rocks and clastic rocks were prepared as CL thin sections (thickness: 0.05 mm), non-coated. The experimental parameters that were established during the imaging operation were as follows. The observation objectives were set at 2.5× and 5×, the working distance (WD) was greater than 15 mm, and the electron beam spot, which initially measured 25 mm in diameter, was electromagnetically focused to 0.3 mm through high-voltage optimization. The current was set to 240 μA and the voltage to 12.8 kV, with the cathode ray applied starting at <0.5 kV. The vacuum level was stabilized at 0.03 Mbar, and it was observed that the imaging stage remained uncooled during experimental operation. All standard photographs were captured at an exposure time of 17.3 milliseconds (ms), and the cathodoluminescence images were obtained at an exposure time of 1.1 s. The primary function of the cathodoluminescence technique was to facilitate the analysis of cement types and their respective stages.
The analysis of major, trace, and rare earth elements (REEs) was conducted at the China Railway Resource Central Lab. The carbonate samples were initially pulverized to 200 mesh using an agate mortar, followed by analysis with inductively coupled plasma–mass spectrometry (ICP-MS, Thermo Fisher X-series 2, Thermo Electron, Waltham, MA, USA). The analytical precision and accuracy of this method were determined to be superior to 5%. Rare earth element data were then normalized to chondrite values.

4. Results

4.1. Microfacies

It was evident from the analysis of outcrop, slabs, thin sections, and cathodoluminescence (CL)that high-frequency tidal flat cycles exhibit a complex lithological composition. This can be broadly categorized into two main types: dolostones and siliciclastic rocks.

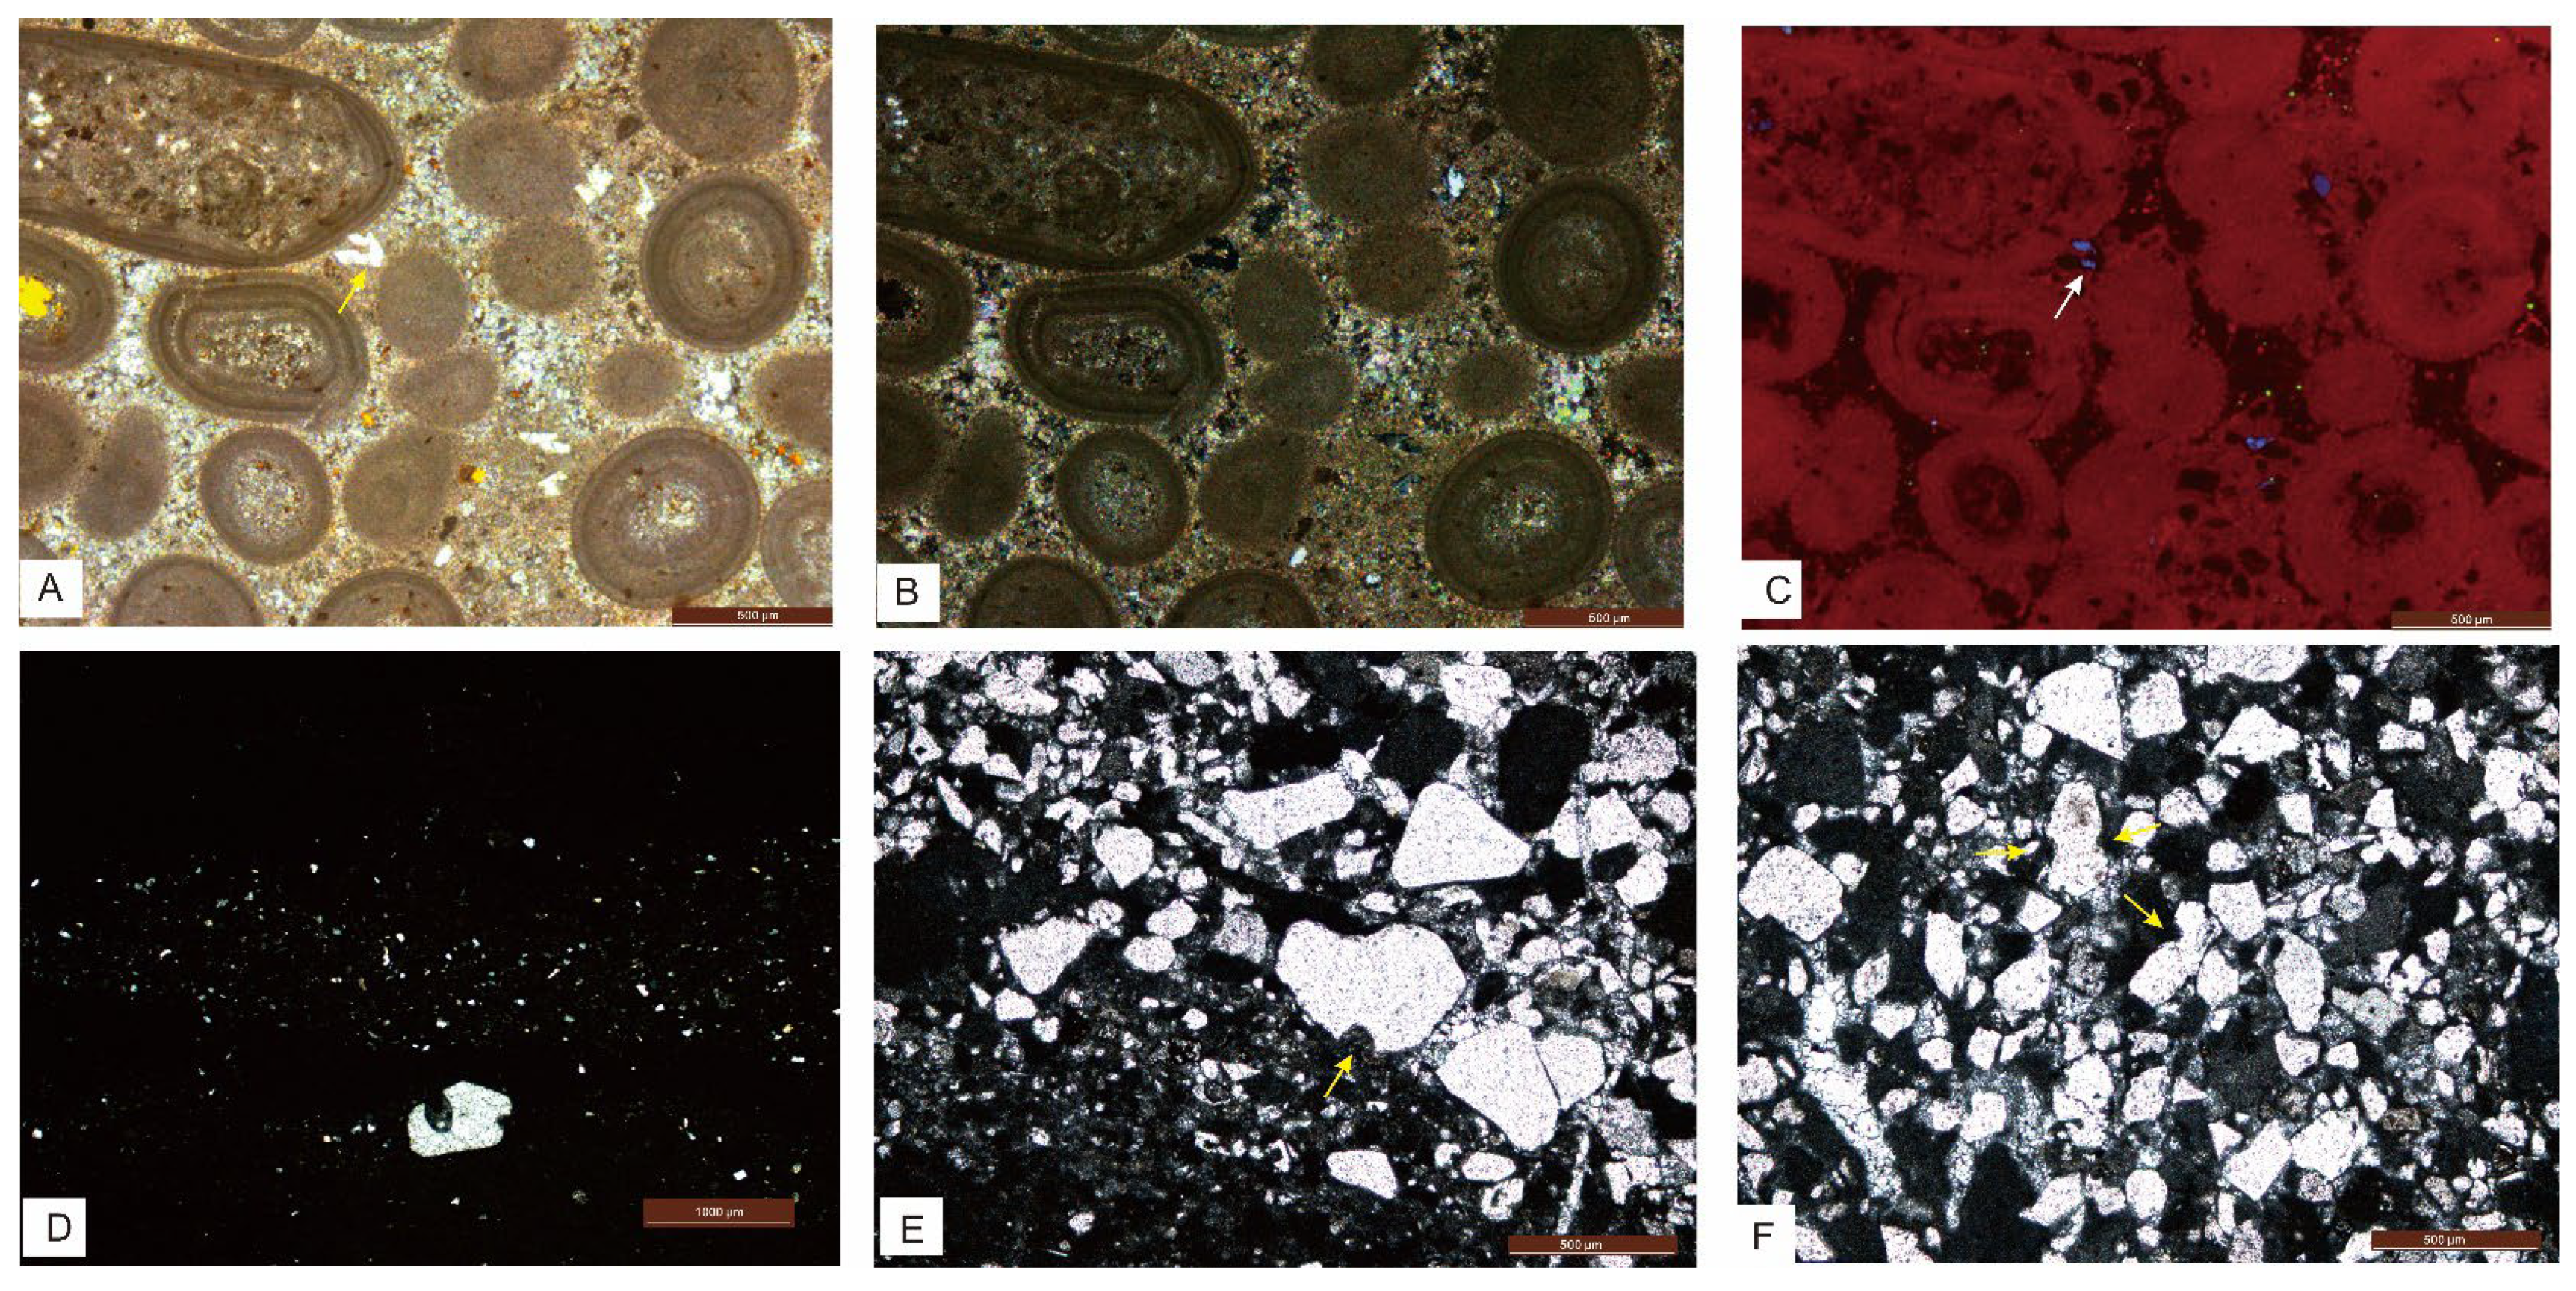
4.1.1. Carbonate Microfacies

The dolostones, situated in the middle–upper part of the cycle (sublayers 1–7), are predominantly associated with microbial processes. In accordance with the classification scheme proposed by Tang et al. (2022) [10], the dolostones can be further subdivided into five distinct types: oolitic dolostone, oolitic dolothrombolite, spongiomicrobialite, microbial-peloidal wackstone (with siltstone), and silty dolomudstone.
The occurrence of the oolitic dolostone was identified at the top (sublayer 1) and middle (sublayer 6) of the high-frequency cycle (Figure 2C,H and Figure 3A,F), with a thickness of ~30 cm. The ooid-bearing strata exhibit a grayish-white appearance in their outcrop form (Figure 2B) and yellowish-gray hue when polished (Figure 2C,H). Under close examination, these strata reveal distinct oolitic grains, micritic bands, and micritic clasts (Figure 2C). Microscopically, the ooids are predominantly concentric oolitic particles with rare instances of radial types, though deformation, fragmentation, and dissolution are common. The concentric ooids manifest as predominantly spherical to ellipsoidal forms (Figure 4A–C) 0.3–0.5 mm in diameter. These ooids are composed of 5–15 alternating light–dark laminae. Cathodoluminescence (CL) reveals enhanced visibility of concentric zoning (Figure 4C,F), with organic-rich dark laminae and light laminae consisting of micritic to microcrystalline dolomite. The majority of ooid nuclei exhibit irregular filamentous structures, manifesting as concentric layers in the early stages (Figure 4A,D). A subset of these nuclei also contain quartz clasts. Surprisingly, the Qigebulake Formation exhibits well-developed ooid deformation structures, including plastic deformation (Figure 4D) and brittle deformation (Figure 4E,F). The temporal relationship between deformation and isopachous rim cements suggests that these structures formed early during diagenesis. Ooid intervals are distinguished by the presence of sparry calcite, with sublayer 1 dolostone exhibiting a notable abundance of intra-oolitic and intergranular pores (Figure 3A). In contrast, sublayer 6 exhibits a paucity of pore development. Furthermore, the presence of irregular quartz clasts and micas was observed within a micritic dolomite matrix between ooids. It is noteworthy that certain quartz clasts exhibit a distinctive bright-blue luminescence when examined under CL (Figure 5C,H,J,L).
The occurrence of the oolitic dolothrombolite is confined to sublayer 2 of the section, with a thickness of approximately 20 cm (Figure 2B). The specimen exhibits a grayish-white appearance when observed in its natural state and a yellowish-gray hue when viewed on polished slabs (Figure 2D). Thrombolitic clasts demonstrate considerable size variation, with the largest reaching 2 mm. Under the microscope, the thrombolitic morphology is found to be irregular, and the internal particles include intraclasts, ooids, and smaller thrombolitic fragments (Figure 3B), etc. The intergranular spaces are cemented by sparry dolomite, while bedding-parallel vugs are prominently developed in outcrop (Figure 2B).
The microfacies of the third layer of the high-frequency cycle is characterized by the presence of spongiomicrobialite, with a thickness measuring approximately 15 cm (Figure 2B). In situ, it exhibits grayish-white appearance, transitioning to gray in polished slabs. It is notable for its absence of discernible lamination or sedimentary structures (Figure 2C,E). Microscopically, it exhibits irregular sponge-like textures with diameters of less than 0.2 mm (Figure 3C). The sponge pore structures are infilled with micro-spar to spar dolomite, while the inter-pore spaces are cemented by micritic dolomite. Previous studies have proposed that spongiomicrobialite of the Qigebulake Formation is associated with intraclasts, indicating that it is formed in a tidal flat environment with relatively strong hydrodynamic force [9]. The present study has determined that spongiomicrobialite occurs vertically between microbial-peloidal wackstone and the oolitic dolothrombolite. This finding suggests that the hydrodynamic conditions of spongiomicrobialite may be stronger than those of the microbial-peloidal wackstone, yet weaker than those of the oolitic dolothrombolite.
Within sublayer 4 of the cycle, there is a significant increase in silt sand particles and the microfacies undergoes a change to microbial-peloidal wackstone (with siltstone), which has a thickness of approximately 20 cm (Figure 2B). In situ, it manifests as thin grayish-white beds and yellowish green on polished slabs, exhibiting an absence of discernible sedimentary structures (Figure 2F). Microscopic analysis reveals the presence of peloids measuring less than 0.5 mm in size, displaying a range of shapes from subrounded to irregular. The peloids are constituted of micritic dolomite, which is cemented by a micritic-to-microcrystalline dolomite matrix (Figure 3D). The hypothesis that these peloids are of microbial origin is one that has been postulated by scholars [10]. Furthermore, abundant silt-sized quartz clasts are dispersed within the microbial-peloidal wackstone.
Silty dolomudstone is present in sublayers 5 and 7 of the cycle. In outcrop, it typically manifests as thin beds that are gray or grayish-green in color. Sublayer 7 is characterized by the presence of intercalated grayish-white silty-fine sandstone laminae (Figure 2B). Polished slabs appear gray, showing normal grading texture and frequent scour surfaces (Figure 2I). Microscopically, sublayer 5 comprises silty quartz clasts within a micritic dolomite matrix, with the quartz clasts also exhibiting graded grading (Figure 3E). Both sublayers 5 and 7 display quartz grains with embayed margins (Figure 5D–F).

4.1.2. Siliciclastic Microfacies

Siliciclastic rocks are present in the basal sublayers 8–9 of the cycle and can be subdivided into argillaceous siltstone and silty mudstone.
The argillaceous siltstone (sublayer 8) manifests as grayish-green thin beds in outcrop and yellowish-green polished slabs, exhibiting normal-graded texture (Figure 2J). Microscopically, it is composed of angular to subangular quartz grains that are moderately to poorly sorted, accompanied by irregular mud intraclasts and micritic dolomite clasts. The micritic dolomite clasts manifest internal granular textures (Figure 3H), suggesting that it may be of microbial origin.
Silty mudstone is in sublayer 9 of the cycle. In outcrop, it exhibits yellowish-gray coloration, with polished slabs displaying a fresh yellowish-green surface and well-developed wavy bedding (Figure 2K). Microscopically, the rock is relatively homogeneous, with silty quartz clasts dispersed within the mudstone matrix. Black pyrite nodules are present, and occasional fine- to medium-grained quartz grains are observed (Figure 3I).

4.2. Geochemistry

4.2.1. Major and Trace Elements

Major elements and trace elements in tidal flat high-frequency cycles are shown in Table 1.
The analysis indicates that the SiO2 content of all samples ranges from 1.82 to 39.10 wt%, with an average of 12.88 wt%. In the upper cycle of oolitic dolostone, oolitic thrombolite dolostone, and middle cycle oolitic dolostone, the SiO2 content ranges from 1.82 to 6.86 wt%. In the lower-cycle siliciclastic dolomudstone and dolosiltstone, the SiO2 content ranges from 12.06 to 39.10 wt%. The Al2O3 content ranges from 0.61 to 12.45 wt%, with an average of 3.54 wt%, and its distribution within the strata follows a pattern analogous to that of SiO2. The content of CaO and MgO ranges from 10.12 to 28.04 wt% and from 9.30 to 23.37 wt%, respectively, with averages of 22.54 wt% and 19.31 wt%. The MnO content is comparatively low, ranging from 0.01 to 0.02 wt%, with an average of 0.02 wt%.
With regard to trace elements, the overall characteristics indicate higher concentrations in the lower-cycle strata, with a concomitant decrease in content as clastic particles increase in the upward direction. Specifically, the Sc content ranges from 6.52 to 14.63 ppm, with an average of 9.63 ppm. The Mo content ranges from 0.15 to 1.52 ppm, with an average of 0.43 ppm. The concentration ranges of the nutrient-related elements Cu and Ba are 2.02–26.16 ppm and 106–893 ppm, respectively, with averages concentrations of 6.43 ppm and 510 ppm.

4.2.2. Rare Earth Elements

Rare earth elements (REEs) in the tidal flat high-frequency cycle are shown in Table 2. In this paper, chondrite-normalized REE distribution [24] is used for rare earth elements, and the normalised REE distribution pattern is shown in Figure 6. The ΣREE content of the samples varies significantly, ranging from 11.08 to 189.83 ppm (average: 62.19 ppm). In the middle- to lower-cycle siliciclastic dolomudstone and dolosiltstone, ΣREE content is relatively high, ranging from 51.83 to 189.83 ppm (average: 114.08 ppm). In contrast, oolitic dolostone and oolitic thrombolite dolostone in the upper cycle exhibit lower ΣREE content, ranging from 11.08 to 49.82 ppm (average: 25.12 ppm). The average LREE/HREE and (La/Yb) N ratios are 3.86 and 10.48, respectively, indicating pronounced light rare earth element (LREE) enrichment and heavy rare earth element (HREE) depletion. The δCe values range from 0.88 to 1.9 (average: 1.25), with positive Ce anomalies observed in the middle- to upper-cycle oolitic dolostone and oolitic thrombolite dolostone. Similarly, δEu ranges from 0.7 to 2.34 (average: 1.15), and positive Eu anomalies are present in the middle- to upper-cycle oolitic dolostone and some oolitic thrombolite dolostone.

5. Discussion

5.1. Implications for Terrigenous Input

The correlation analysis of the major elements is presented in Table 3. It is a commonly held belief that an r2 > 0.5 is statistically significant [26]. The following conclusions are derived from the analysis.
(1)
The positive correlations observed between SiO2 and Al2O3, K2O, TiO2, and TFe2O3 (r = 0.89, 0.85, 0.81, and 0.80, respectively) suggest a potential association between these elements and clay minerals, indicating a co-variation trend (Figure 7) [27]. Al2O3, TiO2, Th, and ΣREE are frequently utilized as proxies for terrigenous input [28]. The analysis reveals strong correlations between Al2O3 and TiO2, Th, and ΣREE, with correlation coefficients of 0.96, 0.98, and 0.95, respectively. In sublayers 9, 8, and 5, the PAAS (Panasqueira Average Abundance Standard)-normalized ΣREE values of the rare earth element (REE) samples are 189.83 ppm, 116.19 ppm, and 118.01 ppm, with Y/Ho ratios of 23.56, 25.54, and 25.36, respectively. These ΣREE values and Y/Ho ratios obtained are comparable to those of average shale (184.8 ppm and 27 [mass ratio]), reflecting significant terrigenous input influence on the samples. Analysis of regional geological data indicates that the late Ediacaran Keping Movement in the Tarim Basin resulted in the occurrence of varying degrees of erosion within the Nanhua–Ediacaran strata [29]. Dissolution pores and vugs of epigenetic karst origin are universally found at the top of the Upper Ediacaran dolomites in the Keping and Yecheng areas of the basin margin, and the disconformity of the Ediacaran top surface is clearly visible in the seismic profile of the basin [30]. Further studies on zircon geochronology have indicated that the Kalpin Movement occurred between 525 and 575 Ma [31]. From the standpoint of the time of basin tectonics, the intense terrigenous input observed in the high-frequency cycles of this study is probably associated with this tectonic occurrence (Table 4).
(2)
Furthermore, MgO was found to exhibit a positive correlation with CaO, but negative correlations with SiO2, Al2O3, K2O, TiO2, and TFe2O3 (Figure 7). This is indicative of the mixing of carbonate and siliciclastic components, a conclusion that is consistent with petrographic characteristics. Additionally, the analysis of vertical element variation profiles revealed cyclic patterns in these correlations. The initial cycle is as follows: silty mudstone (sublayer 9) → oolitic dolostone (sublayer 6). The second stratigraphic succession is as follows: silty dolomudstone (layer 5) → oolitic dolostone (sublayer 1). This cyclic pattern is indicative of terrigenous input influencing the growth of carbonate formations.
(3)
The loss on ignition (LOI) index demonstrates a positive correlation with MgO and CaO while exhibiting a negative correlation with SiO2, Al2O3, K2O, TiO2, and TFe2O3. This pattern is indicative of mass loss in dolomite during the process of heating as a result of the release of CO2. This finding is consistent with the thermal decomposition processes of carbonate minerals.

5.2. Implications for Volcanism

As demonstrated in previous studies, the cathodoluminescence color of quartz has been shown to be indicative of its provenance [32]. However, there is an overlap in cathodoluminescence colors of quartz from different sources [33]. Nevertheless, a general classification proposed by Boggs [33] is often used as a first interpretation [34]. It has been determined that for volcanic quartz phenocrysts that emit most intensely in the blue spectral range, their cathodoluminescence (CL) color gamut is most constrained [33]. This results in a lower multiplicity of genetic interpretations. In addition, within the group of blue-CL quartz varieties, hydrothermal quartz displays short-lived CL emission, whilst quartz formed from high-temperature melts exhibits stable CL behavior [34]. The study area has been found to contain quartz grains that display stable, bright-blue CL signatures. This is indicative of their formation from high-temperature melts (>573 °C) that underwent rapid cooling processes. Alternatively, the high-frequency cycle is characterized by the presence of larger quartz particles, measuring approximately 0.5 mm in size. These particles are distinguished by their euhedral shape, embayment, unit extinction, and scarcity of inclusions (Figure 5D), which are indicative of an extrusive igneous (volcanic) provenance [35]. It should be noted that the presence of embayed quartz textures can may also be attributed to the reworking of pyroclastic sediments or high-energy tidal abrasion [36]. This observation necessitates careful consideration in analogous studies.
In addition to petrology, trace and rare earth element (REE) geochemical signatures are also preserved in volcanic processes. The content under consideration is found to be considerably higher than that of Sc in sedimentary rocks (0.05~0.6 μg/g), and is consistent with that of Sc in volcaniclastic rocks (5.6~18 μg/g) [37,38]. This finding indicates that volcaniclastic rocks may exist in the samples. REE partitioning patterns and element ratio relationships have been demonstrated to be effective in determining the provenance of rocks [39,40]. The REE distribution pattern of dolostone in the Ediacaran tidal flat cycle in the Tarim Basin is characterized by LREE enrichment and HREE depletion, with a mean of 1.15 and a standard deviation of 0.7–2.34 (δEu). The REE distribution pattern demonstrates a relatively smooth curve of right-dip LREE enrichment and HREE (except for positive Er anomaly) (Figure 6). The REE distribution pattern exhibited by the samples are analogous to that observed in the Ediacaran volcanic rocks within the Tarim Basin (Figure 6), thereby suggesting a genetic relationship between the samples and the volcanic rocks. This observation indicates that quartz fragments may have originated from volcanic rocks. Furthermore, carbonate rocks of distinct genetic origins exhibit diagnostic distribution patterns on La/Ca vs. Yb/La discrimination diagrams. Typically, magmatic carbonates display Yb/Ca and Yb/La ratios that exceeded 10−4, while sedimentary varieties show a Yb/Ca ratio of 10−7. Hydrothermal carbonates, on the other hand, plot within the 10−6–10−5 range for both ratios. Chondrite-normalized REE data combined with La/Ca-Yb/La systematics (Figure 8) further reveal genetic connections between the dolostones in the study area and both volcanism and hydrothermal processes. The observed positive δCe anomalies in REE patterns likely correlate with the continental margin setting [41], whereas the positive δEu anomalies exhibited by certain samples may be indicative of hydrothermal influences, as will be discussed in more detail in the following sections. It is important to note the presence of Er anomalies in the samples, which require further investigation to determine their petrogenetic significance.
The temporal parameters of the deposition of volcanic quartz can be constrained through analysis of the texture observed between volcanic quartz and oolitic dolostones. The results demonstrate that volcanic quartz clasts are truncated by parallel bedding stylolite (Figure 5G,H), which is a diagnostic sedimentary structure distinguishing shallow burial versus moderately deep burial regimes [42], indicating their formation during or prior to the shallow burial stage. Furthermore, the volcanic quartzes are associated with micas (Figure 5I–L), primarily embedded within micritic matrix, and postdate first-generation isopachous fibrous cements (Figure 5I,J). Recent studies in the Bahamas have demonstrated that the formation of isopachous fibrous cement composed of marine carbonate particles occurs within a mere 20 months [43]. This evidence further constrains the deposition timing of volcanic quartz to the penecontemporaneous stage. This finding is consistent with observations of CL. The occurrence of volcanic eruptions during the penecontemporaneous phase of high-frequency cyclic deposits the preservation of embayed quartz grains. These grains were found to be present in both impermeable siliciclastic dolomudstone and permeable facies (within oolitic dolostones).

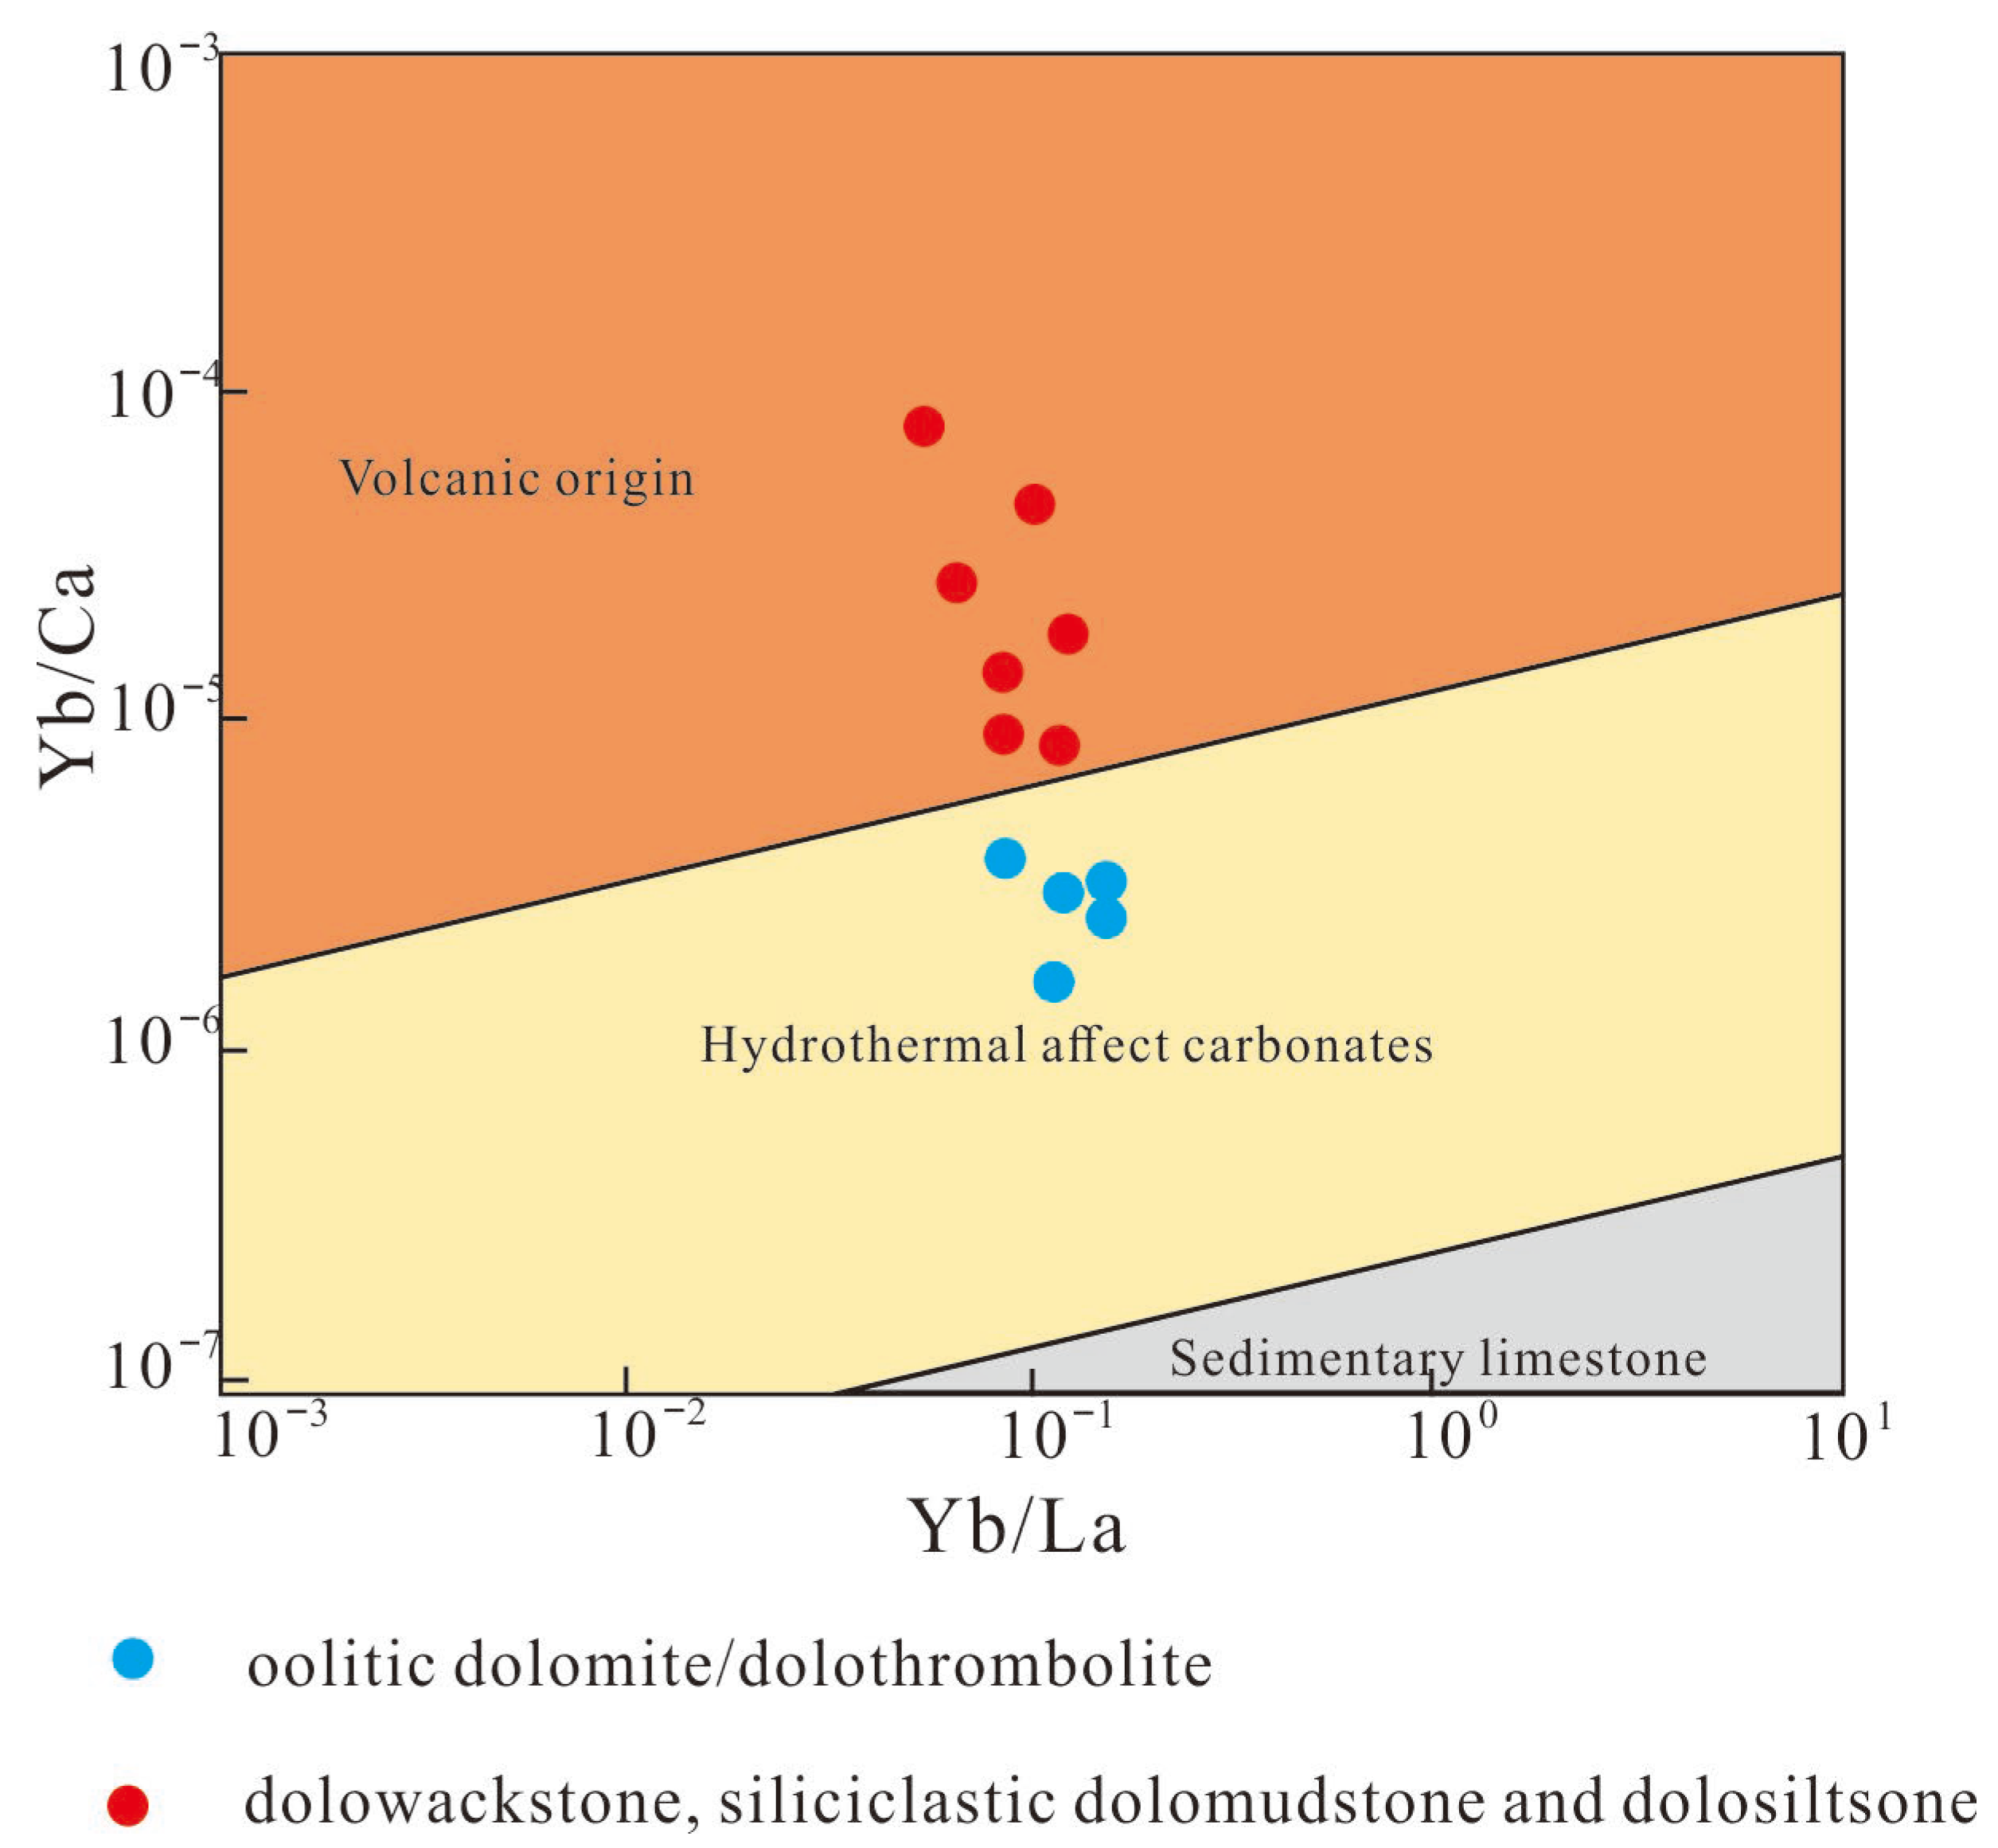
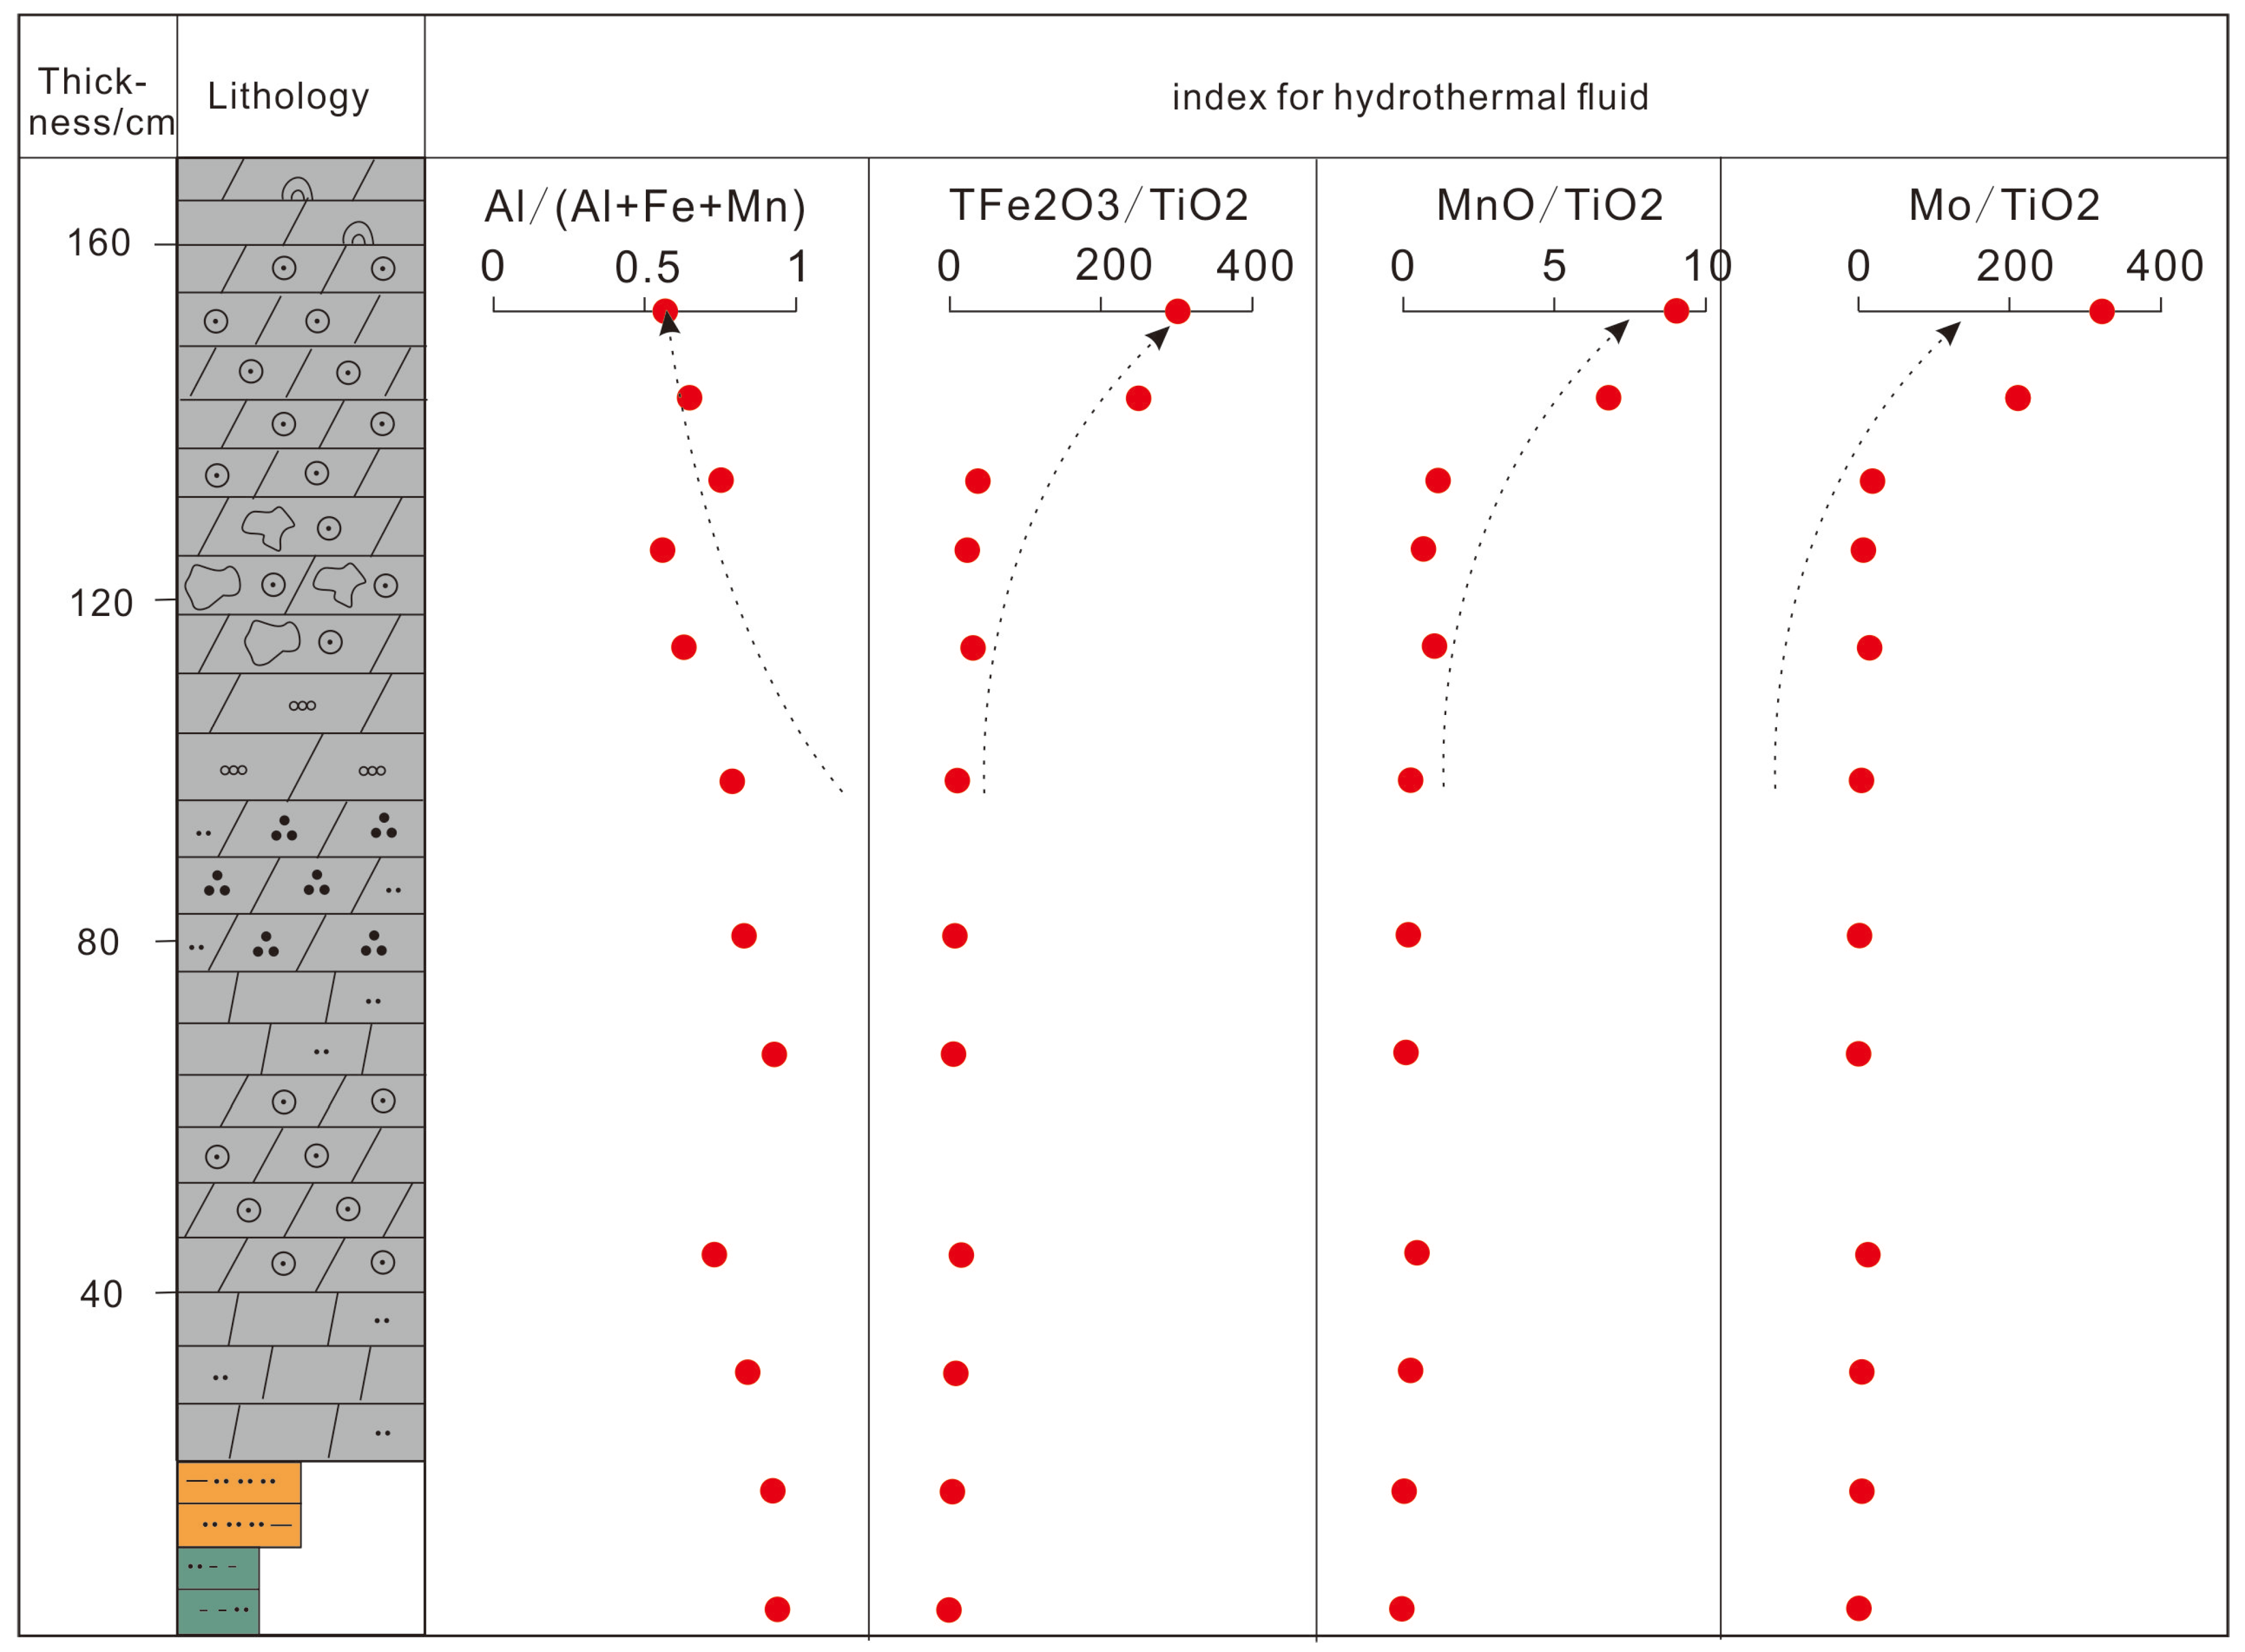
5.3. Implications for Hydrothermal Fluids

Extensive hydrothermal activity has been identified in the Ediacaran strata of the Tarim Basin. As demonstrated in previous studies, the Qigebulake Formation of the study section contains saddle dolomite, quartz, barite, fluorite, and other hydrothermal minerals [44]. Furthermore, positive δEu anomalies have frequently been associated with hydrothermal fluids [45]. It is important to note that these positive anomalies may also be attributable to diagenetic partitioning under reducing conditions in carbonates or due to detrital feldspar contamination [46]. Despite the absence of the aforementioned hydrothermal minerals in the study cycle, significant geochemical evidence was nevertheless identified, suggesting ongoing hydrothermal activity. As demonstrated in earlier studies, formations affected by thermal fluid exhibit characteristics such as low Al/(Al+Fe+Mn), high Fe2O3/TiO2, MnO/TiO2, Mo/TiO2, positive δEu anomaly, and relatively high Yb/La-Yb/Ca [39,47].The δEu of oolitic dolostone (samples 1-1, 1-3, 1-5) and some thrombolitic dolostones (sample 2-3) revealed a significant positive anomaly in the δEu values, ranging from 1.14 to 2.73 (mean = 1.73) (Figure 6).
Furthermore, the Al/(Al+Fe+Mn) ratio demonstrates a co-variation trend with Fe2O3/TiO2, MnO/TiO2, and Mo/TiO2. Overall, the Al/(Al+Fe+Mn) ratio decreases upward, while Fe2O3/TiO2, MnO/TiO2, and Mo/TiO2 increase upward (Figure 9). Specifically, samples from the lower part of the cycle demonstrate higher Al/(Al+Fe+Mn) values (ranging from 0.56 to 0.94, average 0.82). Conversely, the oolitic dolostone present at the uppermost section (samples 1-1, 1-3, 1-5) and certain instances of oolitic thrombolite dolostone (sample 2-3) exhibit reduced Al/(Al+Fe+Mn) values (ranging from 0.57 to 0.76, with an average of 0.65). Conversely, samples from the lower part of the cycle have Fe2O3/TiO2 < 24 (average 9.77), MnO/TiO2 < 1 (average 0.34), and Mo/TiO2 > 14 (average 141.77). In contrast, the oolitic dolostone at the top (samples 1-1, 1-3, 1-5) and some oolitic thrombolite dolostone (sample 2-3) exhibit Fe2O3/TiO2 > 32 (average 155.65), MnO/TiO2 > 1 (average 4.54), and Mo/TiO2 < 14 (average 4.33) (Figure 9).
Furthermore, the Yb/Ca vs. Yb/La cross-plot (Figure 8) suggests that certain samples were influenced by hydrothermal fluids. Further analysis reveals that these samples affected by hydrothermally are concentrated in the oolitic layers (samples 1-1, 1-3, 1-5) and the oolitic thrombolite layers (samples 2-1 and 2-3) at the top of the cycle (Figure 8). The evidence presented herein demonstrates that the oolitic dolostones and some oolitic thrombolite dolostones in the studied section were affected by hydrothermal processes (Table 4).
It has been established through the efforts of preceding researchers that two significant episodes of hydrothermal activity occurred in the Aksu area: Ediacaran–Early Cambrian and Permian [48,49]. The data on fluid inclusion homogenization temperatures indicate that the hydrothermal minerals contained in the Qigebulake Formation were formed during the Permian hydrothermal event [10]. The stronger hydrothermal influence observed in the oolitic dolostones and oolitic thrombolite dolostones at the top of the cycle may be attributed to their well-developed pore systems and the migration of late-stage hydrothermal fluids along permeable layers.

6. Conclusions

Sedimentological records are the consequence of tectonic movements, volcanic eruptions, hydrothermal activities, and other regional geological processes. The present paper focuses on the high-frequency oolitic cycles in the late Ediacaran stage of the Tarim Basin, analyzing the petrological and geochemical responses to regional geological processes. The following conclusions are drawn.
Detailed petrological analyses reveal that the high-frequency peritidal cycles of the Qigebulake Formation in the Tarim Basin comprise seven lithological types: oolitic dolostone, oolitic dolothrombolite, spongiomicrobialite, microbial-peloidal wackstone (with siltstone), silty dolomudstone, argillaceous siltstone, and silty mudstone.
Trace elements demonstrate systematic variation from silty mudstone to oolitic dolostone. Terrigenous input proxies (e.g., Al2O3, TiO2, Th, ΣREE) demonstrate strong correlations in the studied section. The ΣREE contents and Y/Ho ratios of the silty mudstone, argillaceous siltstone, and silty dolomudstone approximate average shale values, indicating a pronounced terrigenous influence in the studied samples. When considered in conjunction with the regional geological context, this influx is likely to be correlated with the late Ediacaran Keping Movement in the Tarim Basin.
The presence of embayed quartz grains, as identified in late Ediacaran strata of the Tarim Basin, has been documented for the first time. These grains have been observed to exhibit stable bright-blue luminescence under cathodoluminescence. Their anomalously elevated concentrations of Sc, right-leaning REE patterns, and La/Ca vs. Yb/La ratios that overlap with magmatic fields suggest a volcaniclastic origin. The presence of irregular quartz grains has been observed to indicate synsedimentary volcanic eruptions that occurred during the peritidal ooid cycle formation.
The upper permeable strata of this high-frequency cycle exhibit the following diagnostic characteristics: low Al/(Al+Fe+Mn), elevated Fe2O3/TiO2, MnO/TiO2, Mo/TiO2 ratios, positive δEu anomalies, and relatively high Yb/La-Yb/Ca ratios, indicating hydrothermal influence. It is hypothesized that this record is indicative of late-stage hydrothermal fluid migration through permeable layers.
Finally, it should be noted that for the embayed quartz grains with blue cathodoluminescence, in addition to the volcanic origin cited in this paper, similar textures may also arise from high-energy transport processes or the reworking of older pyroclastic material. More geochemical work, such as in situ trace element mapping, LA-ICP-MS spot analysis of associated minerals, or petrographic screening for detrital phases, would help reinforce the interpretations.

Author Contributions

Writing—original draft, Y.H.; Supervision, S.Z. All authors have read and agreed to the published version of the manuscript.

Funding

This research received no external funding.

Data Availability Statement

The original contributions presented in this study are included in the article. Further inquiries can be directed to the corresponding author.

Conflicts of Interest

Author Yan Hao was employed by the company Sinopec International Petroleum Exploration and Production Corporation. The remaining authors declare that the research was conducted in the absence of any commercial or financial relationships that could be construed as a potential conflict of interest.

References

  1. Wright, V.P. Peritidal carbonate facies models: A review. Geol. J. 1984, 19, 309–325. [Google Scholar] [CrossRef]
  2. Xiong, L.; Long, K.; Cao, Q.M.; Zhang, S.L. Multilayer accumulation conditions and key technologies for exploration and development of the west Sichuan gas field in Sichuan basin. Acta Pet. Sin. 2024, 45, 595–614. [Google Scholar]
  3. Guo, X.J.; Wu, X.N.; Jin, W.D.; Lin, S.G.; Wu, D.X.; Yu, Z. New analysis of lithofacies palaeogeography and exploration area selection of the Member 4 of Majiagou Formation in Ordos Basin. J. Paleogeography 2023, 25, 105–118. [Google Scholar]
  4. Yi, S.W.; Li, M.P.; Guo, X.J.; Yang, F.; Yang, H.J.; Sun, R.N.; Wang, X.M. Rift-uplift-depression reservoir-controlling model of large gas province in Cambrian presalt, Tarim Basin. Nat. Gas. Geosci. 2022, 33, 1363–1383. [Google Scholar]
  5. Qian, Y.X.; Du, Y.M.; Chen, D.Z.; You, D.H.; Zhang, J.T.; Chen, Y.; Liu, Z.B. Stratigraphic sequence and sedimentary facies of Qigebulak formation at Xianerbulak, Tarim basin. Pet. Geol. Exp. 2014, 36, 1–8. [Google Scholar]
  6. Wang, Y.Z.; Ge, X.T.; Tang, P.; Yang, B.; Chen, D.Z.; Wang, B.; Deng, M.; Zhao, G.W. Division of the Sequence Stratigraphy of the Sinian Qigebrak Formation in the Northwest Tarim Basin: Evidence from the High-resolution Analysis of Depositional Facies and the Fischer Plot. Acta Sedimentol. Sin. (Chin. Ed. Engl. Abstr.) 2024, 23, 983–998. [Google Scholar]
  7. Chen, Y.Q.; Yang, G.; Tian, H.N.; Chen, B.; Yi, Y.; Li, B.H. Ediacaran stratigraphic succession and sedimentary evolution of the Tarim carton. J. Stratigr. 2024, 48, 17–41. [Google Scholar]
  8. Wang, X.L.; Hu, W.X.; Chen, Q.; Li, Q.; Zhu, J.Q.; Zhang, J.T. Characteristics and formation mechanism of Upper Sinian algal dolomite at the Kalpin area, Tarim Basin. Acta Pet. Sin. 2010, 84, 1479–1497. [Google Scholar]
  9. Li, P.W.; Luo, P.; Song, J.M.; Jin, T.F.; Wang, G.Q. Characteristics of Upper Sinian dolomite reservoir in the northwestern margin of Tarim Basin. Mar. Orig. Pet. Geol. 2015, 20, 1–12. [Google Scholar]
  10. Tang, P.; Chen, D.Z.; Cai, Z.; Wang, Y.Z.; Ding, Y.; El-Shafeiy, M.; Yang, B. Diagenesis of microbialite-dominated carbonates in the Upper Ediacaran Qigebrak Formation, NW Tarim Basin, China: Implications for reservoir development. Mar. Petrol. Geol. 2022, 136, 105476. [Google Scholar] [CrossRef]
  11. Qian, Y.X.; He, Z.L.; Chen, D.Z.; Chu, C.L.; Dong, S.F.; Zhang, Q.Z. Characteristics and genesis of various oolites in the Ediacaran Qigebulake formation in northern Tarim basin. J. Paleogeography 2023, 25, 56–74. [Google Scholar]
  12. Qian, Y.X.; You, D.H.; Chen, D.Z.; Chen, Y.; Jiang, H.J.; Liu, Z.B. The stratigraphic and sedimentation analysis of Sugaitbulak Formation of the Upper Sinian at Xianerbulak of Aksu in Tarim Basin. Chin. J. Geol. 2011, 46, 445–455. [Google Scholar]
  13. Zhou, X.B.; Li, J.H.; Fu, C.J.; Li, W.S.; Wang, H.H. A discussion on the Cryogenian-Cambrian tectonic-sedimentary event and tectonic setting of northern Tarim Basin. Geol. China 2012, 39, 900–911. [Google Scholar]
  14. He, J.Y.; Wu, G.H.; Xu, B.; Qu, T.L.; Li, H.H.; Cao, Y.H. Characteristics and petroleum exploration significance of unconformity between Sinian and Cambrian in Tarim Basin. Chin. J. Geol. 2010, 45, 698–706. [Google Scholar]
  15. Tian, L.; Zhang, H.Q.; Liu, J.; Zhang, N.C.; Shi, X.Q. Distribution of Nanhua-Sinian rifts and proto-type basin evolution in southwestern Tarim Basin, NW China. Pet. Explor. Dev. 2020, 47, 1122–1133. [Google Scholar] [CrossRef]
  16. Chen, Y.Q.; Yan, W.; Han, C.W.; Yan, L.; Ran, Q.G.; Hang, Q.; He, H.; Ma, Y. Structural and sedimentary basin transformation at the Cambrian/Neproterozoic interval in Tarim basin: Implication to subsalt dolostone exploration. Nat. Gas. Geosci. 2019, 30, 39–50. [Google Scholar]
  17. Yang, F.; Bao, Z.D.; Zhang, D.M.; Jia, X.; Xiao, J. Carbonate secondary porosity development in a polyphaser paleokarst from Precambrian system: Upper Sinian examples, North Tarim basin, northwest China. Carbonates Evaporites 2017, 32, 243–256. [Google Scholar] [CrossRef]
  18. Chen, X.; Xu, Q.; Hao, F.; Chen, Y.; Yi, Y.; Hu, F.; Wang, X.; Tian, J.; Wang, G. Dolomite reservoir formation and diagenesis evolution of the Upper Ediacaran Qigebrak Formation in the Tabei area, Tarim Basin. Sci. China Earth Sci. 2023, 66, 2311–2331. [Google Scholar] [CrossRef]
  19. Jiao, C.L.; He BZLi, Y.; Huang, C.J.; Sha, X.G.; Zhang, Y.; Gao, X.P.; Wang, K.N.; Li, J.J.; Yang, X.Q. The petroleum geological conditions and favorable exploration direction of Sinian in northern Tarim basin. Acta Geol. Sin. 2024, 98, 3683–3702. [Google Scholar]
  20. He, D.F.; Jia, C.Z.; Li, D.S.; Zhang, C.J.; Meng, Q.R.; Shi, X. Formation and evolution of polycyclic superimposed Tarim basin. Oil Gas. Geol. 2005, 26, 64–76. [Google Scholar]
  21. Zheng, J.F.; Shen, A.J.; Yang, H.G.; Zhu, Y.J.; Liang, F. Geochemistry and geochronology characteristics and their geological significance of microbial dolomite in upper Sinian, NW Tarim Basin. Acta Petrol. Sin. 2021, 37, 2189–2202. [Google Scholar]
  22. Zhang, C.Y.; Guan, S.W.; Wu, L.; Ren, R. Hydrothermal activity and depositional model of the Yurtus formation in the early Cambrian, NW Tarim, China. Earth Sci. Front. 2019, 26, 202–211. [Google Scholar]
  23. Dickson, J.A.D. Carbonate identification and genesis as revealed by staining. J. Sediment. Res. 1966, 36, 491–505. [Google Scholar]
  24. McDonough, W.F.; Sun, S.S. The composition of the Earth. Chem. Geol. 1995, 120, 223–253. [Google Scholar] [CrossRef]
  25. Yun, H.P. Geochemistry and their tectonic significance of the volcanic rocks from Tarim micro-plate. Northwestern Geol. 2003, 36, 1–6. [Google Scholar]
  26. Dudás, F.Ö.; Zhang, H.; Shen, S.Z.; Bowring, S.A. Major and Trace Element Geochemistry of the Permian-Triassic Boundary Section at Meishan, South China. Front. Earth Sci. 2021, 9, 637102. [Google Scholar] [CrossRef]
  27. Lin, L.B.; Yu, Y.; Huang, Q.C.; Shi, H. The geochemical characteristics and sedimentary environment analysis of Ordovician in Wangcang region, northern Sichuan Basin. Acta Petrol. Sin. 2017, 33, 1272–1284. [Google Scholar]
  28. Yang, J.; Du, Y.S.; Han, Z.Z.; Hu, L.S.; Zhang, Z.H.; Wan, L.; Zeng, Z.X. Increasing terrigenous input into the continental margin seawater during the late Ediacaran, North China. Palaeogeogr. Palaeoclimatol. Palaeoecol. 2024, 636, 111979. [Google Scholar] [CrossRef]
  29. Yang, H.J.; Chen, Y.Q.; Pan, W.Q.; Wang, B.; Yang, W.J.; Huang, S.Y.; Yang, P.F.; Yi, Y.; Wang, X.X. Study on tectonic and sedimentary evolution during the Nanhua-Middle Cambrian and its significance for subsalt exploration, Tarim Basin. China Pet. Explor. 2021, 26, 84–98. [Google Scholar]
  30. Yang, X.; Li, H.L.; Zhang, Z.P.; Chen, Q.L.; Chen, Y.; Xiong, P. Evolution of Neoproterozoic Tarim basin in Northwestern China and tectonic background of the lower Cambrian Hydrocarbon source rocks. Acta Geol. Sin. 2017, 91, 1706–1719. [Google Scholar]
  31. Guo, D.S.; Wu, G.H.; Zhang, C.Z.; Zhang, B.S. The evidence of detrital zircon age determination of Tarim basin basement. J. Southwest Pet. Univ. (Sci. Technol. Ed.) 2008, 30, 6–10. [Google Scholar]
  32. Zinkernagel, U. Cathodoluminescence of quartz and its application to sandstone petrology. Contrib. Sed. 1978, 8, 1–69. [Google Scholar]
  33. Boggs, S.J.R.; Kwon, Y.-I.; Goles, G.G.; Rusk, B.G.; Krinsley, D.; Seyedolali, A. Is quartz cathodoluminescence color a reliable provenance tool? A quantitative examination. J. Sediment. Res. 2002, 72, 408–415. [Google Scholar] [CrossRef]
  34. Götze, J.; PloÈtze, M.; Habermann, D. Origin, spectral characteristics and practical applications of the cathodoluminescence (CL) of quartz-a review. Mineral. Petrol. 2001, 71, 225–250. [Google Scholar] [CrossRef]
  35. Ulmer-Scholle, D.S.; Scholle, P.A.; Schieber, J.; Raine, R.J. A Color Guide to the Petrography of Sandstones, Siltstones, Shales and Associated Rocks; The American Association of Petroleum Geologists: Tulsa, OK, USA, 2003; pp. 4–473. [Google Scholar]
  36. Weltje, G.J.; von Eynatten, H. Quantitative provenance analysis of sediments: Review and outlook. Sediment. Geol. 2004, 171, 1–11. [Google Scholar] [CrossRef]
  37. Vinogradov, A.P. Average concentration of chemical elements in the chief types of igneous rocks of the crust of the Earth. Geochemistry 1962, 7, 555–571. [Google Scholar]
  38. Turekian, K.K.; Wedepohi, K.H. Distribution of the elements in some major units of the earth’s crust. GSA Bull. 1961, 72, 175–192. [Google Scholar] [CrossRef]
  39. Möller, P.; Morteani, G.; Schley, F. Discussion of REE distribution patterns of carbonatites and alkalic rocks. Lithos 1980, 13, 171–179. [Google Scholar] [CrossRef]
  40. Yang, Y.Q.; Qiu, L.W.; Wang, M.; Jia, X.Y.; Cao, Y.C.; Lei, D.W.; Qu, C.C. Depositional model for a salinized lacustrine basin: The Permian Lucaogou Formation, Jimsar Sag, Junggar Basin, NW China. J. Asian Earth Sci. 2019, 178, 81–95. [Google Scholar] [CrossRef]
  41. Murray, R.W.; Brink, M.B.; Gerlach, D.C.; Russ, G.P., III; Jones, D.L. Rare earth, major, and trace elements in chert from the Franciscan Complex and Monterey Group, California: Assessing REE sources to fine-grained marine sediments. Geochim. Cosmochim. Acta 1991, 55, 1875–1895. [Google Scholar] [CrossRef]
  42. Huang, S.J. Carbonate Diagenesis; Geological Publishing House: Beijing, China, 2010; pp. 192–196. [Google Scholar]
  43. Grammer, G.M.; Crescini, C.M.; McNeill, D.F.; Taylor, L.H. Quantifying rates of syndepositional marine cementation in deeper platform environments—New insight into a fundamental process. J. Sediment. Res. 1999, 69, 202–207. [Google Scholar] [CrossRef]
  44. Shi, S.; Liu, W.; Huang, Q.; Wang, T.; Zhou, H.; Wang, K.; Ma, K. Dolostone reservoir characteristic and its formation mechanism in Qigebulake formation, sinian, north Tarim Basin. Nat. Gas. Geosci. 2017, 28, 1226–1234. [Google Scholar]
  45. Bau, M.; Dulski, P. Distribution of yttrium and rare-earth elements in the Penge and Kuruman iron-formations, Transvaal Supergroup, South Africa. Precambrian Res. 1996, 79, 37–55. [Google Scholar] [CrossRef]
  46. Rieger, P.; Magnall, J.M.; Gleeson, S.A.; Oelze, M.; Wilke, F.D.K.; Lilly, R. Differentiating between hydrothermal and diagenetic carbonate using rare earth element and yttrium (REE+Y) geochemistry: A case study from the Paleoproterozoic George Fisher massive sulfide Zn deposit, Mount Isa, Australia. Miner. Depos. 2022, 57, 187–206. [Google Scholar] [CrossRef]
  47. Adachi, M.; Yamamoto, K.; Sugisaki, R. Hydrothermal chert and associated siliceous rocks from the Northern Pacific, their geological significance as indication of ocean ridge activity. Sediment. Geol. 1986, 47, 125–148. [Google Scholar] [CrossRef]
  48. Chen, H.; Yang, S.; Dong, C.; Zhu, G.; Jia, C.; Wei, G.; Wang, Z. Study on geological thermal events in Tarim Basin. Chin. Sci. Bull. 1997, 42, 1096–1098. [Google Scholar]
  49. Zhou, X.; Chen, D.; Qing, H.; Qian, Y.; Wang, D. Submarine silica-rich hydrothermal activity during the earliest Cambrian in the Tarim Basin, northwest China. Int. Geol. Rev. 2014, 56, 1906–1918. [Google Scholar] [CrossRef]
Figure 1. Location of the Shiairike section in the Tarim Basin (A) modified from [21,22]) tectonic division map of the Tarim basin (B), and stratigraphic column of the Qigebulake Formation (C) modified from [7,10]).
Minerals 15 00613 g001
Figure 2. Stratum division of the oolitic tidal flat and hand specimen photographs. The scale of the hand specimen is expressed in centimeters. (A) Position of the oolitic tidal flat cycle in the field section; (B) stratigraphic composition of the oolitic tidal flat cycle, with sublayers 1–9 from top to bottom. Note that the yellow circles are the sampling position, and the legend is consistent with that employed in Figure 1; (C) polished surface of sublayer 1 (oolitic dolostone), with micritic dolomite delineated by red dashed lines and intraclast gravels delineated by the black box; (D) polished surface of sublayer 2 (oolitic dolothrombolite); (E) polished surface of sublayer 3 (spongiomicrobialite), showing homogeneous structure; (F) polished surface of sublayer 4 (microbial-peloidal wackstone); (G) polished surface of sublayer 5 (silty dolomudstone); (H) polished surface of sublayer 6 (oolitic dolostone), exhibiting normal grading structure; (I) polished surface of sublayer 7 (silty dolomudstone), with yellow dashed lines indicating a scour surface overlain by normal grading structure; (J) polished surface of sublayer 8 (argillaceous siltstone). Note that the grain size displays a fining upward; (K) polished surface of sublayer 9 (silty mudstone), showing wavy bedding structure.
Minerals 15 00613 g002
Figure 3. Micrographs of rock types from high-frequency oolitic tidal flat cycles. All thin sections are plane-polarized light (PPL) photomicrographs. (A) Sublayer 1 (oolitic dolostone): dominated by concentric ooids with sparry dolomite cement between grains. Note the well-developed porosity characteristics within this sublayer. Yellow arrows indicate well-developed interparticle pores; red arrows highlight intraparticle pores. (B) Sublayer 2 (oolitic-dolothrombolite): note the irregular thrombolitic textures in the central part of the photograph, containing ooids and intraclasts. (C) Sublayer 3 (spongiomicrobialite): note the irregular spongy-shaped pores filled with sparry dolomite. (D) Sublayer 4 (microbial-peloidal wackstone): scattered quartz clasts are visible. Note the presence of ghost granular texture. (E) Sublayer 5 (silty dolomudstone): laminated texture composed of micritic dolomite and quartz clasts. Note the irregular contact surfaces, indicating micro-scour surfaces. (F) Sublayer 6 (oolitic dolostone): also dominated by concentric ooids with sparry dolomite cement between grains. Note the plastic deformation of ooids. (G) Micrograph of silty dolomudstone (sublayer 7): note the elevated siliceous content and poorly sorted quartz grains within this sublayer. (H) Sublayer 8 (argillaceous siltstone): black mud clasts (red arrows) and gray microbial debris (yellow arrows) are observed. Note the presence of an internal reticulate texture within microbial debris. (I) Sublayer 9 (silty mudstone): yellow arrows mark pyrite grains; red arrows indicate medium sand-sized quartz clasts.
Minerals 15 00613 g003
Figure 4. Micrographs of ooid types. (A) Concentric ooid. Note the irregular filamentous structures (yellow arrows), indicating microbial origin, plane-polarized light (PPL). (B) Concentric ooid exhibiting alternating light-dark laminae, PPL. (C) Cathodoluminescence (CL) image of (B): ooid laminae emit red luminescence, with enhanced visibility of laminar structures. (D) Plastically deformed ooids. Note the irregularly shaped quartz grains within micritic dolomite laminae (yellow arrow), indicating early origin, PPL. (E) Brittle deformation of ooids, PPL. (F) CL image of (E). Note ooids and first-generation syntaxial fibrous cement (red luminescence), followed by non-luminescent second-generation isometric cement.
Minerals 15 00613 g004
Figure 5. Micrographs of quartz types. (A) Quartz grains within sublayer 1 oolitic dolostone, showing irregularly edged quartz (yellow arrows). Note the irregular quartz grain with bright-blue CL, indicating volcanic origin PPL. (B) Cross-polarized light (XPL) image of (A). (C) CL image of (A). Irregularly edged quartz exhibits bright-blue cathodoluminescence (CL) (white arrows). Note the embayed quartz grain with bright-blue CL, indicating volcanic origin. (D) Quartz clasts with embayed margins in sublayer 5, XPL. (E) Embayed quartz clasts in sublayer 7 (yellow arrows), PPL. (F) Embayed quartz clasts in sublayer 7 (yellow arrows), PPL. (G) Quartz grain crosscut by a stylolite (yellow arrow) in sublayer 1. Note that this phenomenon indicates the presence of the quartz grain with bright-blue CL predating the formation of stylolite. PPL. (H) CL image of (G). Note the quartz grain is bright blue under CL, indicating volcanic origin, and it was cut by stylolite (white arrow). (I) Abundant quartz clasts within micritic matrix of sublayer 1 oolitic dolostone, PPL. (J) CL image of (I). Partial quartz grains show bright-blue CL. Note that quartz grains with bright-blue CL coexist with micritic matrix and postdate first-generation isopachous fibrous cements. (K) Quartz grains and platy mica (yellow arrow) in sublayer 1 oolitic dolostone, XPL. (L) CL image of (K). Quartz emits bright-blue CL, mica is non-luminescent (white arrow).
Minerals 15 00613 g005aMinerals 15 00613 g005b
Figure 6. Chondrite-normalized REE distribution patterns of samples from the Qigebulake Formation (the volcanic rocks of the Tarim Basin illustrated herein are modified from [25] Yun (2003).
Minerals 15 00613 g006
Figure 7. Longitudinal index plot of siliciclastic input and carbonates in high-frequency oolitic tidal cycles.
Minerals 15 00613 g007
Figure 8. Cross-plot of Yb/Ca versus Yb/La in high-frequency oolitic tidal cycles (modified from [39,40]).
Minerals 15 00613 g008
Figure 9. Longitudinal variation of Al/(Al+Fe+Mn), TFe2O3/TiO2, MnO/TiO2, and Mo/TiO2 in high-frequency oolitic tidal cycles.
Minerals 15 00613 g009
Table 1. Major elements (wt%) and trace elements (ppm) of the Qigebulak samples in Tarim Basin.
Samples 1-11-31-52-12-33-14-156-1789
LithofaciesOolitic DolostoneOolitic DolostoneOolitic DolostoneOolitic-DolothromboliteOolitic DolothromboliteDolowackstoneDolowackstoneSiliciclastic DolomudstoneOolitic DolostoneSiliciclastic DolomudstoneSiliciclastic DolomudstoneDolosiltstone
SiO22.722.092.302.711.826.8612.0620.926.4824.9532.5439.10
Al2O30.640.611.170.630.652.393.846.971.944.306.8912.45
TFe2O30.480.500.500.510.440.760.931.360.760.881.282.48
MgO22.1021.3422.7923.0523.3721.9220.1616.7021.6616.1413.229.30
CaO27.6928.0426.6826.7926.8224.8322.8118.4624.5818.5615.1310.12
Na2O0.311.100.210.280.270.330.370.510.790.430.551.11
K2O0.030.070.060.080.040.410.502.140.311.523.056.50
MnO0.010.010.020.020.020.020.020.020.020.020.020.02
TiO20.000.000.010.020.010.080.110.230.050.110.280.61
P2O50.040.050.040.120.060.080.120.220.060.060.130.16
LOI45.9046.1546.2245.7746.4942.2939.0532.4443.3332.9926.8718.10
FeO0.460.320.360.480.360.600.750.510.700.750.600.84
Ba892.80560.20378.10309.70283.00476.60106.40607.20428.70606.90721.10745.70
Cr32.587.2210.939.6812.8717.6121.4447.5614.5023.3439.1787.58
Ga0.460.360.600.910.532.604.158.611.473.597.4816.68
Sr123.3079.6463.7365.3061.0578.7473.5288.9570.1366.29104.60119.50
Th0.290.230.460.530.381.682.374.931.202.506.0111.26
U2.422.132.113.072.652.263.245.192.832.344.128.64
V8.178.0310.747.257.0416.7021.2044.7414.5115.5030.3385.36
Co1.981.471.211.221.231.802.163.083.623.583.382.86
Ni18.815.696.805.958.305.596.7013.5711.4512.0512.479.18
Table 2. REEs in the Qigebulake samples in Tarim Basin (ppm).
Samples1-11-31-52-12-33-14-156-1789
La1.531.371.913.972.278.6712.2323.755.818.9321.3245.57
Ce6.914.776.7311.588.5120.2123.5645.5515.6619.0842.6476.74
Pr0.500.430.461.310.672.082.865.301.472.044.898.36
Nd1.901.651.725.192.527.8611.0519.755.547.7219.0828.13
Sm0.350.290.340.910.441.351.953.391.071.483.734.32
Eu0.300.190.180.250.170.410.430.820.330.480.911.00
Gd0.430.330.360.840.451.221.752.880.981.363.173.84
Tb0.050.040.060.120.070.180.260.420.160.210.490.56
Dy0.330.220.340.620.370.981.422.220.911.262.662.95
Y1.791.051.853.092.155.246.9310.704.756.7313.2313.50
Ho0.070.040.070.110.070.190.300.420.180.260.520.57
Er0.470.570.460.500.460.7730.871.450.801.321.652.12
Tm0.030.020.030.040.030.080.110.160.070.120.220.25
Yb0.160.100.200.230.180.500.701.040.460.741.461.66
Lu0.030.020.030.030.030.080.130.160.070.120.230.26
ΣREE14.8311.0814.7228.7918.3749.8294.55118.0138.2651.83116.19189.83
LREE11.498.7011.3423.2114.5840.5952.0998.5529.8839.7392.57164.12
HREE3.352.383.385.573.809.2342.4619.458.3812.1123.6225.71
LREE/HREE3.433.663.354.173.844.401.235.073.573.283.926.38
(La/Yb)N9.7013.139.7317.2412.3817.4217.4722.7712.6912.0614.6127.40
δCe1.901.491.681.221.641.110.930.941.261.040.970.88
δEu2.341.901.520.871.140.970.700.780.971.020.790.74
(La/Yb)N6.548.856.5611.638.3511.7411.7815.358.568.139.8518.47
Table 3. Summary of major element correlations of Qigebulake formation in Tarim Basin.
R2SiO2Al2O3TFe2O3MgOCaONa2OK2OMnOTiO2P2O5LOIFeO
SiO21
Al2O30.8931
TFe2O30.7990.9721
MgO−0.982−0.915−0.8511
CaO−0.971−0.948−0.8770.9571
Na2O0.1720.2340.3070.2790.181
K2O0.8490.940.95−0.912−0.8970.3041
MnO0.0980.030.0180.0470.0950.0030.0091
TiO20.8120.9620.986−0.866−0.8820.2840.9770.0071
P2O50.3710.5160.480.350.4280.0270.3690.0010.4441
LOI−0.982−0.958−0.8930.9780.9920.21−0.9180.062−0.902−0.4291
FeO0.4860.4560.4630.416−0.510.0760.3720.410.4130.125−0.4891
Table 4. Summary of lithofacies, geochemical characteristics, and geological processes in high-frequency oolitic tidal cycles.
MicrofaciesLayer/SublayerKey Petrographic FeaturesSiO2, Al2O3, REE TrendsδEu/δCe,
Al/(Al+Fe+Mn), Mo/TiO2
Interpreted Process
Oolitic dolostone1Concentric ooids, embayed quartz grains with blue CL, spar cementLow Si and Al, enriched EuδEu > 1.5, low Al/(Al+Fe+Mn), high Mo/TiO2Hydrothermal overprint
volcaniclastic influx
Oolitic dolothrombolite2Irregular thrombolitic texture, spar cementLow Si and Al, enriched EuParts of δEu > 1.1Hydrothermal overprint
Spongiomicrobialite3Sponge-like texture, micro-spar to spar cementLow Si and Al, REE-poorδEu ~ 1
Microbial-peloidal wackstone4Subrounded microbial peloid, quartz grainsmedium Si and Al, REE-richδEu = 0.7Terrigenous input
Silty dolomudstone5, 7Graded bedding, quartz clasts, embayed quartz grains with blue CLHigh Si and Al, REE-richδEu ~ 0.7Terrigenous input
volcaniclastic influx
Oolitic dolostone6Concentric ooids, spar cementmedium Si and Al, REE-poorδEu ~ 1Terrigenous input?
Argillaceous siltstone8Graded bedding, irregular clastsHigh Si and Al, REE-richδEu ~ 0.8Terrigenous input
Silty mudstone9Homogeneous, silty quartz clastsHigh Si and Al, REE-richδEu = 0.74Terrigenous input
Disclaimer/Publisher’s Note: The statements, opinions and data contained in all publications are solely those of the individual author(s) and contributor(s) and not of MDPI and/or the editor(s). MDPI and/or the editor(s) disclaim responsibility for any injury to people or property resulting from any ideas, methods, instructions or products referred to in the content.

