Abstract
The South China Block hosts extensive sedimentary phosphorites that offer valuable insights into both paleoenvironmental reconstruction and rare earth element (REE) resource potential. However, the mechanisms governing REE enrichment in these deposits remain poorly understood. This study investigates two distinct phosphorite layers from the Lower Cambrian Zhujiaqing (ZJQ) Formation in the Bailongtan (BLT) area of the Yangtze Platform using integrated analyses including petrology, XRD, major and trace elements, δ13C and δ18O isotopes, and LA-ICP-MS. The lower thin-bedded phosphorite, composed of finer phosphatic grains (<300 μm), exhibits significantly higher REE concentrations (883.6 ± 160.9 ppm; n = 48) compared to the upper thick-bedded phosphorite (303.2 ± 82.7 ppm; n = 64), which is dominated by larger, reworked grains (300–600 μm). Intervening strata consist of laminated phosphate-bearing carbonates interbedded with quartz, dolomite, and pyrite. PAAS-normalized REE patterns display MREE–HREE enrichment, negative Ce anomalies (avg. 0.60 ± 0.18; n = 18), and positive Y anomalies—indicative of oxic depositional conditions. The elevated REE content in the lower layer, coupled with the lowest δ13C values (−4.59‰), suggests enrichment linked to organic matter degradation. A proposed two-stage depositional model links REE enrichment to proximity with REE-rich deep-shelf waters, underscoring the critical role of redox and depositional dynamics in phosphorite-hosted REE accumulation.
1. Introduction
Rare earth elements (REE; if Y is included, REY), which include the lanthanide series as well as scandium and yttrium, have become key materials for global high-tech industries and green-energy industries [1,2,3]. REE deposits have been reported in 34 countries, with China holding one-third of the global REE reserves and accounting for 97% of the world’s REE production [4,5]. According to projections, REE consumption is expected to grow at an annual rate of 10% over the next decade [6]. Based on their geochemical properties, REEs are informally subdivided into light REEs (LREEs; La–Nd), medium REEs (MREEs; Sm–Dy), and heavy REEs (HREEs; Ho–Lu and Y) [7,8]. LREEs are relatively abundant, while MREEs and HREEs are a scarce resource [4,7]. Generally, REEs can be found in a variety of geologic settings including carbonatite/alkaline igneous complexes, ion-absorption-type ore deposits, and deep-sea REY-rich mud [4,7,9]. Phosphorite-hosted rare earth deposits have emerged as a promising supplement [7,10]. These sedimentary formations, widely distributed across marine basins in North America, Asia, and the Middle East, contain economically viable REE concentrations (200–2000 ppm) alongside phosphate reserves as a byproduct, offer readily extractable REEs, and pose fewer environmental concerns than most conventional REE deposits [7,10].
Notably, sedimentary phosphate rocks with more than 18 wt.% of P2O5 are phosphorite, primarily crypto- to microcrystalline carbonate fluorapatite (CFA), which can incorporate substantial REE concentrations during their formation [11,12]. Sedimentary phosphorites are enriched in REEs compared to Chinese clay-type deposits (ΣREE: 500–2000 ppm, ΣHREE: 50–200 ppm) and other sedimentary rock types, and phosphorite with ΣREE > 500 ppm is considered REE-enriched [7]. It is generally believed that REEs in marine sedimentary fluorapatite originate from seawater, with their concentrations controlled by seawater composition [13,14,15]. Some studies have shown that REE-rich phosphorites are influenced by hydrothermal activity, which alters REE distribution [16,17,18]. Others have attributed variations in REE abundance in phosphorites to post-depositional alteration, organic fractions, and grain size [19,20,21,22]. Therefore, the enrichment mechanisms of REEs in phosphorites remain largely controversial.
Carbon and oxygen isotopic compositions of sedimentary phosphorites are widely used to constrain the paleoenvironment [23,24], as well as for stratigraphic correlations [25,26]. 13C depletion in phosphorites is commonly related to the remineralization of organic matter with relatively stable δ13Corg values ca. −30‰) [27,28]. The δ18O depletion in phosphorites likely results from diagenetic alteration [29]. The REE records in pure authigenic fluorapatite are used to study their diagenetic processes, as well as to reveal depositional paleoenvironments [30,31,32]. However, the purification and concentration processes, including granulometric fractionation, hand-picking under a binocular microscope, and heavy liquid separation, are cumbersome [30,31,32,33,34]. In contrast, laser ablation inductively coupled plasma mass spectrometry (LA-ICP-MS) enables the in situ micro-sampling of specific areas of a mineral, allowing for more precise tracking of chemical composition variations at the microscale [30,32,35,36].
During the Early Cambrian, sedimentary phosphorite deposition was widespread across South China, but extraordinary REE enrichment has only been reported in the Zhijin phosphorites [17,18,37,38,39,40,41,42]. Based on elemental geochemistry and Sr–Nd isotopes, it has been proposed that the REY enrichment in the phosphorites was primarily due to granite weathering, which delivered a large amount of REY to the seawater [37]. However, the distribution pattern of REEs in phosphate formed in seawater is different from that of granite. In contrast, REY patterns similar to organic matter (OM) have been ascribed to an OM source for high REE contents in Zhijin phosphorites [38,39], which is, however, argued against by two aspects of evidence. Firstly, the Lower Cambrian deposits in other areas with abundant OM do not exhibit significant REE enrichment [43]. Secondly, these phosphorites were deposited under oxic-suboxic transitional conditions, marked by high productivity and active Fe cycling based on Fe and Zn isotopes [40,41,42]. More recently, Y/Ho ratios in phosphorites were found to closely resemble those of seawater, suggesting that the REEs are primarily associated with marine sources [44]. However, our current understanding of the mechanisms of REE enrichment in these Early Cambrian phosphorites in South China remains limited.
In this study, Bailongtan (BLT) and Laocun (LC) phosphorites were investigated for the mechanisms of REE enrichment. BLT has higher REE concentrations in the lower phosphorite layer than the upper one. We performed in situ geochemical analyses (major and trace elements) on authigenic phosphatic particles, along with mineralogical analyses (Optical microscopy, SEM, XRD) and whole-rock geochemical analyses (major and trace elements, carbon and oxygen isotopes) on the Zhongyicun (ZYC) member at BLT, Yunnan Province. Furthermore, we investigated the petrographic and mineralogical characteristics to understand their depositional environments and the factors influencing REE enrichment in sedimentary phosphorites in South China.
2. Geological Setting
The Lower Cambrian phosphorite successions are well preserved on the Yangtze Platform, which experienced extensional tectonism during the Ediacaran–Cambrian transition [37,45]. During the early Cambrian period, various paleoenvironmental settings existed, including carbonate platform facies, siliceous basins, and an intraplatform basin (Figure 1A) [45,46]. Subsequent transgression during the deposition of the ZYC Member led to the formation of large-scale economic phosphate ore deposits in the Early Cambrian, which were associated with platform facies [46]. The most significant transition occurred during the Ediacaran–Cambrian (E-C) transition period, characterized by substantial biological diversification and a shift from anoxic to extensively oxic conditions in the seawater environment [40,47]. Sedimentary and litho-facies evolution occurred in the BLT section located in an offshore intraplatform basin within the Yangtze Platform, eastern Yun’nan, South China [40]. The lithology of the platform is primarily composed of dolostone [25,40].
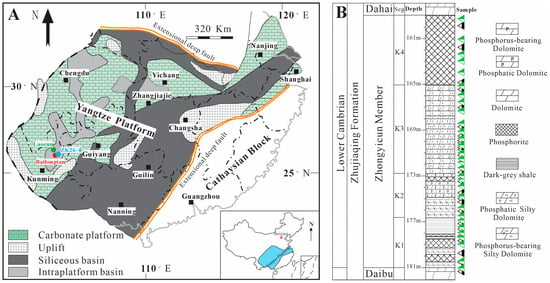
Figure 1.
(A) Simplified paleogeographic map of the Yangtze Platform during the Early Cambrian, showing the locations of the studied phosphorites modified after [48]; (B) the lithological column of the studied phosphorite deposits on the Yangtze Platform, South China.
The BLT section consists of the Daibu, ZYC, and Dahai members (Figure 1B). The Daibu Member is dominated by siliceous dolostones, which underlie the phosphorite deposits of the ZYC Member [25]. The lower part of the ZYC Member consists of grey, thick-bedded laminated phosphorite. The middle part of the ZYC Member consists of striped phosphatic dolostone, while the upper part consists of coarse sand and biological phosphate rock. Additionally, previous studies have recognized a positive δ13C excursion in the Dahai Member, which can be globally correlated [49,50]. Thick-bedded limestone is the dominant lithological unit of the Dahai Member. Phosphogenesis in the ZYC Member occurred during the transition from a transgressive systems tract to a condensed interval, suggesting that the sedimentation rates of phosphorites were relatively slow [25].
3. Materials and Methods
Ninety-four samples were collected from the drill core (ZK26-4) and outcrop sections at LC and BLT in Yunnan (Figure 1A). The study area is partitioned into four distinct lithological ore segments: K1 shows thinly layered phosphorite interbedded with phosphoric dolomite in the lower portion and primarily black phosphoric shale in the upper section; K2 is characterized by a dominant lithology of phosphoric dolomite in the lower part, which contains abundant phosphatic intraclasts, and is overlain by phosphatic dolomite intercalated with thin layers of phosphorite; K3, in which the primary lithology is phosphoric siliceous dolomite, with banded phosphorite present in the central portion as phosphatic siliceous dolomite; and K4 is defined by thick-bedded massive phosphorite, with the lower part exhibiting medium- to coarse-grained phosphorite, while the upper part consists of bioclastic phosphorite featuring minor scour surface. In this study, K1 and K2 are collectively referred to as the Lower Phosphorite Layer (LP), while K3 and K4 are designated as the Upper Phosphorite Layer (UP). The K4 segment, notable for its significant thickness and high ore grade, presents substantial economic mining potential. Therefore, samples were collected from the LC and BLT mining sites, focusing specifically on the K4 phosphorite layer. The sampled intervals were systematically logged from base to top, with detailed sample spacing data provided in Table S1 (sample locations are also illustrated in Figure 1B). A total of forty samples were transported to ALS Chemex Guangzhou Co., Ltd., Guangzhou, China, for analysis of major and trace elements. Prior to geochemical analyses, each sample was cleaned with distilled water, dried, and then crushed to a 200-mesh size. For light microscopy and laser ablation inductively coupled plasma mass spectrometry (LA-ICP-MS), the samples were prepared as polished sections with a thickness of 25 μm.
3.1. Bulk-Rock Major and Trace Elements
A total of forty samples were analyzed at ALS Chemex Guangzhou Co., Ltd., Guangzhou, China. The geochemical analyses were conducted on samples that were as fresh as possible, with minimal alteration and veining. In the laboratory, weathered materials and visible veins were first removed from all samples using a diamond saw, followed by crushing and pulverization to 200-mesh powders. Major and trace element analyses were then conducted on these powders. Major element and trace element (including rare earth elements) data were obtained using inductively coupled plasma atomic emission spectrometry (ICP-AES) and inductively coupled plasma mass spectrometry (ICP-MS), respectively, following the methods described [38], with an analytical error of ±5%.
3.2. X-Ray Diffraction
The mineralogical composition of phosphorite samples (ZK26-4) was determined using X-ray diffraction (XRD) on a PANalytical diffractometer at the Laboratory of Soil Geology and Environment, Institute of Geology and Geophysics, Chinese Academy of Sciences. The analysis was performed with Ni-filtered Cu-Kα radiation (40 kV, 40 mA), and the divergence and anti-scatter slits were set at 1/16° and 1/8°, respectively. The X-ray diffraction scanning angle (2θ) ranged from 4° to 75° or 90°, with a step size of 0.0167° (2θ).
3.3. Optical Microscopy
Petrographic studies were conducted on polished thin sections and rock slabs using an Olympus BX 41 microscope. The microscope was equipped with a Canon 5D Mark II camera at the Institute of Geology and Geophysics, Chinese Academy of Sciences. Mineralogy and microfabrics were documented using 2×, 4×, 10×, and 40× objectives under transmitted light, with areas of interest mapped for further in situ microanalysis.
3.4. Scanning Electron Microscopy and Energy Dispersive X-Ray Spectrometry
Mineral assemblages and distribution features of the samples were analyzed using a Thermofisher Apreo (Thermo Fisher Scientific, Waltham, MA, USA) field emission scanning electron microscope (FE-SEM) equipped with a Bruker XFlash 60 energy dispersive spectrometer (EDS) detector at IGGCAS [51]. The instrument was operated at an accelerating voltage of 25 kV and a beam current of 13 nA. X-ray data for mineral analysis were collected with a step size of 15 μm and a dwell time of 8 ms.
3.5. LA-ICP-MS
In situ trace element analysis of apatite and dolomite was performed using a GeolasHD 193 nm ArF excimer LA system (Coherent; Göttingen, Germany) coupled to an Element XR sector field (SF)–ICP–MS (Thermo Fisher Scientific; Bremen, Germany) at the Institute of Geology and Geophysics, Chinese Academy of Sciences (IGGCAS), Beijing, China. The samples were analyzed using a laser spot size of 24 μm, an ablation frequency of 5 Hz, and an energy density of ~5.0 J cm−2. Helium was employed as the ablation gas to enhance the transport efficiency of the ablated aerosols. The ARM-1 glass reference material was used to calibrate elemental concentrations, while NIST 610 and BCR-1 were analyzed for quality control purposes. Data reduction was carried out using Glitter software (version 4.0), with bulk oxides normalized to 100% to correct for ablation yield bias. For most trace elements (>0.1 μg/g), analytical accuracy was better than ±20% (one relative deviation), and precision was better than ±20% (one relative standard deviation).
REE concentrations are normalized to Post-Archean Australian Shale (PAAS) [19,52]. Relevant diagnostic parameters were calculated using the following equations:
where “N” represents the normalizing value of the Post-Archean Australian Shale (PAAS) [19] standard. (1) is after [53]; (2) and (3) are after [52]; and (4) is after [54].
3.6. Carbon and Oxygen Isotopes
The C–O isotope analyses of dolomite were conducted at the Laboratory for Stable Isotope Geochemistry, Institute of Geology and Geophysics, Chinese Academy of Sciences, using an EM-MAT-253 gas isotope ratio mass spectrometer. The analytical procedures were as follows: powdered samples were reacted with 100% phosphoric acid (for 24 h at 72 °C) to release CO2, which was then transferred to the mass spectrometer for C–O isotope analysis. The δ13C and δ18O were calculated using the international standard V-PDB. The analytical precision is better than ± 0.15‰ and ± 0.2‰ for δ13Ccarb and δ18Ocarb, respectively.
4. Results
4.1. Petrography and Mineralogy
Fifteen powdered samples from the drill core (ZK26-4) were subjected to XRD analyses (Table 1 and Figure 2). The X-ray diffraction patterns of the phosphorites revealed that the bulk samples are predominantly composed of carbonate fluorapatite and accessory minerals (silicates, carbonates, sulfates, and clay minerals). The carbonate content was estimated from the 2θ difference (Δ2θ) between the (004) and (410) reflections of CFA [55]. The calculated CO32− concentration ranged from 0.87% to 4.04% (average: 2.28%, n = 13). The lower phosphorites show no dolomite and more clays (mainly illite), while the upper phosphorites contain more dolomite but fewer clays.

Table 1.
Quantified X-ray diffraction data for the Early Cambrian phosphorites.
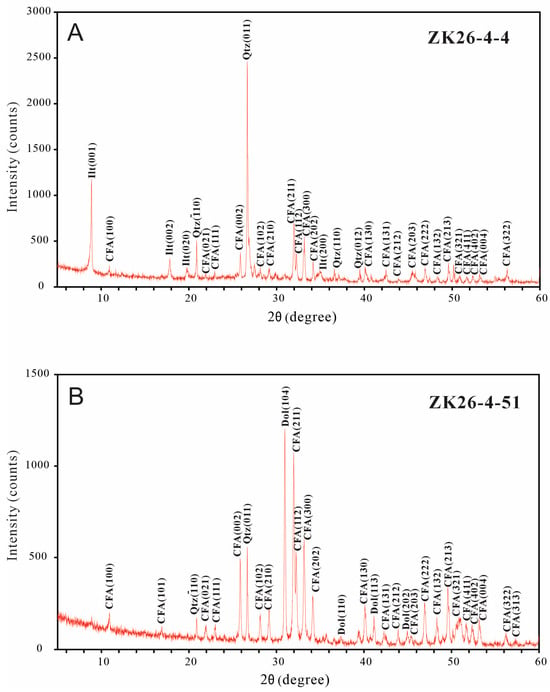
Figure 2.
Representative X-ray diffraction background subtracted stacked patterns for the Lower Cambrian phosphorites. (A) Lower phosphorite layer; (B) upper phosphorite layer. CFA = Carbonate Fluorapatite, Qtz = Quartz, Dol = Dolomite, Ilt = Illite.
In this study, we use the term ‘collophane’ to refer to fine-grained CFA and ‘francolite’ for its more crystalline, diagenetically altered form, both belonging to the apatite group. The upper phosphorite layer and lower phosphorite layer are composed almost entirely of cryptocrystalline CFA but with differences in size, structure, and morphology. The lower phosphorites primarily consist of collophane with phosphatic cement and quartz. The collophane is structureless (d < 300 μm) in diameter (Figure 3A–C) and dark brown. The upper phosphorites contain various types of phosphatic grains, which are classified into bioclastic, francolite types. The cement is primarily composed of dolomite (Figure 3D–I). Francolite occurs as subangular to subrounded grains ranging from 300 to 2000 μm in diameter. Phosphatic detrital and oolitic textures with phosphatic cement are also observed (Figure 3G–I).
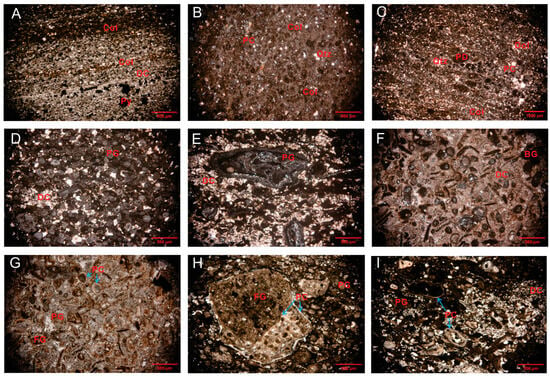
Figure 3.
Photomicrographs of phosphorites from the BLT, Eastern Yun’nan. (A) Phosphatic detrital and collophane grains (PPL); (B) collophane grains with phosphatic cement (XPL); (C) collophane grains with phosphatic and dolomite cement (XPL); (D) phosphate grains and dolomite (XPL); (E,F) Biogenetic phosphate rock composed of phosphatic biogenic grains or biodetritus (XPL); (G–I) oolitic texture (blue arrows) and phosphatic grain (PPL). Abbreviations: Dol = dolomite; PC = phosphatic cement; Py = pyrite; PD = phosphatic detritus; Qtz = quartz; BG = biogenic grains; DC = dolomite cement; PG = phosphatic grains; FG = francolite grains.
SEM imaging (Figure 4G,H) shows that the particles consist of fluorapatite aggregates composed of francolite. The phosphate debris particles are approximately 2 mm in size (Figure 4A), and the phosphatic cement contains pyrite. The phosphorite samples exhibit irregularly shaped bands of fine-crystalline apatite (d < 300 μm) intergrown with abundant clay mineral assemblages (Figure 4B,C). The upper phosphorite layer apatite is predominantly characterized by well-rounded biogenic apatite with large particle diameters ranging from 300 to 600 μm (Figure 4D–F).
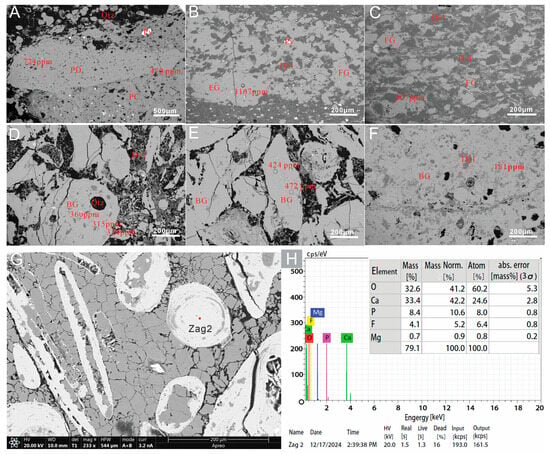
Figure 4.
Scanning electron microscope (SEM) images of the samples from the ZYC member (A) phosphatic grains with phosphatic cement and pyrite; (B) authigenic collophane grains with dolomite in band and clay minerals; (C) collophane and dolomite; (D) biogenic grains and dolomite cement; (E,F) carbonaceous matter and biogenic grains, (G) francolite and dolomite, and (H) semi-quantitative EDS spectra of fluorapatite. Abbreviations: Dol = dolomite; Py = pyrite; Qtz = quartz; FG = francolite grain; BG = biogenic grains; PD = phosphatic detritus.
4.2. Whole-Rock Geochemistry
The compositional data of major and trace elements for the dissolved phosphate fraction are presented in Table 2 and Table S1. The major oxides in the Lower Cambrian phosphorites predominantly comprise CaO (3.78–50.8 wt.%), Fe2O3 (0.33–7.78 wt.%), P2O5 (0.93–36.2 wt.%), and SiO2 (5.66–65.12 wt.%). The contents of MgO, K2O, SO3, and Al2O3 range from 0.11–10.2 wt.%, 0.17–5.86 wt.%, 0.24–13.2 wt.%, and 0.49–17.14 wt.%, respectively. The concentrations of other oxides, including TiO2, Na2O, and MnO, are generally low (<1%). In the LC and BLT outcrop sections, the average P2O5 content is 30.7% in the upper phosphorites. The CFA is the principal mineral phase in the phosphorites, accompanied by subordinate dolomite, quartz, and clay minerals. The mudstone samples from the ZYC member exhibit SiO2 contents ranging from 25.54 to 65.12 wt.%, CaO from 3.8 to 29.2 wt.%, and MgO from 1.9 to 10.2 wt.%, respectively. These compositional characteristics indicate the predominance of terrigenous detritus as the primary mineral in the mudstone, accompanied by subordinate dolomite and clay minerals.

Table 2.
Analytical and calculated results of REEs(ppm) from BLT section.
The phosphorite of the lower phosphorite layer at BLT exhibits REE enrichment ranging from 322.2 to 953.3 ppm, with an average of 705.7 ± 336.7 ppm (n = 3), and phosphorite of the upper phosphorite layer variable REE concentrations ranging from 115.3 to 358.7 ppm, with an average of 181.7 ± 94.2 ppm (n = 15). However, the PAAS-normalized patterns for all samples exhibit remarkable consistency, characterized by a hat-shaped profile with elevated MREE and HREE, relatively depleted LREE (Figure 5A), and relative enrichment of Y (Figure 5A). This bivariate cross-plot of (Sm/Yb)N versus (Sm/Pr)N (Figure 5B) shows that REE-enriched samples fall within the MREE-enriched field, while samples from the upper phosphorite layer fall within the HREE-enriched field. The Y/Ho ratios of phosphorite range from 50.3 to 69.0, with an average of 61 ± 5.2 (n = 18). The Eu/Eu* values range from 0.81 to 1.58, with an average of 1.04 ± 0.18 (n = 18), while there is no significant Eu anomaly. All phosphorite samples exhibit a negative Ce anomaly (Figure 5A), with Ce/Ce* values ranging from 0.47 to 0.79, with an average of 0.60 ± 0.18 (n = 18) (Table 2).
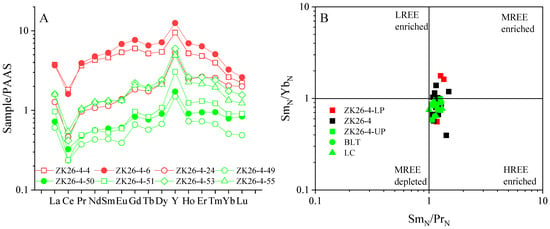
Figure 5.
(A) Distribution pattern of PAAS-normalized REE in phosphorites of BLT area; (B) the cross graph of (Sm/Yb)N versus (Sm/Pr)N showing that the REE enrichment samples fall within the MREE-enriched field, and the upper phosphorites layer samples fall within the HREE-enriched field.
4.3. Carbonate Carbon and Oxygen Isotopes
The carbon and oxygen isotopic compositions of ZYC carbonates are presented in Table S1. Carbonates from the Lower Cambrian exhibit negative δ13C VPDB values ranging from −4.59‰ to −2.54‰, and a narrow range of δ18O VPDB from −12.22‰ to −8.38‰. The δ13C VPDB and δ18OVPDB values in the ZYC member exhibit consistent variations, showing a similar trend, with the phosphorite layer displaying relatively lower values. The most REE-enriched samples from the lower phosphorite layer exhibit the lightest δ13Ccarb (−4.59‰) and δ18Ocarb (−12.22‰) observed in this study.
4.4. Geochemistry of Carbonate Fluorapatite from BLT Using LA-ICP-MS
The geochemical compositions of apatite grains and dolomite from the Lower Cambrian phosphorite successions are presented in Table S2. The REE concentrations of apatite grains are consistent with the bulk rock chemistry, and the PAAS-normalized patterns exhibit a ‘hat-shaped’ REE profile, characterized by slight MREE enrichment. Based on the mineralogical analysis, several distinct types were identified, including collophane grains, biogenic phosphate grains, phosphatic debris, phosphatic cement, and dolomites. The total REE concentrations for phosphatic biogenic grains in the upper phosphorite layer range from 128.04 to 472.50 ppm (average 303.15 ± 82.66 ppm, n = 64), while collophane grains exhibit REE concentrations ranging from 643.03 to 1330.67 ppm (average 883.59 ± 160.91 ppm, n = 48). Phosphatic detrital shows REE concentrations between 467.83 and 777.83 ± 123.14 ppm (average 646.70 ppm, n = 5), and phosphatic cements range from 309.48 to 686.15 ppm (average 479.36 ± 117.13 ppm, n = 16). In contrast, dolomite displays the lowest REE contents, ranging from 7.38 to 401.76 ppm (average 69.25 ± 173.79 ppm, n = 9). The total REE concentrations in fluorapatite grains in the same geological deposit are significantly higher than those in dolomite.
5. Discussion
5.1. Effects of Detrital Inputs and Diagenesis
The correlations between bulk-rock ΣREE and Al2O3 content are used to evaluate the mixing of terrestrial detritus with marine sediments [37]. All BLT phosphorite samples from this study exhibit low Al2O3 content (typically < 5%) and weak correlations with REE (r2 = 0, Figure 6A), indicating minimal detrital inputs. Burial and diagenetic alteration of detrital clay minerals could release REE, leading to an increase in ΣREEs and a corresponding decrease in Y/Ho ratios [45]. The average Y/Ho ratio for the BLT phosphorites is 53.7, with weak correlations to ΣREE (r2 = 0, Figure 6B), suggesting REE enrichment was not related to clay mineral dissolution or transformation. Furthermore, a significantly strong negative correlation between Al2O3 content and P2O5 (r2 = 0.39, Figure 6C), along with the Y/Ho ratios of the studied phosphorites, resemble those of seawater (50–70; Figure 6D), suggesting that the REEs in these phosphorites are primarily sourced from an oxic marine environment and are likely associated with organic matter oxidation.
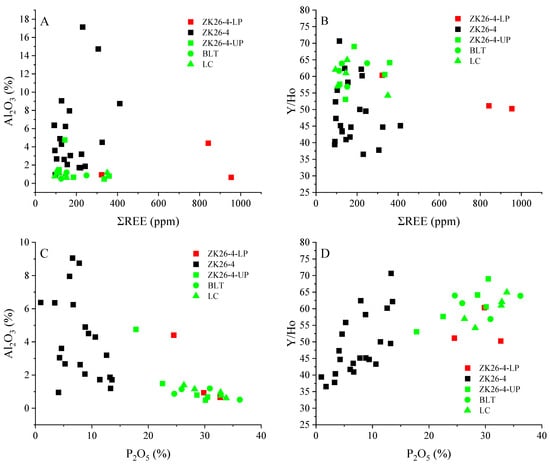
Figure 6.
Bivariate plots of REE with (A) Al2O3 contents and (B) Y/Ho ratios; (C) negative correlations between Al2O3 and P2O5; (D) positive correlations between Y/Ho and P2O5.
In this study, Ce/Ce* is moderately negatively correlated with the (Dy/Sm)N ratio (r2 = 0.44, Figure 7A), shows a weak negative correlation with the (La/Sm)N ratio (r2 = 0.03, Figure 7B), and exhibits a weak negative correlation with ΣREE contents (r2 = 0.1, Figure 8A). These findings indicate minimal impact from late diagenetic alterations [56]. Previous studies have suggested that reworking results in the relative enrichment of MREEs compared to other REEs, leading to a strong correlation between the Y/Y* and (La/Sm)N ratios [7,23]. The cross-plot of Y/Y* versus the (La/Nd)N ratio is a key indicator for assessing post-depositional alterations, as both ratios decrease in sediments as the intensity of diagenesis increases [54,57]. A moderate negative correlation between Y/Y* and (La/Nd)N (r2 = 0.389) (Figure 7C), with a moderately positive correlation between Y/Y* and (La/Sm)N (r2 = 0.438) is observed in our samples (Figure 7D), indicating that REE enrichment in phosphorite was not related to post-depositional processes. Therefore, the REE signatures of BLT phosphorites reflect primary sedimentary information, with REEs from seawater adsorbed during ore deposition.
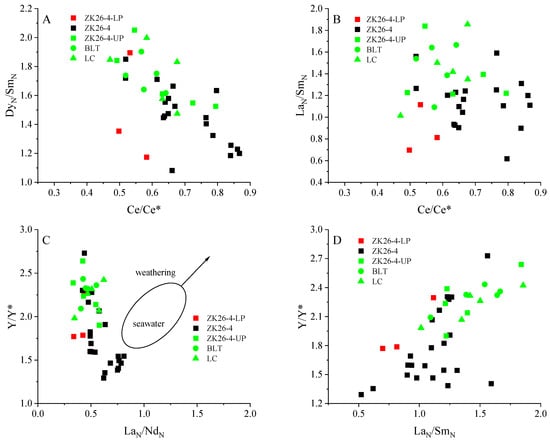
Figure 7.
Multi-element diagrams comparing the composition of the phosphate rock from BLT. (A) The plot of normalized (Dy/Sm)N ratios versus Ce/Ce* ratios; (B) the plot of normalized (La/Sm)N ratios versus Ce/Ce* ratios; (C) the cross-plot of Y/Y* versus (La/Nd)N ratio; (D) the cross-plot of Y/Y* versus (La/Sm)N.
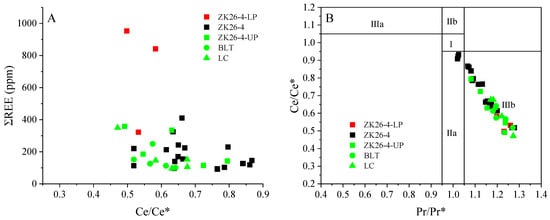
Figure 8.
(A) Cross plots of REE versus Ce/Ce*. (B) Ce/Ce* versus Pr/Pr* diagram, after [52]. Field I, no anomaly; Field IIa, positive La anomaly causes apparent negative Ce anomaly; Field IIb, negative La anomaly causes apparent positive Ce anomaly; Field IIIa, real positive Ce anomaly; Field IIIb, real negative Ce anomaly [34].
The weathering effect on these phosphorites can be identified through cross-plots of (La/Sm)N versus Y/Y* and Y/Y* versus (La/Nd)N [34,58]. For example, weathering leads to a strong positive correlation between (La/Sm)N and yttrium anomalies. There is a strong positive correlation between (La/Sm)N and Y/Y* (r2 = 0.438, Figure 7D). However, the REE-rich lower phosphorite layer exhibits lower (La/Sm)N and Y/Y* ratios and displays extremely poor correlations, suggesting that REE enrichment was not controlled by weathering. Additionally, the enrichment of MREEs (Figure 5) in these phosphorite samples further rules out intense weathering processes.
In summary, the low Al2O3 content, high Y/Ho ratios, and distribution patterns, along with the absence of post-diagenetic effects, collectively support the notion that the enrichment of REE in phosphorites from this study mainly occurred in syn-depositional marine conditions.
5.2. Paleoenvironment Conditions
Cerium (Ce) is a redox-sensitive rare earth element (REE) that undergoes valence changes (Ce3+ ↔ Ce4+) in response to environmental oxygen levels. In oxidizing seawater, Ce3+ is oxidized to insoluble Ce4+, which is subsequently scavenged from the water column. This process generates a negative Ce anomaly (Ce/Ce* < 1) relative to neighboring REEs [19,34,52]. Therefore, the negative Ce anomaly serves as a reliable proxy for assessing the oxidation state of seawater [59]. The pronounced negative Ce anomalies in these phosphorites reflect the widespread oxidation of dissolved Ce3+ to particulate Ce4+ under oxic marine conditions. The BLT phosphorites show negative Ce anomalies with Ce/Ce* values from 0.47 to 0.79, with an average of 0.6 ± 0.09 (n = 18, Figure 8A), indicating that they were formed in oxic depositional environments [39,60]. However, some authors have suggested that Ce/Ce* could be masked by high La and Pr concentrations [10,34]. Therefore, the Pr/Pr* ratio was used to assess the validity of the Ce/Ce* [34,52]. The Pr/Pr* versus Ce/Ce* diagram confirms that the Ce/Ce* in BLT phosphorites is true (Figure 8B). The lower Ce/Ce* value in the lower phosphate layer (0.5 versus 0.6 in the upper layer) suggests a more oxidizing environment with greater REE enrichment (Table 2) [61,62].
The carbon isotopic composition of global seawater during the Early Cambrian period shows significant fluctuations [24,42,50]. Subsequent oxidation of these dissolved organic carbon (DOC) reservoirs would release isotopically light carbon (i.e., 12C) into the dissolved inorganic carbon pool [27,32], driving the precipitation of 12C-rich carbonate minerals, which manifested as pronounced negative carbon isotope (δ13Ccarb) excursions in sedimentary records [27,28,63,64]. Alternatively, another possible reason for negative carbon isotope excursions could be attributed to diagenetic alteration of primary signals [65,66]. Notably, two negative δ13C excursions have been reported in the ZJQ Formation of the Yangtze Platform in South China [42,49].
Phosphorites from the BLT drill core exhibit multiple negative δ13C and δ18O excursions (Figure 9), which are consistent with previously reported data [49]. The δ13C and δ18O values of the phosphorites are more negative than those of the middle and lower dolostones from the ZYC member. Significantly, the most REE-enriched samples from the lower phosphorite layer exhibit the lowest carbon δ13Ccarb (−4.59‰) and oxygen δ18O isotopic values (−12.22‰). A decrease in δ18Ocarb values is commonly related to meteoric diagenesis [67]. Alternatively, δ18Ocarb values lower than −10‰ were likely related to diagenetic alteration under elevated burial temperatures [29]. However, petrological observations from the BLT section (Figure 2) reveal that these phosphorites underwent negligible recrystallization with minor diagenetic modification. This indicates that neither meteoric water nor late burial diagenesis was responsible for the depleted δ18O values in carbonates. Decomposed organic matter has been closely related to 12C-rich dolomite within phosphorites [68,69]. Several negative δ13C excursions recorded in the Early Cambrian have been interpreted as the result of organic matter decomposition associated with the upwelling within phosphorites [70]. We hypothesize that the paired negative δ13C and δ18O values of dolomites within phosphorites were mostly plausibly due to extensive organic matter decomposition under marine diagenesis conditions, likely coinciding with increased temperatures [44]. The lower phosphorite layer in the meishucun (MSC) section exhibits oolitic textures and evidence of high-energy reworking, indicating shallow-water depositional conditions. Geochemically, the MSC unit is characterized by higher δ13C (−3.87‰ to −2.43‰) and δ18O values (−9.8‰ to −8.4‰) compared to the BLT samples (δ13C = −4.59‰; δ18O = −12.22‰) [43]. Therefore, δ13C and δ18O values of dolomites further support that REE enrichment in phosphorites was likely syn-depositional, occurring prior to marine diagenesis.
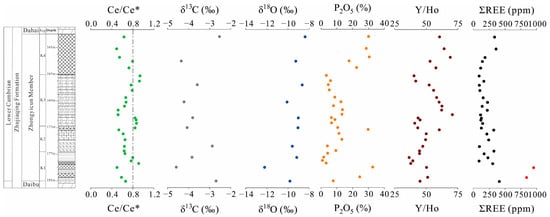
Figure 9.
Profiles of geochemistry of phosphorites and isotopic characters of carbonate of the Zhujiaqing Formation, at BLT drill.
5.3. Rare Earth Element Enrichment Revealled by LA-ICP-MS Analysis of Francolite
The in situ LA-ICP-MS results of various grain types and phosphatic cements provide further insights into REE enrichments in phosphorites (Figure 10). The lower phosphorite layer, predominantly composed of fine-grained collophane (grain size < 300 µm) and deposited in a proximal “deeper” shelf setting, exhibits ΣREE concentrations ranging from 643.03 to 1330.67 ppm (average 883.59 ± 160.91 ppm, n = 48), which are 2.7 to 8.3 times higher than those of the upper phosphorite layer. Note that phosphatic biogenic grains, with relatively larger sizes (d = 300–600 μm) and lower ΣREE (128.04 to 472.50 ppm, average 303.15 ppm, n = 64), dominated in the upper phosphorite layer. We tentatively interpret that REE enrichment in phosphorite was primarily controlled by (i) sustained REE3+-rich fluid available during the early diagenetic stage, and (ii) fine-grained particulates indicating lower water energy proximal to REE-rich water sources in deeper facies [71]. Cerium anomalies in phosphorites have been used to infer redox conditions [34]. In oxic marine environments, Ce3+ is oxidized to Ce4+, forming insoluble CeO2, which is then removed from seawater by scavenging through Fe and Mn oxyhydroxides or by organic matter in suspension [34,52,60,72]. During this process, Cerium fractionates from other lanthanides, resulting in strongly negative Ce anomalies. The weak correlations between Ce/Ce* and total REE content (r2 = 0.13) in collophane suggest that REE enrichment in the BLT phosphorites was not related to redox fluctuations (Figure 11A) [15,40].
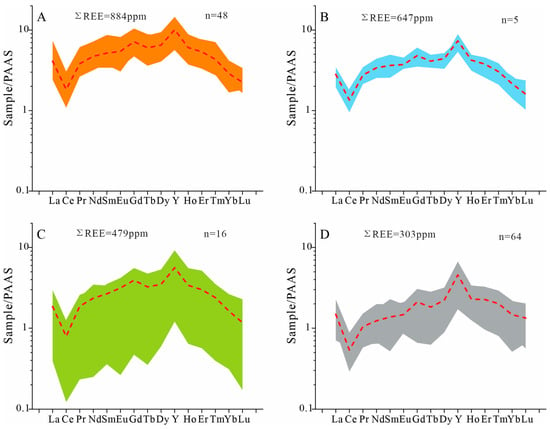
Figure 10.
REE patterns of apatite in different types of sedimentary phosphorite rocks and dolomite investigated by LA-ICP-MS analyses. REE patterns are normalized to the PAAS [19]. The red dashed line in the chart represents the average values. (A) Collophane grains, as shown in Figure 4B; (B) phosphatic detrital, as shown in Figure 4A; (C) phosphatic cement, as shown in Figure 4A; (D) phosphatic biogenic grains, as shown in Figure 4D,E.
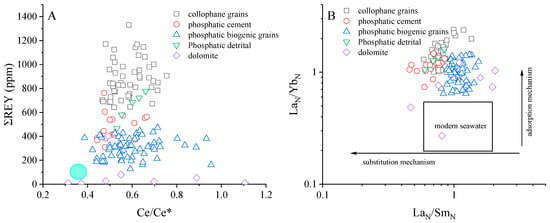
Figure 11.
Compositions of phosphorite grains determined by the LA-ICP-MS from the BLT region. (A) Correlations of Ce anomalies and total REE contents. The green filled circle for bottom seawater from [34]; (B) (La/Sm)N and (La/Yb)N values from in situ carbonate fluorapatite analysis after [73].
The effects of diagenesis on our samples were evaluated using the diagram proposed [73]. Biogenic phosphate is typically less susceptible to diagenetic alteration, thus reflecting the original sedimentary information. The biogenic phosphate exhibits (La/Yb)N ratios between 0.59 and 0.73 and (La/Sm)N ratios between 0.60 and 1.02, suggesting it is well-preserved [73]. The source of collophane grains is seawater, and we believe that the ‘primary’ (La/Yb)N and (La/Sm)N ratios of the phosphorite samples should resemble those of seawater. However, the (La/Yb)N and (La/Sm)N values of the phosphorite samples from BLT are higher than those of modern seawater (Figure 11B). Studies indicate that the (La/Yb)N and (La/Sm)N ratios are considered indicators of LREE and MREE enrichment [54,73]. The (La/Yb)N values would increase relative to seawater due to the preferential sorption of LREEs. The (La/Sm)N ratio would significantly decrease if substitution through the recrystallization of apatite predominates. It suggests that REE content was likely influenced by crystal surface adsorption and bulk crystal substitution during early diagenesis, with seawater playing a dominant role through adsorption mechanisms [73].
Optical microscopy and scanning electron microscopy (SEM) analyses reveal that the lower phosphorite layer is predominantly composed of banded collophane, whereas the upper layer contains sandy phosphatic grains with a clastic texture (Figure 4). The LA-ICP-MS results demonstrate significant REE fractionation among phosphate minerals: collophane exhibits the highest ΣREE concentrations, followed by phosphatic clasts and phosphate cement, with the latter two phases and biogenic apatite grains showing the lowest REE contents (Figure 4D,E). In terms of particle size distribution, collophane grains (<300 μm) are significantly smaller than biogenic apatite (200–600 μm) and clastic apatite (2000 μm), accounting for 80% of the lower phosphorite layer. We analyzed rare earth content within different particles, with many showing increases in REE+Y from the center toward the edge (Table S2). Notably, biogenic apatite grains display core-to-rim compositional zoning (Figure 4D, Table S2), characterized by elevated REE concentrations in their cores relative to their rims. Generally, collophane is a cryptocrystalline to amorphous primary phosphatic mineral. Phosphatic clasts signify the mechanical recycling of prior phosphate-rich deposits. Phosphatic cement records post-depositional diagenetic modification [12,74,75]. Petrographic evidence indicates that structureless collophane likely formed in low-energy depositional settings below the storm wave base [76], unaffected by terrigenous clastic input (Figure 4C). Thus, high REE concentrations in aqueous environments facilitate the direct substitution of Ca2+ within the apatite lattice by trivalent REE cations (e.g., La3+ and Ce3+), thereby enhancing their structural incorporation into the mineral framework [13,77,78]. Mineral paragenesis analysis demonstrates that phosphatic clasts and authigenic phosphate grains crystallized prior to the formation of early diagenetic cement (e.g., dolomite and phosphate cement). Phosphatic clasts and biogenic phosphates, typically formed in high-energy hydrodynamic environments, experience limited REE incorporation due to low ambient seawater REE concentrations. During subsequent diagenetic stages, the development of phosphatic cements occurs under pore fluid conditions where dissolved REE remains constrained by the pore water [30,35]. This study demonstrates that prolonged pre-burial interactions between collophane and REE- and P-enriched seawater facilitated REE incorporation via surface adsorption and lattice substitution (Figure 2). The high surface-to-volume ratio of collophane particles further enhanced their REE scavenging capacity during early diagenesis [19,79]. The observation that REEs decrease from grain margins to interiors (Figure 4E) further supports the notion of the predominance of surface-mediated processes in elemental sequestration [12,19].
5.4. REE-Rich Phosphorites Deposition Model
Sedimentary phosphorite deposits primarily form through upwelling currents, which transport cold, nutrient-rich ocean water from the deep ocean to shallow shelves, enhancing biological productivity [80,81,82]. It is suggested that organic matter decomposition may serve as a major source of REEs and 12C for dolomitic phosphorites [68,69]. The biogenic particulates carrying P and REEs, which are initially sourced from weathering detrital inputs [37,83,84,85,86], ultimately settle into deep-sea sediments [37,68,87]. The deeper facies seem to contain abundant and sustainable REE-rich water, which was likely due to organic matter remineralization, as revealed by the pronounced negative carbon isotope excursion observed in the lower BLT phosphorites layer. Carbonate fluorapatite (CFA) is thought to absorb phosphorus from pore water with marine chemical composition and form below the sediment–water interface. Our dataset reveals that REE enrichment is linked to redox conditions: (1) petrographic and geochemical analyses indicate that the lower phosphorite layer was deposited in a relatively deeper marine environment compared to the upper phosphorite layer; (2) the Ce/Ce* values of the lower phosphorites (average ~0.5) are lower than those of the upper phosphorites (average ~0.6) (Table 2), suggesting more oxic conditions during the deposition of the lower phosphorites. Therefore, redox condition likely played a key role in REE enrichment, with the higher REE+Y values in the lower phosphorites potentially attributed to enhanced organic matter-mediated adsorption and precipitation under more oxic conditions. The presence of bioclastic debris coincided with increased grain sizes and dolomite cements, supporting increased water energy during the upper phosphorites’ deposition (Figure 3E,F). Petrographic thin-section observations indicate that the upper phosphorite layer exhibits an oolitic texture (Figure 3H–I), which is interpreted to result from sedimentary reworking processes occurring under strong hydrodynamic conditions [43]. Minor scour surfaces have been observed in the upper phosphorite layer, indicating modification by strong hydrodynamic processes, such as wave action. Transgressive seas favor the initial formation of phosphorite deposits, though much phosphate may be fixed in shelf sediments, and shelf phosphates formed during high stands have a good chance of being reworked during drops in sea level [88]. Phosphorites were deposited in water depths of less than 200 m, so gravity-flow deposits are usually not developed in phosphorites. Additionally, the increased clay minerals coincide with markedly decreased grain sizes in the lower phosphorite layer and support deeper water depth (Table 1, Figure 4B). This vertical zonation implies that apatite in the upper phosphorite layer was deposited in relatively shallow marine settings, whereas the lower unit likely originated from deeper-water environments, as evidenced by their distinct microtextural signatures and mineral associations (Figure 3 and Figure 4). REEs primarily occur in three forms: ion-adsorbed states, independent minerals, and isomorphic substitution. Previous studies have shown that REEs in phosphorites are rarely present in the ion-adsorbed form. XRD and SEM analyses indicate that the main ore minerals in the studied area are apatite, dolomite, and quartz, with accessory minerals including pyrite, iron oxides, and clay minerals. No REE-rich independent minerals were identified. In situ microanalysis of trace elements in minerals reveals that apatite contains significantly higher REE concentrations compared to dolomite, while quartz and pyrite are nearly devoid of REE. On a plot of whole-rock ΣREE contents versus P2O5 contents, the REE-rich (i.e., ZJ) phosphorites studied show a positive correlation, indicating that REEs occur mainly in phosphate minerals [10]. Collophane and phosphatic colluvium have higher specific surface area and thus are expected to absorb more REEs than biotite apatite grains. On the other hand, the lower phosphorite layer contains higher P contents. These two aspects lead to higher levels of rare earth elements in the lower phosphorite layer than in the upper. REE3+ are able to occupy the Ca2+ site in apatite via two substitutions, REE3+ + Na+ ↔ 2Ca2+ and REE3+ + Si4+ ↔ Ca2+ + P5+ [89], and can be sequestered by most phosphates (e.g., biological apatite) in marine-sediment REEs from the surrounding water column via diffusion [22]. Additionally, (La/Sm)N and (La/Yb)N ratio diagrams suggest that REE incorporation into apatite predominantly occurs through an adsorption mechanism rather than substitution (Figure 11B).
We propose a two-stage phosphorite deposition model to interpret the observed distinctive REE values, which were primarily related to sedimentary facies (Figure 12). During the first stage, phosphorite deposition occurred in relative deep-water environments proximal to REE-rich water via the dissolution of organic matter [86,90]. Supporting this is the remarkably high concentrations of REE (8176 to 32,000 ppm) observed in deep-sea authigenic apatite [91]. During the second stage, coastal upwelling transported phosphorites along with REE-rich deep water into shallow shelf environments. This process would have facilitated water mixing and diluted the REE concentration in the waterbody, resulting in decreased REE in the upper phosphorite layer. In addition, the migration of upwelling currents results in nutrient depletion in the water column due to apatite deposition, ultimately leading to lower concentrations of REE availability in distal apatite deposits. The finding that phosphorites deposited in deeper facies proximal to REE-rich water aligns well with previous reports of markedly elevated REE concentrations in Zhijin phosphorites from deeper facies [10,37,58], in contrast to the much lower REE levels in Meishucun phosphorites from shallower facies [43]. This study highlights the crucial role of the depositional environment, especially the coupling relationship with the spatial-temporal development of REE-rich water in deeper facies, in controlling REE enrichment in phosphorites. Hence, this new contribution could provide valuable insights for REE exploration in Early Cambrian sedimentary phosphorites from the Yangtze area and other sedimentary phosphorites worldwide.
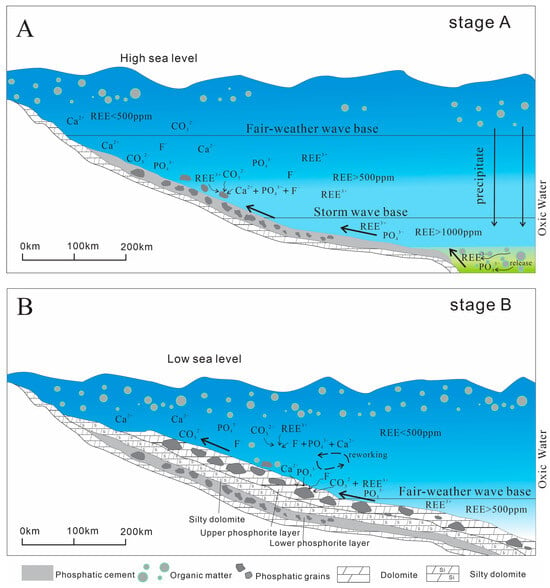
Figure 12.
Conceptual model of the REE mineralization and sedimentation of francolite grains in the BLT deposit. (A) Organic matter transported by oceanic currents to deep-sea regions undergoes decomposition, releasing REE and nutrients. These components subsequently enrich the DOC reservoir through biogeochemical cycling processes, particularly involving P and REEs, ultimately leading to their accumulation in deep-sea sediments. Upwelling transports deep seawater enriched in P and REE to the oxic environment, where the initial lower phosphorite layer forms through precipitation. (B) In shallow marine environments with low dissolved rare earth element (REE) concentrations, the precipitation of REE-depleted apatite is driven by limited availability of REEs in the water column. Nutrient enrichment from upwelling events enhances primary productivity, while subsequent hydrodynamic processes, such as wave action, transport biogenic particulates to deeper marine zones, facilitating the coupled biogeochemical cycling of phosphorus and REEs.
6. Conclusions
This study investigates a newly identified Early Cambrian phosphorite deposit, the BLT phosphorites in South China, which exhibit variable REE concentrations across the examined stratigraphic profile. By integrating mineralogical analyses, bulk-rock geochemical data, and in situ trace element measurements, this study aims to elucidate the origin and enrichment mechanisms of REEs in these phosphorites.
The results suggest that the formation of phosphorites and REE enrichment primarily occurred under seawater-dominated, oxic diagenetic conditions. Elevated REE concentrations, coinciding with negative shifts in δ13C and δ18O values in the lower phosphorite layer, which is dominated by collophane grains, indicate that REE enrichment was likely syn-depositional and involved enhanced organic matter decomposition. In contrast, the upper phosphorite layer, dominated by larger reworked grains with abundant dolomite cement, exhibits markedly lower REE concentrations.
A two-stage phosphorite deposition model is proposed to explain the differential REE enrichment within these phosphorites, emphasizing the critical role of spatial-temporal proximity to REE-rich waters in deeper facies. This study provides new insights into the mechanisms of REE enrichment in sedimentary phosphorites, contributing to a better understanding of their formation and resource potential.
Supplementary Materials
The following supporting information can be downloaded at: https://www.mdpi.com/article/10.3390/min15060581/s1, Table S1. Analytical results of major elements and δ13CVPDB and δ18OVPDB of carbonate from BLT section.; Table S2: In situ REY (ppm) concentrations of dolomites from phosphorus-bearing dolostones, and phosphorites measured using LA-ICP-MS.
Author Contributions
Conceptualization, W.M., C.C. and L.J.; methodology, W.M. and Z.W.; formal analysis, W.M.; investigation, W.M.; resources, W.M., C.C. and L.J.; data curation, W.M. and X.M.; writing—original draft preparation, W.M.; writing—review and editing, L.J. and C.C.; visualization, W.M. All authors have read and agreed to the published version of the manuscript.
Funding
This study received financial support from the Strategic Priority Research Program of the Chinese Academy of Sciences (grant no. XDA0430202).
Data Availability Statement
Data are contained within the article and Supplementary Materials.
Conflicts of Interest
The authors declare no conflicts of interest.
References
- Skinner, L.; Sadekov, A.; Brandon, M.; Greaves, M.; Plancherel, Y.; de la Fuente, M.; Gottschalk, J.; Souanef-Ureta, S.; Sevilgen, D.; Scrivner, A. Rare Earth Elements in early-diagenetic foraminifer ‘coatings’: Pore-water controls and potential palaeoceanographic applications. Geochim. Cosmochim. 2019, 245, 118–132. [Google Scholar] [CrossRef]
- Wang, G.; Xu, J.; Ran, L.; Zhu, R.; Ling, B.; Liang, X.; Kang, S.; Wang, Y.; Wei, J.; Ma, L.; et al. A green and efficient technology to recover rare earth elements from weathering crusts. Nat. Sustain. 2023, 6, 81–92. [Google Scholar] [CrossRef]
- Wang, G.; Zhu, J.; Liang, X.; Ling, B.; Xu, J.; Yang, Y.; Kang, S.; Tan, W.; Xu, Y.; Zou, X.; et al. Industrial-scale sustainable rare earth mining enabled by electrokinetics. Nat. Sustain. 2025, 8, 182–189. [Google Scholar] [CrossRef]
- Kato, Y.; Fujinaga, K.; Nakamura, K.; Takaya, Y.; Kitamura, K.; Ohta, J.; Toda, R.; Nakashima, T.; Iwamori, H. Deep-sea mud in the Pacific Ocean as a potential resource for rare-earth elements. Nat. Geosci. 2011, 4, 535–539. [Google Scholar] [CrossRef]
- Liu, S.-L.; Fan, H.-R.; Liu, X.; Meng, J.; Butcher, A.R.; Yann, L.; Yang, K.-F.; Li, X.-C. Global rare earth elements projects: New developments and supply chains. Ore Geol. Rev. 2023, 157, 105428. [Google Scholar] [CrossRef]
- Ilankoon, I.; Dushyantha, N.; Mancheri, N.; Edirisinghe, P.; Neethling, S.; Ratnayake, N.; Rohitha, L.; Dissanayake, D.; Premasiri, H.; Abeysinghe, A.; et al. Constraints to rare earth elements supply diversification: Evidence from an industry survey. J. Clean. Prod. 2022, 331, 129932. [Google Scholar] [CrossRef]
- Emsbo, P.; McLaughlin, P.I.; Breit, G.N.; du Bray, E.A.; Koenig, A.E. Rare earth elements in sedimentary phosphate deposits: Solution to the global REE crisis? Gondwana Res. 2015, 27, 776–785. [Google Scholar] [CrossRef]
- Xing, J.Q.; Jiang, Y.H.; Xian, H.Y.; Yang, W.B.; Yang, Y.P.; Niu, H.C.; He, H.P.; Zhu, J.X. Rare earth element enrichment in sedimentary phosphorites formed during the Precambrian-Cambrian transition, Southwest China. Geosci. Front. 2024, 15, 101766. [Google Scholar] [CrossRef]
- Gläser, L.; Grosche, A.; Voudouris, P.C.; Haase, K.M. The high-K calc-alkaline to shoshonitic volcanism of Limnos, Greece: Implications for the geodynamic evolution of the northern Aegean. Contrib. Miner. Pet. 2022, 177, 73. [Google Scholar] [CrossRef]
- Zhang, Z.; Jiang, Y.; Niu, H.; Xing, J.; Yan, S.; Li, A.; Weng, Q.; Zhao, X. Enrichment of rare earth elements in the early Cambrian Zhijin phosphorite deposit, SW China: Evidence from francolite micro-petrography and geochemistry. Ore Geol. Rev. 2021, 138, 104342. [Google Scholar] [CrossRef]
- Zhang, K.; Shields, G.A. Early diagenetic mobilization of rare earth elements and implications for the Ce anomaly as a redox proxy. Chem. Geol. 2023, 635, 121619. [Google Scholar] [CrossRef]
- Aubineau, J.; Parat, F.; Fru, E.C.; El Bamiki, R.; Mauguin, O.; Baron, F.; Poujol, M.; Séranne, M. Geodynamic seawater-sediment porewater evolution of the east central Atlantic Paleogene ocean margin revealed by U-Pb dating of sedimentary phosphates. Front. Earth Sci. 2022, 10, 997008. [Google Scholar] [CrossRef]
- Zivak, D.; Spandler, C.; Valetich, M. Origin of REE enrichment in the Cambrian Georgina Basin Phosphorites. Geochem. Geophys. Geosystems 2024, 25, 487. [Google Scholar] [CrossRef]
- Hill, R.C.; Wang, Z.; Williams, G.D.; Polyak, V.; Singh, A.; Kipp, M.A.; Asmerom, Y.; Vengosh, A. Reconstructing the depositional environment and diagenetic modification of global phosphate deposits through integration of uranium and strontium isotopes. Chem. Geol. 2024, 662, 122214. [Google Scholar] [CrossRef]
- Lécuyer, C.; Reynard, B.; Grandjean, P. Rare earth element evolution of Phanerozoic seawater recorded in biogenic apatites. Chem. Geol. 2004, 204, 63–102. [Google Scholar] [CrossRef]
- Fan, H.; Wen, H.; Zhu, X.; Hu, R.; Tian, S. Hydrothermal activity during Ediacaran–Cambrian transition: Silicon isotopic evidence. Precambrian Res. 2013, 224, 23–35. [Google Scholar] [CrossRef]
- Xing, J.; Jiang, Y.; Xian, H.; Yang, W.; Yang, Y.; Tan, W.; Niu, H.; He, H.; Zhu, J. Hydrothermal alteration and the remobilization of rare earth elements during reprecipitation of nano-scale apatite in phosphorites. Lithos 2023, 444, 107113. [Google Scholar] [CrossRef]
- Xing, J.; Jiang, Y.; Xian, H.; Zhang, Z.; Yang, Y.; Tan, W.; Liang, X.; Niu, H.; He, H.; Zhu, J. Hydrothermal activity during the formation of REY-rich phosphorites in the early Cambrian Gezhongwu Formation, Zhijin, South China: A micro- and nano-scale mineralogical study. Ore Geol. Rev. 2021, 136, 104224. [Google Scholar] [CrossRef]
- McArthur, J.; Walsh, J. Rare earth geochemistry of phosphorites. Chem. Geol. 1985, 47, 191–220. [Google Scholar] [CrossRef]
- Francovschi, I.; Gradinaru, E.; Roban, R.D.; Ducea, M.N.; Ciobotaru, V.; Shumlyanskyy, L. Rare earth element (REE) enrichment of the late Ediacaran Kalyus Beds (East European Platform) through diagenetic uptake. Geochemistry 2020, 80, 125612. [Google Scholar] [CrossRef]
- Tlig, S.; Sassi, A.; Belayouni, H.; Michel, D. Uranium, thorium, zirconium, hafnium and rare-earth element (REE) distributions in size fractions of sedimentary phosphates. Chem. Geol. 1987, 62, 209–221. [Google Scholar] [CrossRef]
- Deng, Y.; Guo, Q.; Liu, C.; He, G.; Cao, J.; Liao, J.; Liu, C.; Wang, H.; Zhou, J.; Liu, Y.; et al. Early diagenetic control on the enrichment and fractionation of rare earth elements in deep-sea sediments. Sci. Adv. 2022, 8, eabn5466. [Google Scholar] [CrossRef] [PubMed]
- Yu, L.-M.; Liu, M.-X.; Dan, Y.; Said, N.; Wu, J.-H.; Hou, M.-C.; Zou, H. The origin of Ediacaran phosphogenesis event: New insights from Doushantuo Formation in the Danzhai phosphorite deposit, South China. Ore Geol. Rev. 2023, 152, 105230. [Google Scholar] [CrossRef]
- Yao, C.; Ma, D.; Ding, H.; Zhang, X.; Huang, H. Trace elements and stable isotopic geochemistry of an Early Cambrian chert-phosphorite unit from the lower Yurtus Formation of the Sugetbrak section in the Tarim Basin. Sci. China Earth Sci. 2014, 57, 454–464. [Google Scholar] [CrossRef]
- Da, L.; Ling, H.-F.; Shields-Zhou, G.A.; Chen, X.; Cremonese, L.; Och, L.; Thirlwall, M.; Manning, C.J. Carbon and strontium isotope evolution of seawater across the Ediacaran-Cambrian transition: Evidence from the Xiaotan section, NE Yunnan, South China. Precambrian Res. 2013, 225, 128–147. [Google Scholar]
- Zhao, K.; Zhu, G.; Li, T.; Chen, Z.; Li, S. Fluctuations of continental chemical weathering control primary productivity and redox conditions during the Earliest Cambrian. Geol. J. 2023, 58, 3659–3672. [Google Scholar] [CrossRef]
- Ishikawa, T.; Ueno, Y.; Shu, D.; Li, Y.; Han, J.; Guo, J.; Yoshida, N.; Komiya, T. Irreversible change of the oceanic carbon cycle in the earliest Cambrian: High-resolution organic and inorganic carbon chemostratigraphy in the Three Gorges area, South China. Precambrian Res. 2013, 225, 190–208. [Google Scholar] [CrossRef]
- Rothman, D.H.; Hayes, J.M.; Summons, R.E. Dynamics of the Neoproterozoic carbon cycle. Proc. Natl. Acad. Sci. USA 2003, 100, 8124–8129. [Google Scholar] [CrossRef]
- Kaufman, A.J.; Jacobsen, S.B.; Knoll, A.H. The Vendian record of Sr and C isotopic variations in seawater: Implications for tectonics and paleoclimate. Earth Planet. Sci. Lett. 1993, 120, 409–430. [Google Scholar] [CrossRef]
- Garnit, H.; Bouhlel, S.; Barca, D.; Chtara, C. Application of LA-ICP-MS to sedimentary phosphatic particles from Tunisian phosphorite deposits: Insights from trace elements and REE into paleo-depositional environments. Chem. Erde-Geochem. 2012, 72, 127–139. [Google Scholar] [CrossRef]
- Kim, M.G.; Hyeong, K.; Yoo, C.M. Distribution of rare earth elements and yttrium in sediments from the Clarion-Clipperton Fracture Zone, Northeastern Pacific Ocean. Geochem. Geophys. Geosystems 2022, 23, e2022GC010454. [Google Scholar] [CrossRef]
- Liu, Z.R.R.; Zhou, M.F. Early Cambrian ocean mixing recorded by phosphorite successions in the Nanhua Basin, South China. Precambrian Res. 2020, 349, 105414. [Google Scholar] [CrossRef]
- Xin, H.; Jiang, S.-Y.; Yang, J.-H.; Wu, H.-P.; Pi, D.-H. Rare earth element and Sr-Nd isotope geochemistry of phosphatic rocks in Neoproterozoic Ediacaran Doushantuo Formation in Zhangcunping section from western Hubei Province, South China. Palaeogeogr. Palaeoclim. Palaeoecol. 2015, 440, 712–724. [Google Scholar] [CrossRef]
- Shields, G.; Stille, P. Diagenetic constraints on the use of cerium anomalies as palaeoseawater redox proxies: An isotopic and REE study of Cambrian phosphorites. Chem. Geol. 2001, 175, 29–48. [Google Scholar] [CrossRef]
- Lumiste, K.; Mänd, K.; Bailey, J.; Paiste, P.; Lang, L.; Lepland, A.; Kirsimäe, K. REE plus Y uptake and diagenesis in Recent sedimentary apatites. Chem. Geol. 2019, 525, 268–281. [Google Scholar] [CrossRef]
- Yang, H.Y.; Xiao, J.F.; Xia, Y.; Zhao, Z.F.; Xie, Z.J.; He, S.; Wu, S.W. Diagenesis of Ediacaran-early Cambrian phosphorite: Comparisons with recent phosphate sediments based on, LA-ICP-MS and EMPA. Ore Geol. Rev. 2022, 144, 104813. [Google Scholar] [CrossRef]
- Wu, S.; Fan, H.; Xia, Y.; Meng, Q.; Gong, X.; He, S.; Liu, X.; Yang, H.; Wen, H. Sources of rare earth elements and yttrium in the early Cambrian phosphorites in Zhijin, southwest China. Ore Geol. Rev. 2022, 150, 105146. [Google Scholar] [CrossRef]
- Wu, S.; Yang, H.; Fan, H.; Xia, Y.; Meng, Q.; He, S.; Gong, X. Assessment of the effect of organic matter on rare earth elements and yttrium using the Zhijin Early Cambrian phosphorite as an example. Minerals 2022, 12, 876. [Google Scholar] [CrossRef]
- Pi, D.-H.; Liu, C.-Q.; Shields-Zhou, G.A.; Jiang, S.-Y. Trace and rare earth element geochemistry of black shale and kerogen in the early Cambrian Niutitang Formation in Guizhou province, South China: Constraints for redox environments and origin of metal enrichments. Precambrian Res. 2013, 225, 218–229. [Google Scholar] [CrossRef]
- Fan, H.F.; Wen, H.J.; Zhu, X.K. Marine redox conditions in the Early Cambrian ocean: Insights from the Lower Cambrian phosphorite deposits, South China. J. Earth Sci. 2016, 27, 282–296. [Google Scholar] [CrossRef]
- Fan, H.F.; Wen, H.J.; Xiao, C.Y.; Zhou, T.; Cloquet, C.; Zhu, X.K. Zinc geochemical cycling in a phosphorus-rich ocean during the Early Ediacaran. J. Geophys. Res. Ocean. 2018, 123, 5248–5260. [Google Scholar] [CrossRef]
- Gao, L.; Yang, R.; Gao, J.; Luo, C.; Liu, L.; Ni, X.; Li, X.; Mo, H.; Peng, R. The paleoecological environment during the Ediacaran–Cambrian transition in central Guizhou Province, China: Evidence from Zn isotopes. Minerals 2024, 14, 224. [Google Scholar] [CrossRef]
- Liu, Z.R.R.; Zhou, M.F. Meishucun phosphorite succession (SW China) records redox changes of the early Cambrian ocean. Geol. Soc. Am. Bull. 2017, 129, 1554–1567. [Google Scholar] [CrossRef]
- Yang, H.; Xiao, J.; Xia, Y.; Xie, Z.; Tan, Q.; Xu, J.; He, S.; Wu, S.; Liu, X.; Gong, X. Phosphorite generative processes around the Precambrian-Cambrian boundary in South China: An integrated study of Mo and phosphate O isotopic compositions. Geosci. Front. 2021, 12, 101187. [Google Scholar] [CrossRef]
- Ye, Y.; Wang, H.; Wang, X.; Zhai, L.; Wu, C.; Zhang, S. Elemental geochemistry of lower Cambrian phosphate nodules in Guizhou Province, South China: An integrated study by LA-ICP-MS mapping and solution ICP-MS. Palaeogeogr. Palaeoclimatol. Palaeoecol. 2020, 538, 109459. [Google Scholar] [CrossRef]
- Steiner, M.; Wallis, E.; Erdtmann, B.-D.; Zhao, Y.; Yang, R. Submarine-hydrothermal exhalative ore layers in black shales from South China and associated fossils—Insights into a Lower Cambrian facies and bio-evolution. Palaeogeogr. Palaeoclimatol. Palaeoecol. 2001, 169, 165–191. [Google Scholar] [CrossRef]
- Li, Y.; Fan, T.; Zhang, J.; Zhang, J.; Wei, X.; Hu, X.; Zeng, W.; Fu, W. Geochemical changes in the Early Cambrian interval of the Yangtze Platform, South China: Implications for hydrothermal influences and paleocean redox conditions. J. Asian Earth Sci. 2015, 109, 100–123. [Google Scholar] [CrossRef]
- Li, D.; Ling, H.-F.; Jiang, S.-Y.; Pan, J.-Y.; Chen, Y.-Q.; Cai, Y.-F.; Feng, H.-Z. New carbon isotope stratigraphy of the Ediacaran-Cambrian boundary interval from SW China: Implications for global correlation. Geol. Mag. 2009, 146, 465–484. [Google Scholar] [CrossRef]
- Shen, Y.; Schidlowski, M. New C isotope stratigraphy from southwest China: Implications for the placement of the Precambrian-Cambrian boundary on the Yangtze Platform and global correlations. Geology 2000, 29, 871–872. [Google Scholar]
- Zhang, G.; Chen, D.; Ding, Y.; Huang, T. Controls on organic matter accumulation from an upper slope section on the Early Cambrian Yangtze Platform, South China. Minerals 2023, 13, 260. [Google Scholar] [CrossRef]
- Gu, L.; Hu, S.; Anand, M.; Tang, X.; Ji, J.; Zhang, B.; Wang, N.; Lin, Y. Occurrence of tuite and ahrensite in Zagami and their significance for shock-histories recorded in martian meteorites. Am. Mineral 2022, 107, 1018–1029. [Google Scholar] [CrossRef]
- Bau, M.; Dulski, P. Distribution of yttrium and rare-earth elements in the Penge and Kuruman iron-formations, Transvaal Supergroup, South Africa. Precambrian Res. 1996, 79, 37–55. [Google Scholar] [CrossRef]
- Lawrence, M.G.; Greig, A.; Collerson, K.D.; Kamber, B.S. Rare earth element and yttrium variability in south East Queensland waterways. Aquat. Geochem. 2006, 12, 39–72. [Google Scholar] [CrossRef]
- Fazio, A.M.; Scasso, R.A.; Castro, L.N.; Carey, S. Geochemistry of rare earth elements in early-diagenetic miocene phosphatic concretions of Patagonia, Argentina: Phosphogenetic implications. Deep. Sea Res. Part II Top. Stud. Oceanogr. 2007, 54, 1414–1432. [Google Scholar] [CrossRef]
- Schuffert, J.; Kastner, M.; Emanuele, G.; Jahnke, R. Carbonate-ion substitution in francolite: A new equation. Geochimica Cosmochimica Acta 1990, 54, 2323–2328. [Google Scholar] [CrossRef]
- Zhang, Y.; Li, Z.; Dini, S.M.; Qin, M.; Banakhar, A.S.; Li, Z.; Yi, L.; Memesh, A.M.; Shammari, A.M.; Li, G. Origin and evolution of the late cretaceous reworked phosphorite in the Sirhan-Turayf Basin, Northern Saudi Arabia. Minerals 2021, 11, 350. [Google Scholar] [CrossRef]
- El Bamiki, R.; Séranne, M.; Parat, F.; Aubineau, J.; Chellaï, E.H.; Marzoqi, M.; Bodinier, J.-L. Post-phosphogenesis processes and the natural beneficiation of phosphates: Geochemical evidence from the Moroccan High Atlas phosphate-rich sediments. Chem. Geol. 2023, 631, 121523. [Google Scholar] [CrossRef]
- He, S.; Xia, Y.; Xiao, J.; Gregory, D.; Xie, Z.; Tan, Q.; Yang, H.; Guo, H.; Wu, S.; Gong, X. Geochemistry of REY-Enriched Phosphorites in Zhijin Region, Guizhou Province, SW China: Insight into the Origin of REY. Minerals 2022, 12, 408. [Google Scholar] [CrossRef]
- Kechiched, R.; Laouar, R.; Bruguier, O.; Kocsis, L.; Salmi-Laouar, S.; Bosch, D.; Ameur-Zaimeche, O.; Foufou, A.; Larit, H. Comprehensive REE plus Y and sensitive redox trace elements of Algerian phosphorites (Tebessa, eastern Algeria): A geochemical study and depositional environments tracking. J. Geochem. Explor. 2020, 208, 106396. [Google Scholar] [CrossRef]
- Elderfield, H.; Pagett, R. Rare earth elements in ichthyoliths: Variations with redox conditions and depositional environment. Sci. Total Environ. 1986, 49, 175–197. [Google Scholar] [CrossRef]
- Compton, J.S.; Bergh, E.W. Phosphorite deposits on the Namibian shelf. Mar. Geol. 2016, 380, 290–314. [Google Scholar] [CrossRef]
- Föellmi, K.B. Sedimentary condensation. Earth Sci. Rev. 2016, 152, 143–180. [Google Scholar] [CrossRef]
- Knauth, L.P.; Kennedy, M.J. The late Precambrian greening of the Earth. Nature 2009, 460, 728–732. [Google Scholar] [CrossRef]
- Wei, T.; Cai, C.; Xiong, Y.; Bowyer, F.T.; Poulton, S.W. Environmental controls on Early Cambrian macroevolution: Insights from the Tarim Basin, Northwest China. GSA Bull. 2025. [Google Scholar] [CrossRef]
- Yang, X.; Chang, C.; Chen, Y.; Topper, T.; Liu, F.; Liang, Y.; Fang, R.; Zhang, Z. Geochemical records and environmental analysis of the Ediacaran-Cambrian boundary in Eastern Yunnan, South China. Front. Earth Sci. 2023, 11, 1173846. [Google Scholar] [CrossRef]
- Jiang, G.; Wang, X.; Shi, X.; Xiao, S.; Zhang, S.; Dong, J. The origin of decoupled carbonate and organic carbon isotope signatures in the early Cambrian (ca 542–520 Ma) Yangtze platform. Earth Planet. Sci. Lett. 2012, 317, 96–110. [Google Scholar] [CrossRef]
- Kaufman, A.J.; Knoll, A.H. Neoproterozoic variations in the C-isotopic composition of seawater: Stratigraphic and biogeochemical implications. Precambrian Res. 1995, 73, 27–49. [Google Scholar] [CrossRef]
- Felitsyn, S.; Morad, S. REE patterns in latest Neoproterozoic–Early Cambrian phosphate concretions and associated organic matter. Chem. Geol. 2002, 187, 257–265. [Google Scholar] [CrossRef]
- Canfield, D.E.; Poulton, S.W.; Narbonne, G.M. Late-Neoproterozoic deep-ocean oxygenation and the rise of animal life. Science 2007, 315, 92–95. [Google Scholar] [CrossRef]
- Wu, C.; Zhang, L.; Zhang, T.; Tuo, J.; Song, D.; Liu, Y.; Zhang, M.; Xing, L. Reconstruction of paleoceanic redox conditions of the lower Cambrian Niutitang shales in northern Guizhou, Upper Yangtze region. Palaeogeogr. Palaeoclimatol. Palaeoecol. 2020, 538, 109457. [Google Scholar] [CrossRef]
- Zhang, H.J.; Fan, H.F.; Wen, H.J.; Han, T.; Zhou, T.; Xia, Y. Controls of REY enrichment in the early Cambrian phosphorites. Geochim. Cosmochim. Acta 2022, 324, 117–139. [Google Scholar] [CrossRef]
- Bau, M. Rare-earth element mobility during hydrothermal and metamorphic fluid-rock interaction and the significance of the oxidation state of europium. Chem. Geol. 1991, 93, 219–230. [Google Scholar] [CrossRef]
- Reynard, B.; Lécuyer, C.; Grandjean, P. Crystal-chemical controls on rare-earth element concentrations in fossil biogenic apatites and implications for paleoenvironmental reconstructions. Chem. Geol. 1999, 155, 233–241. [Google Scholar] [CrossRef]
- Föllmi, K.B. The phosphorus cycle, phosphogenesis and marine phosphate-rich deposits. Earth-Sci. Rev. 1996, 40, 55–124. [Google Scholar] [CrossRef]
- Abou El-Anwar, E.A.; Rahim, S.H.A.E. Mineralogy, geochemistry and origin of the phosphorites at Um El-Huwtat mine, Quseir, Central Eastern Desert, Egypt. Carbonate Evaporite 2022, 37, 16. [Google Scholar] [CrossRef]
- Awadalla, G.S. Geochemistry and microprobe investigations of Abu Tartur REE-bearing phosphorite, Western Desert, Egypt. J. Afr. Earth Sci. 2010, 57, 431–443. [Google Scholar] [CrossRef]
- Burnett, W.C. Geochemistry and Origin of Phosphorite Deposits from Off Peru and Chile. Geol. Soc. Am. Bull. 1977, 88, 813–823. [Google Scholar] [CrossRef]
- Kanazawa, Y.; Kamitani, M. Rare earth minerals and resources in the world. J. Alloys Compd. 2006, 408, 1339–1343. [Google Scholar] [CrossRef]
- Ilyin, A.V. Rare-earth geochemistry of ‘old’ phosphorites and probability of syngenetic precipitation and accumulation of phosphate. Chem. Geol. 1998, 144, 243–256. [Google Scholar] [CrossRef]
- Abed, A.M. The eastern Mediterranean phosphorite giants: An interplay between tectonics and upwelling. Geoarabia 2013, 18, 67–94. [Google Scholar] [CrossRef]
- Xu, L.; Frank, A.; Frei, R.; Wang, G.; Yuan, P.; Fu, X.; Lehmann, B. Oxidative weathering on the continent and seawater upwelling along the passive continental margin promoted widespread phosphorite formation at the Neoproterozoic-Cambrian boundary in South China. Chem. Geol. 2024, 670, 122418. [Google Scholar] [CrossRef]
- Glenn, C.R.; Föllmi, K.B.; Riggs, S.R.; Baturin, G.N.; Grimm, K.A.; Trappe, J.; Abed, A.M.; Galli-Oliver, C.; Garrison, R.E.; Ilyan, A.V.; et al. Phosphorus and phosphorites: Sedimentology and environments of formation. Eclogae Geol. Helv. 1994, 87, 747–788. [Google Scholar]
- Planavsky, N.J.; Rouxel, O.J.; Bekker, A.; Lalonde, S.V.; Konhauser, K.O.; Reinhard, C.T.; Lyons, T.W. The evolution of the marine phosphate reservoir. Nature 2010, 467, 1088–1090. [Google Scholar] [CrossRef]
- Kholodov, V.N. Geochemistry of phosphorus and origin of phosphorites: Communication 2. Sources of phosphorus in continents and genesis of marine phosphorites. Lithol Miner. Resour. 2003, 38, 477–494. [Google Scholar] [CrossRef]
- Föllmi, K.B.; Hosein, R.; Arn, K.; Steinmann, P. Weathering and the mobility of phosphorus in the catchments and forefields of the Rhône and Oberaar glaciers, central Switzerland: Implications for the global phosphorus cycle on glacial–interglacial timescales. Geochim. Cosmochim. Acta 2009, 73, 2252–2282. [Google Scholar] [CrossRef]
- Barale, L.; D’Atri, A.; Martire, L. The role of microbial activity in the generation of lower Cretaceous mixed Fe-oxide-phosphate ooids from the proven?al domain, French Maritime Alps. J. Sediment. Res. 2013, 83, 168–178. [Google Scholar] [CrossRef]
- Baturin, G.N. Issue of the relationship between primary productivity of organic carbon in ocean and phosphate accumulation (Holocene-Late Jurassic). Lithol Miner. Resour. 2007, 42, 318–348. [Google Scholar] [CrossRef]
- Arthur, M.A.; Jenkyns, H.C. Phosphorites and Paleoceanography. Oceanol. Acta 1981, 1980, 1–51. [Google Scholar]
- Fleet, M.E.; Pan, Y. Site preference of rare earth elements in fluorapatite: Binary (LREE + HREE)-substituted crystals. Am. Mineral. 1997, 82, 870–877. [Google Scholar] [CrossRef]
- Filippelli, G.M. The global phosphorus cycle: Past, present, and future. Elements 2008, 4, 89–95. [Google Scholar] [CrossRef]
- Fan, W.; Zhou, J.; Yuan, P.; Zhang, H.; Wang, F.; Liu, D.; Dong, Y. Identifying the roles of major phosphorus fractions in REY enrichment of Pacific deep-sea sediments using sequential extraction and mineralogical analysis. Ore Geol. Rev. 2023, 157, 105430. [Google Scholar] [CrossRef]
Disclaimer/Publisher’s Note: The statements, opinions and data contained in all publications are solely those of the individual author(s) and contributor(s) and not of MDPI and/or the editor(s). MDPI and/or the editor(s) disclaim responsibility for any injury to people or property resulting from any ideas, methods, instructions or products referred to in the content. |
© 2025 by the authors. Licensee MDPI, Basel, Switzerland. This article is an open access article distributed under the terms and conditions of the Creative Commons Attribution (CC BY) license (https://creativecommons.org/licenses/by/4.0/).