Abstract
The tight sandstone reservoirs within the Oligocene Huagang Formation represent one of the most promising exploration targets for future hydrocarbon development in the Xihu Depression of the East China Sea Basin. The reservoir has complex sedimentary and diagenetic processes. In this paper, a variety of methods, such as microscopic image observation, particle size analysis, X-ray diffraction measurement (XRD), heavy minerals, carbon and oxygen isotopes of cement, the homogenization temperature of fluid inclusions, zircon (U-Th)/He isotopes, and high-pressure mercury intrusion (HPMI), are used to analyze the thermal evolution history, diagenetic evolution process, and the causes of differences in diagenetic processes and high-quality reservoirs. This study shows that the provenance of the southern region is derived from western metamorphic rock, while that of the northern region is dominated by northern metamorphic rock, including some eastern volcanic rock. The northern region exhibits a stronger compaction and lower porosity, primarily due to a greater proportion of volcanic rock provenance. Additionally, coarse-grained lithofacies exhibit a higher quartz content and lower proportions of clay minerals and lithic fragment compared to fine-grained lithofacies, consequently demonstrating greater resistance to compaction. The Huagang Formation reservoir has three stages of carbonate cementation, two stages of quartz overgrowth, and two stages of fluid charging. The two stages of fluid charging correspond to two stages of organic acid dissolution. In the northern region, the geothermal gradient is high, and the burial depth is large, so the diagenetic event occurred earlier and is now in the mesodiagenesis B stage, while in the southern region, the geothermal gradient is low, and the burial depth is small and is now in the mesodiagenesis A stage. The southern distributary channel sands and northern high-energy braided channel sands constitute high-quality reservoirs, characterized by a coarse grain size, large pore throats, and minimal cement content.
1. Introduction
In the past decades, with the increasing investment in offshore oil and gas exploration and development, a large number of offshore oil and gas resources have been discovered [1,2,3]. However, the number of offshore wells is often small, which leads to an unclear understanding of many geological aspects, especially the complex formation process of low-permeability tight sandstone, which seriously restricts the offshore oil and gas development process [4,5,6,7]. Tight sandstone reservoirs have a strong heterogeneity and are mainly controlled by diagenetic events (including compaction, dissolution, cementation, and recrystallization), while factors such as temperature, petrography, sediment grain size, provenance type, fluid charging, and burial processes control the intensity and timing of diagenetic events [8,9,10,11,12,13,14] Generally, diagenesis reduces the porosity of sandstones through two main pathways: (i) compaction, a physicochemical process governed by lithostatic/hydrostatic pressure [15,16,17], and (ii) cementation, a chemical process governed by a pressure–temperature–ion type of pore fluid [18,19]. The presence of clay coatings and microquartz around quartz particles, or pore fluid overpressure, can inhibit siliceous cementation and compaction, thereby preserving porosity [20,21,22,23,24,25]. The dissolution of feldspar or cement can form secondary pores, thereby increasing porosity and improving the reservoir’s properties [9,26]. Therefore, the physical and chemical processes are multiple and quite complex. The recovery of reservoir burial and diagenetic processes is the basis for the exploration and development of offshore clastic reservoirs.
The Xihu Depression in the East China Sea Basin has abundant oil and gas resources, with recoverable natural gas reserves of approximately 2.38 × 10¹² m3 [27]. For the gas reservoir of the Oligocene Huagang Formation, predecessors have discussed the sequence framework [28,29], sedimentary facies [30,31], provenance [32,33,34], diagenetic environment [32,35], and diagenetic process [32,35,36]. Previous studies have discussed the influence of burial history and tectonism on diagenesis [37,38]. Although a lot of research has been carried out on diagenesis and its influencing factors, the existing studies mainly focus on a certain tectonic area or consider the basin as a whole, ignoring the differences in diagenetic processes between the north and south portions of the basin, especially the unclear understanding of the basin’s geothermal evolution process, making it difficult to determine the time of diagenetic events. Therefore, to clarify the differences in and causes of diagenetic evolution across the north and south of the basin, we used a thermochronological and reservoir analysis to detail diagenetic evolution between the north and south of the basin to achieve the following: (1) to divide the lithofacies types of reservoirs and compare the physical properties and mineralogy characteristics of different lithofacies; (2) reconstruct the thermal evolution history of the basin, determine the geological time of cement precipitation and fluid charging, and establish the diagenetic evolution sequence; (3) analyze the controlling factors of diagenesis and compare the differences in diagenetic evolution process in different lithofacies and regions; and (4) clarify favorable lithofacies for the development of high-quality reservoirs.
2. Geological Setting
The East China Sea Basin (ECSB) is located in the offshore waters of Southeastern China (Figure 1a). It is a back-arc basin formed under the subduction of the Pacific plate [39,40]. The Xihu Depression (XD) is a NE-SW basin located in the center of the East China Sea basin, with a basin area of about 46,000 km2 (Figure 1b) [41]. From west to east, the XD can be divided into a western slope zone, western sag, central uplift zone, eastern sag and eastern sharp slope (Figure 1c) [3]. The objects of this study include the Tiantai (TT) and Huangyan (HY) regions in the south and Ningbo (NB) and Yuquan (YQ) areas in the north (Figure 1c).
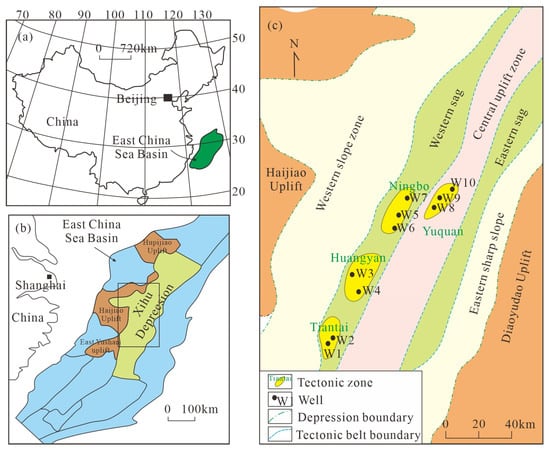
Figure 1.
(a) Basin location, (b) structural unit, and (c) well location distribution map (modified from [7,38]).
In the XD, thick Cenozoic strata have been deposited, reaching thicknesses of up to several ten thousand meters [41,42]. Among them, the Eocene Pinghu Formation is a tidal lagoon system, which develops coal-measure source rock and is an important source rock layer in the basin, and the Oligocene Huagang Formation (E3h) develops a river delta system and is an important reservoir layer in the basin (Figure 2) [41,43]. The Huagang Formation can be divided into two members, the upper member and the lower member (E3hx), and the upper member can be subdivided into five sand formations (E3h1–5), among which, the E3h1, E3h2, and E3h3 members are the main oil and gas-producing layer and also the target layer of this study (Figure 2) [7,38].
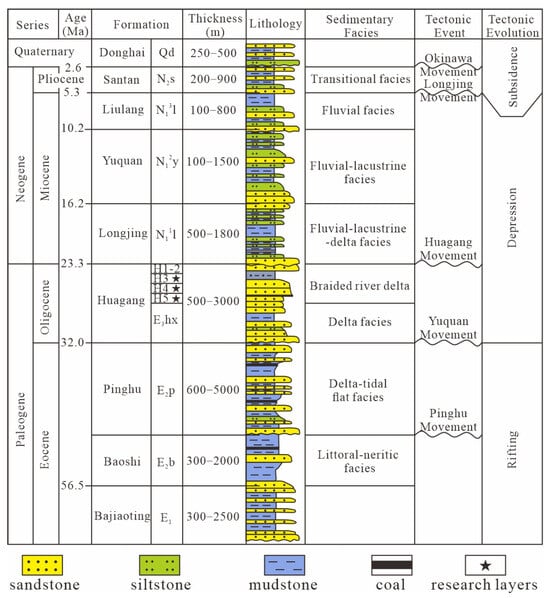
Figure 2.
Stratigraphic histogram of the Xihu Sag (modified from [7,38]).
3. Database and Methods
This study focuses on the tight sandstone of the Oligocene H3, H4, and H5 members. More than 700 pieces of reservoir physical property data, 235 high-pressure mercury injection data, 277 grain size analysis data, 164 whole rock X-ray diffraction data, 418 thin section analysis data, 226 heavy mineral data, and more than 300 thin sections were collected from the oilfield. In addition, 20 sandstone core samples from 10 wells in 4 tectonic regions were taken. The experimental work involved in this research institute was completed at the National Key Laboratory of Petroleum Resources and Engineering, China University of Petroleum (Beijing).
3.1. Microscopic Image Observation
The blue resin-impregnated thin sections were observed with an optical microscope (OM) to determine the pore type, mineral type, and particle contact relationships [44,45]. A small piece of the core sample was struck and gold-plated on the fresh broken surface. A quantum 200 F field emission scanning electron microscope (SEM) with a resolution of 1.2 nm and an accelerating voltage of 200 V–30 KV was used to observe the nanoscale micropores and clay mineral types.
All core samples were prepared with standard optical slices. Cathodoluminescence (CL) analyses were performed using a CL8200-MK5 system (Cambridge Image Technology Ltd., Cambridge, UK) to observe the carbonate cement [46]. The observation standard followed the Chinese national industrial standard SY/T 5916-2013 [47]. Chemical composition was analyzed using a JXA-8100 electron probe micro-analyzer (EPMA) (JEOL Ltd., Tokyo, Japan) for mineral observation and quantitative identification [48,49]. The observation standard was in accordance with the Chinese industry standard GB/T 15074-2008.
3.2. Porosity and Permeability
The porosity and permeability were measured in strict accordance with the Chinese oil and gas industry standard (SY/T 5336-1996) [50], and the instrument used was the ECK-III core permeability tester 08-03-002 (Nantong Feiyu Petroleum Technology Development Co., Ltd., Nantong, China). The porosity was measured using the helium expansion method, and the relatively stable permeability was determined based on the air flowing through the samples.
3.3. High-Pressure Mercury Injection Tests
High-pressure mercury injection (HPMI) was able to provide the distribution of pore throat radius and the connectivity among pores and throats. The instrument used was the kantar PoreMaster-60 full-automatic high-pressure mercury injector (Quantachrome Instruments, Boynton Beach, FL, USA), with a maximum mercury injection pressure of 200 MPa, and the radius of the pore throat that could be measured was >0.004 μm. The principle of the HPMI test is to assume that the pores of the sample are cylindrical, and the size (radius) of them can be calculated by the Laplace–Washburn equation. In tight reservoirs, pore and throat sizes can differ greatly, so the pore size distribution and pore throat radius measured by HPMI were only relative sizes.
3.4. Carbon and Oxygen Isotope Analysis of Carbonate Cement
All core samples were prepared as laser slices without glass cover, and the carbonate cement was heated at high temperature under vacuum conditions using the lr/s155 laser denudation system, so that the carbon and oxygen isotopes of the decomposed CO2 gas could be measured by a MAT-252 stable isotope mass spectrometer (Finnigan MAT, Bremen, Germany). The isotope data were reported according to the mil deviation with the Pee Dee Belemnite (PDB) standard, and the analysis accuracy could reach ±0.22‰.
3.5. Fluid Inclusion Analysis
A fluid inclusion analysis was undertaken and homogenization temperatures (Ths) measured using a Leica microscope with a Linkam THMSG 600 cooling–heating stage (Leica Microsystems, Wetzlar, Germany). When the homogenization temperature was measured, the heating rate was 10 °C/min when the temperature was lower than 60 °C, and 5 °C/min when the temperature was higher than 60 °C.
3.6. Zircon (U-Th)/He Thermochronological Analysis
In order to recover the longer thermal history process, samples with a larger burial depth were taken for the determination of (U-Th)/He isotopes. Four samples from three wells (W1, W3, and W5) from south to north were selected, among which E3H3 and E3Hx samples in Well W5 were used for comparison and verification. An Alphachron helium extraction measurement instrument (Australian Scientific Instruments, Canberra, Australia) and Agilent 7900 inductively coupled plasma mass spectrometer (Agilent Technologies, Santa Clara, CA, USA) were used for the measuring of (U-Th)/He isotopes. The internationally used FCT (Fish Canyon Tuff) zircon was used as the standard sample in the laboratory. The pipeline vacuum level of the Alphacron helium extraction measuring instrument is less than 2.67 × 10⁻⁸ Pa, the laser operating current is 2.5 A, the heating time is 15 min, and the SAES AP10N zirconium aluminum pump purification time is 2 min. The electron multiplier of the Agilent 7900 inductively coupled plasma mass spectrometer has a magnification of 108.
4. Results
4.1. Lithofacies Characteristics and Mineral Composition
4.1.1. Lithofacies Characteristics
The E3h3, E3h4, and E3h5 members of the Oligocene in the Xihu Sag are mainly river delta depositional systems [30,51]. Large axial channels developed from north to south in the northern area, and large braided river delta deposits dominate the NB and YQ regions [28,34,52]. The southern TT and HY regions are dominated by small western-provenance sand bodies, mainly meandering river delta sedimentary sand bodies [31,53]. In the southern TT and HY regions, there are mainly fine sandstones and siltstones. The core observation shows that the development of tabular cross-bedding and wash cross-bedding reflects the high-energy environment of distributary channels in the delta front, while siltstones have mostly developed in the flood plain sedimentary environment (Figure 3). The NB and YQ regions in the north are mainly fine sandstone and medium sandstone, with gravelly sandstones developed. Thick sand bodies with normal grain sequence sedimentary characteristics have developed, with tabular cross-bedding, and the natural gamma logging curves are box-shaped, reflecting the large braided channel deposits, while the siltstones are mostly braided inter-channel deposits (Figure 3). According to the sedimentary characteristics, the braided channels are further subdivided into high-energy braided channels (Hbcs) dominated by medium sandstone and gravelly medium-fine sandstone and low-energy braided channels (Lbcs) dominated by fine sandstone.
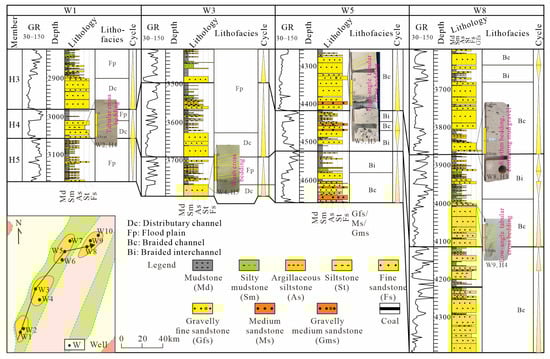
Figure 3.
Interwell profiles of strata and lithofacies of E3h3, E3h4, and E3h5 members in study area of Xihu Sag.
The average value of the median grain size of fine sandstone in the TT and HY regions is 114.1 μm and 129.4 μm, respectively. The sediments in the NB and YQ regions have a relatively coarser grain size, and the average value of the median grain size of fine sandstone is 172.9 μm and 158.1 μm, respectively (Table 1). These patterns indicate either provenance differences between the northern and southern sectors, varying sediment transport distances, or contrasting depositional environments. At the same time, the sediment in the northern region has a higher sorting coefficient than that in the southern region (Table 1), indicating that it may have experienced a longer transport distance.

Table 1.
Statistical table of reservoir size and physical property parameters in the study area.
4.1.2. Mineral Composition
The rock types of the H3, H4, and H5 members in the Xihu Sag are similar in different regions, mainly quartzofeldspathic sandstone, arkose, and lithic arkose, containing a small amount of quartz sandstone, quartzolithic sandstone, and feldspathic litharenite (Figure 4a). The content of quartz, feldspar, and lithic fragments in sandstone can be used to judge the tectonic setting of the provenance area [54,55,56,57]. The sediments in the study area are mainly derived from continental block and recycled orogen (Figure 4b).
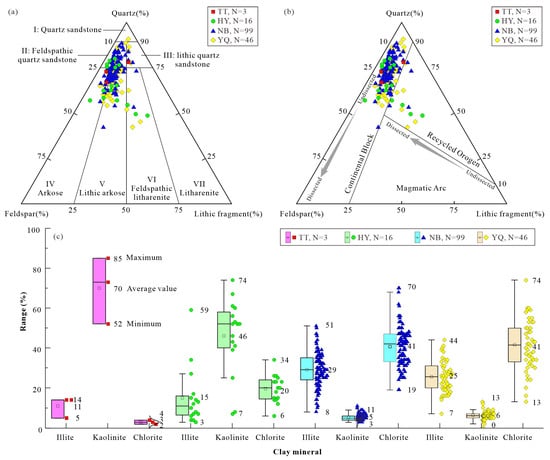
Figure 4.
(a) The triangle chart of sandstone mineral composition shows the lithology of the sandstone (classification standard according to Folk, 1968 [58]). (b) The triangle chart of mineral detritus content composition shows the tectonic background of the provenance area (classification standard according to Garzanti et al., 2006, 2014 [55,56]). (c) Box comparison diagram of different types of clay minerals in different regions.
In the finer grain size, the difference in mineral types in the study area is mainly reflected in the content of clay minerals. The TT and HY regions are dominated by kaolinite, with a kaolinite content of 52%~85% (average value: 70%) and 7%~74% (average value: 46%) respectively, while the NB and YQ regions have a lower kaolinite content, with a kaolinite content of 3%~11% (average value: 5%) and 0~13% (average value: 6%), respectively (Figure 4c). The content of chlorite and illite increases gradually from south to north. The content of illite and chlorite is generally less than 15% in the TT region and slightly increased in the HY region, 3%~59% (average value: 15%) and 6%~34% (average value: 20%), respectively. The content of illite and chlorite in the NB and YQ regions increases significantly. The illite content ranges from 8% to 51% (average value: 29%) and from 7% to 44% (average value: 25%); the chlorite content ranges from 19% to 70% (average value: 41%) and from 13% to 74% (average value: 41%) (Figure 4c). The difference in clay mineral types between the southern and northern regions reflects a difference in diagenetic evolution stages and diagenetic environments.
4.1.3. Heavy Mineral Composition
The heavy minerals in the study area are mainly garnet, leucoxene, zircon, magnetite, and tourmaline (Table 2). The types of heavy minerals in the south and north are different. In the TT and HY regions, the heavy mineral type is dominated by garnet, and the content of most samples can reach more than 50%, with an average content of 59.48% and 70.03%, respectively (Table 2). In the NB and YQ regions, the E3H3 member is dominated by garnet, with an average content of 72.67% and 62.13%, respectively. However, the garnet content in the E3H4 and E3H5 members decreases significantly, while the zircon and leucoxene content increase significantly, and the magnetite content is relatively high (Table 2). The difference in heavy mineral content indicates the difference in provenance types between the southern and northern regions.
Table 2.
Statistical table of heavy mineral content of reservoirs in study area.
4.2. Reservoir Physical Properties and Pore Size Distribution
The reservoir properties improve from north to south. The porosity of the reservoirs in the TT region is generally greater than 15%, and the permeability is generally greater than 1 mD. The porosity of the reservoirs in the HY region is mostly between 10% and 15%, and the permeability is more than 1 mD. The porosity of the reservoirs in the NB and YQ regions is mostly less than 10%, and the permeability is mostly less than 10 mD (Figure 5a,b). Under the same porosity condition, the permeability varies widely (Figure 5c), reflecting the complexity of pore structure, and also indicating that reservoir diagenesis has an important impact on reservoirs’ physical properties.
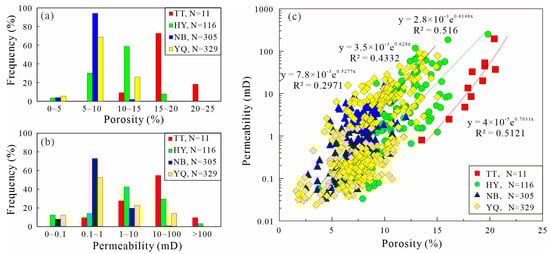
Figure 5.
(a) Histogram of porosity frequency distribution in different regions. (b) Histogram of permeability frequency distribution in different regions. (c) Relationship between porosity and permeability in different regions.
The difference in reservoirs’ physical properties in different regions is related to buried depth, compaction strength, and sediment particle size [58,59]. The contact mode of sediment particles in the TT region is mainly point contact or line contact (Figure 6a); for sediment particles in the HY region it is mainly line contact (Figure 6c), while the contact mode of sediment particles in the NB and YQ regions is mainly concave–convex contact and suture contact (Figure 6e,g). Meanwhile, the peak value of the pore radius decreases from south to north (Figure 6b,d,f,h), and the pore radius also gradually decreases (Table 1). In addition, the distribution of the pore radius is also affected by the sediment particle size. The coarser the sediment particle size, the larger the average pore radius (Table 1). For example, the peak pore radius of siltstone in the NB area is about 0.16 μm, with a small pore peak (Figure 6i,j); the peak pore radius of fine sandstone is about 0.63 μm (Figure 6e,f); and the peak pore radius of medium sandstone is about 1.6 μm (Figure 6k,l).

Figure 6.
Particle contact relationship and pore radius distribution in different regions. (a) Well W1, 2910 m, H3, fine sandstone, particles are in line contact or point contact; pore radius distribution determined by high-pressure mercury injection is shown in (b). (c) Well W3, 3645 m, H4, fine sandstone, particles are mainly in line contact; pore radius distribution determined by high-pressure mercury injection is shown in (d). (e) Well W5, 4385.99 m, H3, fine sandstone, particles in line contact or concave convex contact; pore radius distribution determined by high-pressure mercury injection is shown in (f). (g) Well W9, 3649 m, H3, fine sandstone, particles in concave convex contact or suture contact; pore radius distribution determined by high-pressure mercury injection is shown in (h). (i) Well W7, 4606.7 m, H5, siltstone, particles in concave convex contact or suture contact; pore radius distribution determined by high-pressure mercury injection is shown in (j). (k) Well W5, 4333 m, H3, medium sandstone, particles in concave convex contact or suture contact; pore radius distribution determined by high-pressure mercury injection is shown in (l).
4.3. Diagenetic Types
4.3.1. Compaction
In the study area, the mineral particles are mainly in line contact, concave–convex contact, and suture contact, which indicates that the reservoir of the Huagang Formation has suffered a strong compaction (Figure 7a). In order to quantitatively characterize the impact of compaction on reservoir porosity, the primary porosity (Po) was calculated according to Equation (1) proposed by Scherer (1987) [60], and the calculation results are summarized in Table 1. The volume and percentage of compaction that reduces porosity can be calculated by Equations (2) and (3) [37], and the calculation results are shown in Table 3. The results show that the study area generally suffers from strong compaction; the average percentage of pore reduction is generally greater than 70%, with a maximum of 98.82% (Table 3).
where Po is the primary porosity, %; So is the sorting coefficient; Vcompaction is the compaction that reduces the porosity volume, %; Vdissolution is the dissolution increasement pore volume, %; Vcementation is the cementation reduction pore volume, %; ϕ is the measured core porosity, %; Pcompaction is the compaction that reduces the porosity percentage, %.
Po = 20.91 + (22.9/So)
Vcompaction = Po + Vdissolution − Vcementation − ϕ
Pcompaction = (Vcompaction/Po) × 100%
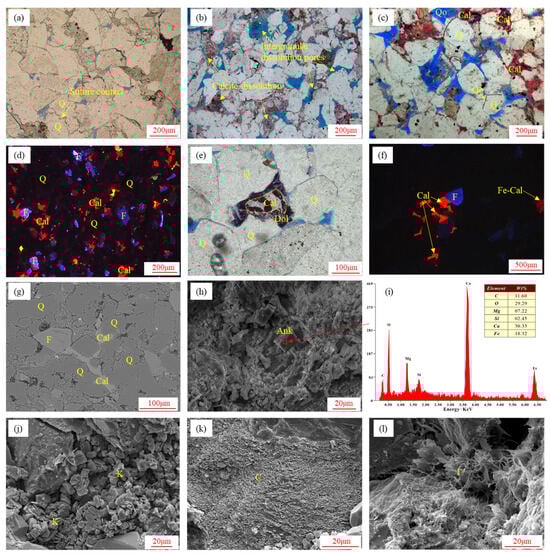
Figure 7.
Micrograph of tight sandstone reservoir in study area. (a) Well W5, 4325.1 m, H3, clastic particles are in suture contact due to strong compaction; (b) Well W1, 3022 m, H4, clastic particles are subjected to strong dissolution to form secondary dissolution holes; (c) Well W3, 3705 m, H5, quartz overgrowth; (d) Well W4, 3534.8 m, H5, cathodoluminescence photo of calcite cement; (e) Well W5, 4324.8 m, H3, calcite and dolomite cement; (f) Well W5, 4326.8 m, H3, cathodoluminescence photo of calcite cement; (g) Well W4, 3534.8 m, H5, electron probe photo of calcite cement; (h) Well W5, 4326.6 m, H3, scanning electron microscope photo of ferricalcite; (i) energy spectrum of ankerite in photo (h); (j) Well W1, 3017 m, H4, SEM photos of kaolinite; (k) Well W3, 3639 m, H4, SEM photo of chlorite; (l) Well W8, 3848.6 m, H3, SEM photo of illite. Q = quartz; Qo = quartz overgrowth; F = feldspar; Cal = calcite; Fe-Cal = iron calcite; Dol = dolomite; Ank = ankerite; I = illite; C = chlorite; K = kaolinite.
Table 3.
Statistics of cement content and diagenesis porosity reduction/increase rate of reservoirs in the study area.
4.3.2. Dissolution
The reservoir pores in the study area are mainly secondary dissolution pores, with few primary pores (Figure 7b). In order to quantitatively analyze the impact of dissolution on reservoir porosity, the proportion of dissolution pores and dissolution increasement pore volume were calculated by Equations (4) and (5), and the calculation results are shown in Table 3. The calculation results show that the pore types of the study area are dominated by secondary dissolution pores, and the proportion of dissolution pores is generally more than 60%, even up to 100% (Table 3).
where Pdissolution is the proportion of dissolution pores, %; VSecondary pore is the plane porosity of secondary dissolution pores in the thin section, %; Vtotal is the total plane porosity in the thin section, %; Vdissolution is the dissolution increasement pore volume, %; and ϕ is the measured core porosity, %.
Pdissolution = VSecondary pore/Vtotal
Vdissolution = Pdissolution × ϕ
4.3.3. Cementation
Quartz overgrowth, carbonate cements, and clay minerals are important types of cements in sandstone reservoirs [61,62,63]. Quartz overgrowth can be observed under the microscope in the study area (Figure 7c), but the content is lower, generally less than 2.0% (Table 3). Multi-stage carbonate cement can be identified by microscopic observation. Early cryptocrystalline calcite fills between the mineral particles in the form of basement cementation (Figure 7d), and the content is usually high, up to 11%. Crystal calcite appears in the intergranular pores in the form of intergranular cementation (Figure 7e–g), showing an orange-red cathodoluminescence, and the reservoir is obviously tight (Figure 7f). Ferrocalcite cementation is mainly the product of calcite recrystallization, which mostly exists at the edge of particles and shows a dark red cathodoluminescence (Figure 7d,f). Dolomite and ankerite have an obvious rhombic shape, mostly in the form of surrounding calcite or dispersed granularity (Figure 7e,h). The content of calcite cement is mostly lower than 10% (Table 3). Clay minerals include kaolinite, chlorite, and illite. Kaolinite fills pores in a shape that is wormlike (Figure 7j), chlorite attaches to the mineral surface in the shape of thin film (Figure 7k), and illite is mostly fibrous (Figure 7l). The cementation reduction pore volume is the proportion of the cement in the total area of the thin section. The statistical results show that the cementation reduction pore volume of the reservoir in the study area is between 0 and 11.5. On the whole, the southern area has a higher cementation reduction pore volume, and the low-energy sedimentary environment has a higher cementation reduction pore volume (Table 3).
4.4. Thermal History, Burial History, and Hydrocarbon Generation History
The radioactive 4He produced by the radioactive decay of parent isotopes U and Th can be lost by diffusion to the mineral edge, which is a function of temperature. Therefore, zircon (U-Th)/He data can be used to restore the thermal history of sedimentary basins [64,65,66,67]. Based on the ZRDAAM kinetic model proposed by Guenthner et al. (2013) [68], this study uses HeFTy2.0 thermal modeling software developed by Ketcham (2005) [69] to simulate the thermal evolution path. Except for z05 particles of sample 1 in the TT region, the measured ages of the samples in the study area are all older than the age of stratum deposition (Table 4), which is due to inherited early radiation damage and 4He [65,66]. Orme et al. (2016) [70] used such samples to reconstruct a long-term thermal history, indicating that these samples can still effectively reflect that thermal history. In order to simplify the model, the temperature before deposition was set as the surface temperature of 20 °C using the international common method (Guenthner et al., 2014 [71]). The thermal evolution path of the sample corresponding to the depth was reconstructed by using the measured zircon data (Figure 8a–d). The simulation results show that the trend of the thermal evolution path of the E3H3 (sample 3) and E3Hx (sample 4) members in the NB region is consistent (Figure 8e), indicating that the simulation results are reasonable and reliable. A basin simulation of the study area was carried out by using the thermal history reconstruction results. The YQ region is very close to the NB region, so the same thermal history parameters were used, and the simulated temperature is highly consistent with the measured temperature (Figure 8f), indicating that the thermal history reconstruction results are reasonable.
Table 4.
Zircon (U-Th)/He measurement data.
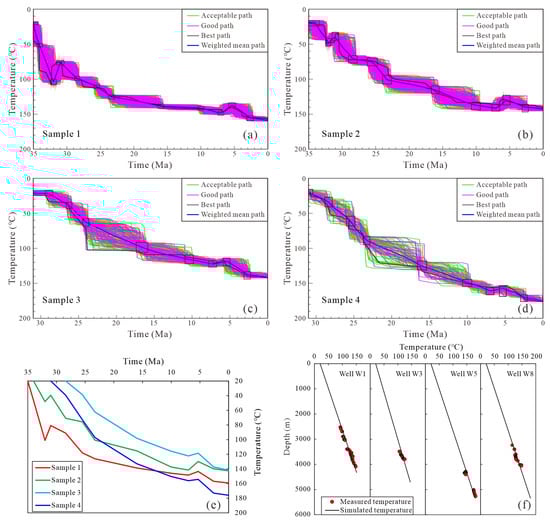
Figure 8.
(a) Thermal history inversion model of sample 1. (b) Thermal history inversion model of sample 2. (c) Thermal history inversion model of sample 3. (d) Thermal history inversion model of sample 4. (e) Comparison map of thermal history inversion results. (f) Comparison map of simulated and measured temperature.
The burial history and hydrocarbon generation history of typical wells in different regions were further simulated. The formation thickness and burial depth data were obtained from the drilling data. The denudation thickness was read on the seismic profile by the trend extension method. The TOC and hydrogen index of the source rock were determined as 1.6% and 140 mg HC/g TOC based on the average of the measured data. The results show that the TT and HY regions have a small burial depth and low formation temperature, and the E3h3, E3h4 and E3h5 members are currently in the mesodiagenesis A stage (Figure 9a,b), while the NB and YQ regions have a large burial depth and high formation temperature, and the E3h3, E3h4 and E3h5 members have reached the mesodiagenesis B stage (Figure 9c,d). The source rocks of the Pinghu Formation in the study area began to generate hydrocarbon at 24 Ma–26 Ma, and the peak time of hydrocarbon generation gradually became later from north to south (Figure 9). The TT region is characterized by continuous hydrocarbon generation, and it is still in a period of rapid hydrocarbon generation (Figure 9a). The HY region entered a rapid hydrocarbon generation stage at 15 Ma and is now in a slow hydrocarbon generation stage (Figure 9b). The NB region entered into a rapid hydrocarbon generation stage at 19 Ma and is still slowly generating hydrocarbon today (Figure 9c). The YQ region has entered the rapid hydrocarbon generation stage at 25 Ma and stopped hydrocarbon generation at 6 Ma (Figure 9d).
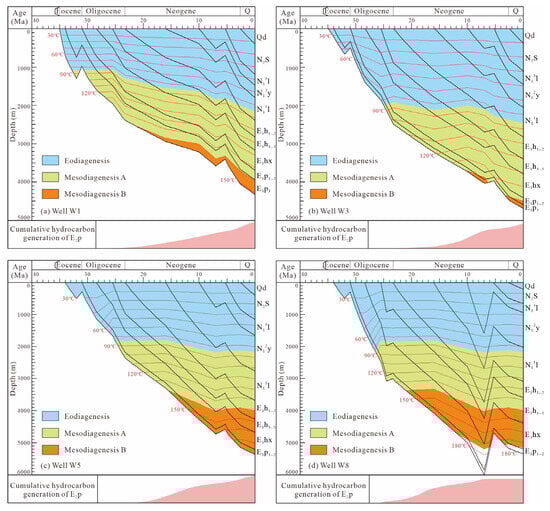
Figure 9.
Burial history, thermal history, and hydrocarbon generation history of Wells W1 (a), W3 (b), W5 (c), and W8 (d).
5. Discussions
5.1. Provenance Types
The characteristics of heavy mineral assemblages can reflect types of provenance [72]. Zircon and tourmaline indicate a provenance of felsic magmatic rocks, magnetite and leucoxene indicate a provenance of intermediate–mafic magmatic rock, and garnet and rutile indicate a provenance of metamorphic rock [72,73]. The heavy minerals in the TT and HY regions are mainly garnet (Table 3), indicating that the provenance type is mainly metamorphic rock. The heavy minerals in the E3h3 member of the NB and YQ regions are dominated by garnet (Table 3), which indicates that the provenance type is mainly metamorphic rock, while the garnet content in the E3h4 and E3h5 members is significantly reduced, and the content of leucoxene, zircon, and magnetite is significantly increased (Table 3), reflecting that their provenance has a certain contribution to volcanic rocks. There are many provenances in the Xihu Sag, including the East Yushan uplift and Haijiao uplift in the west, Hupijiao uplift in the north and Diaoyudao uplift in the east (Figure 1b,c). The provenance in the west and north is a Precambrian metamorphic rock basement, and the provenance in the east is a Paleozoic and Mesozoic volcanic rock basement [34,74,75]. Through heavy mineral content, zircon age, sand content, and seismic reflection characteristics, the researchers confirmed that the NB and YQ regions are dominated by the Hupijiao uplift provenance, with a small amount of contribution from the Diaoyudao uplift provenance [28,33,34,35]. However, the NB structure farther from the northern provenance area has a lower ZTR index than the YQ structure (Table 2), and the sand content gradually decreases from the western slope area to the NB region [51,74], so there is also a small amount of provenance contribution from the Western Hupijiao uplift. In summary, the provenance of the TT and HY regions is derived from a western metamorphic rock provenance [75]. The provenance of the NB and YQ regions is mainly derived from the metamorphic rock provenance of the Hupijiao uplift, and the E3h4 and E3h5 members are also provided by the volcanic rock provenance of the Diaoyudao uplift, and the NB region is also contributed to by a small amount of the Haijiao uplift.
The volcanic provenance from the Diaoyudao uplift is characterized by a low quartz content, high gravel content, and poor compaction resistance, while the metamorphic provenance is characterized by a high quartz content, high ZTR index, and strong compaction resistance [34,53]. Compared with the south, the NB and YQ regions have a significantly larger compaction that reduces the porosity percentage (Table 3), but the north has a greater burial depth. In order to eliminate the impact of burial depth, the compaction trend lines in the south and north are compared. The results show that the NB and YQ regions have a higher compaction that reduces the porosity rate (Figure 10).
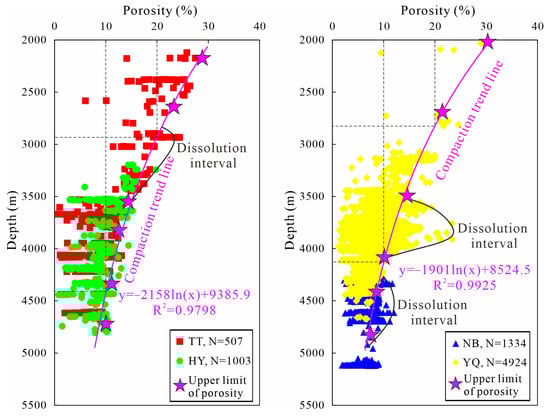
Figure 10.
Relationship between porosity and depth in the south and north of the Xihu Sag.
5.2. Impact of Components of Sediment on Reservoir Quality
The sedimentary conditions not only determine the type, scale, and distribution of sand bodies but also determine the mineral composition, primary pore volume, and compaction resistance, thus further affecting diagenesis [35,76,77,78]. With the increase in sediment grain size, the porosity and permeability of reservoirs in different study areas also increase (Figure 11a,b), indicating that grain size has a significant impact on reservoir quality, especially in the TT and HY regions with a shallow burial depth and weak compaction. The porosity of the Huagang Formation reservoir increases with the increase in the content of rigid mineral quartz (Figure 11c), whereas it decreases with an increase in lithic fragment content (Figure 11d), indicating that mineral composition affects the effect of compaction on porosity. Simultaneously, the existence of carbonate cement and clay minerals is also an important factor leading to a reduction in reservoir porosity (Figure 11e,f). According to the compaction–cementation pore reduction chart, compaction is the dominant factor for the reduction of intergranular pores (Figure 11g). Additionally, the mineral content of different sedimentary microfacies is obviously different. The sand body with a coarser grain size also has more quartz and less lithic fragment content, as well as less carbonate cement and clay mineral content (Figure 11h). Consequently, the sand body with a coarser grain size has a stronger anti-compaction ability and less cementation porosity reduction.
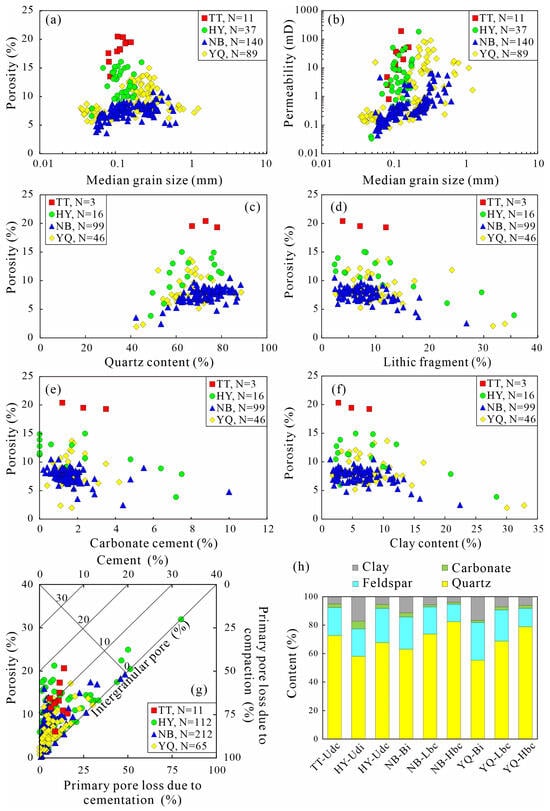
Figure 11.
Porosity (a) and permeability (b) change with median grain size, and porosity change with quartz (c), lithic fragment (d), carbonate cement (e), and clay mineral (f) content from XRD data; (g) relative importance of compaction and cementation in pore loss of Huagang Formation reservoir (modified after Beard and Weyl, 1973 [79]); (h) comparison diagram of average mineral content of different types of sand bodies in different regions, mineral content from XRD data.
5.3. Burial Process and Diagenetic Evolution
The tight sandstone reservoir of the Huagang Formation in the Xihu Sag has undergone many diagenesis processes, such as compaction, cementation, and dissolution. Previous studies mostly determined the diagenesis sequence according to the intersection relationship between particles, distribution of cements, carbon and oxygen isotopes of cements, clay mineral transformation, Ro and Th, and burial history [32]. The exact time of diagenesis is difficult to determine due to the difficulty in determining the thermal evolution history by the basin-modeling method [34]. Based on the determination of the thermal evolution history, carbon and oxygen isotopes of cements, and inclusion data, the diagenetic sequence of the Huagang Formation is established.
5.3.1. Formation Time of Cement
The carbon and oxygen isotopes of carbonate cements can be used to effectively distinguish the genetic types of cements and calculate precipitation temperature and paleosalinity [80,81,82,83,84]. The carbon isotope of carbonate cement in the study area is between −5.50‰ and −3.25‰, and the oxygen isotope is between −20.16‰ and −10.43‰ (Table 5), indicating that organic acid decarboxylation is the important carbon source of carbonate cement (Figure 12a). According to the salinity calculation formula of Keith and Weber (1964) [80], the Z values of the carbonate cements are less than 120 (Table 5), indicating that carbonate cements are precipitated in a freshwater environment. Three stages of carbonate cementation can be identified according to the precipitation temperature calculated by oxygen isotope. For the first stage’s cryptocrystalline calcite, the oxygen isotope is −12.80‰~−10.43‰, and the corresponding precipitation temperature is 73.47 °C~89.33 °C. For the second stage’s crystal calcite, the oxygen isotope is −17.79‰~−15.84‰, and the corresponding precipitation temperature is 111.36 °C~126.48 °C. For the third stage’s ferrocalcite and dolomite, the oxygen isotope is −20.16‰~−18.81‰, and the corresponding precipitation temperature is 134.63 °C~145.84 °C (Table 5). The precipitation temperature can also be determined according to the homogenization temperature (Th) of inclusions in calcite cement [85]. The homogenization temperatures of brine inclusions in cryptocrystalline calcite and crystal calcite are 94 °C~102 °C and 121 °C~122 °C, respectively (Table 5; Figure 13a,b). Based on the above results, the three temperature ranges of carbonate cement precipitation are 70 °C~105 °C, 110 °C~130 °C, and 130 °C~150 °C, respectively (Table 5; Figure 12b).
Table 5.
Carbon and oxygen isotopes and inclusion homogenization temperatures of carbonate cements in study area.
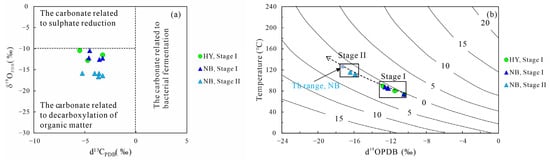
Figure 12.
(a) Scatter diagram of carbon and oxygen isotope distribution (according to Irwin et al., 1977 [82]; Wang et al., 2020a [84]). (b) The relationship between the oxygen isotope of carbonate cement and precipitation temperature, and the contours represent the oxygen isotope composition of carbonate equilibrium fluid. The calculation formula of carbonate precipitation temperature is based on Shackleton, 1973; Fontes et al., 1993 [81].
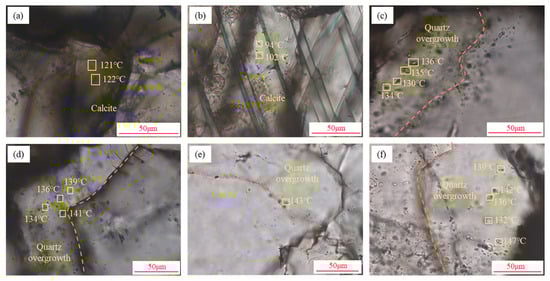
Figure 13.
Micrographs of fluid inclusions in tight sandstone reservoirs in the study area: (a) Well W6, 4487.4 m, H4, fluid inclusions in calcite cements; (b) Well W10, 3915.4 m, H4, fluid inclusions in calcite cements; (c) Well W6, 4303.59 m, H3, fluid inclusions in quartz overgrowth; (d) Well W6, 4487.4 m, H4, fluid inclusions in quartz overgrowth; (e) Well W9, 3719.32 m, H3, fluid inclusions in quartz overgrowth; (f) Well W9, 4011.2 m, H4, fluid inclusions in quartz overgrowth.
Combined with the recovery results of the burial history and thermal history, the precipitation time of carbonate cement can be determined (Figure 9). The precipitation time of cryptocrystalline calcite in the TT region was 20~5 Ma, and crystal calcite started to precipitate after 2 Ma (Figure 14a). The precipitation time of cryptocrystalline calcite in the HY region was 21~11 Ma, and crystal calcite began to precipitate after 7 Ma (Figure 14b). Neither the TT nor the HY regions reached the precipitation temperature of late-stage crystal ferrocalcite and dolomite. The formation temperatures in the NB and YQ regions are relatively high, and three stages of carbonate cements have been developed, with precipitation times of 22~16 Ma, 14.5~7 Ma, 7~1 Ma, and 25~20.5 Ma, 19.5~16 Ma, and 16~9.5 Ma, respectively (Figure 14c,d).
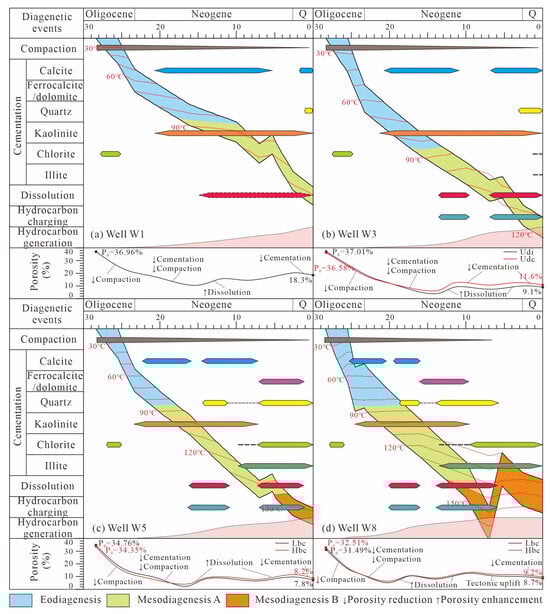
Figure 14.
Diagenetic sequence and porosity evolution of tight sandstone reservoir in E3h3–5 member of Wells W1 (a), W3 (b), W5 (c), and W8 (d).
The homogenization temperature (Th) of brine inclusions in authigenic quartz can indicate its precipitation temperature [84]. The brine inclusions in the quartz overgrowth can be identified under the microscope in the study area (Figure 13c–f), and two main precipitation temperature intervals can be identified by measuring the homogenization temperature (Figure 15a–c), which are 115 °C~130 °C and 135 °C~150 °C. The temperature interval of hydrocarbon charging can be determined by using the homogenization temperature of brine inclusions associated with hydrocarbon inclusions [86,87]. There are two stages of hydrocarbon charging in the study area. The temperature intervals of hydrocarbon charging in the HY region are 90–100 °C and 115–130 °C (Figure 15d), those in the NB region are 115–125 °C and 130–155 °C (Figure 15e), and those in the YQ region are 115–130 °C and 135–160 °C (Figure 15f).

Figure 15.
Frequency distribution histogram of inclusion homogenization temperature (Th) in quartz overgrowth of sandstone reservoirs in Huangyan (a), Ningbo (b), and Yuquan (c) regions. Frequency distribution histogram of inclusion Th of sandstone reservoirs in Huangyan (d), Ningbo (e), and Yuquan (f) regions.
The precipitation temperature intervals of the two phases of quartz overgrowth were determined from the fluid inclusion data, with distributions of 115~130 °C and 135~150 °C (Figure 15a–c). Only the first phase of quartz overgrowth was developed in the TT and HY regions, corresponding to 1~0 Ma and 3~0 Ma, respectively (Figure 14a,b), while two phases of quartz overgrowth were developed in the NB and YQ regions, corresponding to 14.5~11 Ma, 7~0 Ma and 18.5~16 Ma, 14~6 Ma, respectively (Figure 14c,d).
To analyze the temperature of clay mineral transformations, the depth of the sample was converted to the maximum stratigraphic temperature they experienced, using measured stratigraphic temperature data. It is noteworthy that the maximum temperature experienced by the sample in the YQ region was before the tectonic uplift at 7 Ma (Figure 14d), while the current geothermal temperature in the other regions is the maximum temperature during geological history (Figure 14a–c). The results show that kaolinite content will be significantly reduced when the stratigraphic temperature is greater than 140 °C (Figure 16a). When the stratigraphic temperature is greater than 130 °C, the illite content will increase significantly (Figure 16b), and also chlorite will be formed, and when the stratigraphic temperature is greater than 140 °C, chlorite will be formed in large quantities (Figure 16c). Therefore, the reservoirs of the E3h3-5 members in the TT and HY regions are dominated by kaolinite, and illite and chlorite have not yet been formed in large quantities (Figure 14a,b). In the NB and YQ regions, kaolinite began to transform to illite at about 10 Ma and 14 Ma, respectively, and chlorite formed in large amounts at about 7 Ma and 10 Ma, respectively (Figure 14c,d).
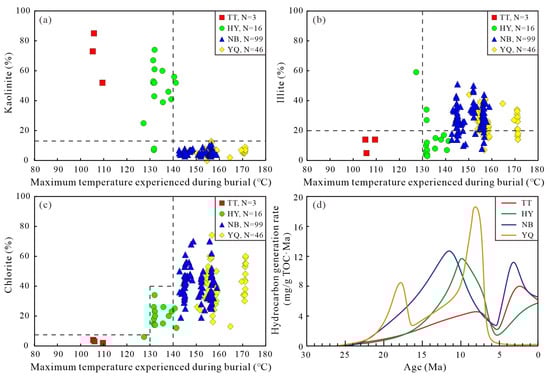
Figure 16.
The relationship between the content of kaolinite (a), illite (b), and chlorite (c) and the maximum temperature experienced during burial. (d) Evolution history of hydrocarbon generation rate in different regions.
5.3.2. Hydrocarbon Charging and Reservoir Dissolution
It is generally believed that a large amount of organic acids will be generated in the early stage of hydrocarbon generation in source rocks, and organic acids will enter the reservoir together with hydrocarbon charging to promote mineral dissolution, thus improving the physical properties of the reservoir [88,89]. The temperature intervals of hydrocarbon charging in the HY region are 90–100 °C and 115–130 °C (Figure 15d), corresponding to 14–9.5 Ma and 7–0 Ma (Figure 14b); those in the NB region are 115–125 °C and 130–155 °C (Figure 15e), corresponding to 16–11 Ma and 7–1 Ma (Figure 14c); and those in the YQ region are 115–130 °C and 135–160 °C (Figure 15f), corresponding to 20–16 Ma and 14–6 Ma (Figure 14d). The hydrocarbon charging time is consistent with the peak time of hydrocarbon generation in the source rocks of the E2p formation (Figure 16d). Therefore, it is speculated that the dissolution of reservoirs in the TT region, which lacks inclusion data, occurred after the period of massive hydrocarbon generation at 15 Ma (Figure 14a and Figure 16d).
5.3.3. Diagenetic Sequence and Pore Evolution
In the eodiagenesis stage (formation temperature < 85 °C, Ro < 0.5%), the diagenesis is dominated by compaction. The early coated chlorite, and cryptocrystalline calcite and kaolinite, were precipitated and formed at this stage (Figure 14). In the mesodiagenesis A stage (formation temperature = 85~140 °C, Ro = 0.5%~1.3%), the early organic acids produced by the coal-measure source rocks of E2p began to dissolve soluble minerals such as feldspar and rock fragments. Simultaneously, kaolinite was formed in large quantities. Then, as the temperature gradually increased, quartz overgrowth and crystal calcite begin to form, and kaolinite gradually transforms into chlorite and illite [46,90,91,92]. The TT and HY regions are currently in this stage (Figure 15a,b). At the late stage of this stage, when the temperature reaches 130 °C, crystal ferrocalcite, dolomite, and the second quartz overgrowth begin to form (Figure 8b and Figure 10) [93,94,95], and the kaolinite is completely transformed into chlorite and illite (Figure 14c,d). In the mesodiagenesis B stage (formation temperature = 140~190 °C, Ro = 1.3%~2.0%), diagenesis is mainly the formation of chlorite, illite, and the second overgrowth of quartz. The NB and YQ regions are currently in this stage (Figure 14b).
The methods of sandstone paleoporosity evolution have been studied previously, including with the numerical simulation method, diagenetic dynamics method, experimental simulation method, and basin simulation [96,97,98,99,100]. In this study, the paleoporosity evolution process was restored by combining basin simulation and test data. The results showed that, due to the higher geothermal gradient and faster deposition rate (Figure 8e and Figure 9), the formation time of cementation and organic acid dissolution were earlier in the NB and YQ regions, and the pore reduction rate was significantly greater in early compaction. Coarse-grained sediments have a lower cementation content than fine-grained sediments, resulting in better pore preservation (Figure 14).
5.4. Influence of Diagenesis Evolution on Reservoir Quality
The reservoirs of the Huagang Formation in the study area have all undergone strong compaction from the rearrangement of particles, deformation of mica and soft rock fragments, and fracture of quartz particles [101,102,103,104,105], with the porosity having been reduced by >70% (Table 3). However, the correlation between the compaction that reduces porosity volume and porosity is poor (Figure 17a), which is due to the widespread dissolution transformation of reservoirs, rather than the small influence of compaction on the porosity of reservoirs.
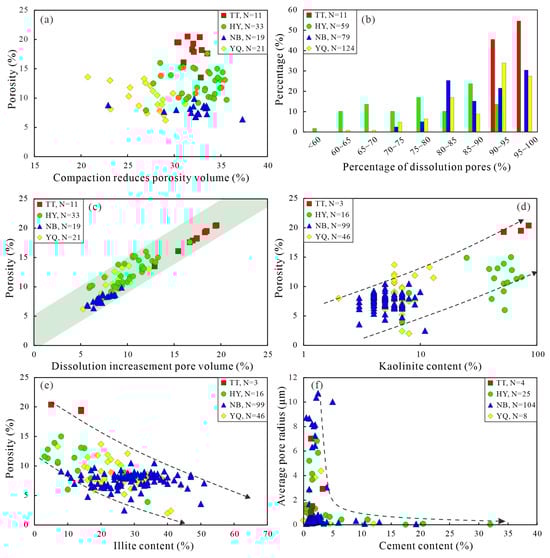
Figure 17.
(a) Relationship between porosity and compaction that reduces pore volume. (b) Frequency distribution histogram of dissolution pores percentage. Porosity change with dissolution increasement pore volume (c), kaolinite content (d), and illite content (e). (f) Relationship between average pore radius and cement content.
The reservoir in the study area generally suffers from strong dissolution, and the percentage of dissolved pores is generally greater than 80% (Figure 17b). There is a significant positive correlation between the dissolution increasement pore volume and porosity (Figure 17c), indicating that dissolution has a significant improvement effect on the reservoir. Kaolinite has a protective effect on the pore space (Figure 17d), while carbonate, quartz overgrowth, and illite can block the pore space (Figure 15e and Figure 17e). The combined effect of multiple cements leads to a poor correlation between cementation reduction pore volume and porosity, but the formation of cements usually occupies the pore space and leads to a decrease in pore radius, Therefore, the average pore radius decreases significantly with the increase in cement content (Figure 17f).
5.5. Diagenetic Evolution Model and Formation of High-Quality Reservoirs
The E3h3–5 members’ reservoir in the TT and HY regions in the south of the study area suffers from weak compaction due to a shallow burial depth and metamorphic rock provenance, and the sand body of the flood plain has a significantly stronger cementation than that of the distributary channel. In contrast, the reservoirs in the northern NB and YQ regions suffer from strong compaction due to the large burial depth and a certain proportion of volcanic rock provenance, and the low-energy braided channel sand bodies have a stronger cementation than the high-energy braided channel sand bodies. Therefore, diagenetic evolution models of four lithofacies are established based on the strength of compaction and cementation, which are a weak compactive–strong cementation reservoir (Fp, Pattern 1), weak compactive–slight cementation reservoir (Dc, Pattern 2), strong compactive–strong cementation reservoir (Lbc, Pattern 3), and strong compactive–slight cementation reservoir (Hbc, Pattern 4) (Figure 18).
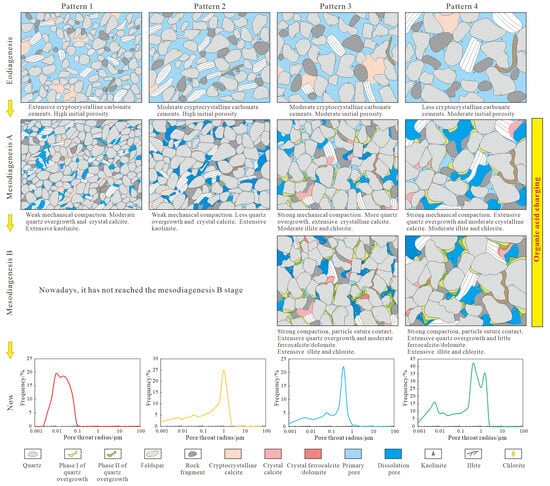
Figure 18.
Diagenetic processes of different lithofacies (plood plain—Pattern 1; distributary channel—Pattern 2; low-energy braided channel—Pattern 3; high-energy braided channel—Pattern 4).
The southern area has a low geothermal gradient and shallow reservoir depth, and it is still in mesodiagenesis A stage (Figure 14a,b). The clay minerals are mainly kaolinite (Figure 4c), and crystal calcite and quartz overgrowth are only locally visible. The flood plain sands are all tight reservoirs with a fine grain size and large amount of carbonate cements (Figure 7d). The pore throat space is often completely blocked by cements, and a large number of dissolution pores are abundantly developed but poorly connected, and the pore throat radius is mostly less than 0.1 μm (Figure 18, Pattern 1). The distributary channel sands are a high-quality reservoir with a coarse grain size and large pore space, which is conducive to organic acid charging. A large amount of cryptocrystalline calcite cement is dissolved to form connected pores, and the pore throat radius is mostly greater than 0.05 μm (Figure 18, Pattern 2).
The reservoir in the northern region has experienced a high temperature and large burial depth, and it is currently in mesodiagenesis B stage (Figure 14c,d). The clay minerals are mainly chlorite and illite (Figure 4c), and crystal calcite, ferrocalcite, and quartz overgrowth are common. Compared with low-energy braided channel sands, high-energy braided channel sands have the characteristics of a coarse grain size, large pore throat radius, and strong siliceous cementation but weak calcareous cementation (Table 1). The precipitation of carbonate cement often completely blocks the early small and medium-sized dissolution pores and throat, resulting in poor pore connectivity (Figure 18, Pattern 3). Therefore, high-energy braided channel sand with more large pores is a high-quality reservoir.
Based on the comprehensive analysis of the study area, it can be concluded that the coarser the particle size of the reservoir, the larger the pore radius, and the better the physical properties. This phenomenon can be attributed to two primary mechanisms: (1) larger pore spaces facilitate the infiltration of organic acids, promoting the development of interconnected dissolution pores; while (2) enhanced ion mobility in larger pores leads to preferential Ca2+ accumulation in smaller pores, resulting in localized calcite cementation that reduces reservoir connectivity. For fine-grained lithofacies dominated by small pores, the blockage of small pores results in a large number of isolated pores (Figure 18, Patterns 1 and 3), which are ineffective pores for oil and gas charging. However, for coarse-grained lithofacies reservoirs dominated by large pores, even if local small pores are blocked, most of the large pores are still connected (Figure 18, Patterns 2 and 4). Therefore, the distributary channel in the south and the high-energy braided channel in the north are high-quality reservoirs.
6. Conclusions
The reservoir of the Huagang Formation is dominated by feldspathic quartz sandstone, arkose, and lithic arkose. According to the study of sediment grain size, four main lithologies are developed: gravelly sandstones, medium sandstones, fine sandstones, and siltstones. Compared with fine-grained lithofacies, coarse-grained lithofacies are characterized by a high silicon cement content, low calcium cement content, high compaction that reduces porosity percentage, and low cementation reduction pore volume.
The provenance of the southern region is derived from western metamorphic rock, while that of the northern region is dominated by northern metamorphic rock, the E3h4 and E3h5 members have a small amount of eastern volcanic rock provenance, and the Ningbo region also has a small amount of western metamorphic rock provenance. The northern region has a higher compaction that reduces the porosity rate due to more volcanic rock provenance. Additionally, compared with fine-grained lithofacies, coarse-grained lithofacies have a higher quartz content and less clay minerals and lithic fragment content, and thus they have a stronger anti-compaction ability.
The Huagang Formation reservoir has three stages of carbonate cementation, two stages of quartz overgrowth and two stages of fluid charging. The temperature intervals of the three carbonate precipitation ranges are 70 °C~105 °C, 110 °C~130 °C, and 130 °C~150 °C, respectively; The temperature intervals of authigenic quartz precipitation are 115 °C~130 °C, and 135 °C~150 °C. The northern region has a higher geothermal gradient and larger burial depth than the southern region, and therefore the timing of the diagenetic event is earlier, and it is currently in the mesodiagenesis B stage, while the southern region is still in the mesodiagenesis A stage.
The Huagang Formation reservoir generally suffers from strong dissolution, with dissolution pores accounting for more than 80%. Cementation is the key factor leading to the reduction in reservoir pore size. According to the strength of compaction and cementation, the reservoir evolution models of different lithofacies are established. The southern distributary channel sand and the northern high-energy braided channel sand are high-quality reservoirs due to their coarse grain size, large pore size, and low content of cements.
Author Contributions
Y.Y.: Experiments, Software, Investigation, Writing—Original Draft. Z.H.: Conceptualization, Methodology. T.Q.: Data Curation, Writing—Review and Editing. J.Z.: Experiments, Writing–Review and Editing. Z.L.: Supervision, Writing—Review and Editing. All authors have read and agreed to the published version of the manuscript.
Funding
This study is funded by the research project of CNOOC Shanghai Branch, China (Grant No: CCL2020SHPS019RSI).
Data Availability Statement
The raw data supporting the conclusions of this article will be made available by the authors on request.
Acknowledgments
The authors are grateful to the Shanghai Branch of CNOOC (China) for supplying the samples and providing original geological data. We thank the anonymous reviewers for their instructive comments and suggestions on the manuscript.
Conflicts of Interest
Tong Qu and Jing Zhao are employees of the Research Institute of Exploration and Development, PetroChina Changqing Oilfield Company. The paper reflects the views of the scientists and not the company.
References
- Gong, J.M.; Liao, J.; Liang, J.; Lei, B.H.; Chen, J.W.; Khalid, M.; Haider, S.W.; Meng, M. Exploration prospects of oil and gas in the Northwestern part of the Offshore Indus Basin, Pakistan. China Geol. 2020, 3, 633–642. [Google Scholar] [CrossRef]
- Dou, L.R.; Wen, Z.X.; Wang, J.J.; Wang, Z.M.; He, Z.J.; Liu, X.B.; Zhang, N.N. Analysis of the world oil and gas exploration situation in 2021. Pet. Explor. Dev. 2022, 49, 1195–1209. [Google Scholar]
- Qian, W.; Sun, Q.; Jones, S.J.; Yin, T.; Zhang, C.; Xu, G.; Hou, G.; Zhang, B. Diagenesis and controlling factors of Oligocene Huagang Formation tight sandstone reservoir in the south of Xihu sag, the East China Sea Shelf Basin. J. Pet. Sci. Eng. 2022, 215, 110579. [Google Scholar]
- Leythaeuser, D.; Keuser, C.; Schwark, L. Molecular memory effects recording the accumulation history of petroleum reservoirs: A case study of the Heidrun Field, offshore Norway. Mar. Pet. Geol. 2007, 24, 199–220. [Google Scholar] [CrossRef]
- Yuan, G.H.; Gluyas, J.; Cao, Y.C.; Oxtoby, N.H.; Jia, Z.Z.; Wang, Y.Z.; Xi, K.L.; Li, X.Y. Diagenesis and reservoir quality evolution of the Eocene sandstones in the northern Dongying Sag, Bohai Bay Basin, East China. Mar. Pet. Geol. 2015, 62, 77–89. [Google Scholar]
- Oluwadebi, A.G.; Taylor, K.G.; Dowey, P.J. Diagenetic controls on the reservoir quality of the tight gas Collyhurst Sandstone Formation, Lower Permian, East Irish Sea Basin, United Kingdom. Sediment. Geol. 2018, 371, 55–74. [Google Scholar] [CrossRef]
- Zhao, Z.X.; Dong, C.M.; Zhang, X.G.; Lin, C.Y.; Huang, X.; Duan, D.P.; Lin, J.L.; Zeng, F.; Li, D. Reservoir controlling factors of the Paleogene Oligocene Huagang Formation in the north central part of the Xihu Depression, East China Sea Basin, China. J. Pet. Sci. Eng. 2019, 175, 159–172. [Google Scholar]
- Critelli, S.; Nilsen, T.H. Petrology and diagenesis of the Eocene Butano Sandstone, LaHonda Basin, California. J. Geol. 1996, 104, 295–315. [Google Scholar]
- Caracciolo, L.; Arribas, J.; Ingersoll, R.V.; Critelli, S. The diagenetic destruction of porosity in plutoniclastic petrofacies: The Miocene Diligencia and Eocene Maniobra formations, Orocopia Mountains, southern California, USA. In Sediment Provenance Studies in Hydrocarbon Exploration and Production; Special Publication; Scott, R.A., Smyth, H.R., Morton, A.C., Eds.; Geological Society: London, UK, 2014; Volume 386, pp. 49–62. [Google Scholar]
- Mahmic, O.; Dypvik, H.; Hammer, E. Diagenetic influence on reservoir quality evolution, examples from Triassic conglomerates/arenites in the Edvard Grieg field, Norwegian North Sea. Mar. Pet. Geol. 2018, 93, 247–271. [Google Scholar] [CrossRef]
- You, L.; Xu, S.L.; Li, C.; Zhang, Y.Z.; Zhao, Z.J.; Zhu, P.Y. Diagenesis-porosity evolution and “sweet spot” distribution of low permeability reservoirs: A case study from Oligocene Zhuhai Formation in Wenchang A sag, Pear River Mouth Basin, northern South China Sea. Pet. Explor. Dev. 2018, 45, 251–263. [Google Scholar]
- Fan, C.W.; Cao, J.J.; Lou, J.L.; Li, S.S.; Wu, S.J.; Dai, L.; Hou, J.X.; Mao, Q.R. Heterogeneity and influencing factors of marine gravity flow tight sandstone under abnormally high pressure: A case study from the Miocene Huangliu Formation reservoirs in LD10 area, Yinggehai Basin, South China Sea. Pet. Explor. Dev. 2021, 48, 1048–1062. [Google Scholar]
- Lawan, A.Y.; Worden, R.H.; Utley, J.E.P.; Crowley, S.F. Sedimentological and diagenetic controls on the reservoir quality of marginal marine sandstones buried to moderate depths and temperatures: Brent Province, UK North Sea. Mar. Pet. Geol. 2021, 128, 104993. [Google Scholar]
- Civitelli, M.; Critelli, S. The interplay of detrital modes and depositional facies on diagenesis and petrophysics of deep-marine Miocene sandstones (Cilento Group), southern Apennines, Italy. Mar. Pet. Geol. 2024, 167, 106943. [Google Scholar]
- Marcussen, Ø.; Maast, T.E.; Mondol, N.H.; Jahren, J.; Bjørlykke, K. Changes in physical properties of a reservoir sandstone as a function of burial depth—The Etive Formation, northern North Sea. Mar. Pet. Geol. 2010, 27, 1725–1735. [Google Scholar]
- Dutton, S.P.; Loucks, R.G. Diagenetic controls on evolution of porosity and permeability in lower Tertiary Wilcox sandstones from shallow to ultradeep (200–6700 m) burial, Gulf of Mexico Basin, U.S.A. Mar. Pet. Geol. 2010, 27, 69–81. [Google Scholar] [CrossRef]
- Bah, B.; Beaudoin, N.E.; Lacombe, O.; Girard, J.P.; Gout, C.; Godeau, N.; Deschamps, P. Multi-proxy reconstruction of the burial history and porosity evolution of the TOCA carbonate formation in the Lower Congo basin (South West Africa). Mar. Pet. Geol. 2023, 148, 106018. [Google Scholar] [CrossRef]
- Saiag, J.; Brigaud, B.; Portier, E.; Desaubliaux, G.; Bucherie, A.; Miska, S.; Pagel, M. Sedimentological control on the diagenesis and reservoir quality of tidal sandstones of the upper Cape Hay Formation (Permian, Bonaparte Basin, Australia). Mar. Pet. Geol. 2016, 77, 597–624. [Google Scholar]
- Yu, Y.; Lin, L.B.; Li, Z.; Chen, H.D. Source of quartz cement in tight gas sandstone: Evidence from the Upper Triassic Xujiahe Formation in the western Sichuan Basin, SW China. J. Pet. Sci. Eng. 2022, 212, 110299. [Google Scholar]
- Wanas, H.A.; Soliman, H.E. Allogenic and authigenic clays of the lower Palaeozoic sandstones of the Naqus Formation at Gebel Gunna, central Sinai, Egypt; their recognition and geological significance. J. Afr. Earth Sci. 2001, 32, 47–60. [Google Scholar]
- Bloch, S.; Lander, R.H.; Bonnell, L. Anomalously high porosity and permeability in deeply buried sandstone reservoirs: Origin and predictability. AAPG Bull. 2002, 86, 301–328. [Google Scholar]
- Dowey, P.J.; Hodgson, D.M.; Worden, R.H. Pre-requisites, processes, and prediction of chlorite grain coatings in petroleum reservoirs: A review of subsurface examples. Mar. Pet. Geol. 2012, 32, 63–75. [Google Scholar]
- Shaldybin, M.V.; Wilson, M.J.; Wilson, L.; Muslimova, A.V.; Cherdantseva, D.A.; Molokov, P.B. Jurassic and Cretaceous clastic petroleum reservoirs of the West Siberian sedimentary basin: Mineralogy of clays and influence on poro-perm properties. J. Asian Earth Sci. 2021, 222, 104964. [Google Scholar]
- Azzam, F.; Blaise, T.; Patrier, P.; Elmola, A.A.; Beaufort, D.; Portier, E.; Brigaud, B.; Barbarand, J.; Clerc, S. Diagenesis and reservoir quality evolution of the Lower Cretaceous turbidite sandstones of the Agat Formation (Norwegian North Sea): Impact of clay grain coating and carbonate cement. Mar. Pet. Geol. 2022, 142, 105768. [Google Scholar]
- Bello, A.M.; Al-Ramadan, K.; Babalola, L.O.; Alqubalee, A.; Amao, A.O. Impact of grain-coating illite in preventing quartz cementation: Example from permo-carboniferous sandstone, Central Saudi Arabia. Mar. Pet. Geol. 2023, 149, 106073. [Google Scholar]
- Duan, W.; Li, C.; Luo, C.F.; Chen, X.G.; Bao, X.H. Effect of formation overpressure on the reservoir diagenesis and its petroleum geological significance for the DF11 Block of the Yinggehai Basin, the South China Sea. Mar. Pet. Geol. 2018, 97, 49–65. [Google Scholar]
- Tao, S.Z.; Zou, C.N. Accumulation and distribution on natural gases in xihu sag, east China Sea Basin. Pet. Explor. Dev. 2005, 32, 103–110, (In Chinese with English Abstract). [Google Scholar]
- Dong, C.M.; Zhao, Z.X.; Zhang, X.G.; Yu, S.; Huang, X.; Duan, D.P.; Lin, J.L.; Sun, X.L. Analysis of provenance and sedimentary facies of Huagang formation in the north central of Xihu sag. J. Northeast Pet. Univ. 2018, 42, 25–34+72, (In Chinese with English Abstract). [Google Scholar]
- Zheng, W.B.; Yin, G.F.; Sun, L.; Wei, S.J.; Wei, X.P.; Niu, B. Sedimentary systems of the Oligocene Huagang Formation in the central anticline zone of the Xihu Depression, East China Sea Shelf Basin. Energy Geosci. 2022, 5, 100150. [Google Scholar]
- Liu, J.S.; Cao, B.; Xu, Z.X.; Qin, L.Z.; Xu, F.H.; Tang, J.C. Sedimentary facies and the characteristics of tight sandstone reservoirs of Huagang Formation in Xihu depression, East China Sea Basin. J. Chengdu Univ. Technol. Sci. Technol. Ed. 2012, 39, 130–136, (In Chinese with English Abstract). [Google Scholar]
- Li, S.L.; Li, J.; Chen, B.T.; Xu, L.; Yu, X.H.; Hou, G.W.; Gao, Z.P. Sedimentary characteristics and controlling factors of large-scale longshore bar in the Oligocene Huagang Formation, Xihu sag. J. Palaeogeogr. 2020, 22, 493–503, (In Chinese with English Abstract). [Google Scholar]
- Hao, L.W.; Wang, Q.; Guo, R.L.; Tuo, C.R.; Ma, D.X.; Mou, W.W.; Tian, B. Diagenetic fluids evolution of Oligocene Huagang Formation sandstone reservoir in the south of Xihu Sag, the East China Sea Shelf Basin: Constraints from petrology, mineralogy, and isotope geochemistry. Acta Oceanol. Sin. 2018, 37, 25–34. [Google Scholar] [CrossRef]
- Wan, Y.Z.; Zhang, N.N. Provenance analysis of huagang formation in xihu sag, east china sea basin. J. Yangtze Univ. Nat. Sci. Ed. 2016, 13, 24–27. (In Chinese) [Google Scholar]
- Wang, W.; Lin, C.; Zhang, X.; Dong, C.; Ren, L.; Lin, J. Provenance, clastic composition and their impact on diagenesis: A case study of the Oligocene sandstone in the Xihu sag, East China Sea Basin. Mar. Pet. Geol. 2021, 126, 104890. [Google Scholar]
- Xu, F.; Xu, G.; Liu, Y.; Zhang, W.; Cui, H.; Wang, Y. Factors controlling the development of tight sandstone reservoirs in the Huagang Formation of the central inverted structural belt in Xihu sag, East China Sea Basin. Pet. Explor. Dev. 2020, 47, 101–113. [Google Scholar]
- Li, H.; Yang, X.H.; Zhu, H.T.; Wang, W. Depositional and diagenetic controls on the evolution of abnormally high porosity in braided river deltaic sandstones (Oligocene), Xihu Depression, East China Sea. Geoenergy Sci. Eng. 2023, 226, 211751. [Google Scholar]
- Wang, W.; Lin, C.; Zhang, X.; Dong, C.; Ren, L.; Lin, J. Effect of burial history on diagenetic and reservoir-forming process of the Oligocene sandstone in Xihu Sag, east China Sea Basin. Mar. Pet. Geol. 2020, 112, 104034. [Google Scholar]
- Wang, Q.C.; Chen, D.X.; Gao, X.Z.; Wang, F.W.; Li, J.H.; Liao, W.H.; Wang, Z.Y.; Xie, G.J. Microscopic pore structures of tight sandstone reservoirs and their diagenetic controls: A case study of the Upper Triassic Xujiahe Formation of the western Sichuan Depression, China. Mar. Pet. Geol. 2020, 113, 104119. [Google Scholar]
- Su, A.; Chen, H.H.; Chen, X.; He, C.; Liu, H.P.; Li, Q.; Wang, C.W. The characteristics of low permeability reservoirs, gas origin, generation and charge in the central and western Xihu depression, East China Sea Basin. J. Nat. Gas Sci. Eng. 2018, 53, 94–109. [Google Scholar]
- Xie, G.L.; Shen, Y.L.; Liu, S.G.; Hao, W.D. Trace and rare earth element (REE) characteristics of mudstones from Eocene Pinghu Formation and Oligocene Huagang Formation in Xihu Sag, East China Sea Basin: Implications for provenance, depositional conditions and paleoclimate. Mar. Pet. Geol. 2018, 92, 20–36. [Google Scholar] [CrossRef]
- Abbas, A.; Zhu, H.T.; Zeng, Z.W.; Zhou, X.H. Sedimentary facies analysis using sequence stratigraphy and seismic sedimentology in the Paleogene Pinghu Formation, Xihu Depression, East China Sea Shelf Basin. Mar. Pet. Geol. 2018, 93, 287–297. [Google Scholar]
- Ye, J.R.; Qing, H.R.; Bend, S.L.; Gu, H.R. Petroleum systems in the offshore xihu basin on the continental shelf of the east China sea. AAPG Bull. 2007, 91, 1167–1188. [Google Scholar] [CrossRef]
- Cheng, X.; Hou, D.J.; Zhou, X.H.; Liu, J.S.; Diao, H.; Jiang, Y.H.; Yu, Z.K. Organic geochemistry and kinetics for natural gas generation from mudstone and coal in the Xihu Sag, East China Sea Shelf Basin, China. Mar. Pet. Geol. 2020, 118, 104405. [Google Scholar] [CrossRef]
- Kassab, M.A.; Hassanain, I.M.; Salem, A.M. Petrography, diagenesis and reservoir characteristics of the Pre-Cenomanian sandstone, Sheikh Attia area, East Central Sinai, Egypt. J. Afr. Earth Sci. 2014, 96, 122–138. [Google Scholar] [CrossRef]
- Fan, A.P.; Yang, R.C.; Lenhardt, N.; Wang, M.; Han, Z.Z.; Li, J.B.; Li, Y.J.; Zhao, Z.J. Cementation and porosity evolution of tight sandstone reservoirs in the Permian Sulige gas field, Ordos Basin (central China). Mar. Pet. Geol. 2019, 103, 276–293. [Google Scholar] [CrossRef]
- Jiu, B.; Huang, W.H.; Mu, N.N.; Li, Y. Types and controlling factors of ordovician paleokarst carbonate reservoirs in the southeastern Ordos Basin, China. J. Pet. Sci. Eng. 2021, 198, 108162. [Google Scholar] [CrossRef]
- SY/T 5916-2013; Analytical Methods for Clay Minerals and Common Non-Clay Minerals in Rocks by X-ray Diffraction. Petroleum Industry Press: Beijing, China, 2013.
- Costin, G.; Götz, A.E.; Ruckwied, K. Sedimentary organic matter characterization of the Whitehill shales (Karoo Basin, South Africa): An integrated quantitative approach using FE-EPMA and LA-ICP-MS. Rev. Palaeobot. Palynol. 2019, 268, 29–42. [Google Scholar] [CrossRef]
- Saha, A.; Bhattacharya, B. Controls on near-surface and burial diagenesis of a syn-rift siliciclastic rock succession; a study from Permian Barren Measures Formation, southern India. Sediment. Geol. 2022, 436, 106170. [Google Scholar] [CrossRef]
- SY/T 5336-1996; Core Analysis Methods. Petroleum Industry Press: Beijing, China, 1996.
- Zhang, G.H.; Liu, J.S.; Qin, L.Z.; Zhao, H. Characteristics of the large braided river depositional system of the Oligocene Huagang Formation in the Xihu sag. China Offshore Oil Gas 2018, 30, 10–18, (In Chinese with English Abstract). [Google Scholar]
- Chen, L.L. Discussion on Depositional Mechanism Controlled by Axis-wise Drainage in Huagang Formation (Oligocene) of Xihu Trough, the East China Sea. Offshore Oil 2001, 21, 35–41, (In Chinese with English Abstract). [Google Scholar]
- Xu, Y.X.; Hu, M.Y.; Liang, J.S.; Ke, L.; Jiang, H.J. Sedimentary Provenance Analysis of Oligocene Huagang Formation in Xihu Sag of East China Sea Basin. J. Oil Gas Technol. 2010, 32, 176–179+407, (In Chinese with English Abstract). [Google Scholar]
- Dickinson, W.R.; Suczek, C. Plate tectonics and sandstone compositions. Am. Assoc. Pet. Geol. Bull. 1979, 63, 2164–2182. [Google Scholar]
- Garzanti, E.; Ando, S.; Vezzoli, G. The continental crust as a source of sand (southern alps cross section, Northern Italy). J. Geol. 2006, 114, 533–554. [Google Scholar] [CrossRef]
- Garzanti, E.; Vermeesch, P.; Padoan, M.; Resentini, A.; Vezzoli, G.; Ando, S. Provenance of passive–margin sand (southern Africa). J. Geol. 2014, 122, 17–42. [Google Scholar] [CrossRef]
- Mueller, P.; Langone, A.; Patacci, M.; Di Giulio, A. Detrital signatures of impending collision; the deep-water record of the Upper Cretaceous Bordighera Sandstone and its basal complex (Ligurian Alps, Italy). Sediment. Geol. 2018, 377, 147–161. [Google Scholar] [CrossRef]
- Folk, R.L. Petrology of Sedimentary Rocks; Hemphill Publishing Company: Austin, TX, USA, 1968; Volume 21, pp. 714–727. [Google Scholar]
- Sun, D.Q.; Liu, X.P.; Li, W.H.; Lu, S.F.; He, T.H.; Zhu, P.F.; Zhao, H.T. Quantitative evaluation the physical properties evolution of sandstone reservoirs constrained by burial and thermal evolution reconstruction: A case study from the Lower Cretaceous Baxigai Formation of the western Yingmaili Area in the Tabei Uplift, Tarim Basin, NW China. J. Pet. Sci. Eng. 2022, 208, 109460. [Google Scholar]
- Scherer, M. Parameters influencing porosity in sandstones: A model for sandstone porosity prediction. AAPG Bull. 1987, 71, 485–491. [Google Scholar] [CrossRef]
- Zhang, Q.; Wu, X.S.; Radwan, A.E.; Wang, B.H.; Wang, K.; Tian, H.Y.; Yin, S. Diagenesis of continental tight sandstone and its control on reservoir quality: A case study of the Quan 3 member of the cretaceous Quantou Formation, Fuxin uplift, Songliao Basin. Mar. Pet. Geol. 2022, 145, 105883. [Google Scholar] [CrossRef]
- Umar, M.; Friis, H.; Khan, A.S.; Kassi, A.M.; Kasi, A.K. The effects of diagenesis on the reservoir characters in sandstones of the Late Cretaceous Pab Formation, Kirthar fold belt, southern Pakistan. J. Asian Earth Sci. 2011, 40, 622–635. [Google Scholar] [CrossRef]
- Li, Y.; Chang, X.; Yin, W.; Sun, T.; Song, T. Quantitative impact of diagenesis on reservoir quality of the Triassic Chang 6 tight oil sandstones, Zhenjing area, Ordos Basin, China. Mar. Pet. Geol. 2017, 86, 1014–1028. [Google Scholar] [CrossRef]
- Zhao, S.J.; Fu, Q.; Liu, X.Y.; Li, S.X.; Zhang, G.Y.; Teng, J. Effect of authigenic clay minerals and carbonate cements on quality of tight sandstone reservoirs: Insight from Triassic tight sandstones in the Huaqing area, Ordos Basin, Northern China. J. Asian Earth Sci. 2022, 229, 105099. [Google Scholar] [CrossRef]
- Li, G.M.; Cao, M.J.; Qin, K.Z.; Evans, N.J.; McInnes, B.I.A.; Liu, Y.S. Thermal-tectonic history of the Baogutu porphyry Cu deposit, West Junggar as constrained from zircon U–Pb, biotite Ar/Ar and zircon/apatite (U–Th)/He dating. J. Asian Earth Sci. 2014, 79, 741–758. [Google Scholar]
- Chang, J.; Qiu, N.S.; Li, C.X.; Zhang, J.Y.; Li, W.Z.; Fu, X.D. Zircon He diffusion kinetics models and its implications on the thermal history reconstruction of the ancient strata in the craton basins, China. Chin. J. Geophys. 2022, 65, 711–725, (In Chinese with English Abstract). [Google Scholar]
- Chang, J.; Yang, X.; Qiu, N.S.; Min, K.; Li, C.X.; Li, H.L.; Li, D. Zircon (U-Th)/He thermochronology and thermal evolution of the Tarim Basin, Western China. J. Asian Earth Sci. 2022, 230, 105210. [Google Scholar]
- Guenthner, W.R.; Reiners, P.W.; Ketcham, R.A.; Nasdala, L.; Giester, G. Helium diffusion in natural zircon: Radiation damage, anisotropy, and the interpretation of zircon (U-Th)/He thermochronology. Am. J. Sci. 2013, 313, 145–198. [Google Scholar]
- Ketcham, R.A. Forward and Inverse Modeling of Low-Temperature Thermochronometry Data. Rev. Mineral. Geochem. 2005, 58, 275–314. [Google Scholar]
- Orme, D.A.; Guenthner, W.R.; Laskowski, A.K.; Reiners, P.W. Long-term tectonothermal history of Laramide basement from zircon–He age-eU correlations. Earth Planet. Sci. Lett. 2016, 453, 119–130. [Google Scholar]
- Guenthner, W.R.; Reiners, P.W.; DeCelles, P.G.; Kendall, J. Sevier belt exhumation in central Utah constrained from complex zircon (U-Th)/He data sets: Radiation damage and He inheritance effects on partially reset detrital zircons. Bull. Geol. Soc. Am. 2014, 127, 323–348. [Google Scholar]
- Zhang, J.Y.; Lu, Y.C.; Wout, K.; Liu, J.S.; Li, X.Q.; Du, X.B.; Wang, C.; Liu, X.C.; Feng, L.; Wei, W.; et al. Source to sink transport in the Oligocene Huagang Formation of the Xihu Depression, East China Sea shelf basin. Mar. Pet. Geol. 2018, 98, 733–745. [Google Scholar]
- Krippner, A.; Meinhold, G.; Morton, A.C.; Schönig, J.; von Eynatten, H. Heavy minerals and garnet geochemistry of stream sediments and bedrocks from the Almklovdalen area, Western Gneiss Region, SW Norway: Implications for provenance analysis. Sediment. Geol. 2016, 336, 96–105. [Google Scholar]
- Liu, E.T.; Chen, S.; Yan, D.T.; Deng, Y.; Wang, H.; Jing, Z.H.; Pan, S.Q. Detrital zircon geochronology and heavy mineral composition constraints on provenance evolution in the western Pearl River Mouth basin, northern south China sea: A source to sink approach. Mar. Pet. Geol. 2022, 145, 105884. [Google Scholar]
- Zhao, H.; Jiang, Y.M.; Shen, W.C.; Chang, Y.S.; Qin, J. Study on Huagang Formation provenance characteristics and effects on reservoirs in Xihu Sag. Coal Sci. Technol. 2018, 46, 65–72, (In Chinese with English Abstract). [Google Scholar]
- Hao, L.W.; Liu, C.; Wang, Q.; Wang, H.; Ma, X.F.; Tang, J.; Mu, P. Provenance Characteristics of Huagang Formation (Paleogene) in Xihu Sag, East China Sea. Nat. Gas Geosci. 2011, 22, 315–323, (In Chinese with English Abstract). [Google Scholar]
- Gao, Y.F.; Fu, H.; Ge, H.B.; Zhao, L.X.; Xu, F.H. Provenance analysis of Pinghu Huagang Formation in Xihu Sag, East China Sea. Sci. Technol. Eng. 2013, 13, 6549–6552, (In Chinese with English Abstract). [Google Scholar]
- Wu, D.; Li, H.; Jiang, L.; Hu, S.H.; Wang, Y.H.; Zhang, Y.L.; Liu, Y. Diagenesis and reservoir quality in tight gas bearing sandstones of a tidally influenced fan delta deposit: The Oligocene Zhuhai Formation, western Pearl River Mouth Basin, South China Sea. Mar. Pet. Geol. 2019, 107, 278–300. [Google Scholar] [CrossRef]
- Beard, D.C.; Weyl, P.K. Influence of texture on porosity and permeability of unconsolidated sand. AAPG Bull. 1973, 57, 349–369. [Google Scholar]
- Keith, M.L.; Weber, J.N. Carbon and oxygen isotopic composition of selected limestones and fossils. Geochim. Cosmochim. Acta 1964, 28, 1787–1816. [Google Scholar] [CrossRef]
- Shackleton, N.J. Non-equilibrium isotopic fractionation between sea-water and planktonic foraminiferal test. Nature 1973, 242, 177–179. [Google Scholar] [CrossRef]
- Irwin, H.; Curtis, C.; Coleman, M. Isotopic evidence for source of diagenetic carbonates formed during burial of organic-rich sediments. Nature 1977, 269, 209–213. [Google Scholar] [CrossRef]
- Fontes, J.C.; Mélières, F.; Gibert, E.; Liu, Q.; Gasse, F. Stable isotope and radiocarbon balances of two Tibetan lakes (Sumxi Co, Longmu Co) from 13,000 BP. Quat. Sci. Rev. 1993, 12, 875–887. [Google Scholar] [CrossRef]
- Wang, W.G.; Lin, C.Y.; Zhang, X.G.; Dong, C.M.; Ren, L.H.; Lin, J.L. Structural controls on sandstone compaction within the anticline crest and flank: An example from the Xihu Sag, East China Sea Basin. J. Pet. Sci. Eng. 2022, 211, 110157. [Google Scholar] [CrossRef]
- Su, A.; Chen, H.H.; Wang, C.W.; Li, Q.; Li, P.J. Densification mechanism and diagenesis fluid evolution of low-porosity and low-permeability tight sandstone reservoir: An example from Huagang formation in the northern of the central anticlinal zone in Xihu depression, East China Sea. J. China Univ. Min. Technol. 2016, 45, 972–981, (In Chinese with English Abstract). [Google Scholar]
- Tian, T.; Yang, P.; Ren, Z.L.; Fu, D.L.; Zhou, S.X.; Yang, F.; Li, J. Hydrocarbon migration and accumulation in the Lower Cambrian to Neoproterozoic reservoirs in the Micangshan tectonic zone, China: New evidence of fluid inclusions. Energy Rep. 2020, 6, 721–733. [Google Scholar]
- Lou, R.X.; Wang, L.W.; Wang, L.X.; Yang, G.; Wang, J.P.; Liu, C.Y.; Pei, Y.; Zhang, C. Characteristics of fluid inclusions and hydrocarbon accumulation period of Huoshiling -Yingcheng Formations in Wangfu fault depression, Songliao Basin, China. J. Pet. Sci. Eng. 2022, 208, 109421. [Google Scholar]
- Guo, X.W.; He, S.; Liu, K.Y.; Song, G.Q.; Wang, X.J.; Shi, Z.S. Oil generation as the dominant overpressure mechanism in the cenozoic dongying depression Bohai Bay Basin, China. AAPG Bull. 2010, 94, 1859–1881. [Google Scholar]
- Zhao, J.; Huang, Z.L.; Fan, C.W.; Xu, M.G.; Hou, J.X. Diagenetic and hydrothermal fluid influence on tight sandstone reservoir quality: Gravity-flow deposits from the Huangliu Formation, Ledong area, Yinggehai Basin, South China Sea. J. Pet. Sci. Eng. 2022, 215, 110633. [Google Scholar]
- Wang, W.; Lin, C.; Zhang, X.; Dong, C.; Ren, L.; Lin, J. Seismic diagenetic facies prediction of tight sandstone in the offshore sparse well area: An example from the Xihu Depression of the East China Sea Basin. J. Pet. Sci. Eng. 2022, 216, 110825. [Google Scholar]
- Hong, D.D.; Cao, J.; Wu, T.; Dang, S.S.; Hu, W.X.; Yao, S.P. Authigenic clay minerals and calcite dissolution influence reservoir quality in tight sandstones: Insights from the central Junggar Basin, NW China. Energy Geosci. 2020, 1, 8–19. [Google Scholar]
- Liu, G.Z.; Hu, G.C.; Shi, X.Z.; Ma, Y.P.; Yin, X.Z.; Li, A.R. Carbonate cementation patterns and diagenetic reservoir facies of the triassic Yanchang Formation deep-water sandstone in the huangling area of the Ordos Basin, northwest China. J. Pet. Sci. Eng. 2021, 203, 108608. [Google Scholar] [CrossRef]
- Dutton, S.P. Calcite cement in Permian deep-water sandstones, Delaware Basin, west Texas: Origin, distribution, and effect on reservoir properties. AAPG Bull. 2008, 92, 765–787. [Google Scholar]
- Mansour, A.S.; Rifai, R.I.; Shaaban, M.N. Geochemical constraint on the origin of the multi-mineralogic carbonate cements in the subsurface Middle Jurassic sandstones, central Sinai, Egypt. J. Geochem. Explor. 2014, 143, 163–173. [Google Scholar]
- Denny, A.C.; Kozdon, R.; Kitajima, K.; Valley, J.W. Isotopically zoned carbonate cements in Early Paleozoic sandstones of the Illinois Basin: δ18O and δ13C records of burial and fluid flow. Sediment. Geol. 2017, 361, 93–110. [Google Scholar]
- Athy, L.F. Density, porosity, and compaction of sedimentary rocks. AAPG Bull. 1930, 14, 1–21. [Google Scholar]
- Lander, R.H.; Walderhaug, O. Predicting porosity through simulating sandstone compaction and quartz cementation. AAPG Bull. 1999, 83, 433–449. [Google Scholar]
- Walderhaug, O. Modeling quartz cementation and porosity in middle Jurassic brent group sandstones of the Kvitebjørn field, northern north Sea. AAPG Bull. 2000, 84, 1325–1339. [Google Scholar]
- Taylor, T.R.; Giles, M.R.; Hathon, L.A.; Diggs, T.G.; Braunsdorf, N.R.; Birbiglia, G.V.; Kittridge, M.G.; Macaulay, C.I.; Espejo, I.S. Sandstone diagenesis and reservoir quality prediction: Models, myths, and reality. AAPG Bull. 2010, 94, 1093–1132. [Google Scholar]
- English, K.L.; English, J.M.; Bonnell, L.M.; Lander, R.H.; Hollis, C.; Redfern, J.; Guirham, C.; Garnham, J.; Cherif, R.Y. Controls on reservoir quality in exhumed basins: An example from the Ordovician sandstone, Illizi Basin, Algeria. Mar. Pet. Geol. 2017, 80, 203–227. [Google Scholar]
- Gier, S.; Worden, R.H.; Johns, W.D.; Kurzweil, H. Diagenesis and reservoir quality of Miocene sandstones in the Vienna Basin, Austria. Mar. Pet. Geol. 2008, 25, 681–695. [Google Scholar]
- Carvalho, A.D.S.G.; De Ros, L.F. Diagenesis of Aptian sandstones and conglomerates of the Campos Basin. J. Pet. Sci. Eng. 2015, 125, 189–200. [Google Scholar]
- Molenaar, N.; Felder, M.; Baer, K.; Gotz, A.E. What classic greywacke (litharenite) can reveal about feldspar diagenesis; an example from Permian Rotliegend Sandstone in Hessen, Germany. Sediment. Geol. 2015, 326, 79–93. [Google Scholar]
- Lai, J.; Wang, G.W.; Wang, S.; Cao, J.T.; Li, M.; Pang, X.J.; Zhou, Z.L.; Fan, X.Q.; Dai, Q.Q.; Yang, L.; et al. Review of diagenetic facies in tight sandstones: Diagenesis, diagenetic minerals, and prediction via well logs. Earth-Sci. Rev. 2018, 185, 234–258. [Google Scholar]
- Xiong, Y.; Xu, H.G.; Wang, Y.Q.; Zhou, W.S.; Wang, L.; Feng, K. The variation mechanism of petrophysical properties and the effect of compaction on the relative permeability of an unconsolidated sandstone reservoir. Mar. Pet. Geol. 2018, 92, 754–763. [Google Scholar]
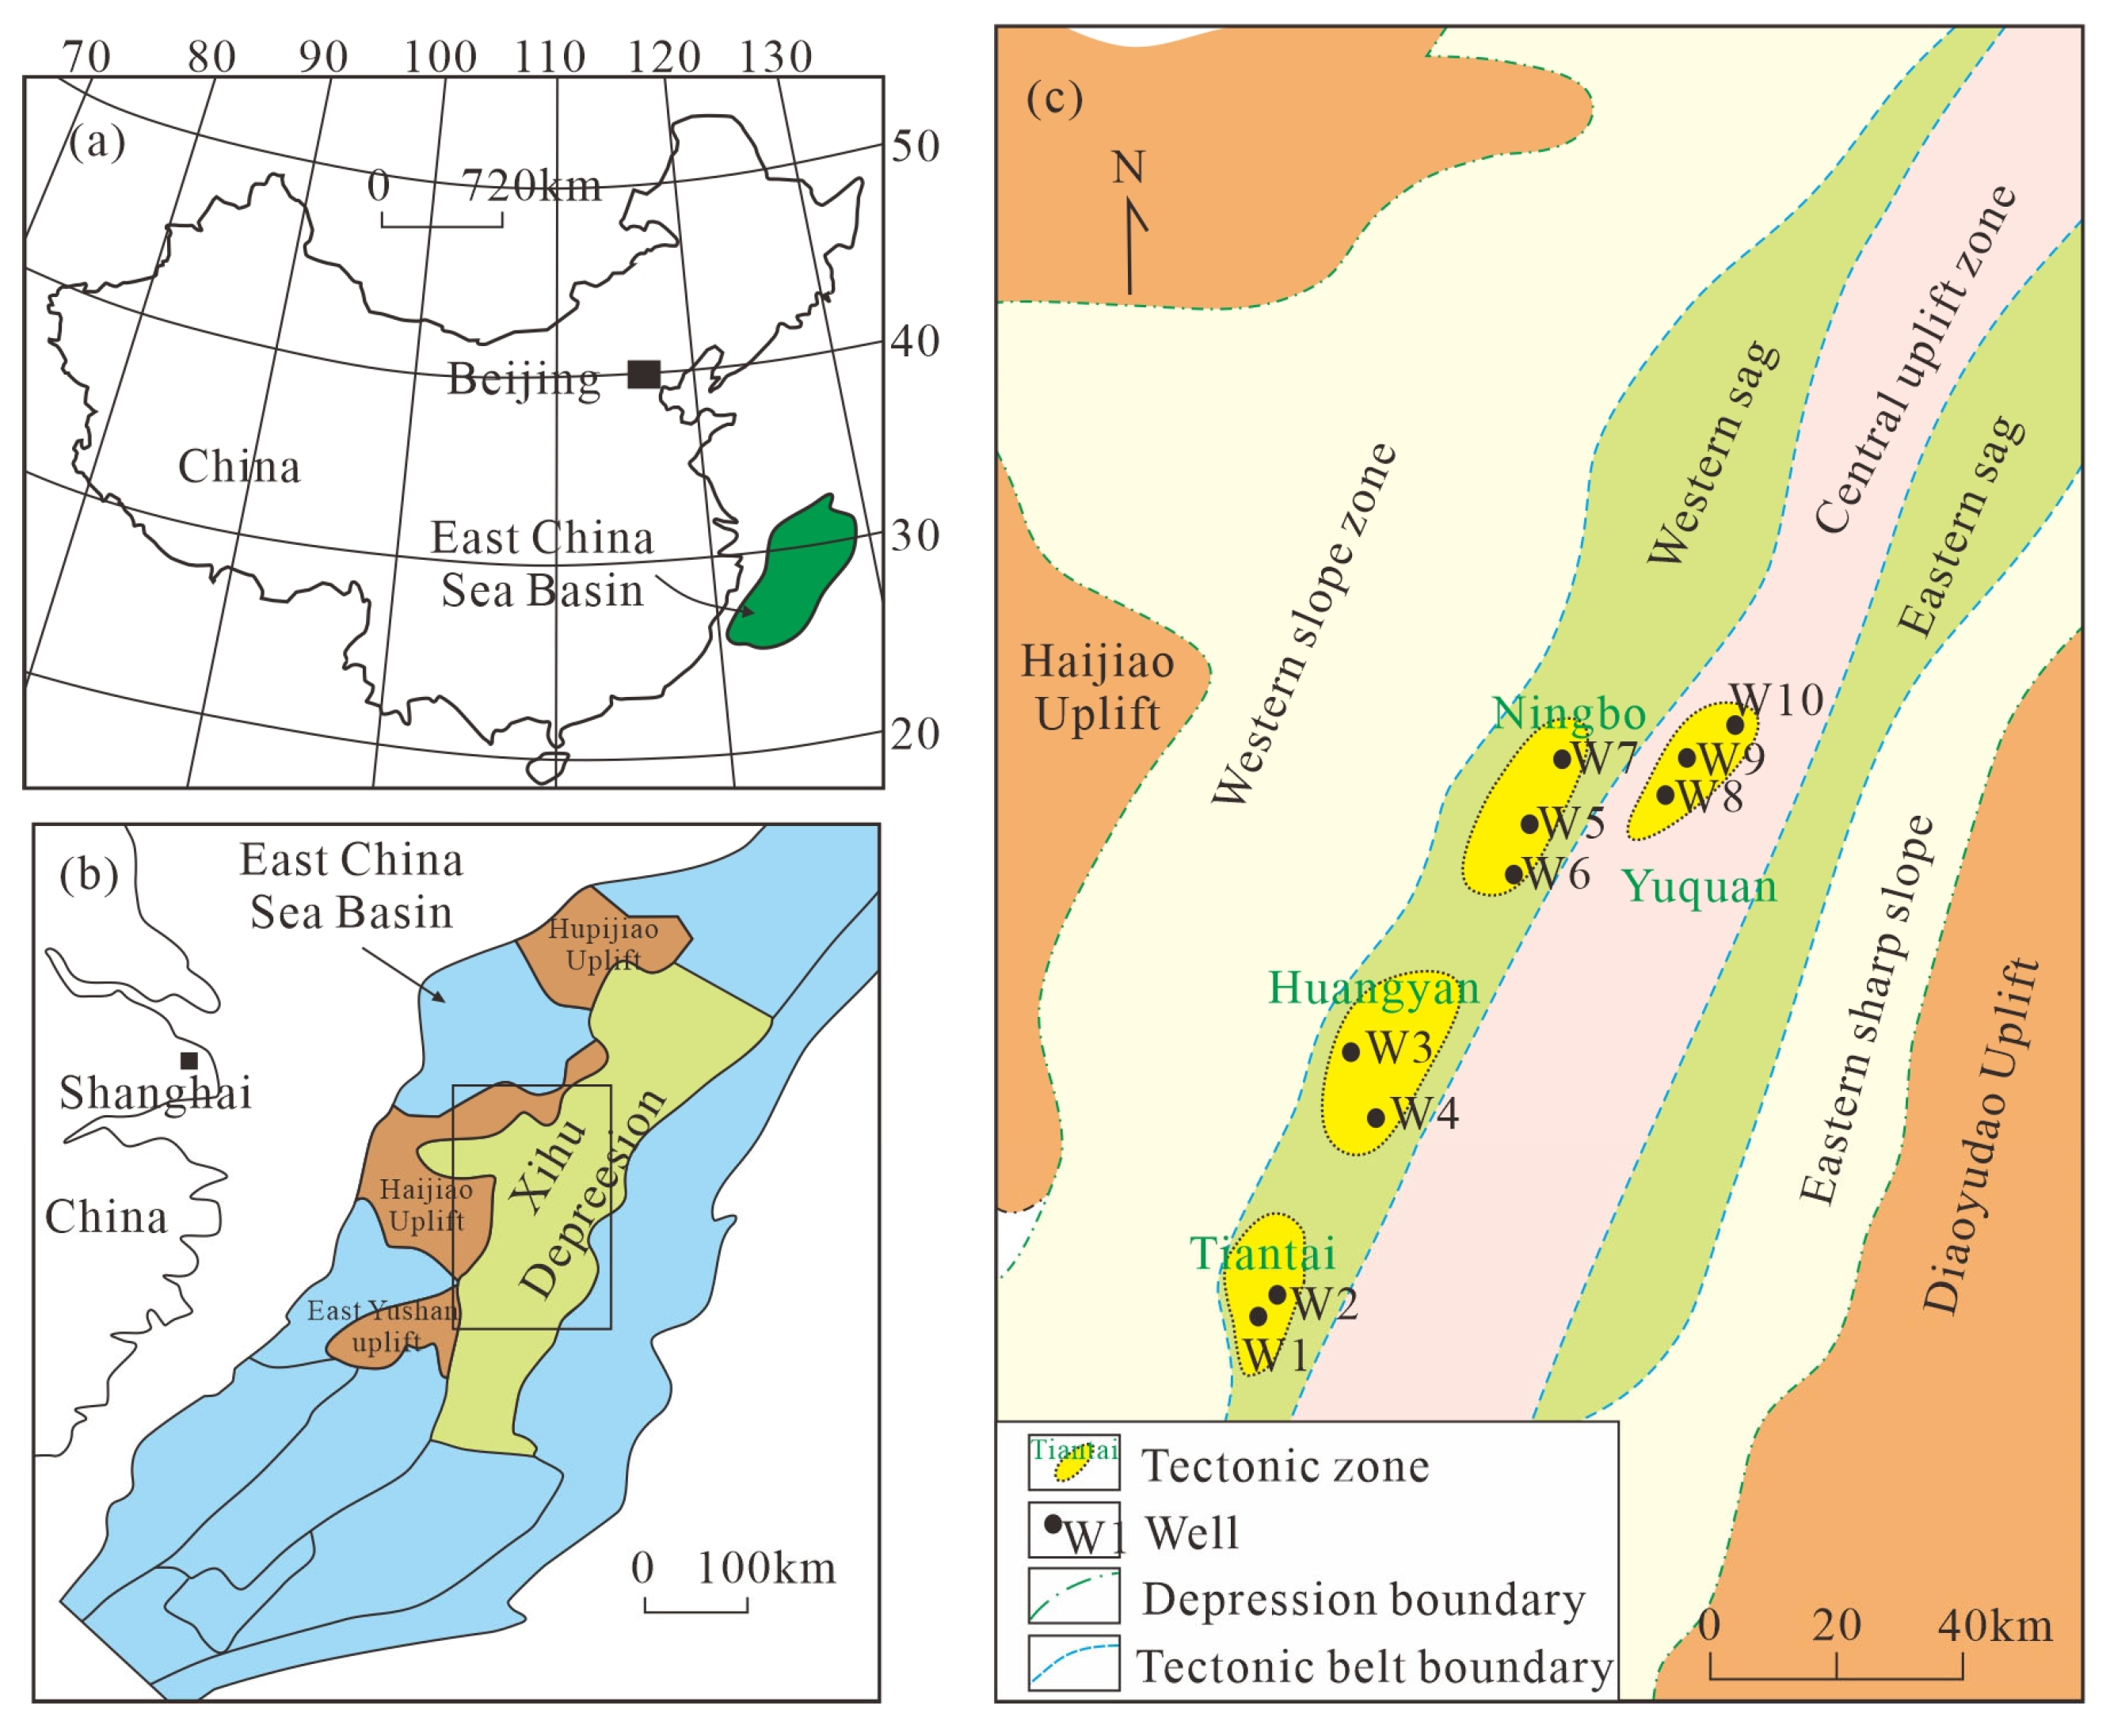
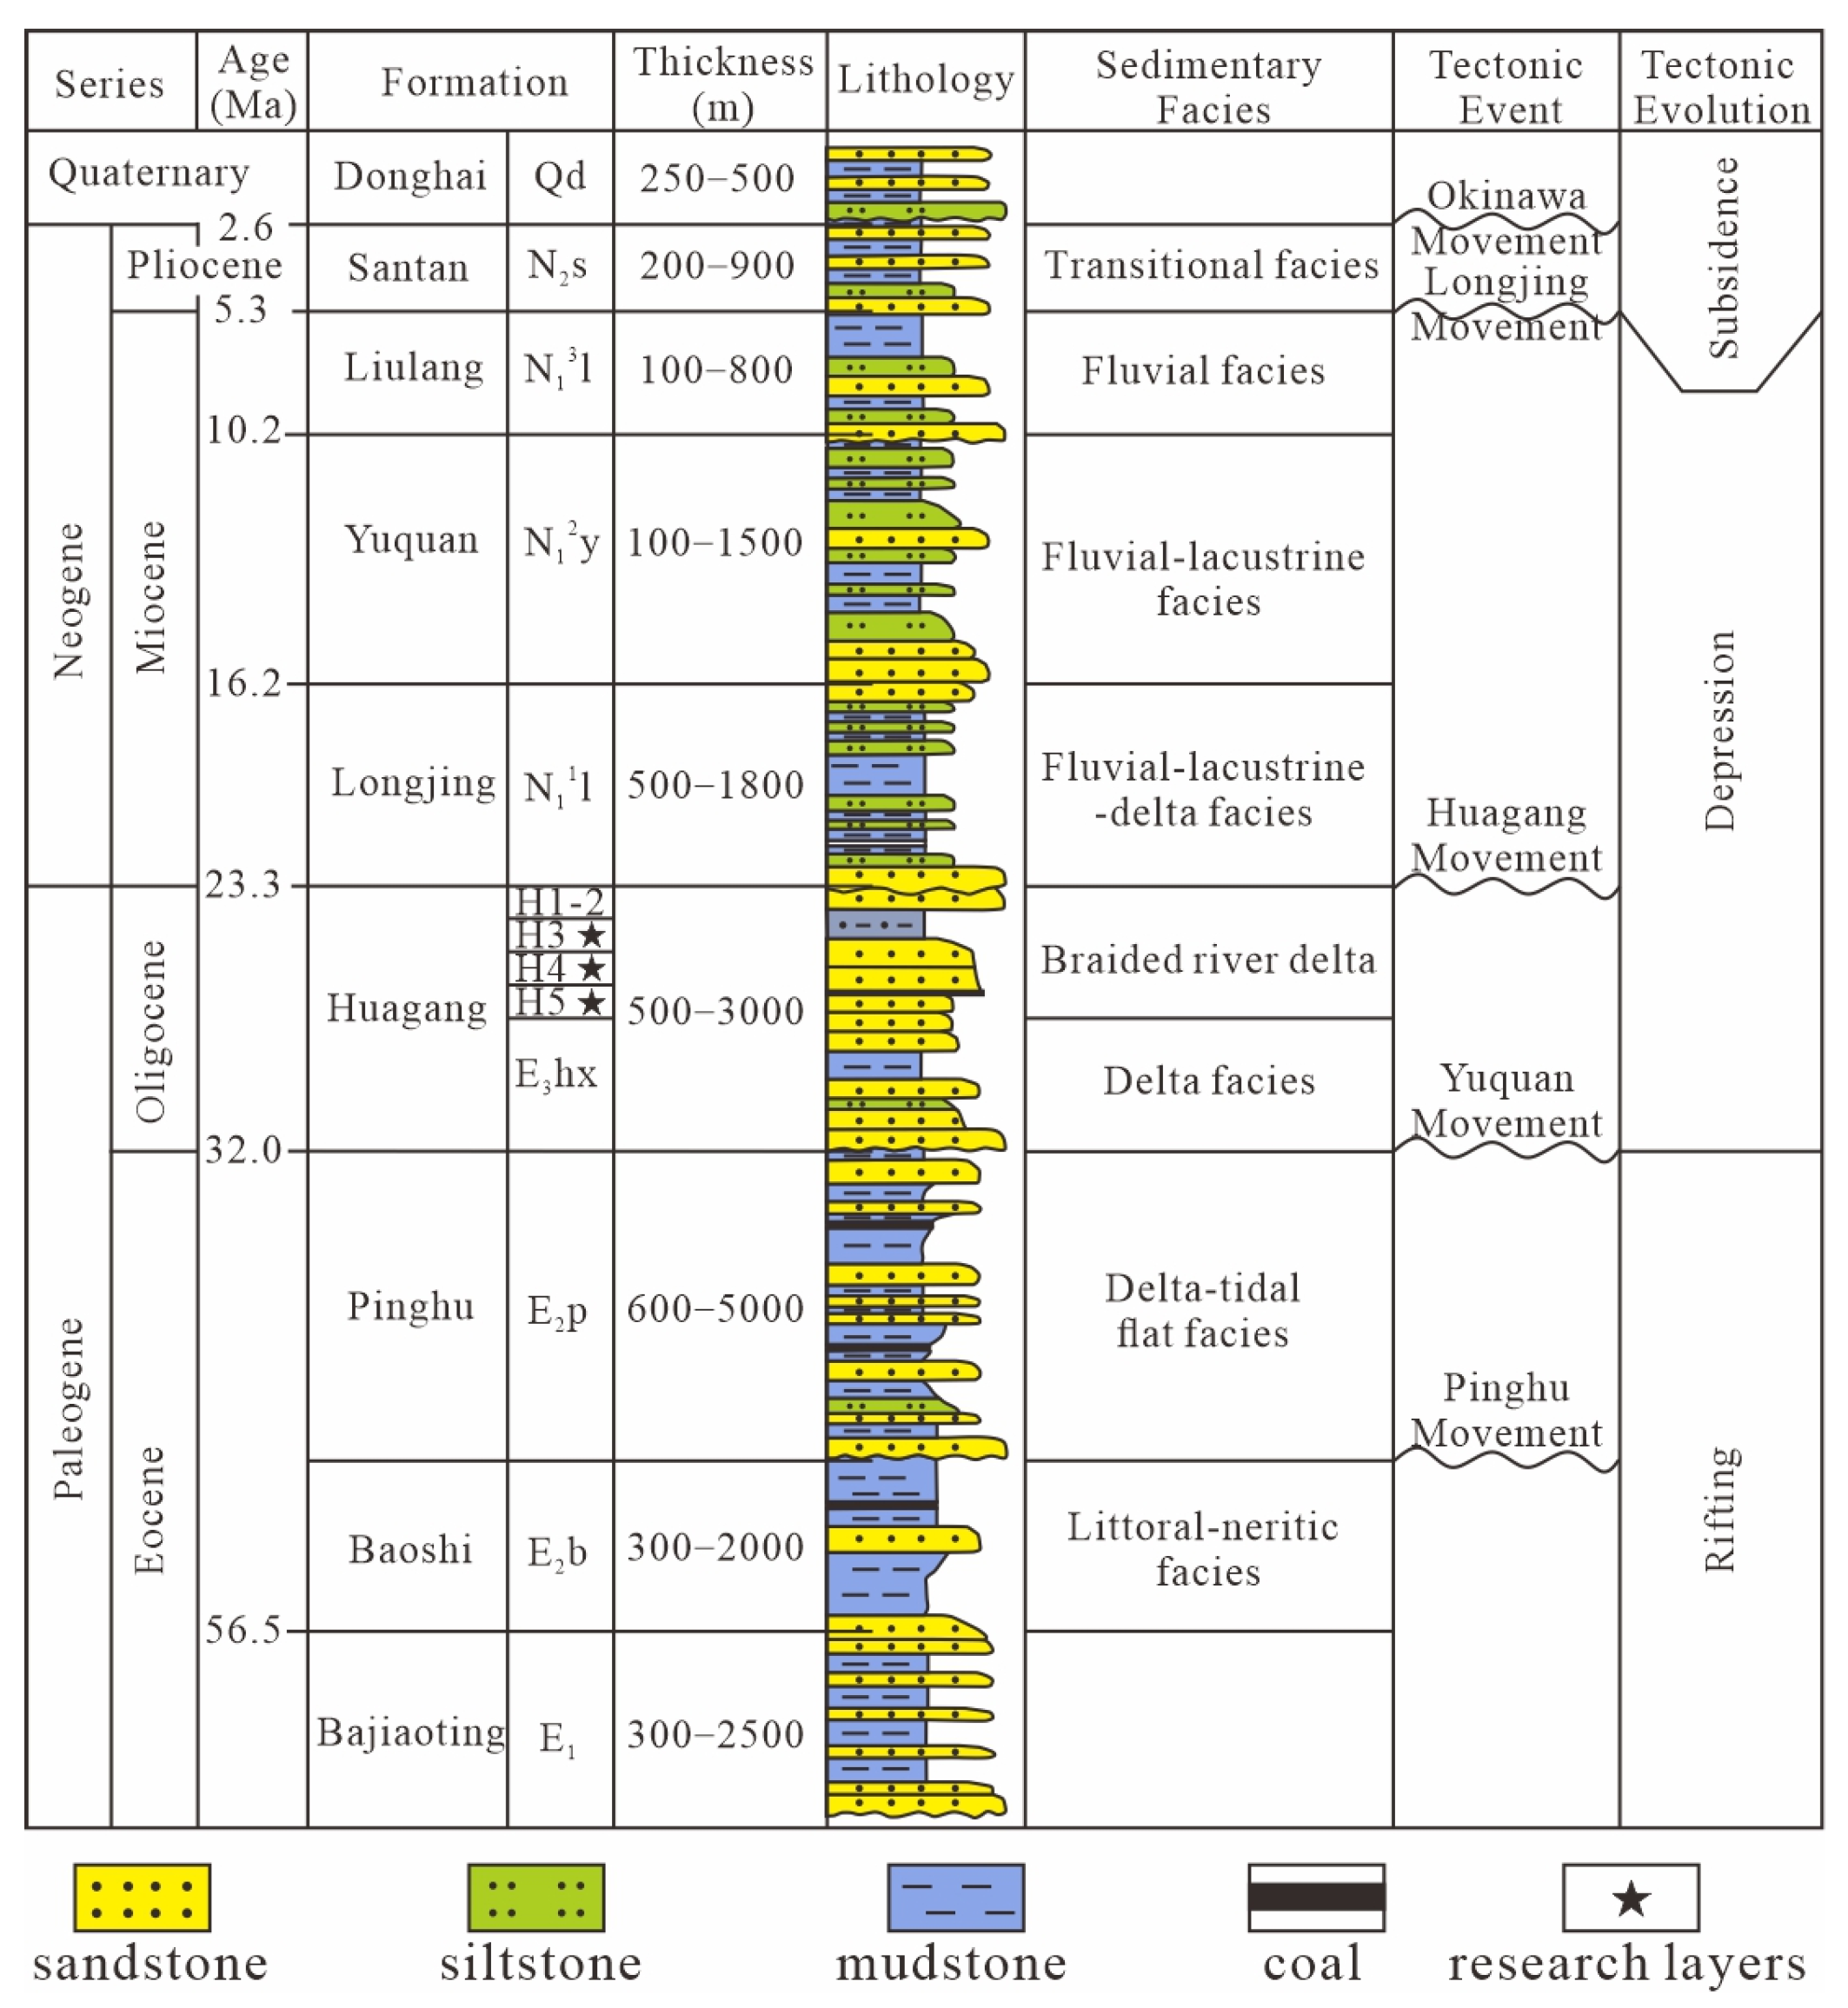
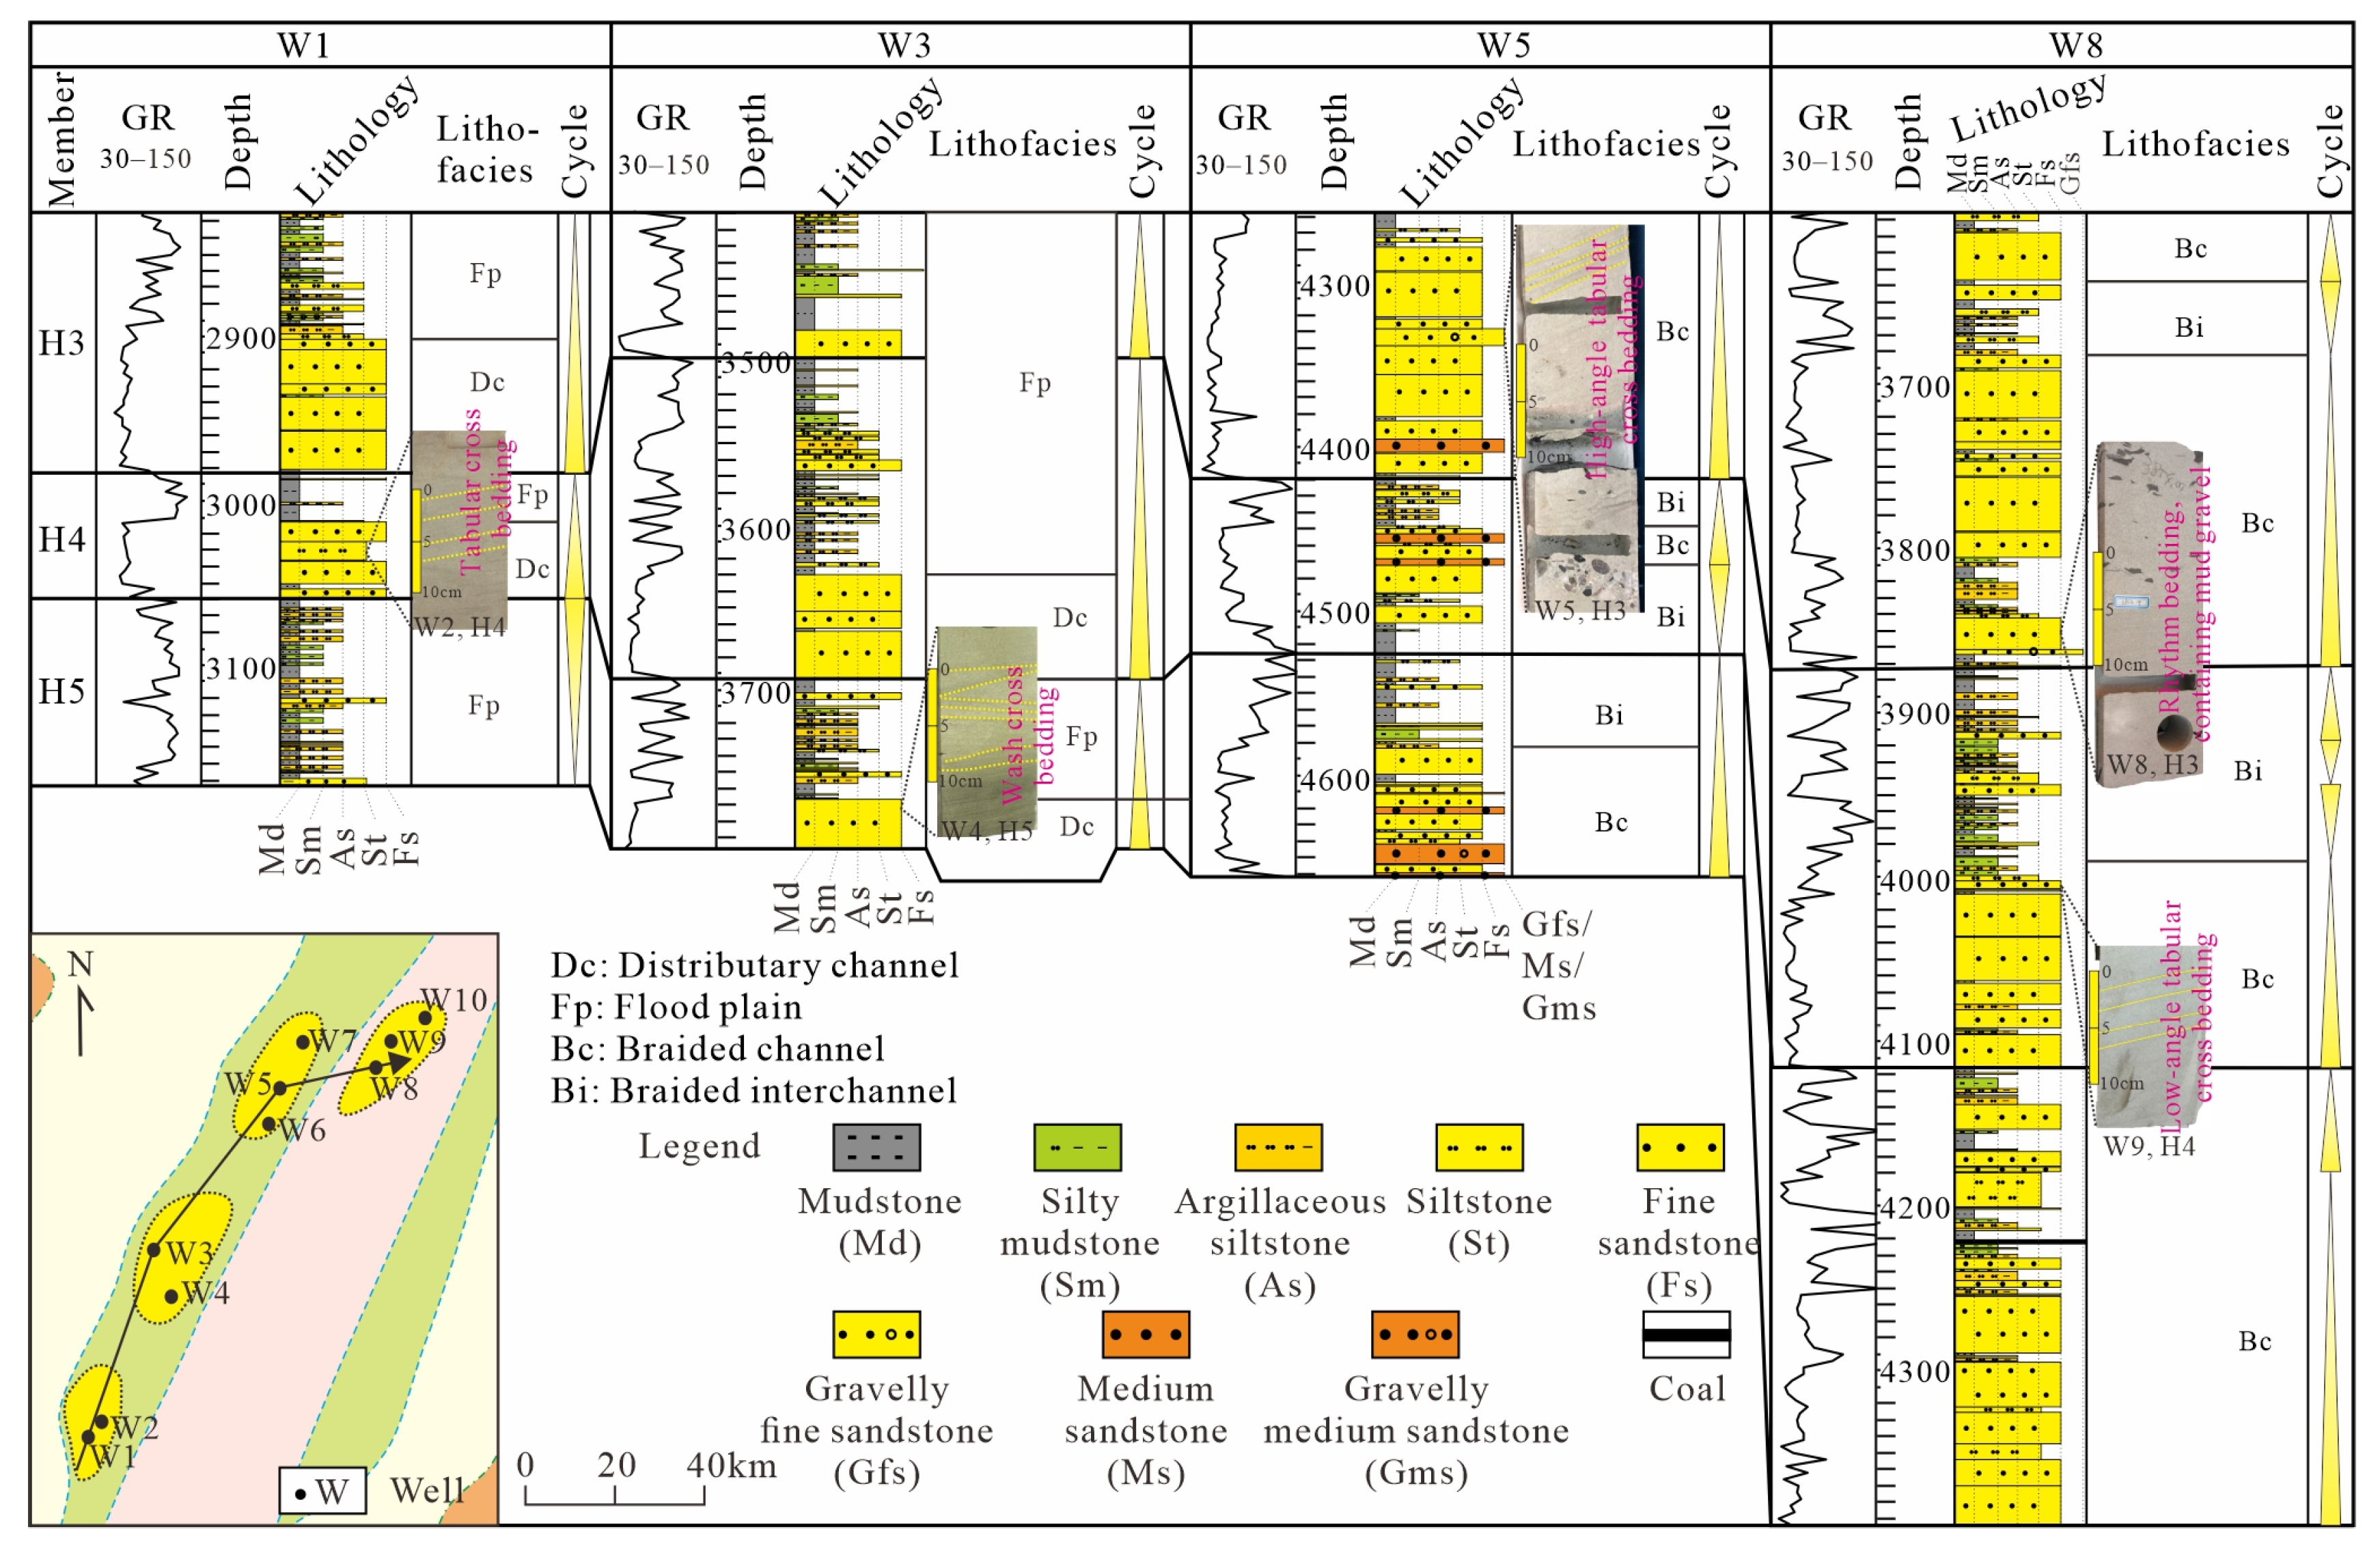
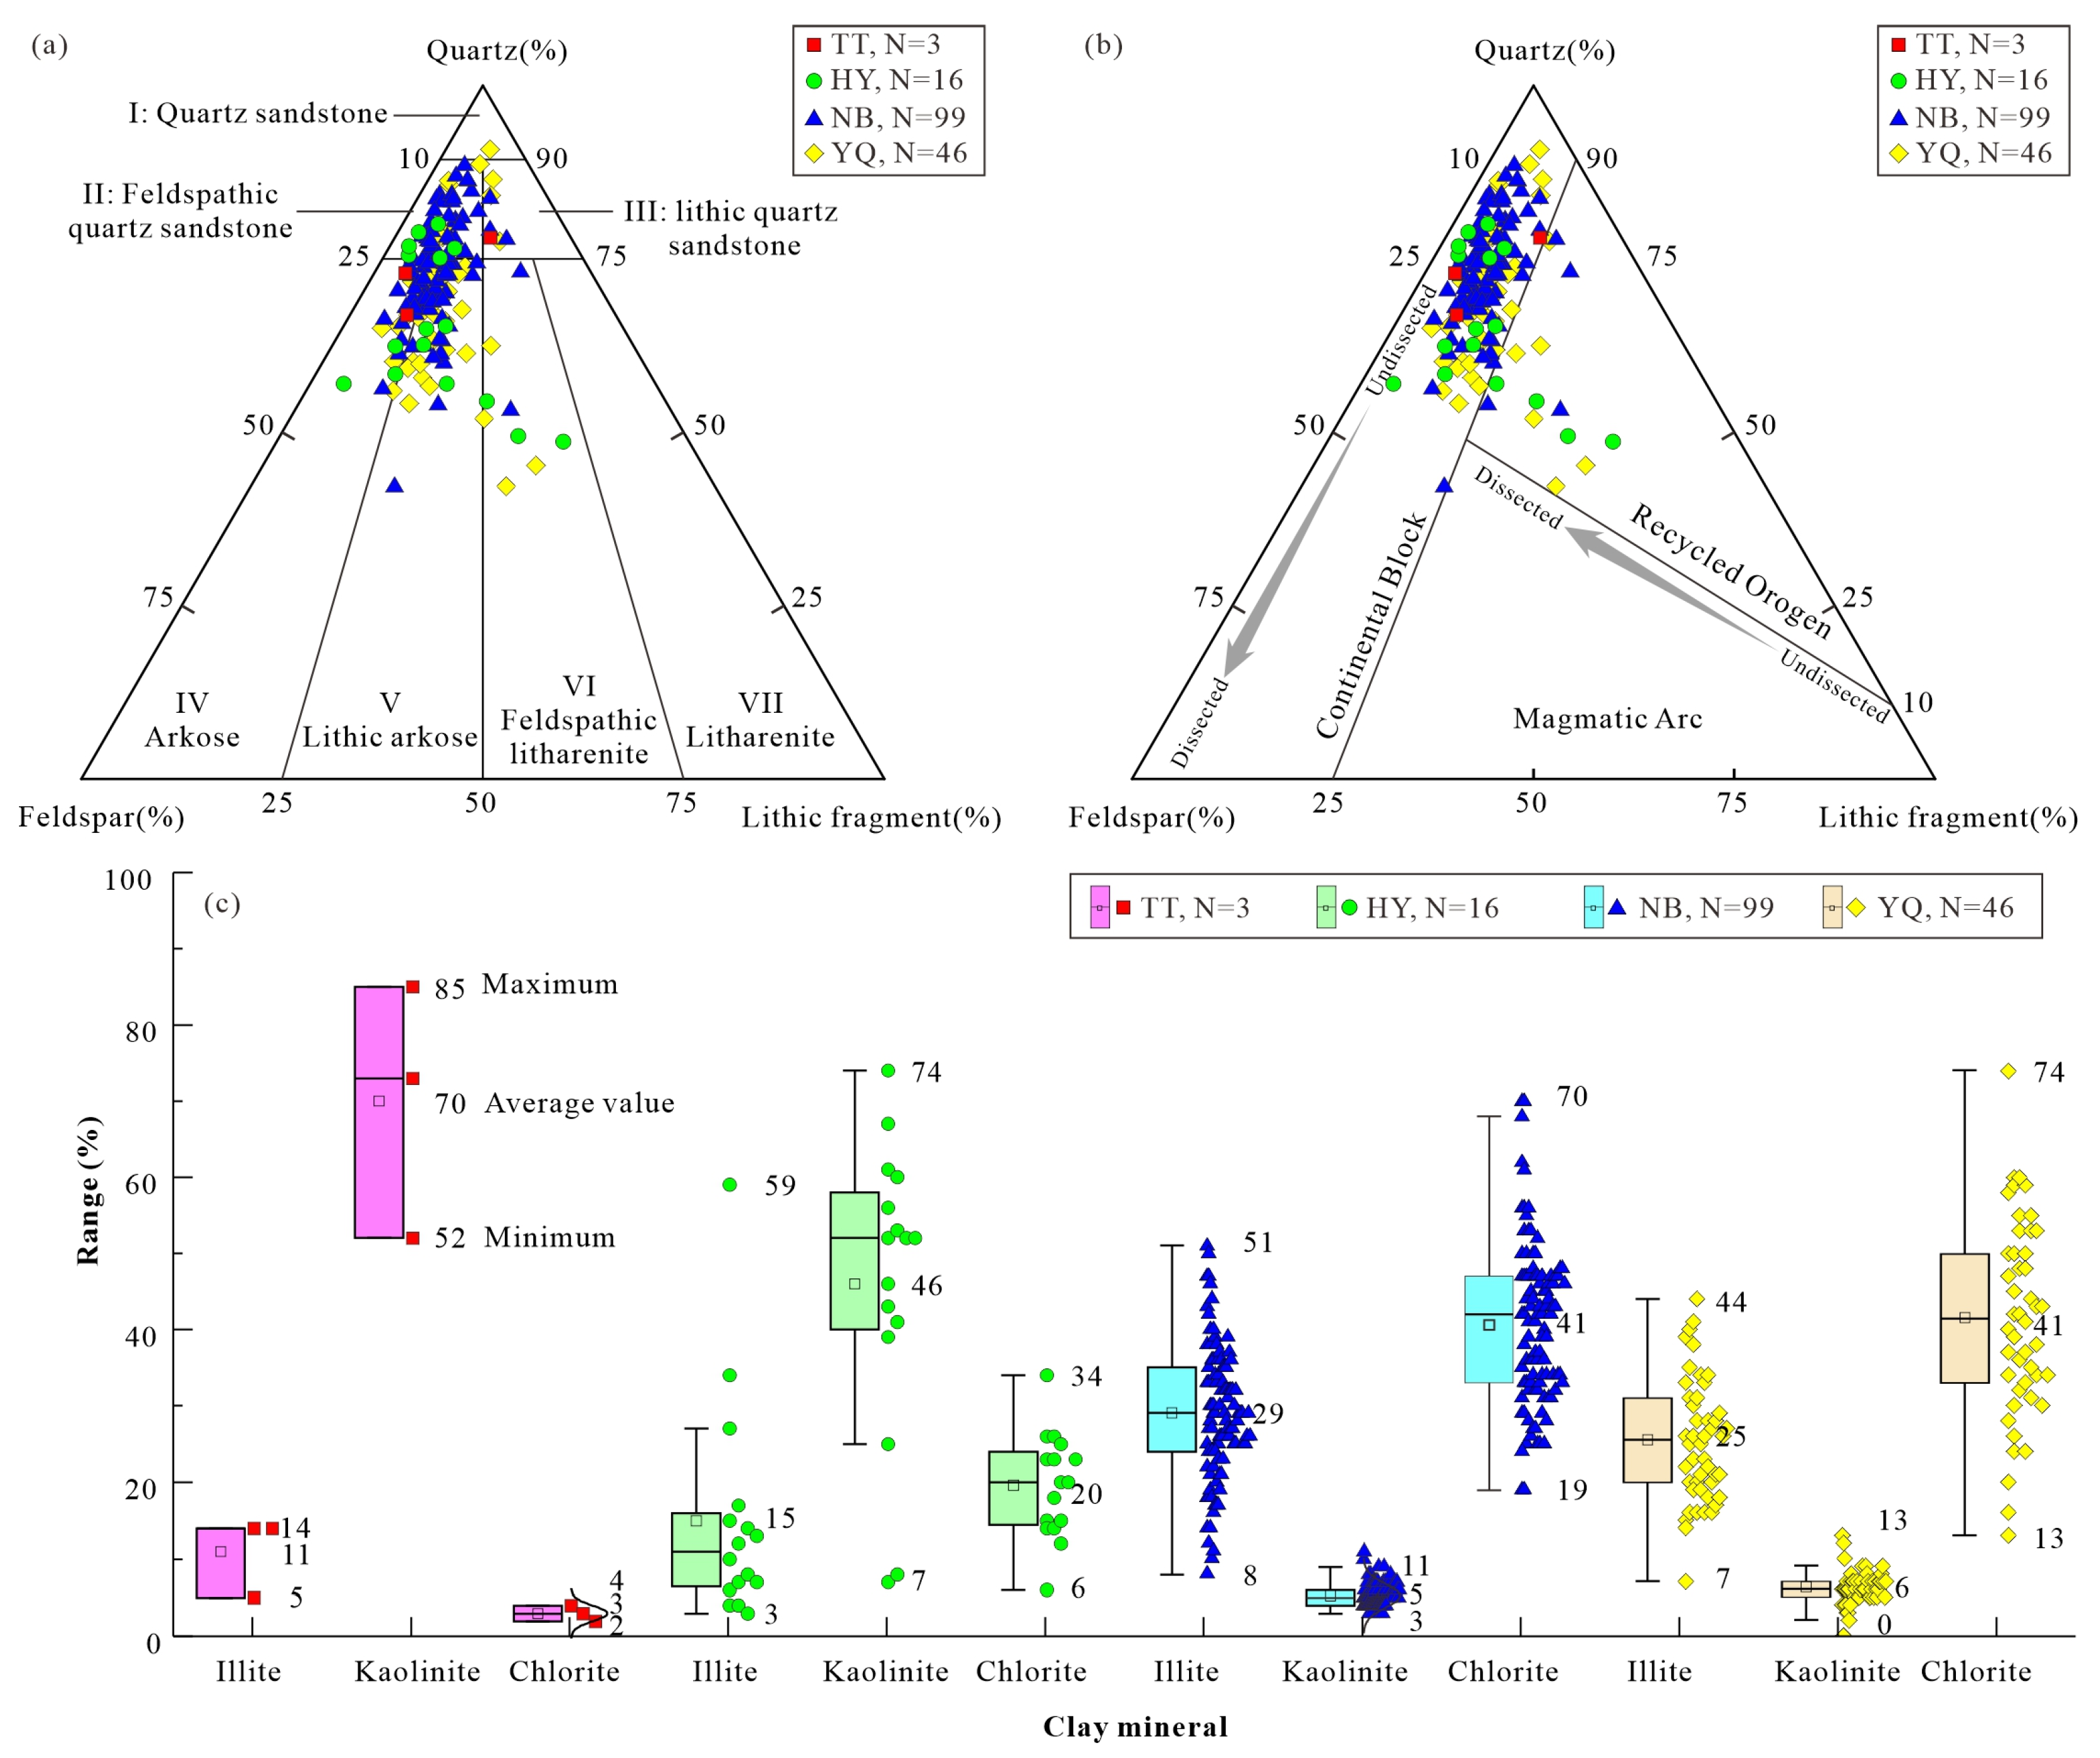
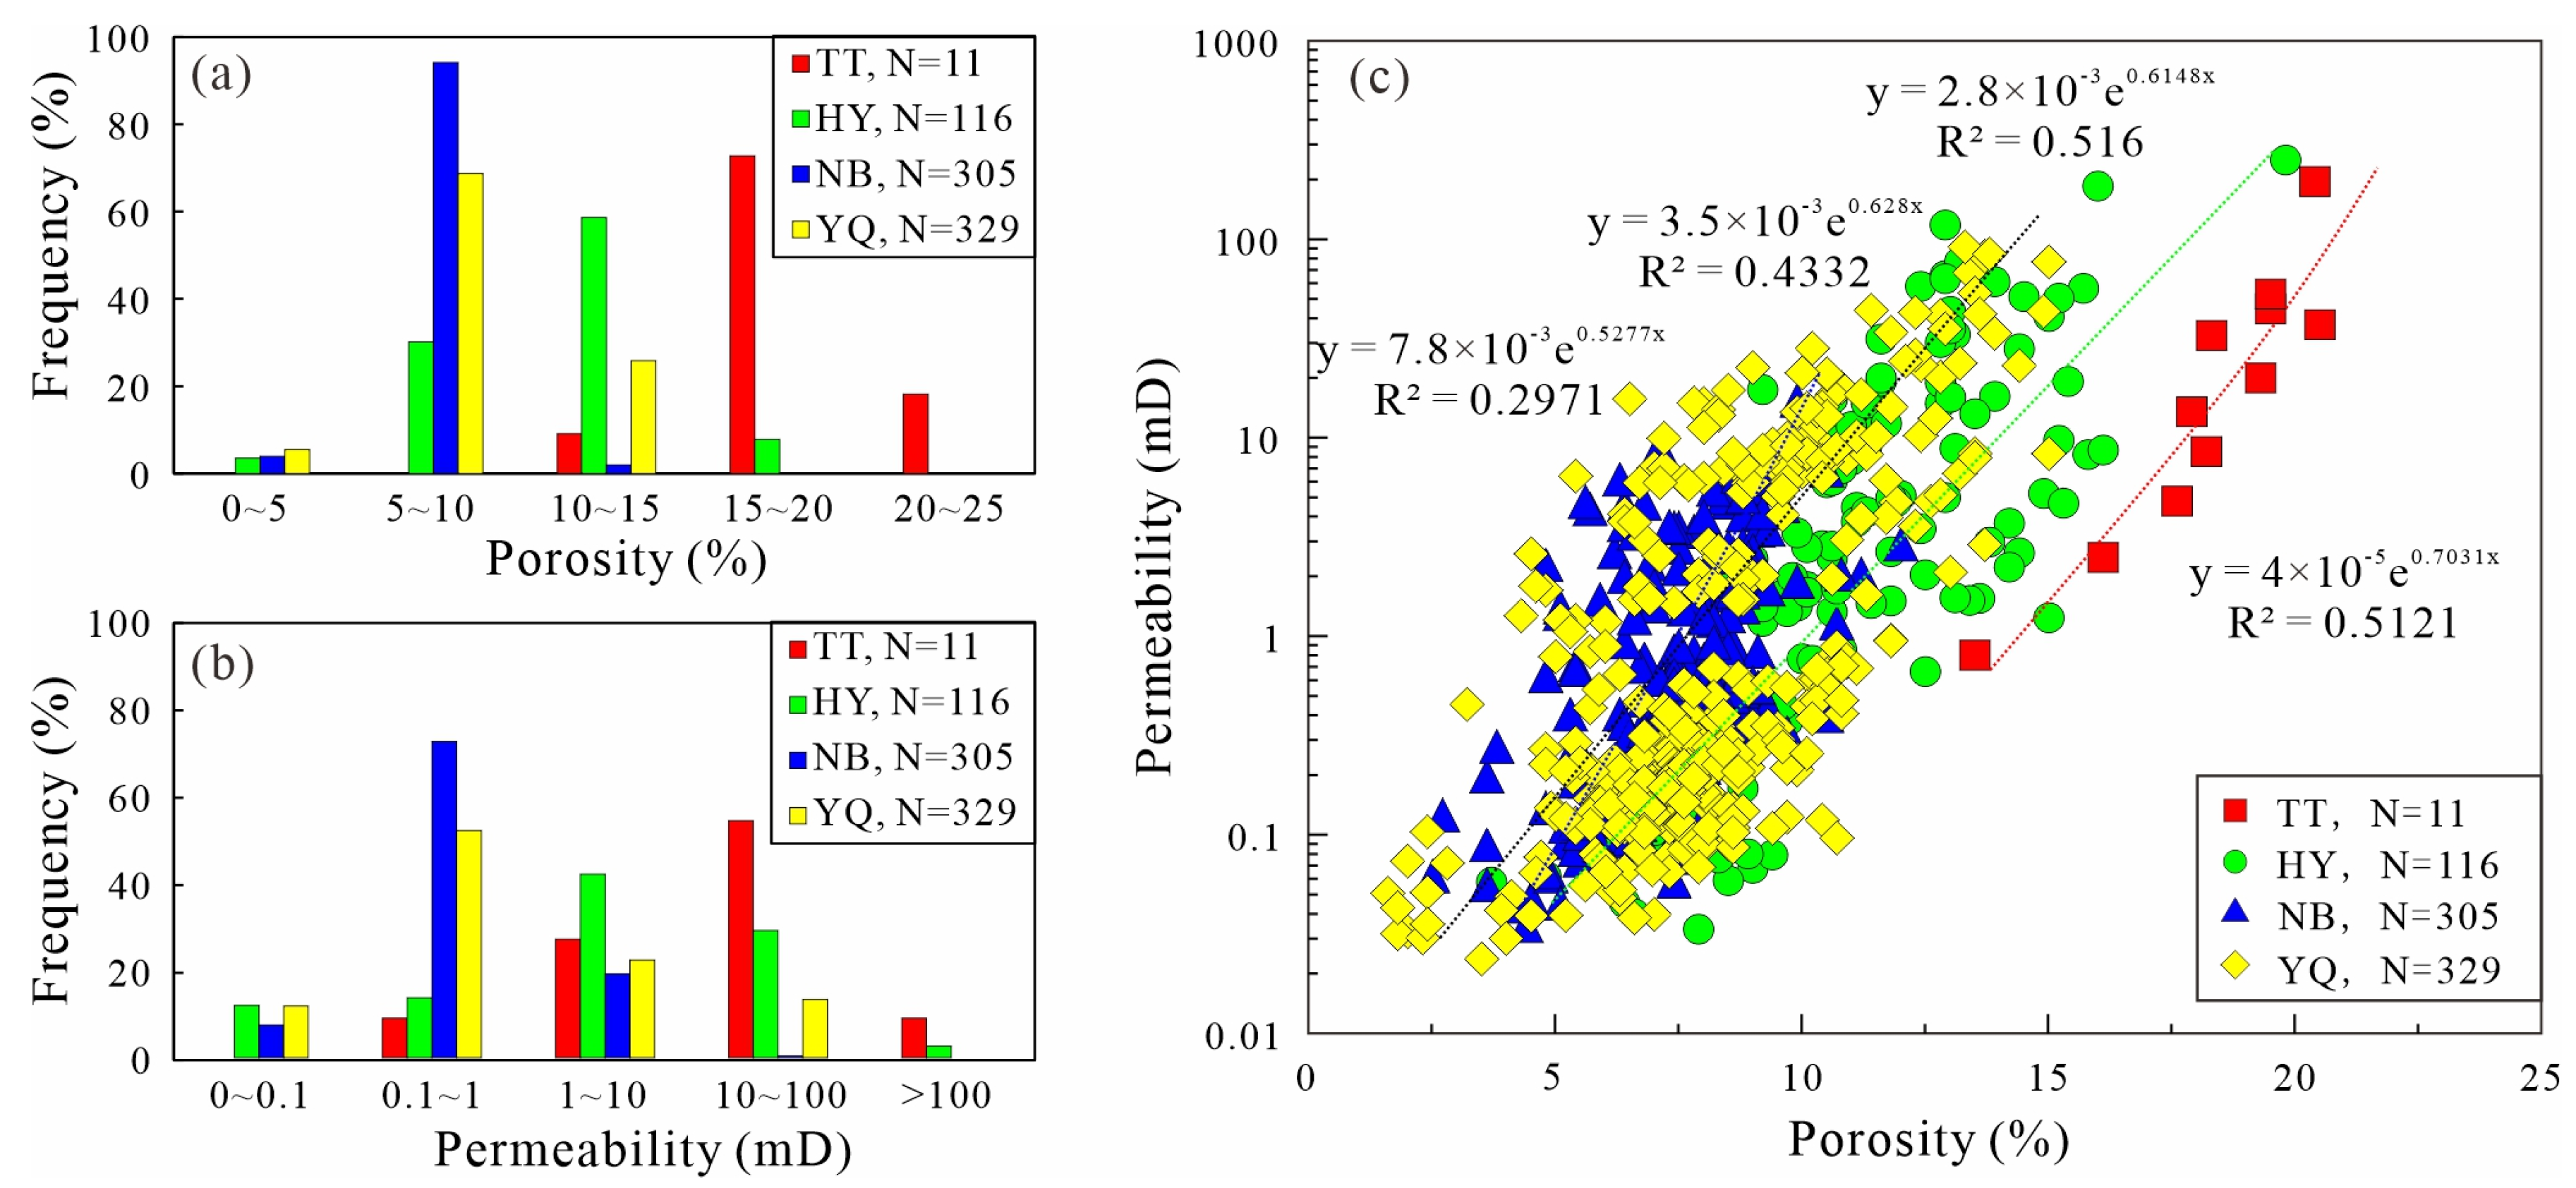
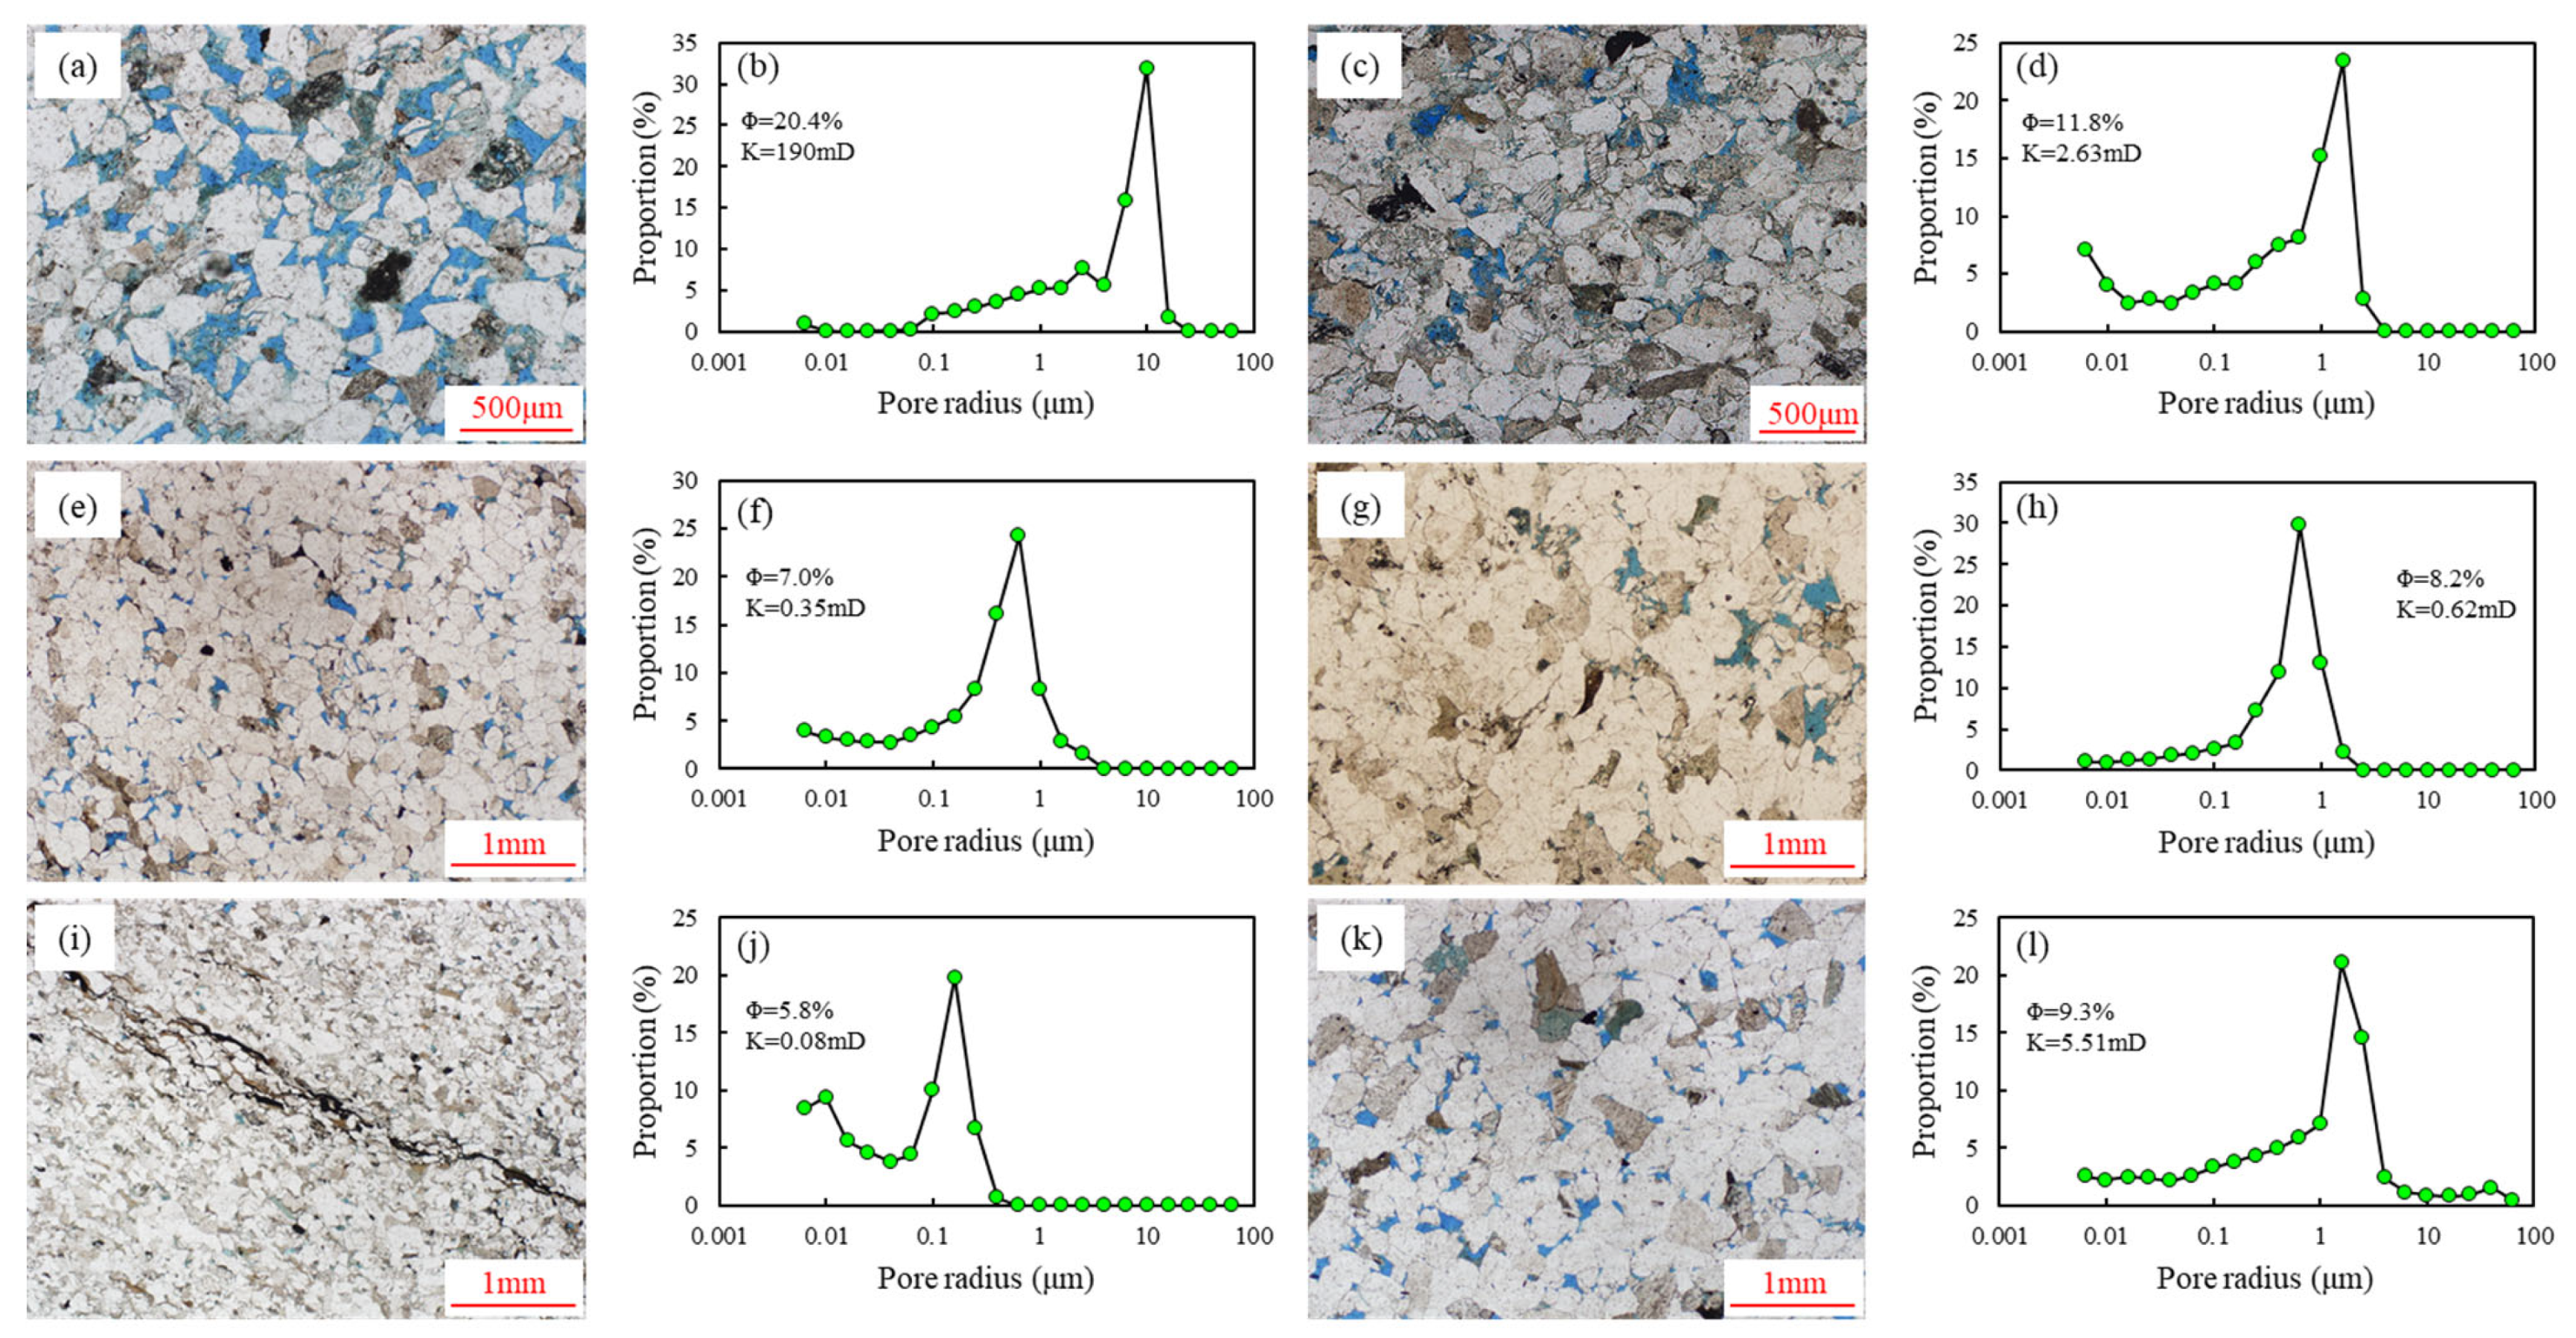
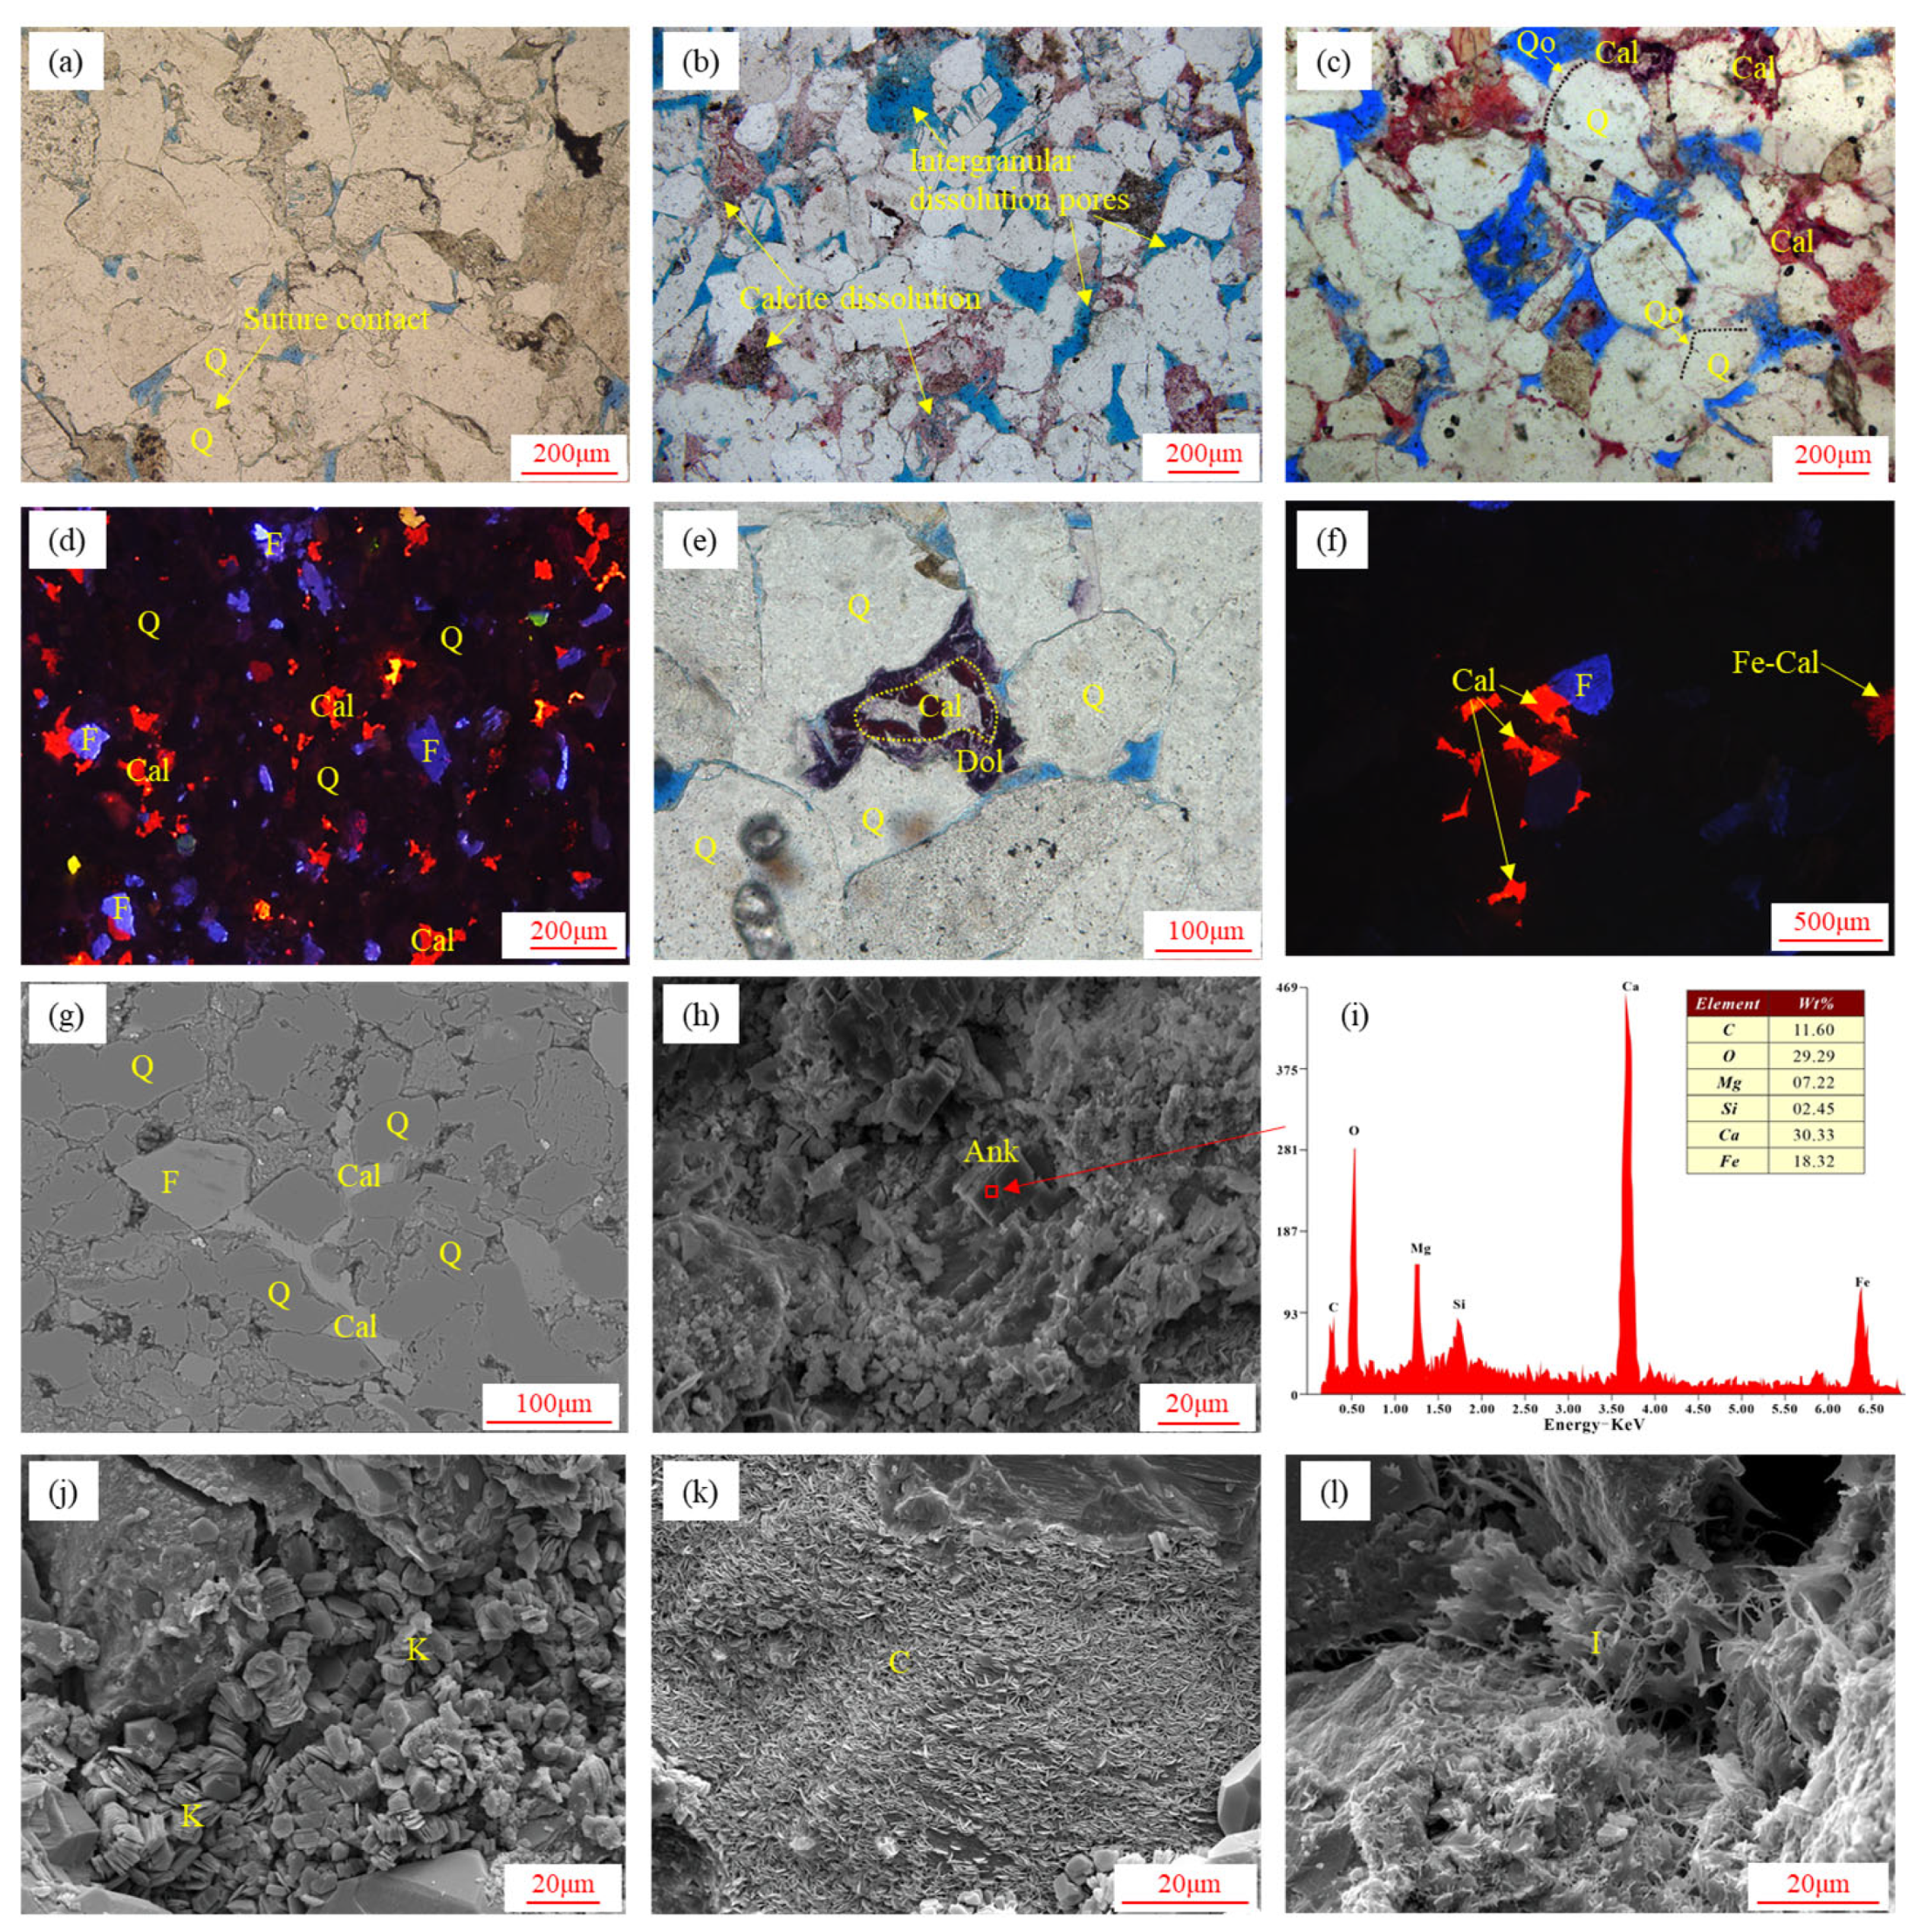
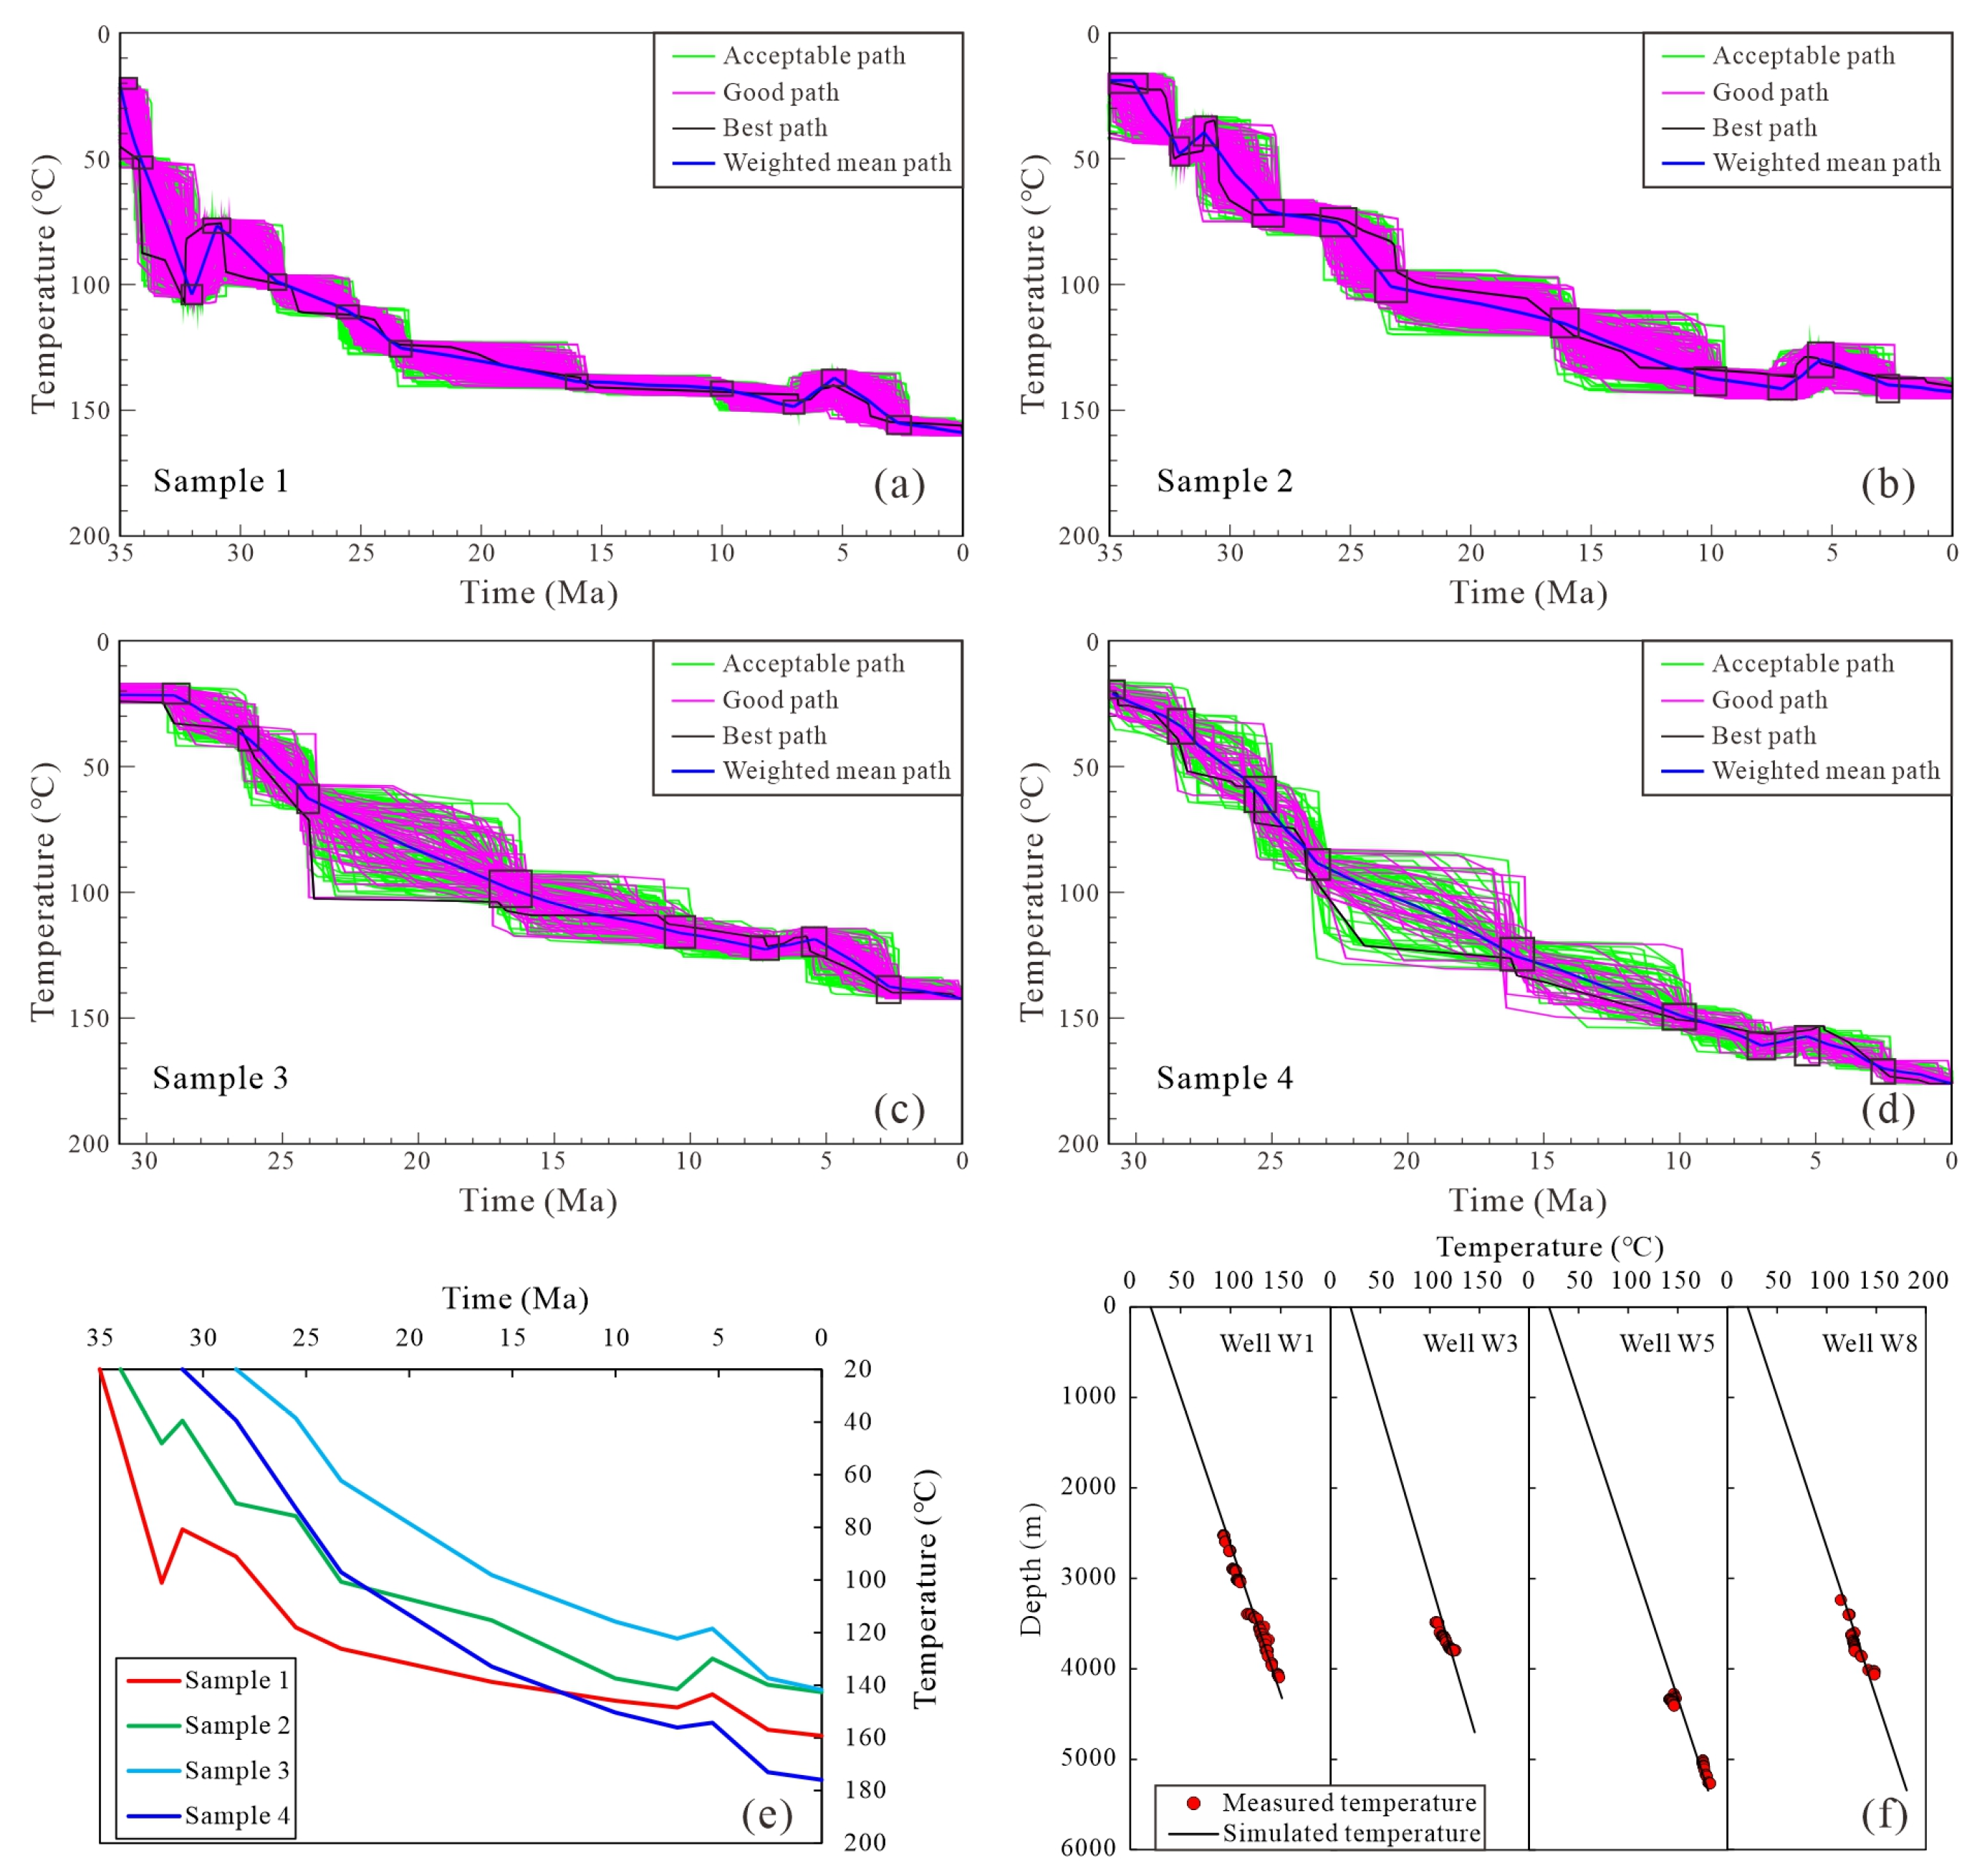
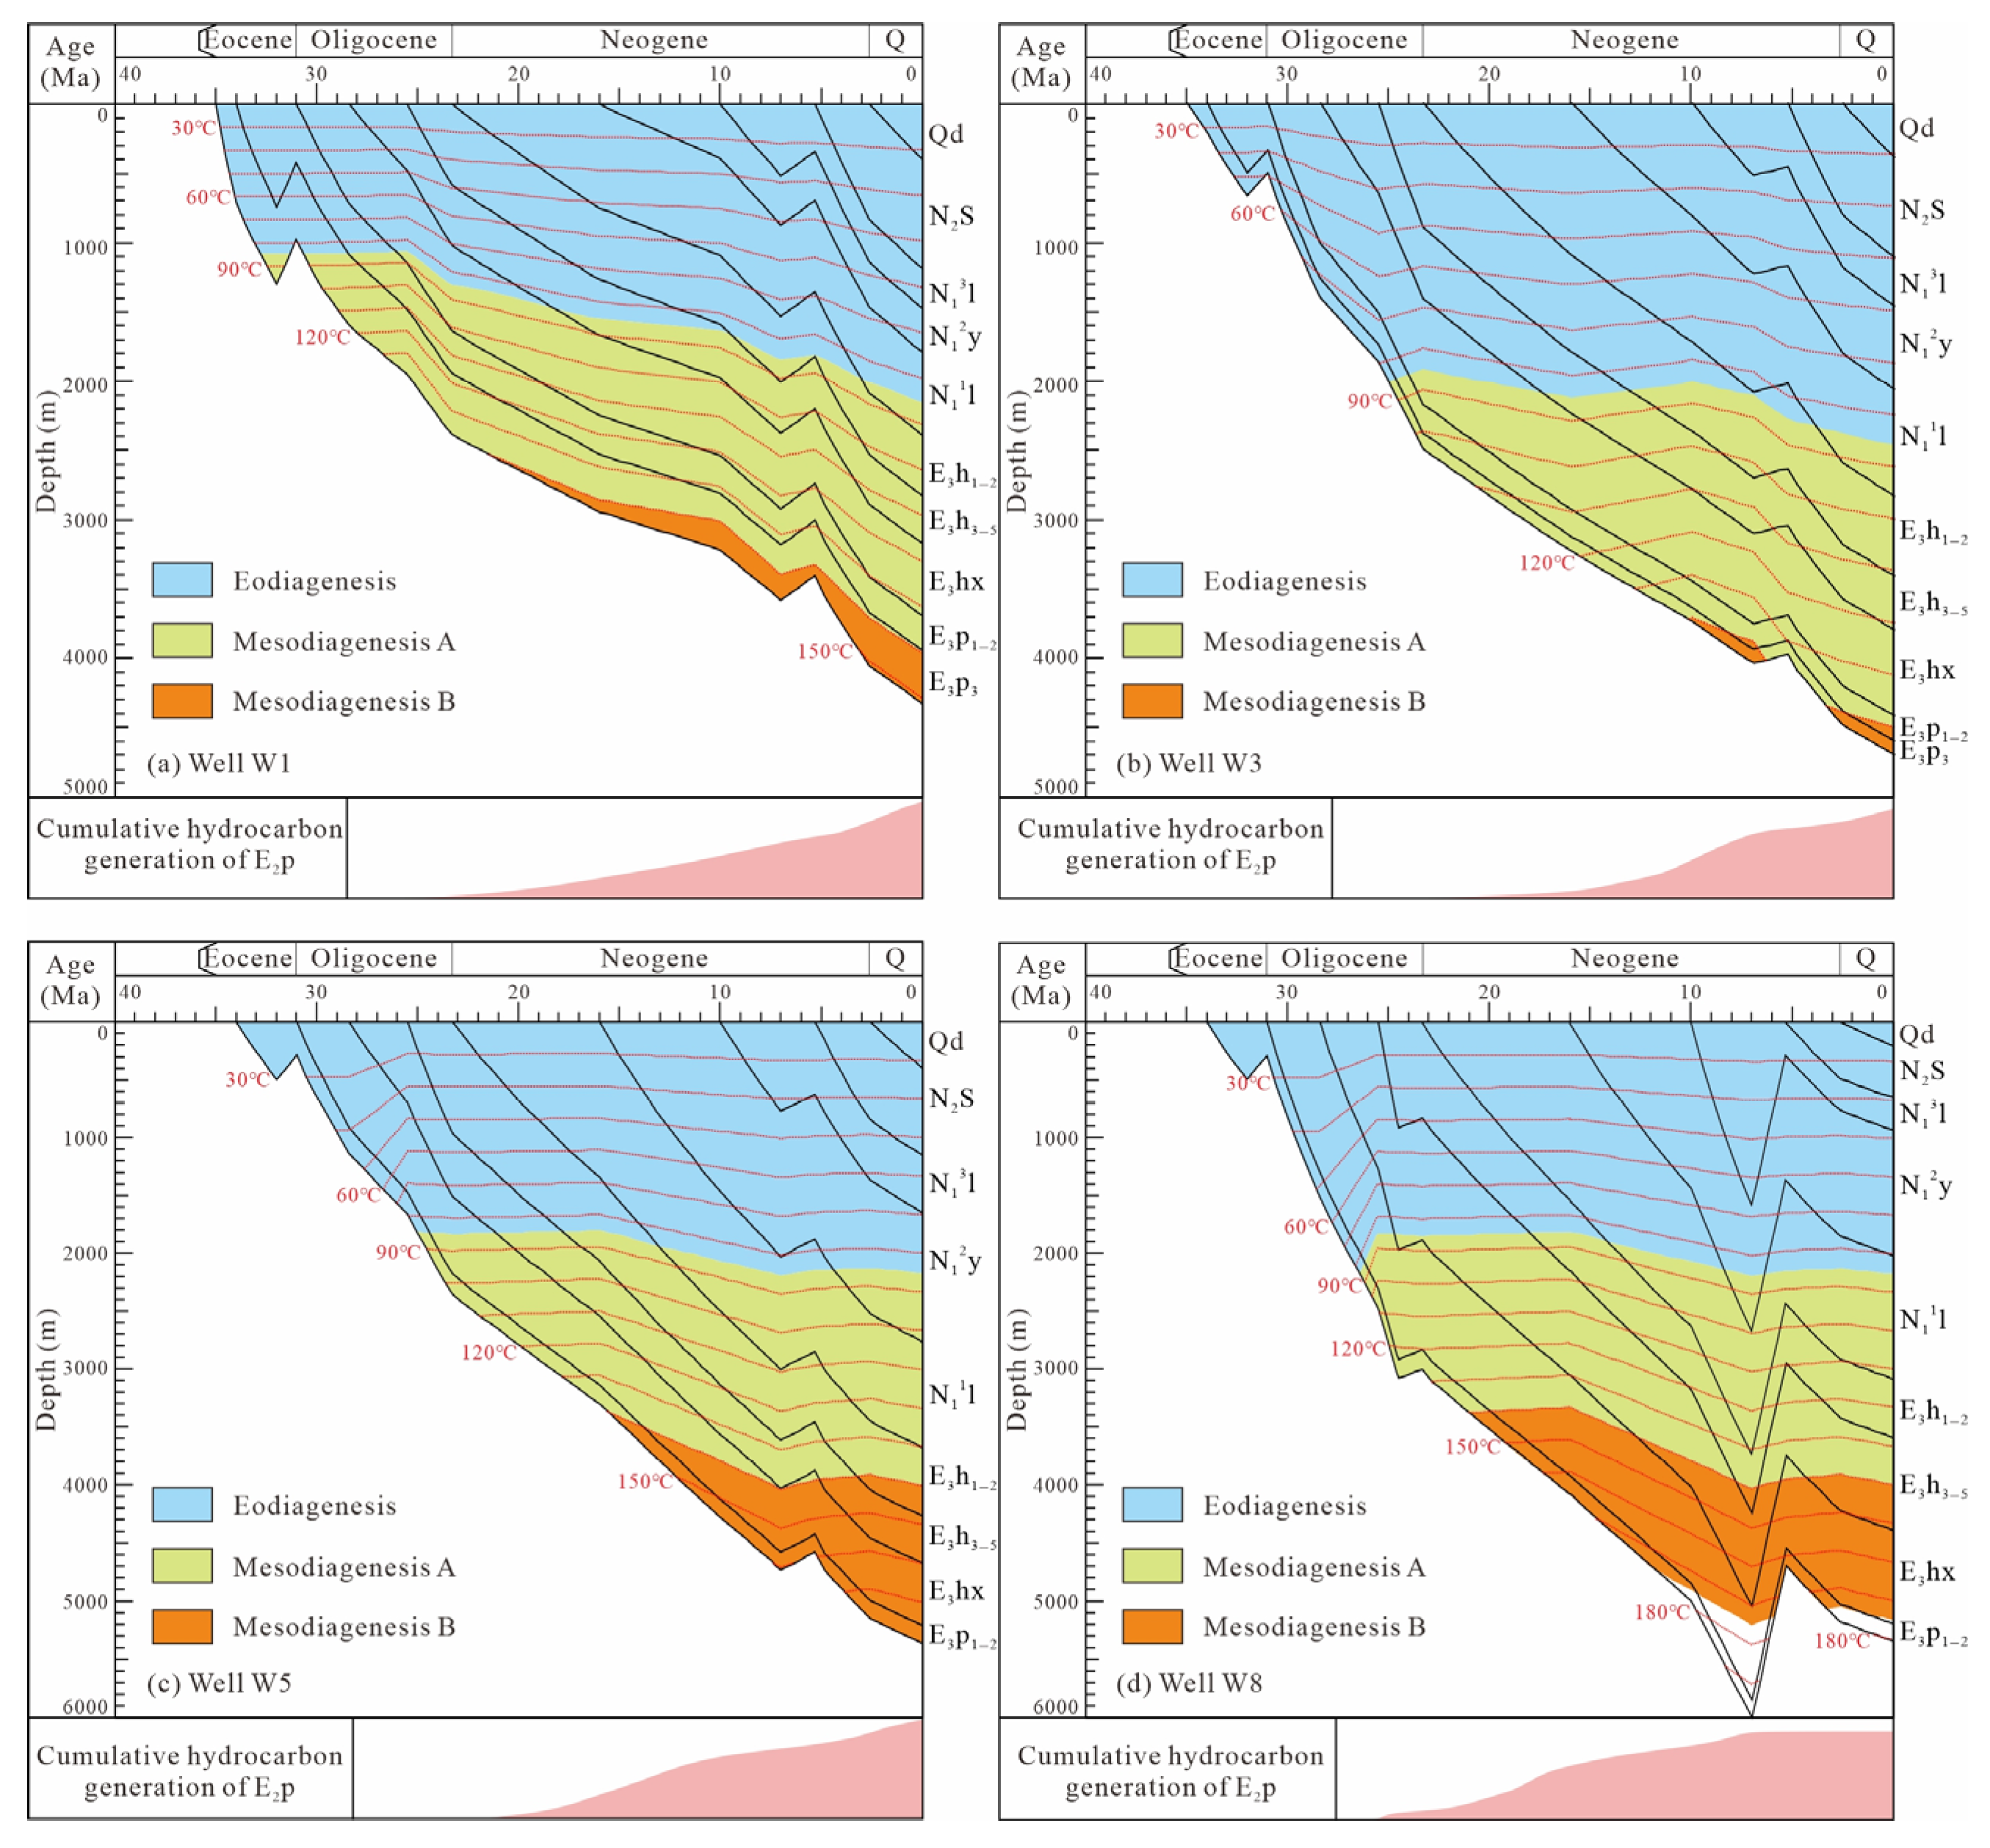

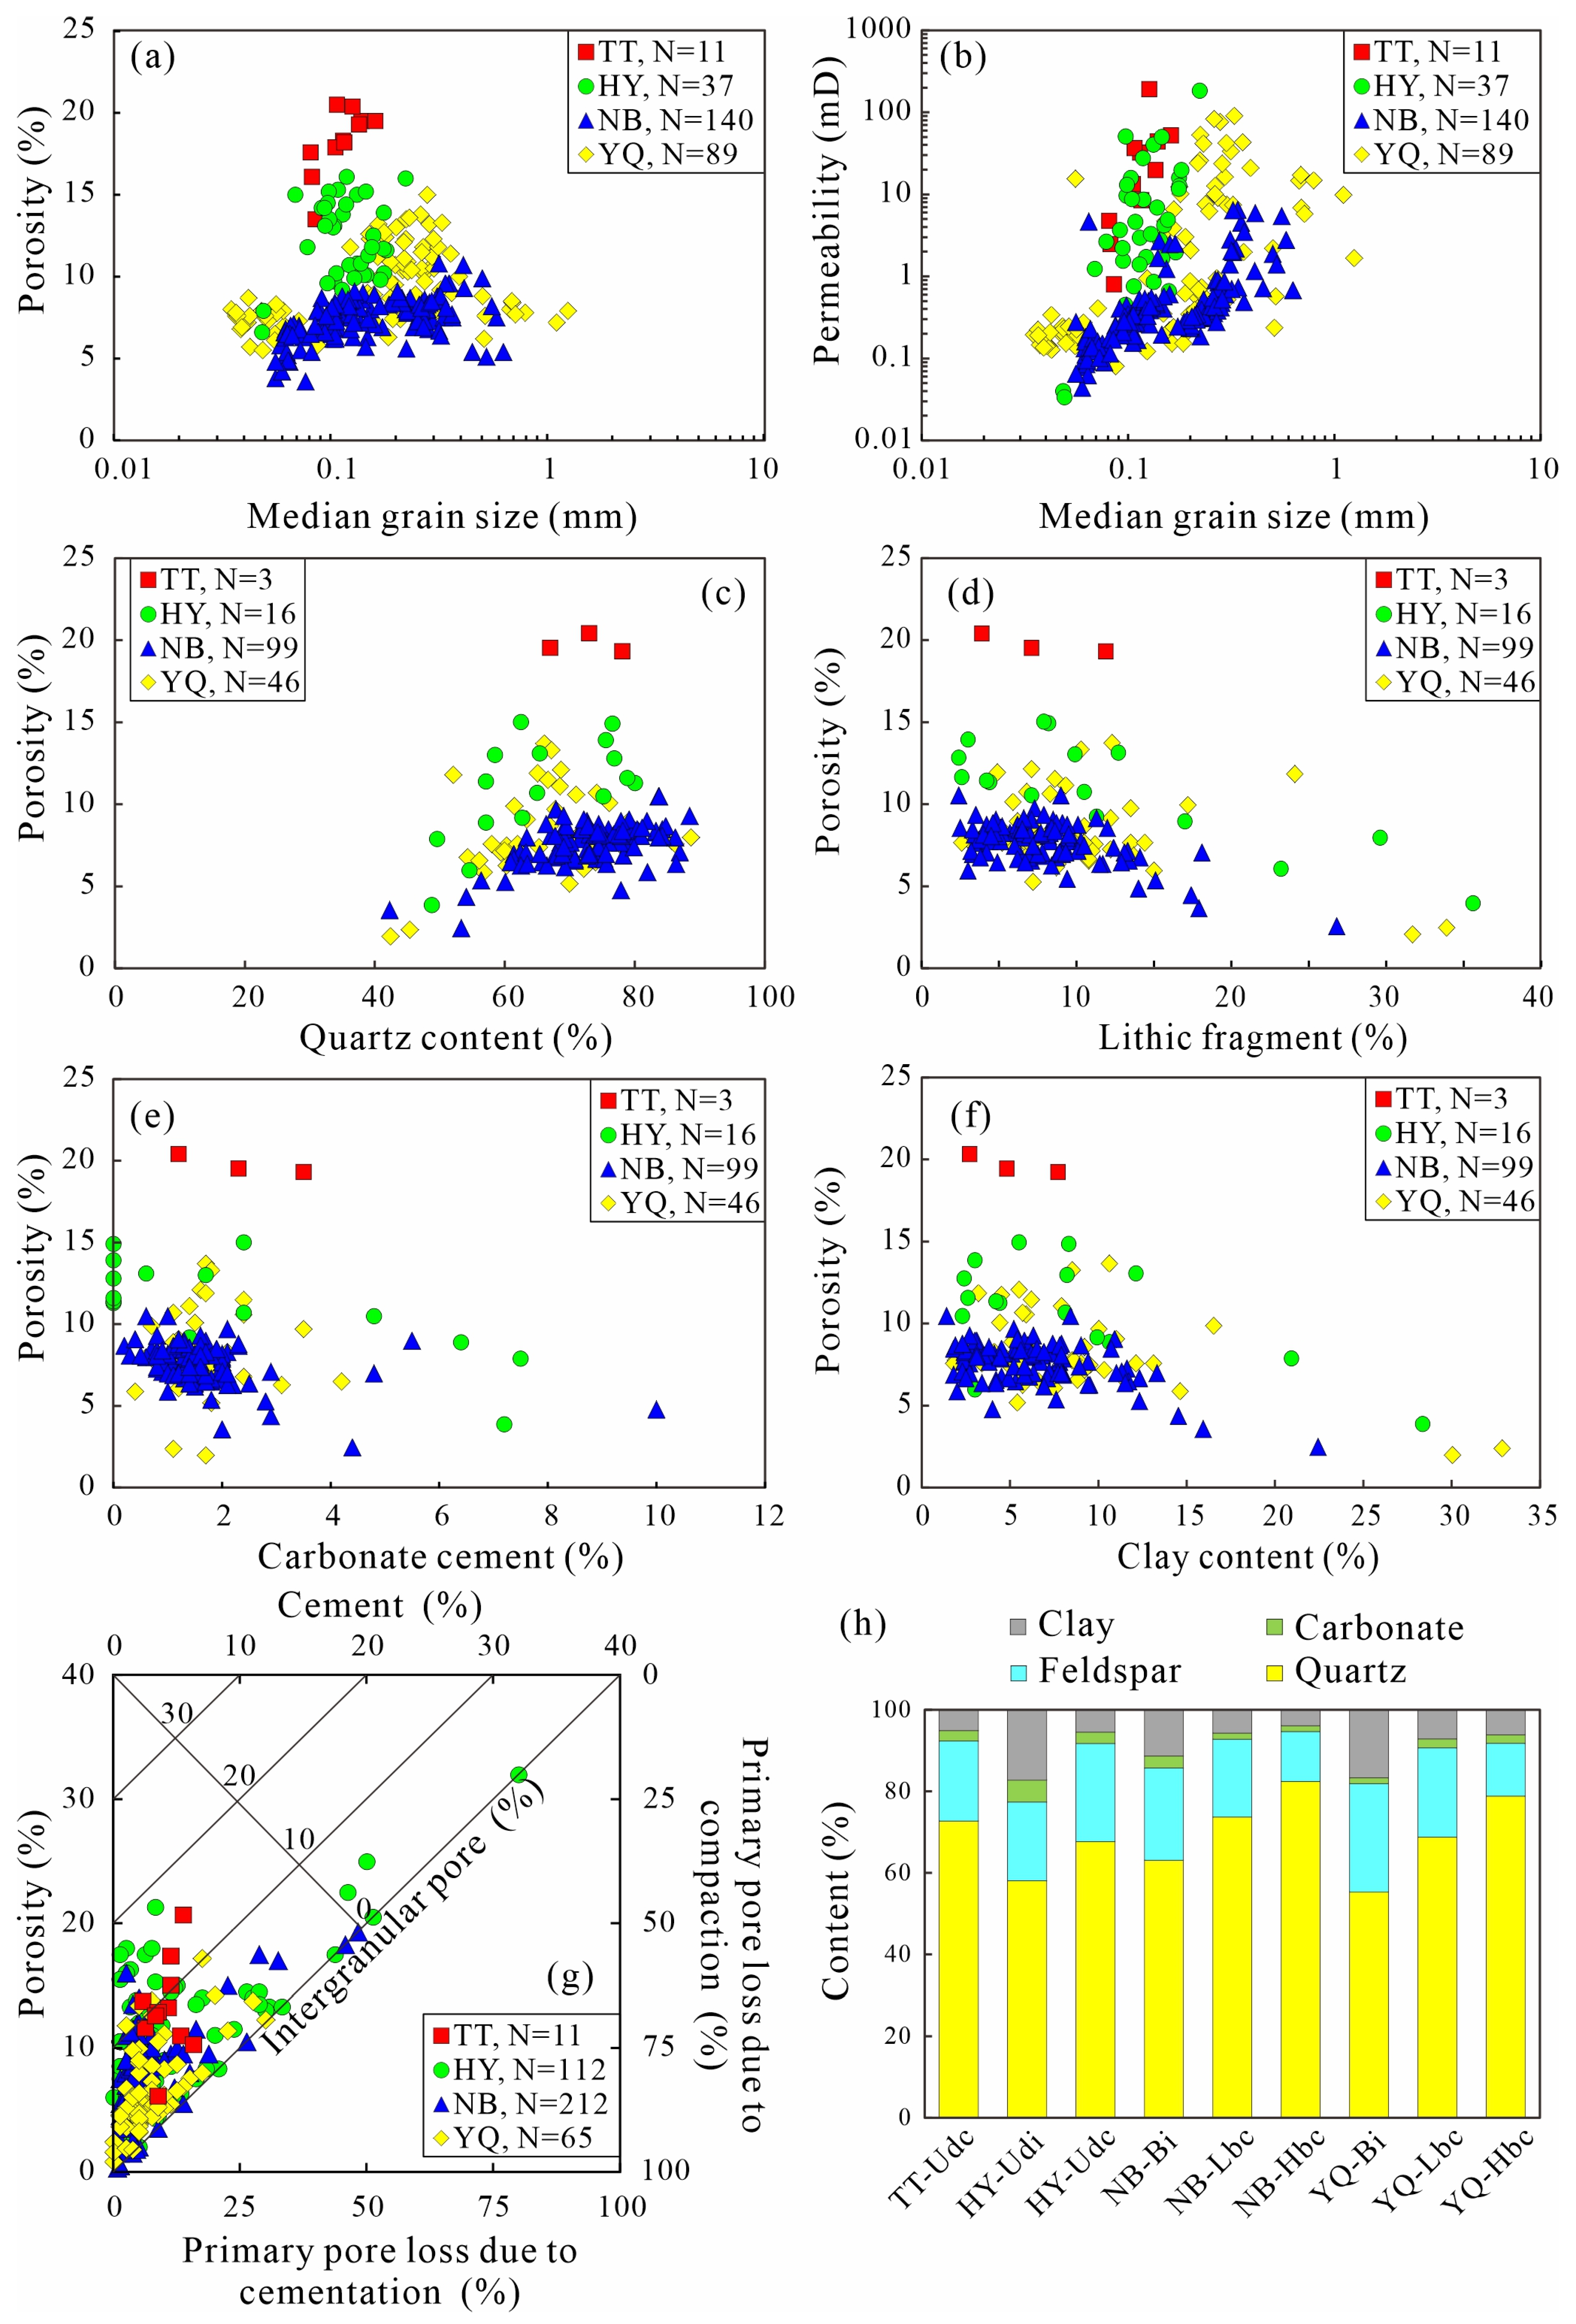


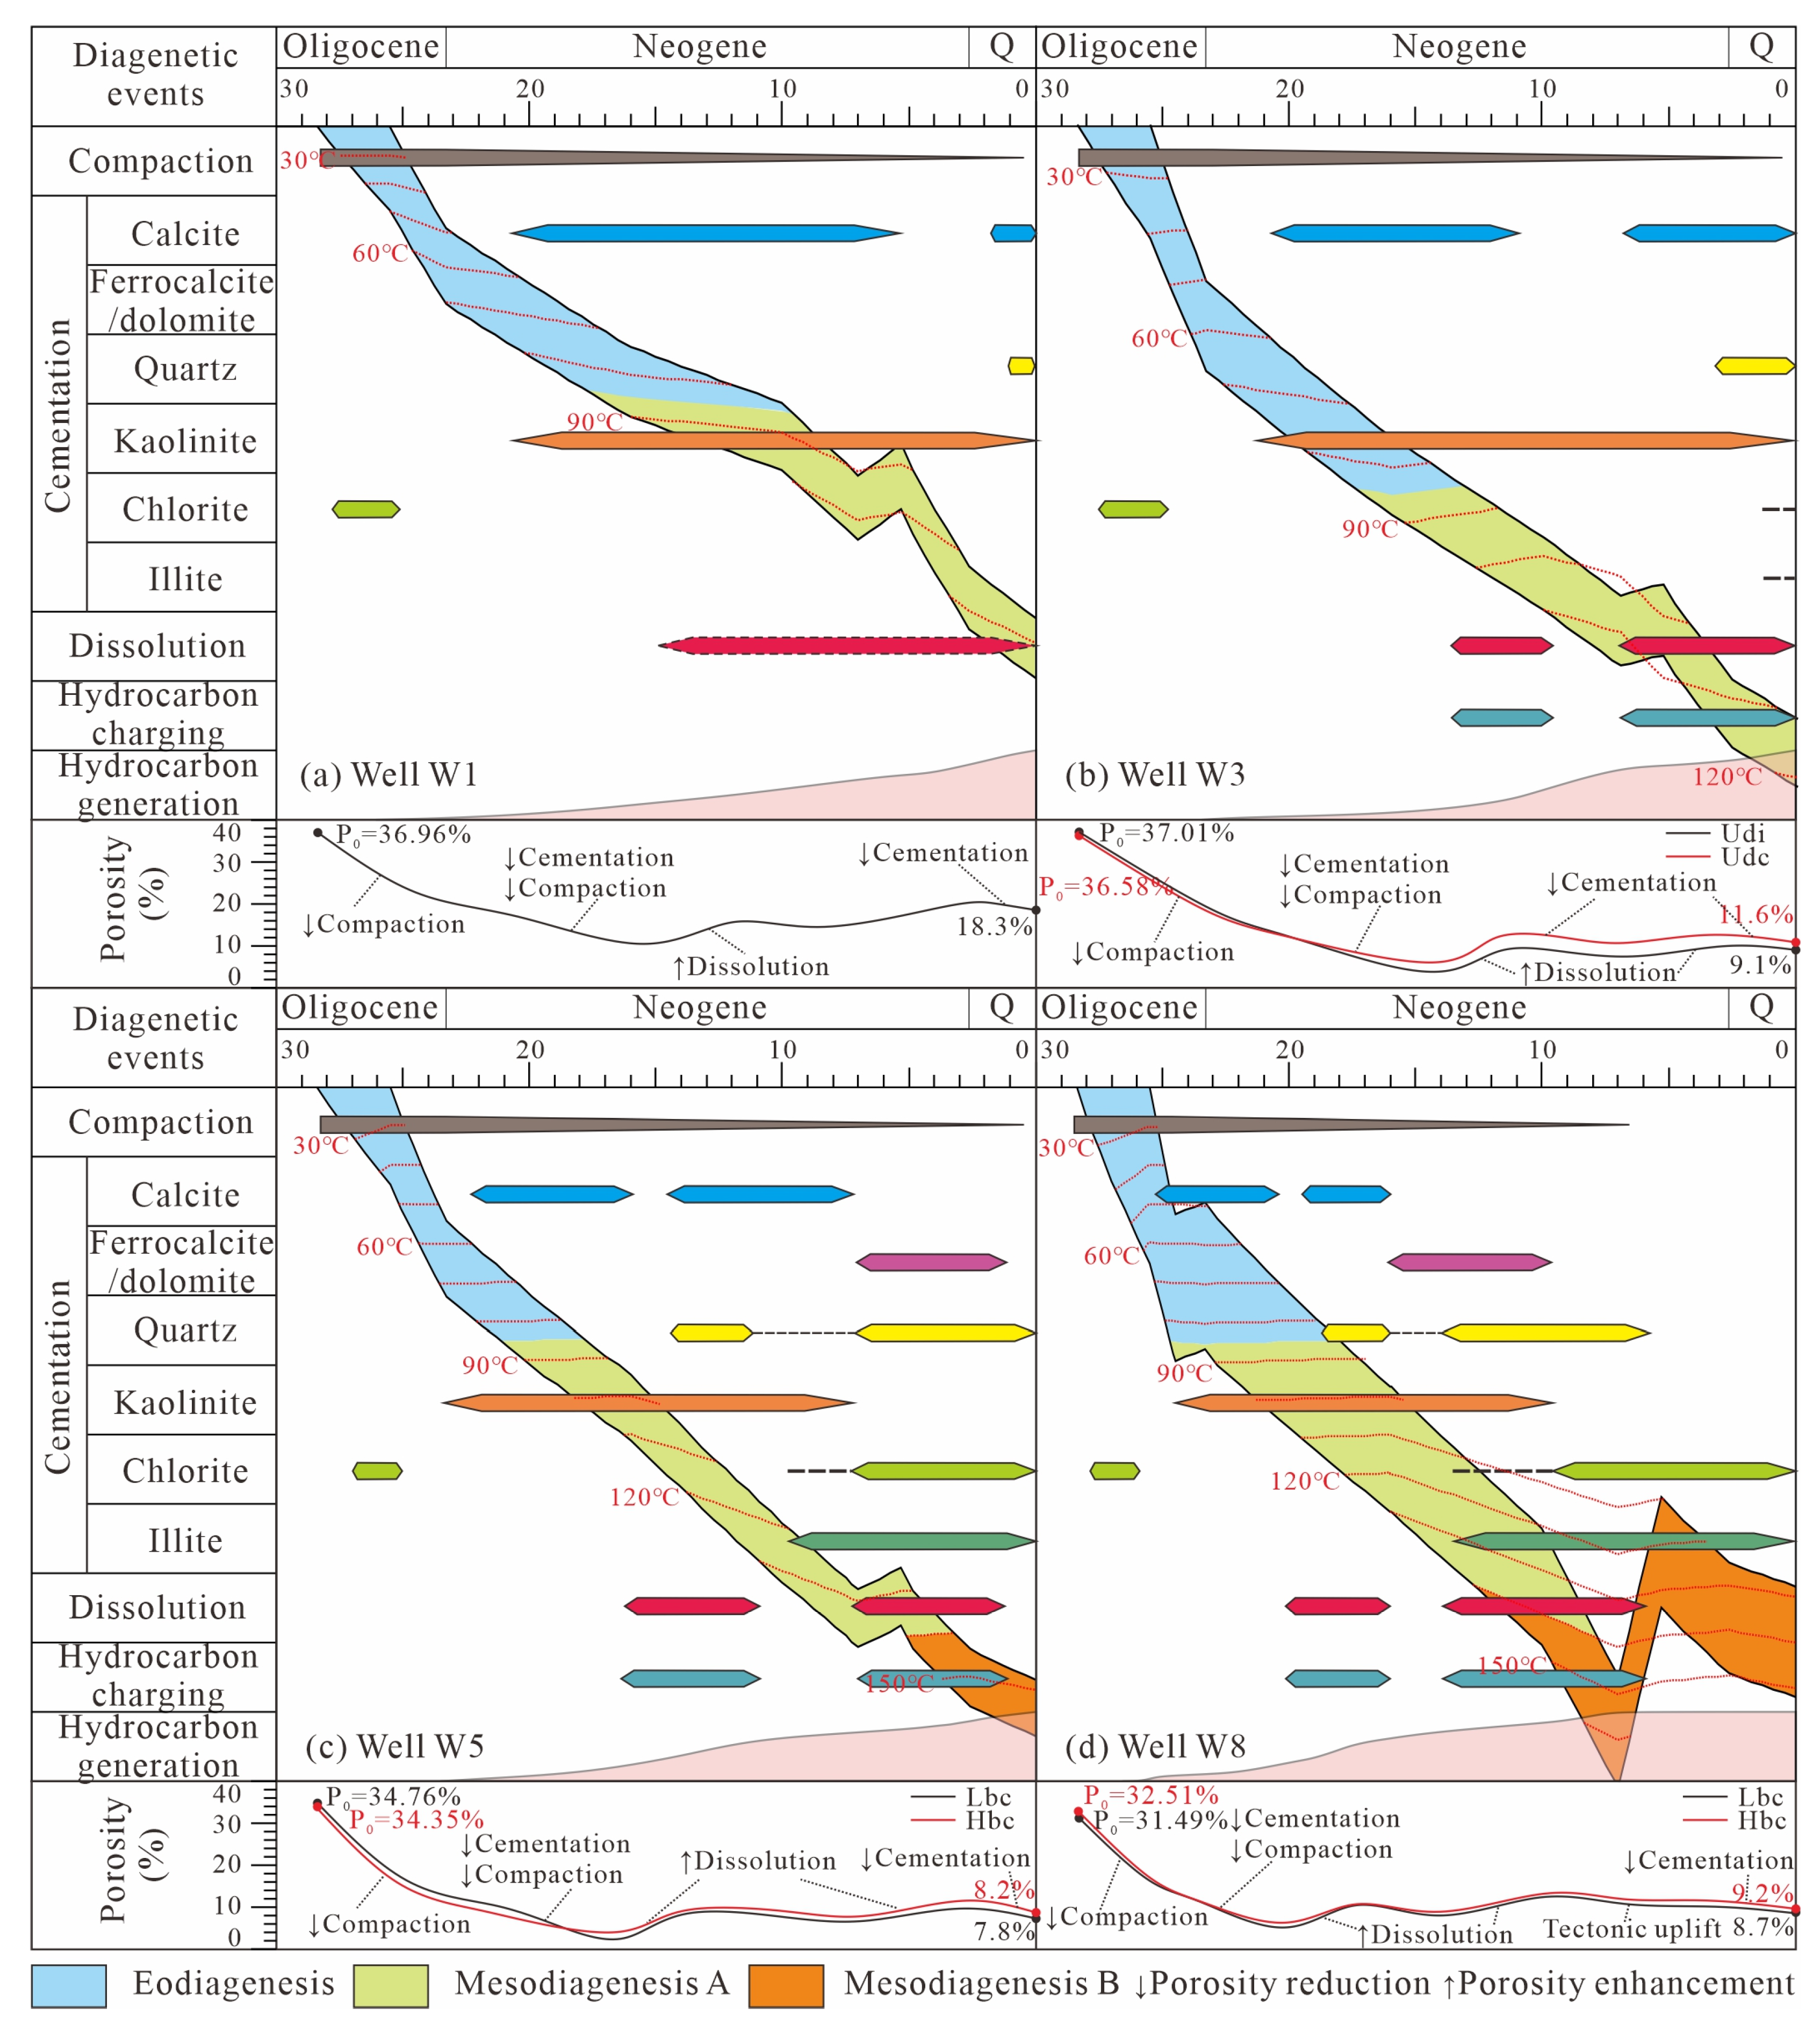
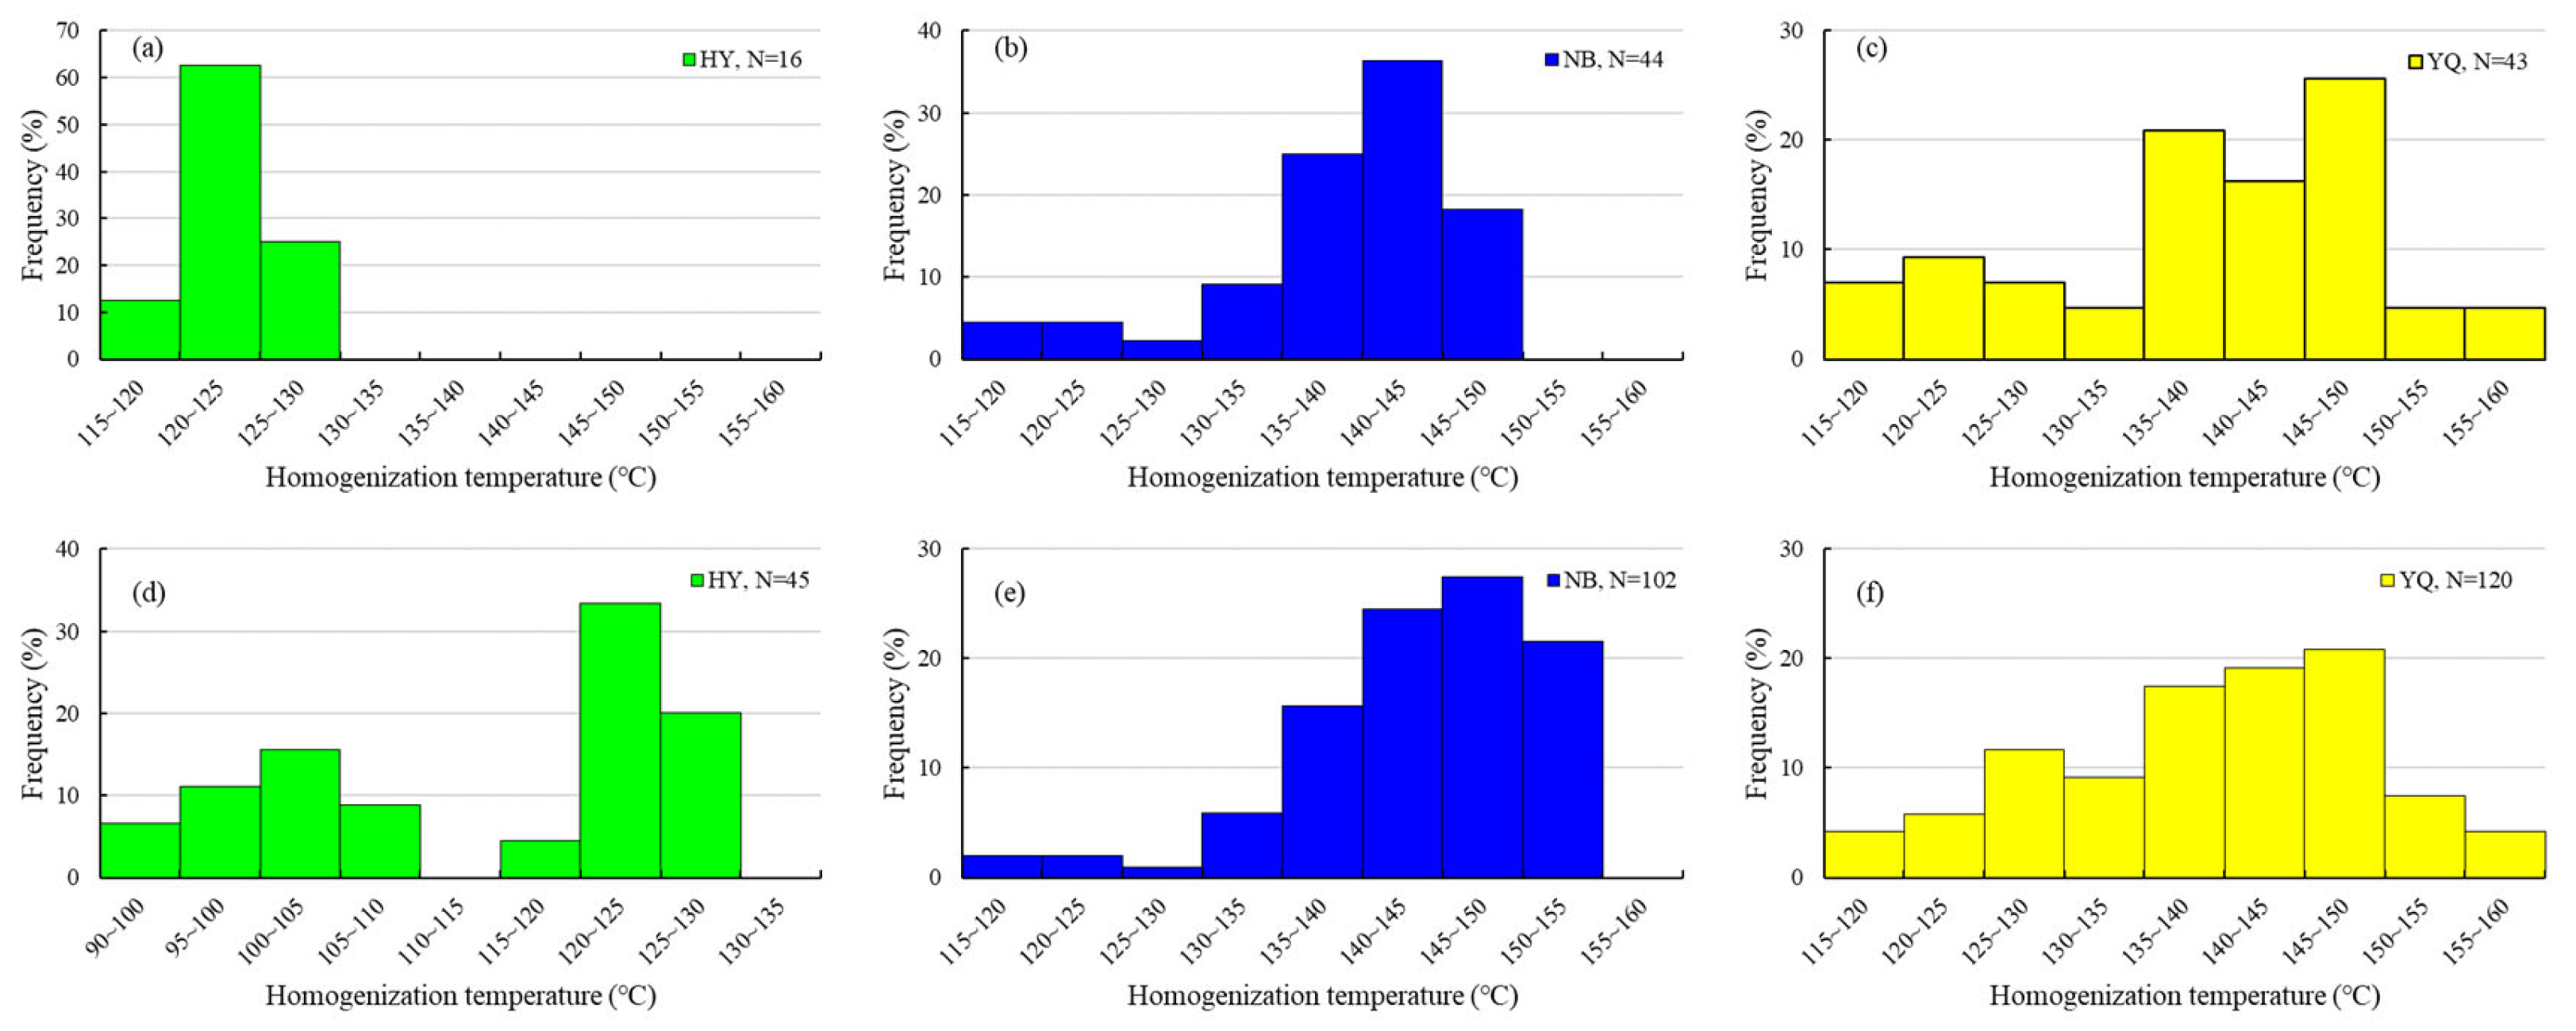
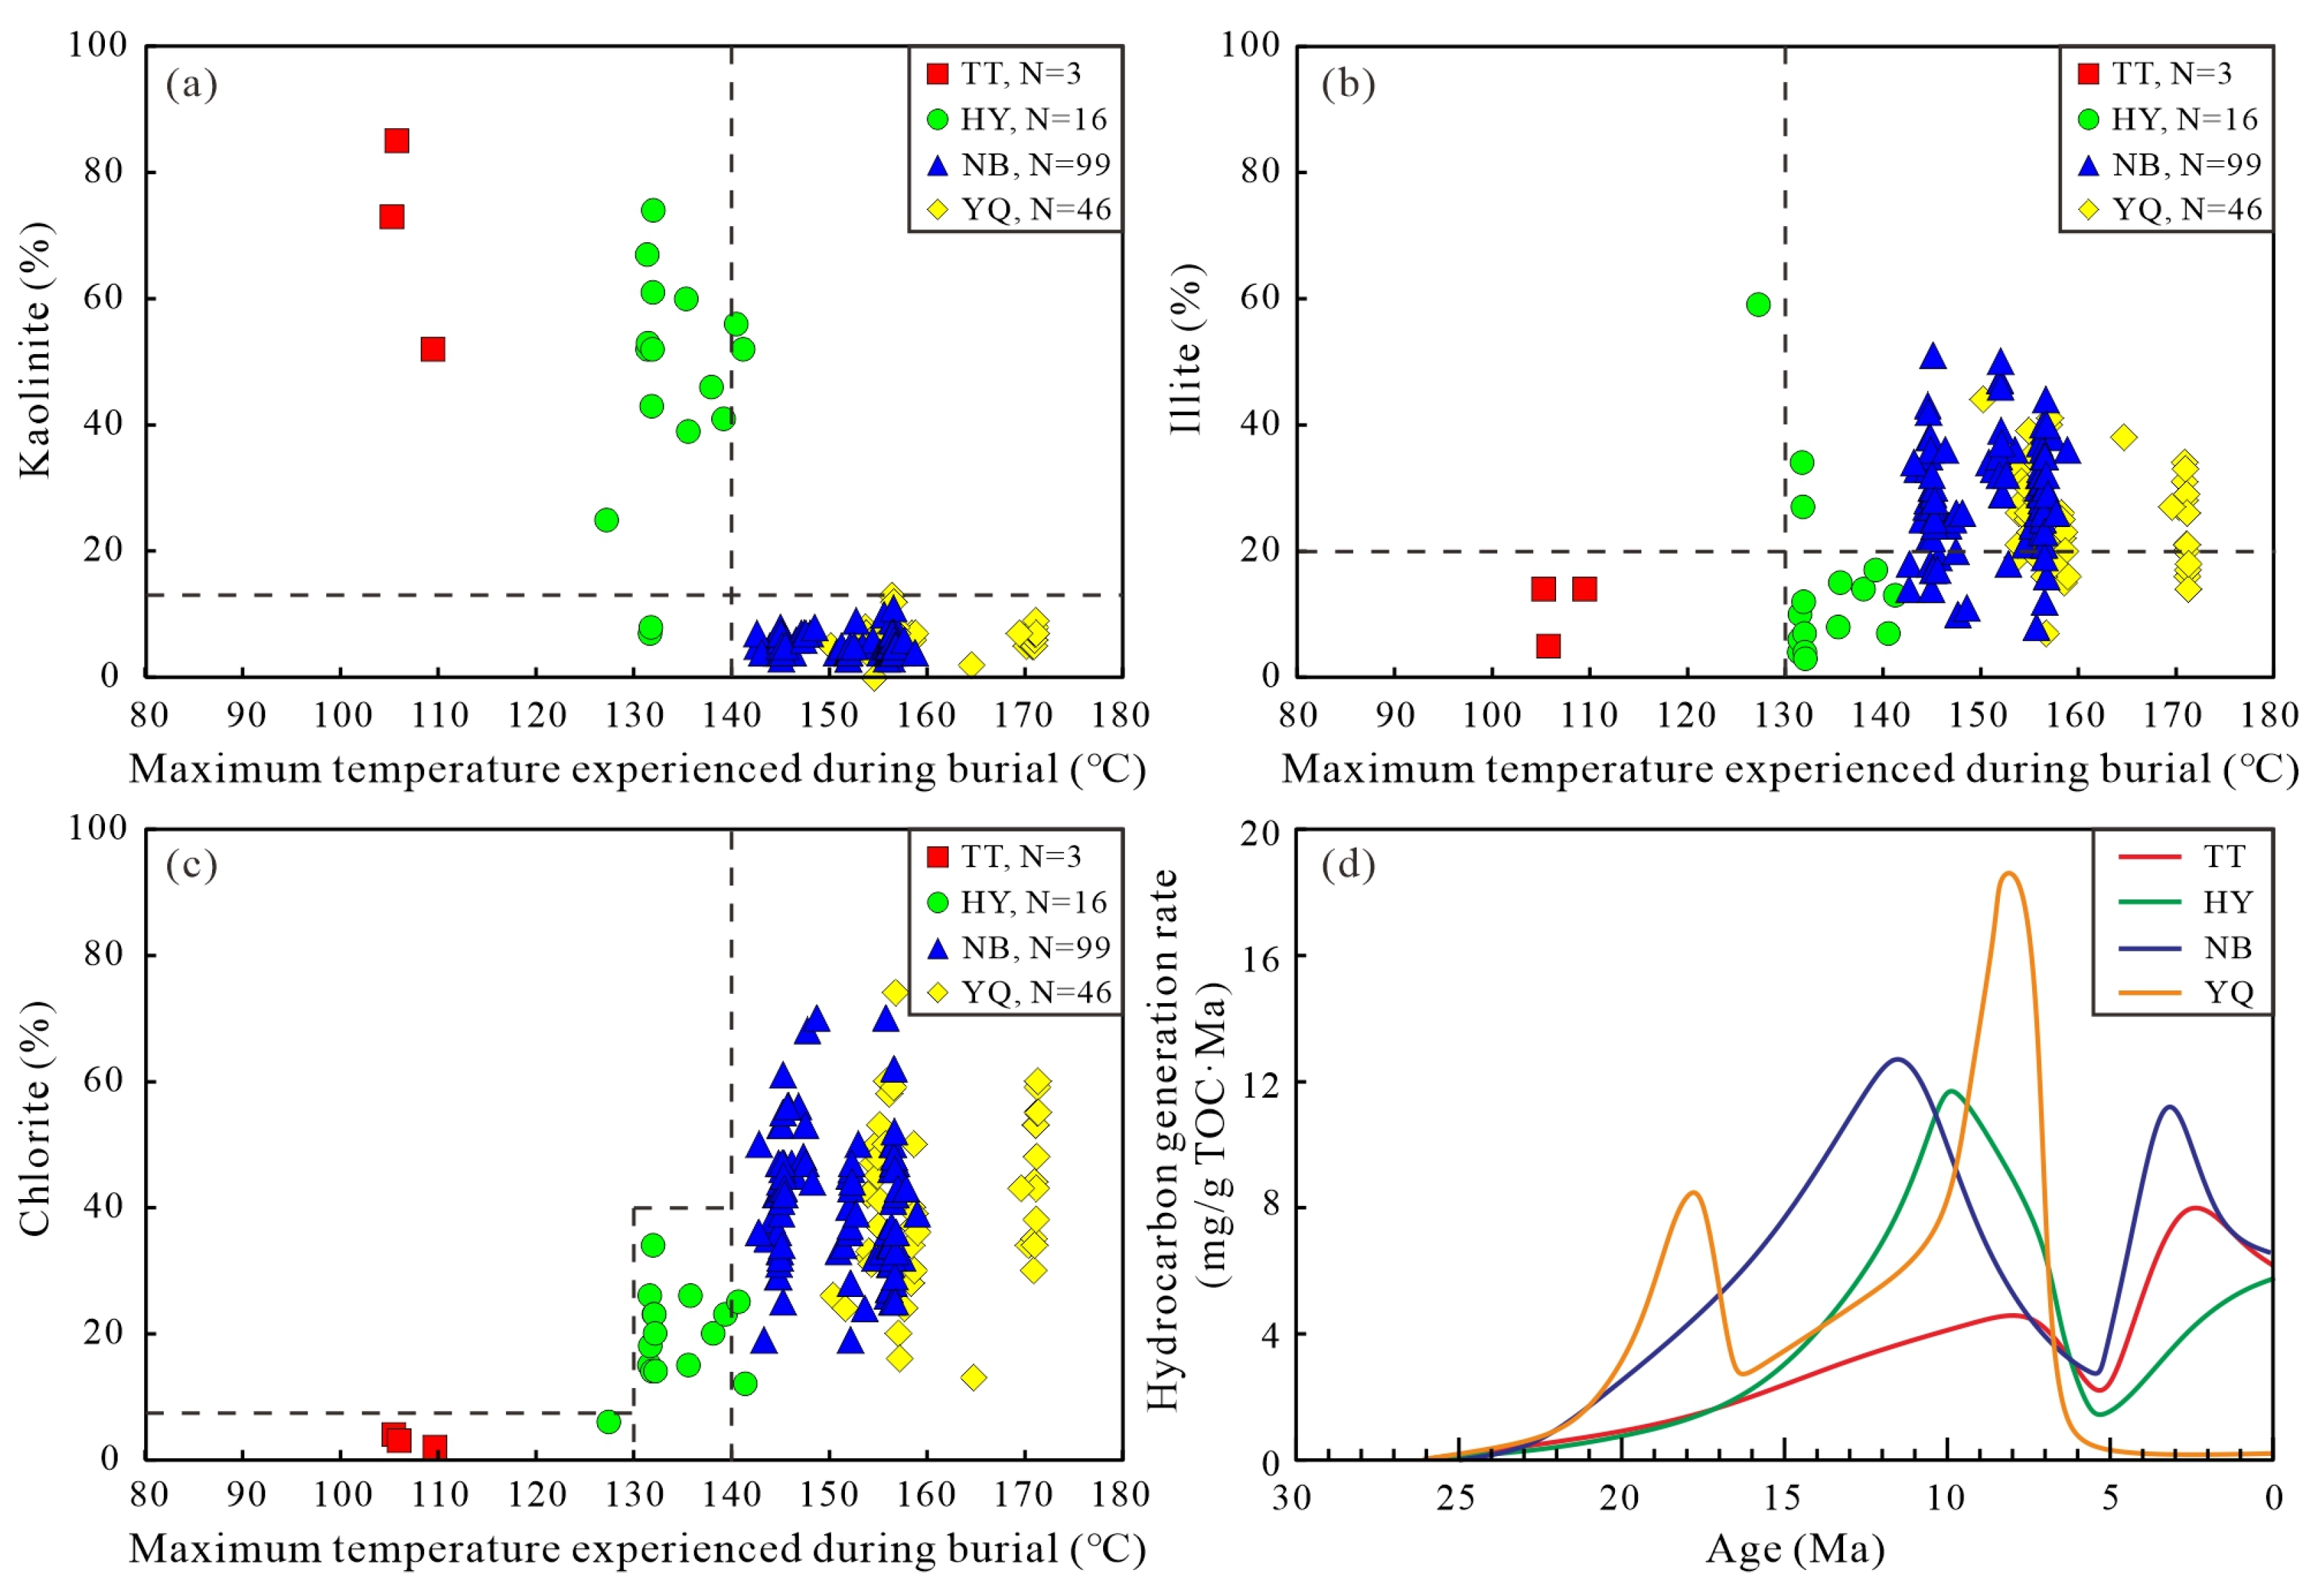
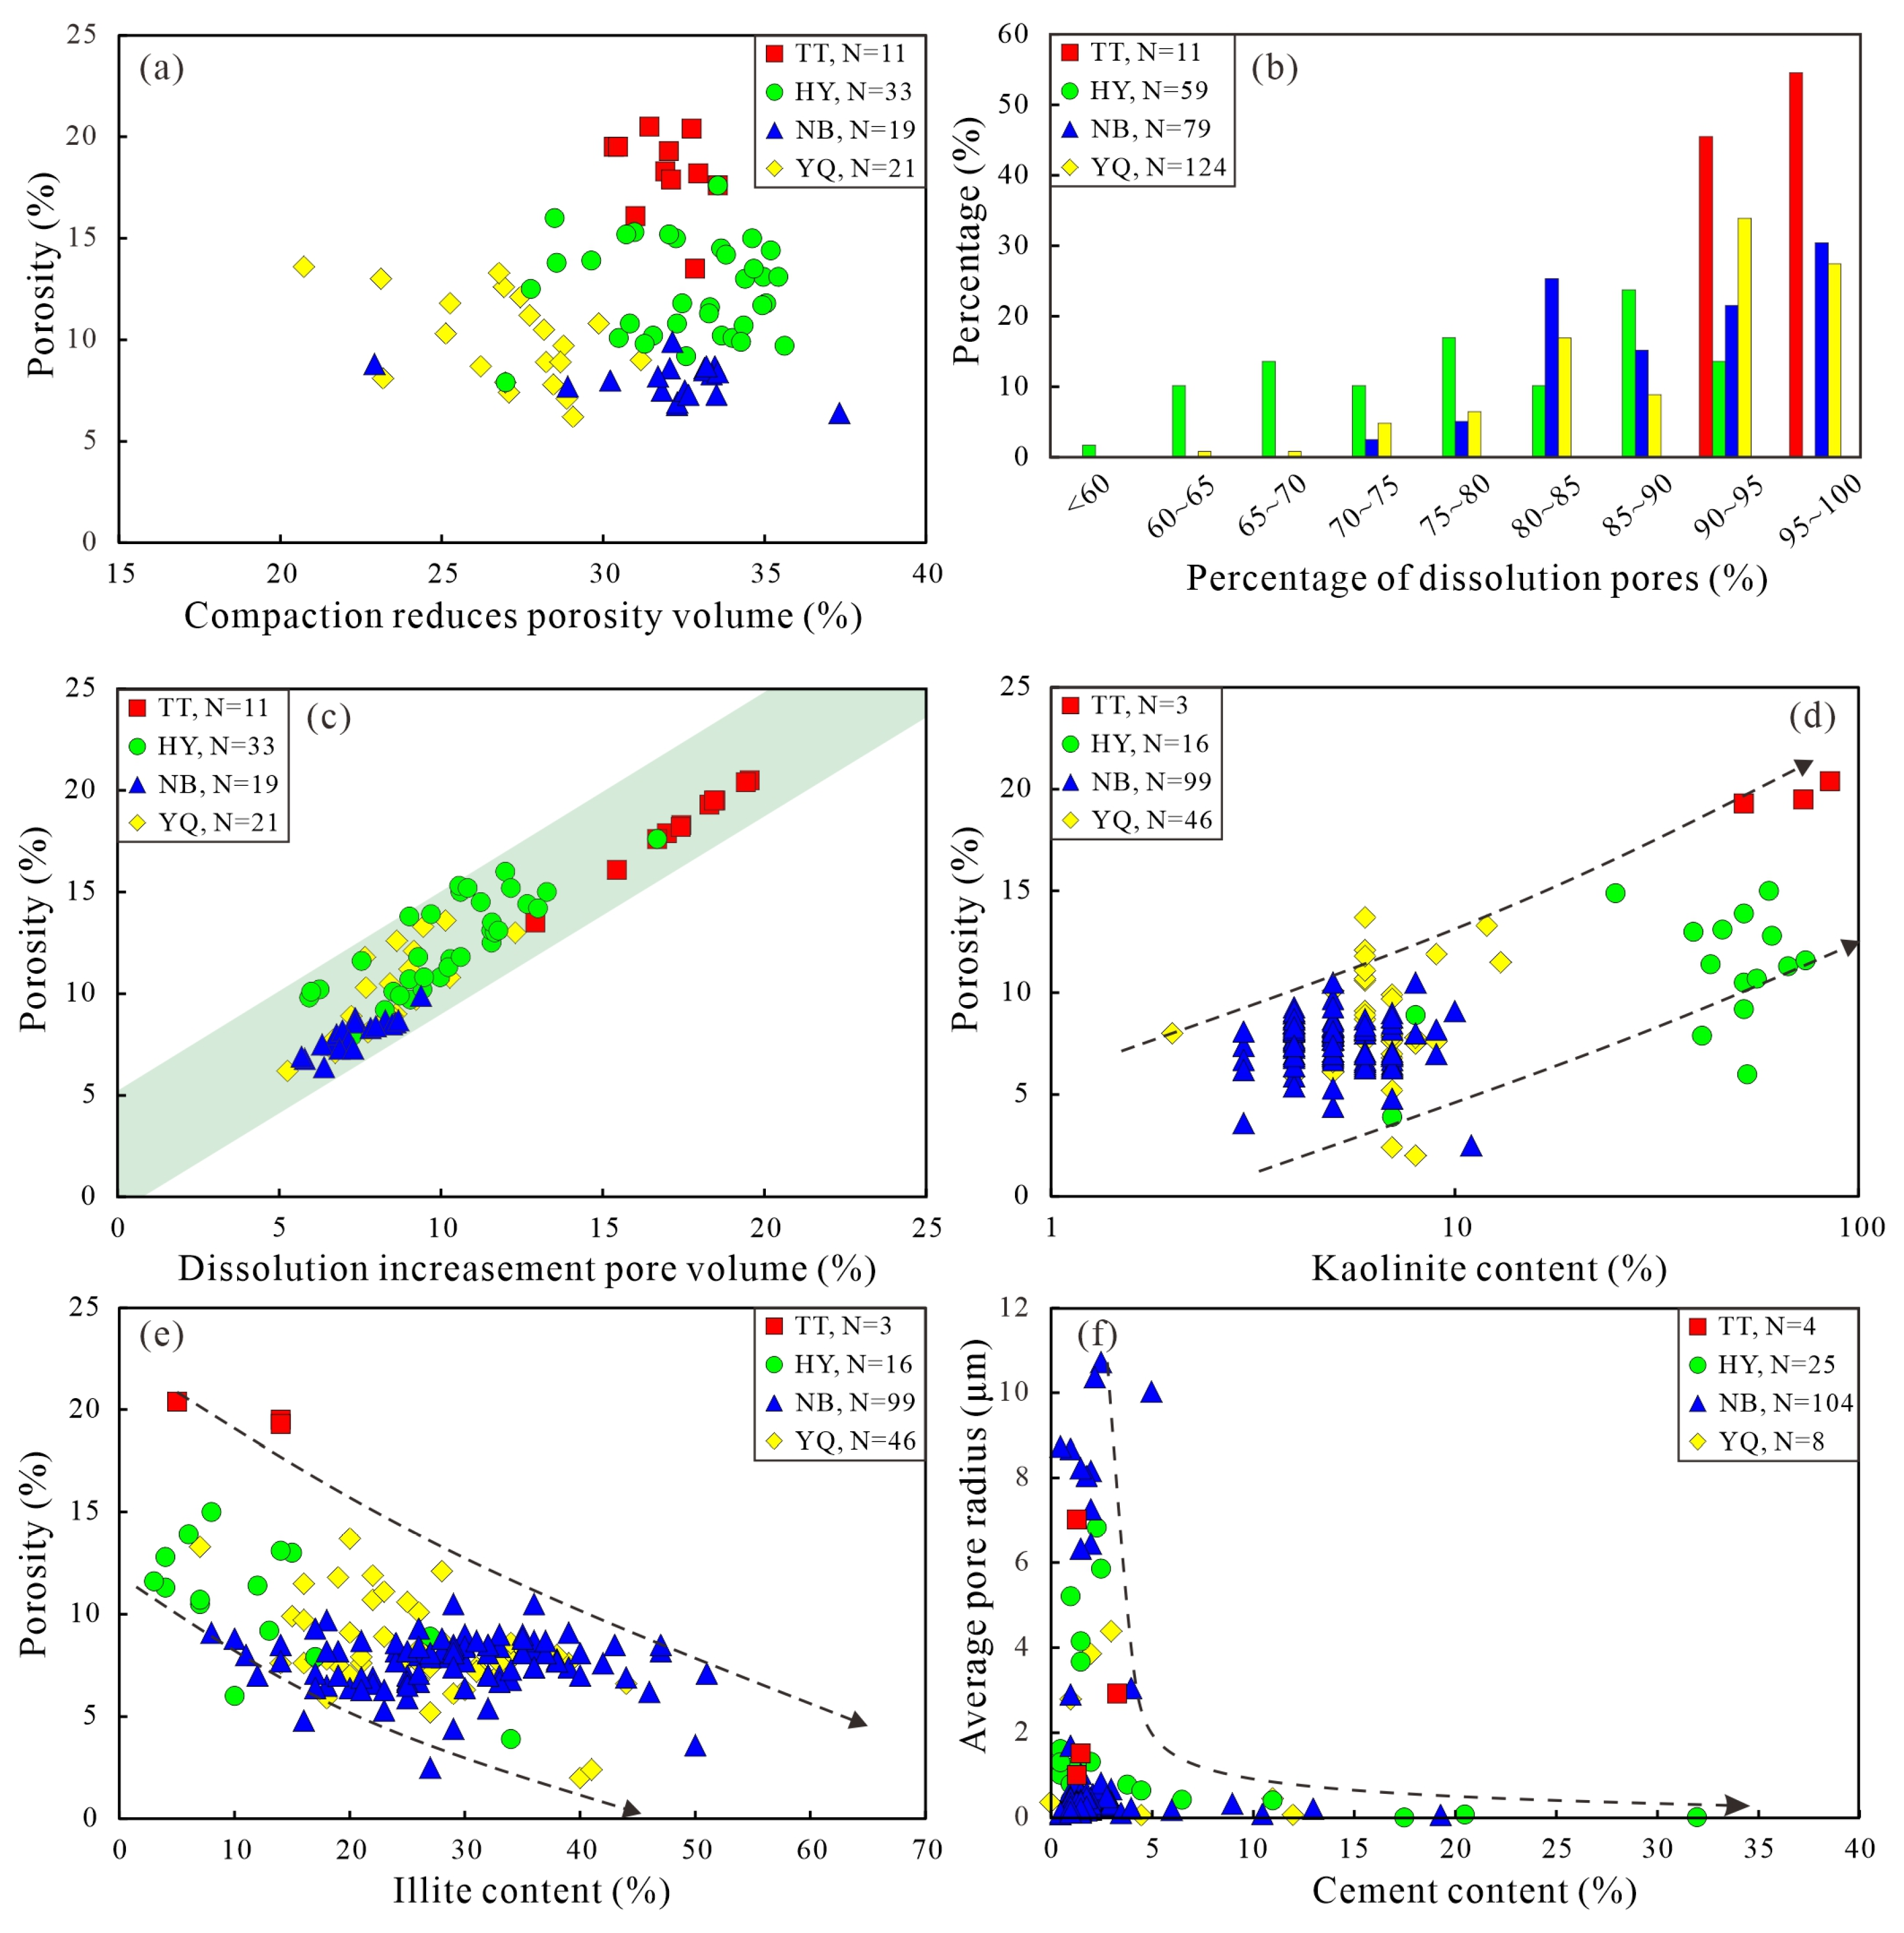
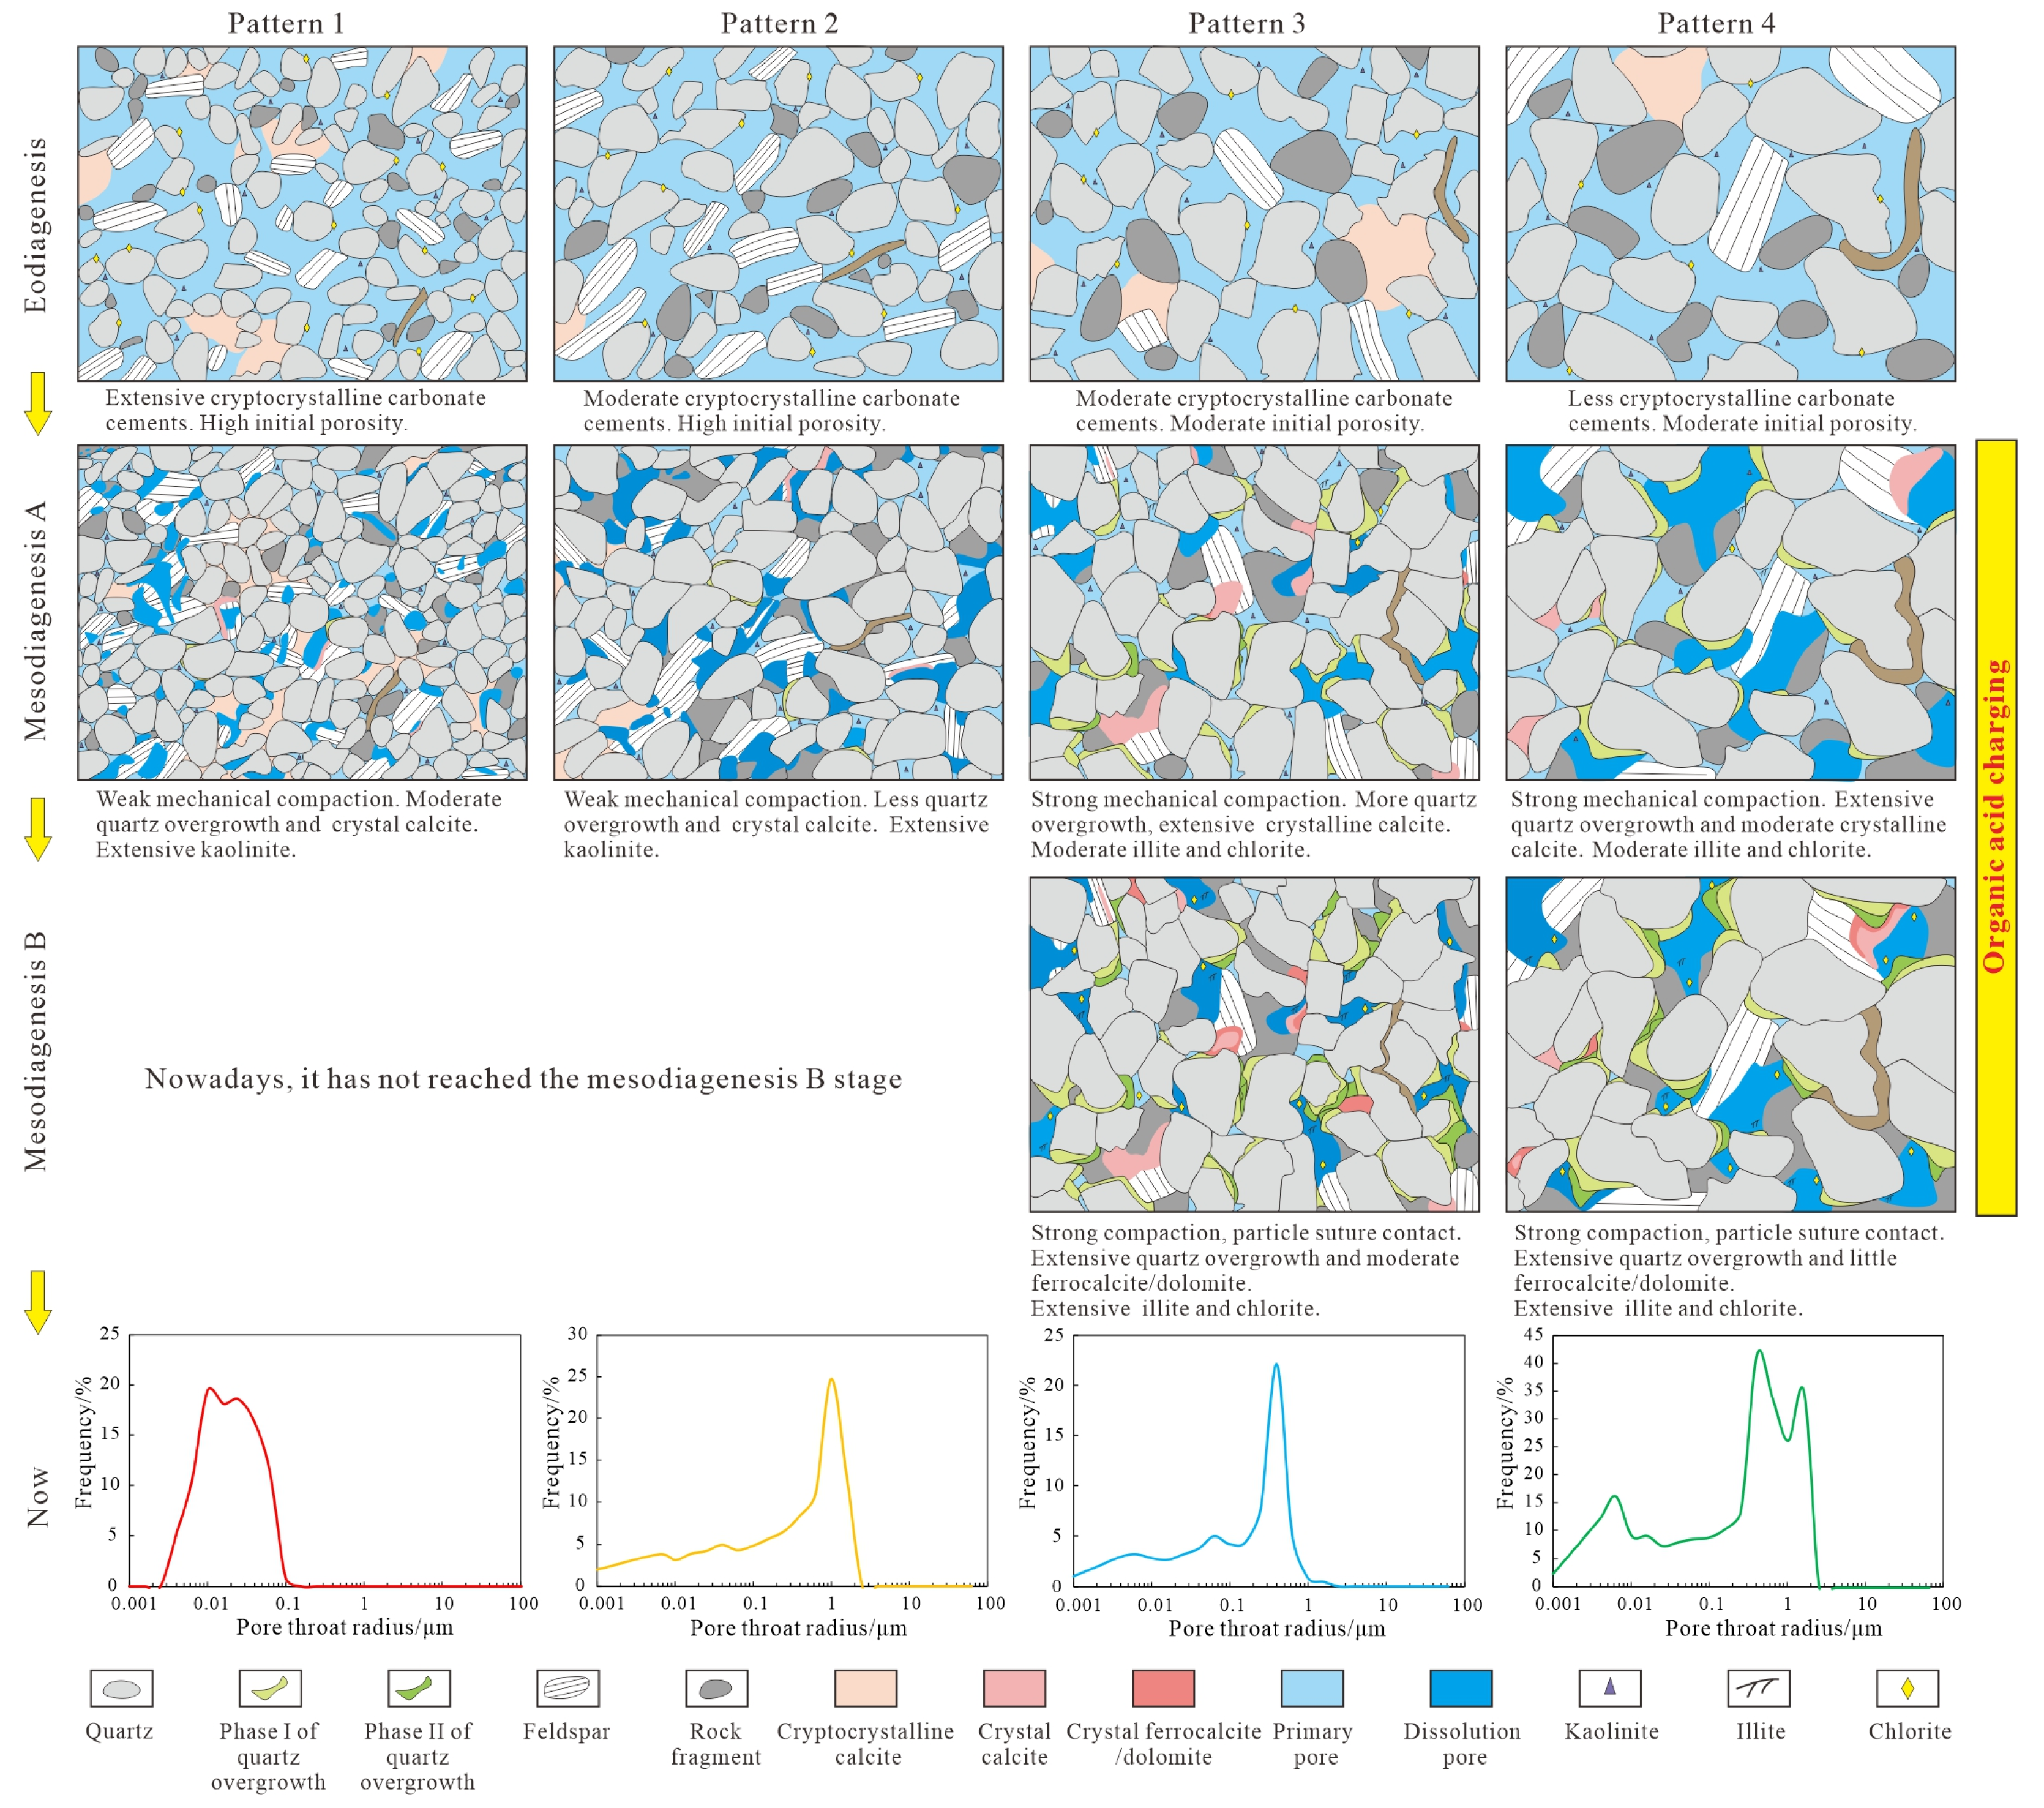
Disclaimer/Publisher’s Note: The statements, opinions and data contained in all publications are solely those of the individual author(s) and contributor(s) and not of MDPI and/or the editor(s). MDPI and/or the editor(s) disclaim responsibility for any injury to people or property resulting from any ideas, methods, instructions or products referred to in the content. |
© 2025 by the authors. Licensee MDPI, Basel, Switzerland. This article is an open access article distributed under the terms and conditions of the Creative Commons Attribution (CC BY) license (https://creativecommons.org/licenses/by/4.0/).