Article

Sensitivity Analysis of Simulation Parameters to Evaluate the Coarse-Grain DEM for Liner Wear Prediction

1
Shaoxing Special Equipment Testing Institute, Shaoxing 312071, China
2
Shaoxing Key Laboratory of Special Equipment Intelligent Testing and Evaluation, Shaoxing 312071, China
3
Institute of Process Equipment and Control Engineering, College of Mechanical Engineering, Zhejiang University of Technology, Hangzhou 310032, China
*
Author to whom correspondence should be addressed.
Minerals 2025, 15(3), 305; https://doi.org/10.3390/min15030305
Submission received: 1 February 2025 / Revised: 25 February 2025 / Accepted: 26 February 2025 / Published: 16 March 2025
(This article belongs to the Section Mineral Processing and Extractive Metallurgy)

Abstract

:
The coarse-grain discrete element method (DEM) has emerged as an effective approach for investigating large-scale granular flow systems. This study performs a sensitivity analysis to evaluate whether parameter calibration in DEM simulations can adequately predict liner wear patterns in tumbling mills. The findings emphasize the critical importance of selecting appropriate sliding friction coefficients fs (optimized as 0.10 in this investigation) for accurate quantitative prediction of total liner wear rates. In contrast, the restitution coefficient e demonstrated negligible influence within the current modeling framework. However, several discrepancies were noted: the model systematically underestimated peak transient wear rates while overestimating wear rates in inter-lifter regions of the mill liners. These discrepancies primarily stem from variations in sliding intensity induced by the coarse-grain methodology.

Graphical Abstract

1. Introduction

Tumbling mills, as quintessential comminution devices, play a critical role in numerous industrial processes [1]. with liner wear emerging as a crucial factor influencing their grinding efficiency [2,3]. Numerical simulation has become an indispensable methodology for advancing mineral processing studies [4,5,6] and elucidating fundamental mechanisms underlying liner wear phenomena [7]. The application of Discrete Element Method (DEM) to mill simulations traces back to Mishra and Rajamani’s seminal 1992 investigation of particle dynamics in ball mills [8]. Subsequently, Cleary established foundational contributions through DEM-based analyses of charge motion [4,9,10,11], power consumption [11,12,13,14], and liner wear patterns [4,10,13]. Over the past two decades, researchers have focused on developing sophisticated DEM models to address three key aspects: granular flow dynamics during grinding operations [15,16,17,18,19], ore particle fragmentation mechanisms [20,21,22,23,24] and predictive frameworks for liner wear evolution [16,25,26,27]. Building upon these foundations, recent advancements continue to enhance the fidelity of DEM simulations in capturing complex mill behaviors.
The Discrete Element Method (DEM) provides precise tracking of individual particle kinematics, yet this particle-scale resolution imposes significant computational demands for industrial-scale simulations [2,28], making such analyses impractical for standard computing systems within reasonable timeframes [29]. This computational challenge has driven substantial interest in continuum-based modeling strategies. Among these, the Two-Fluid Method (TFM) [30] employs Navier-Stokes formulations to describe particulate flows, establishing itself as a fundamental approach in granular mechanics research [31,32]. Concurrently, scaled Lagrangian methodologies have emerged as viable alternatives for computational efficiency enhancement. A paradigm-shifting development occurred in 2009 with Sakai and Koshizuka’s introduction of the coarse-grain model [33], which utilizes strategically enlarged surrogate particles to represent clusters of original particles while preserving essential system dynamics. In numerical simulations of particulate systems, it is generally necessary to employ a dense configuration of particles to ensure the validity and reliability of computational results. However, this approach substantially increases computational time and resource consumption, thereby adversely affecting overall computational efficiency. In contrast, coarse-grain methodologies can effectively reduce the quantity of particles and interaction pairs within the system while maintaining the representativeness of simulation outcomes. Through appropriate adjustment of the time step size, these methods achieve significant enhancement in simulation efficiency without compromising result accuracy. Up to now, the model has been developed and adopted to simulate various particle systems, such as the gas-solid flow in the pneumatic conveying tube [33]; fluidized beds [34,35,36,37,38]; spouted beds [39]; and dense medium cyclone [40,41]; as well as cohesive solids [42,43], the wet mono-size particle flow [44], and the granular flow in a double-screw conical mixer [45]. Recent innovations include multi-level coarse-grain (MLCG) techniques [46] that strategically combine coarse-grain and original-scale DEM domains to preserve critical local particle interactions while maintaining computational efficiency.
In order to evaluate the coarse-grain DEM, a parameter sensitivity analysis was conducted to answer the question of whether or not the coarse-grain level wear model can be calibrated for predicting the liner wear using appropriate parameters. Specifically, parameter sensitivity analysis is a common method for developing DEM [47]. with artificial parameter determination through multi-level studies representing an accepted paradigm for optimizing numerical methods [48]. The coarse-grain wear model utilized in this study builds upon the validated particle-scale Shear Impact Energy Model (SIEM) developed in prior research [7], incorporating modifications to eliminate spring stiffness effects through contact point adjustment as detailed in previous methodology by Zhao et al. [49]. This foundation allows the current investigation to specifically examine the relative influences of restitution and friction coefficients on prediction accuracy within the coarse-grain framework. The study ultimately aims to establish an engineering-viable methodology for liner wear prediction through comprehensive contact parameter sensitivity analysis.

2. Mathematical Model and Numerical Method

2.1. Model of Particles

Using DEM, the particle motion is calculated by Newton’s second law. Specifically, for a particle i with mass mi, the forces exerted on it are the gravity mig and the contact force Fc. Therefore, the acceleration of the particle dvi/dt can be obtained by solving the following equation:
m i d v i d t = m i g + j = 1 n i F c , n , i j + F c , t , i j
where the subscripts n and t denote the normal and tangential component, respectively, ij means that the particle i is in contact with the particle j or wall j. The contact force is given by the Linear Spring-dashpot Model [50]:
F c , n , i j = k n δ n , i j η n v n , i j
F c , t , i j = k t δ t , i j η t v t , i j
where k represents the spring stiffness, η is the damping coefficient, δ is the relative displacement and v is the relative velocity. The methodology for calculating the damping coefficient is referenced in the paper [7].
When the tangential contact force is larger than the sliding friction force (the friction coefficient is fs), i.e.,
F c , t , i j > f s F c , n , i j
the tangential contact force is then given by the following:
F c , t , i j = f s F c , n , i j δ t , i j / δ t , i j
The rotation of the particle i is also given by Newton’s kinetic law. For the particle i, its rotary inertia is Ii, the contact torque exerted on it is Tc,ij, then the angular acceleration dωi/dt is given by the following:
I i d ω i d t = j = 1 n i T c , i j
Because the particles are spherical, the contact torque Tc,ij is only caused by the tangential contact force Fc,t,ij:
T c , i j = F c , t , i j × n r
where n represents the normal unit vector and r denotes the particle radius.

2.2. Wear Model

A coarse-grain level wear model based on SIEM is used in the current work:
W c g = E S h e a r , c g 4.0 l p
where Wcg is the volume removed by the coarse-grain particles, EShear,cg is the shear impact energy exerted on the surface due to the impact of the coarse-grain particles, l is the coarse-grain ratio, p denotes the plastic flow pressure. According to Finnie et al. [51], p is 1–5 times the Vickers hardness for metal. For the liners in the current work, p is verified to be 1.5 times the Vickers hardness of the liner surface [7].

2.3. Solution and Simulation Conditions

All simulations were performed using the DEM. The particle-level simulation results from prior validation studies [7], benchmarked against experimental data from Banisi and Hadizadeh [52]. served as reference standards for the contact parameter sensitivity evaluation. The simulated semi-autogenous grinding (SAG) mill configuration (9.48 × 4.88 m) represents a generic tumbling mill geometry, suggesting potential applicability of the developed coarse-grain methodology to broader mill liner wear predictions. The mill’s cylindrical interior features rail-type liners constructed from cast chrome molybdenum steel. While simulation accuracy is known to depend critically on coarse-grain ratio selection (governing spatial resolution), excessively small ratios remain computationally prohibitive for standard computing systems. To optimize the accuracy-efficiency balance, an empirically determined coarse-grain ratio of l = 3.0 was employed based on established computational guidelines [35].
The study investigated the effects of two contact parameters-restitution coefficient and sliding friction coefficient—on energy dissipation and liner wear prediction. While rolling friction (equivalent to static friction) showed negligible influence on wear outcomes, the original parameter set (eo and fs,o) produced overestimations of particle kinetic energy and liner wear. To address this, reduced parameter values (ecg and fs,cg). were implemented in coarse-grain (CG) simulations. Three restitution coefficient values (1/3 eo, 1/2 eo, eo) were tested to analyze energy dissipation characteristics, as well as three sliding friction coefficients (0.1 fs,o (0.05), 0.2 fs,o (0.10), 0.6 fs,o (0.3)). In addition, three values of fs,cg were used, which are 0.1 fs,o (0.05), 0.2 fs,o (0.10), 0.6 fs,o (0.3) were evaluated to mitigate contact force overprediction (Equation (7)). Table 1 summarizes the parameter combinations across nine CG simulation cases. The time step remained consistent with the benchmark case at 2 × 10⁻⁵ s. Increased particle size in CG models theoretically permits larger critical time steps when maintaining spring stiffness [53]. Therefore, time step independence was systematically validated through additional simulations (Cases 10–13). This verification enabled computational acceleration in subsequent full-size simulations (Case 14). The full-scale model contained 110,784 particles—substantially fewer than the original system—while incorporating particle breakage effects through reduced energy-to-wear conversion ratios. All simulations maintained a constant CG ratio (l = 3.0), according to the ore particle size distribution of the benchmark case (or the original level case), with Table 2 presenting the adjusted particle size distribution derived from the original ore gradation. Table 3 provides comprehensive simulation parameters and conditions. The grid meshing of the mill is illustrated in Figure 1. It is noted that while preserving particle irregularity could enhance simulation accuracy, it would significantly degrade computational efficiency. Therefore, all ore particles in this work are geometrically simplified as spheres to balance numerical tractability with physical fidelity.

3. Results and Discussion

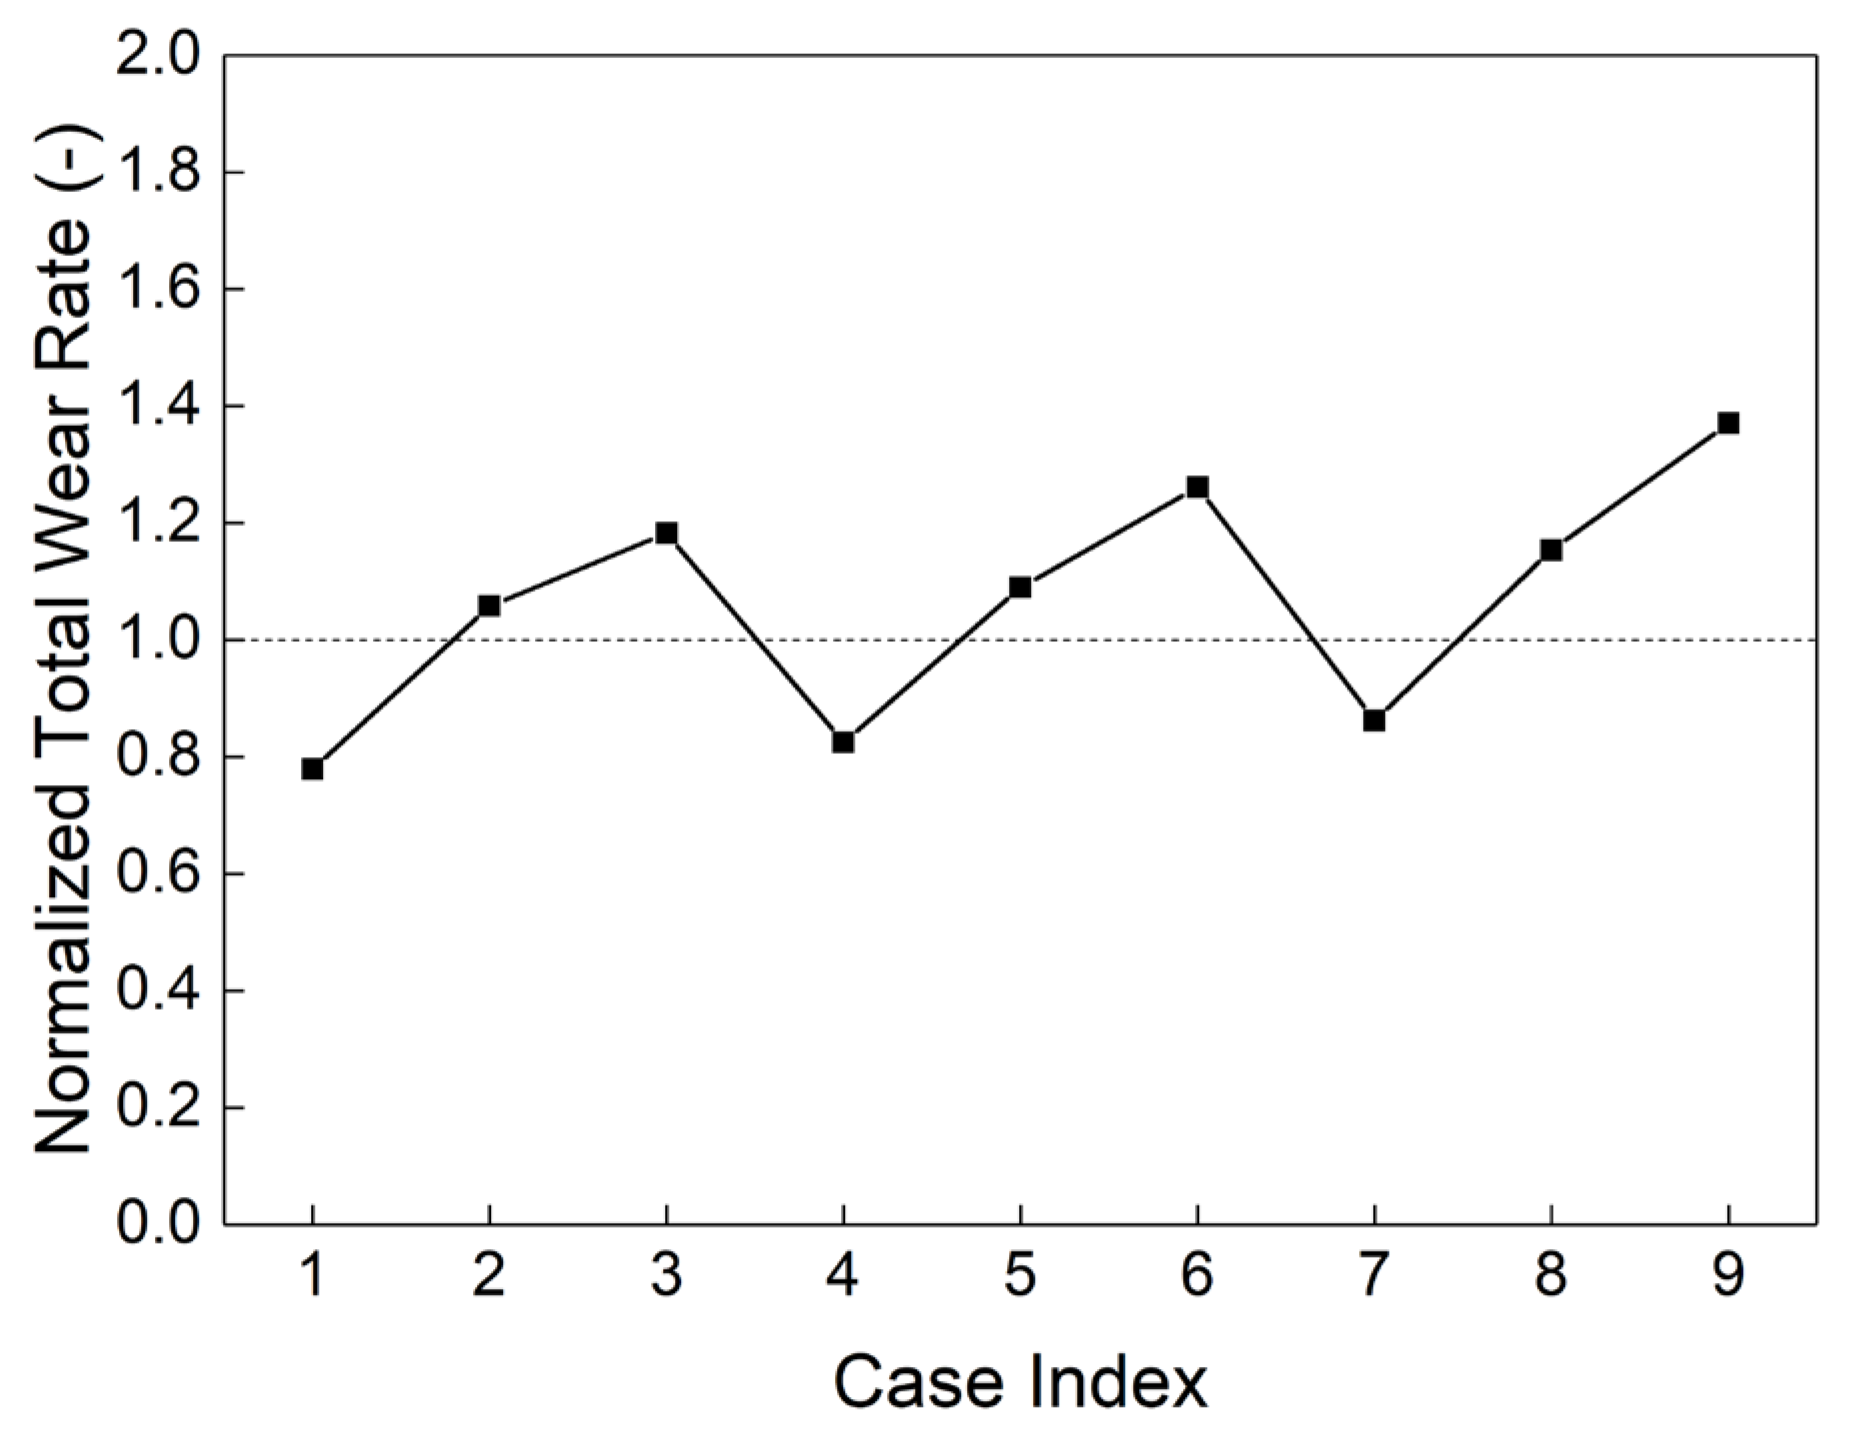
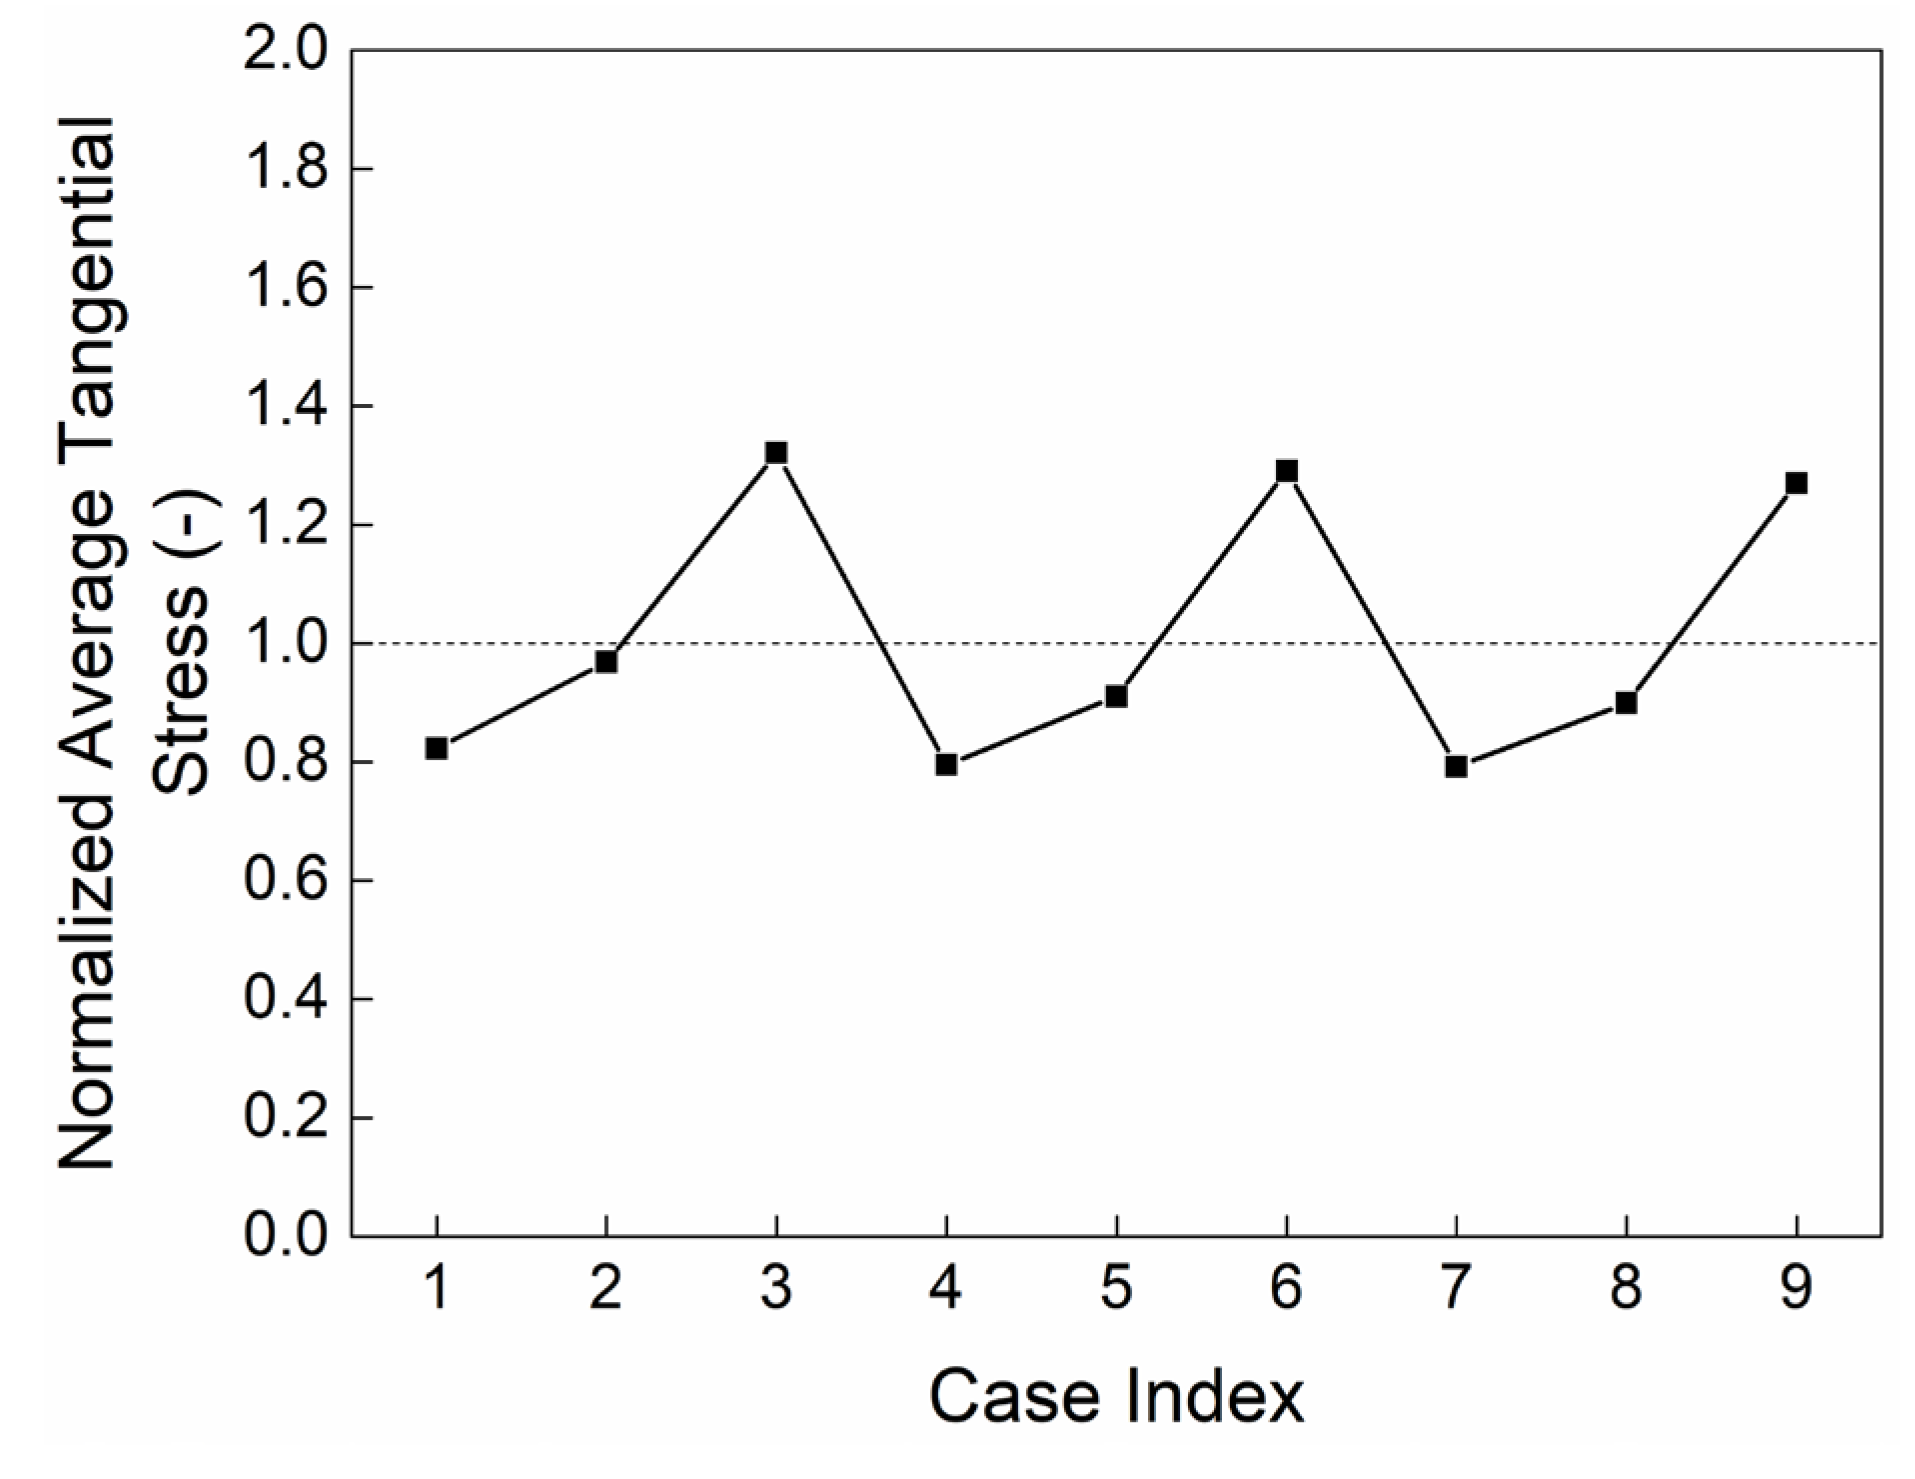
3.1. Effect of Contact Parameters on Total Wear Rate and the Reasons for the Deviations

Figure 2 presents the normalized total liner wear rate across the entire mill, as predicted by the coarse-grain (CG) wear model. The normalization process utilized original-scale benchmark data, where a value of 1.0 indicates perfect agreement with the reference benchmark. That is to say, when the normalized wear rate equals 1.0, the coarse-grain level approach is accurate. Clearly, using the same e, the wear rate evidently increases with increasing fs and the growth rate decreases (which is true when fs increases from 0.005 to 0.3; the total wear rate when fs = 0.005, i.e., case 10, is not given here for brevity). In addition, using the same fs, the wear rate slightly increases with increasing e. The total wear rate of case 2 (e = 0.05, fs = 0.10) is the most accurate. When fs = 0.10, the accuracy is the best. The wear distribution of the liner in Case 2 is presented in Figure 3, where it is evident that wear predominantly concentrates on the lifters. Figure 4 displays the particle distribution within the mill for Case 2. It is evident that the particles in contact with the liner are predominantly small in size.
Figure 5a displays the normalized energy dissipation rates associated with mill liners, where all cases exhibit values exceeding 1.67. Although calibrated by the coarse-grain ratio l, the energy dissipation is still significantly overestimated. The reason for this is likely that the energy dissipation due to the normal contact force is overestimated. Moreover, only when the restitution coefficient (ep-p) is 0.05, the normalized energy dissipation rate increases with increasing fs, which is similar to that of the normalized total wear rate. As shown in Figure 5b–d, three regions can be observed in the frequency spectra: in the low energy level region (<10−2 J), the frequency increases with increasing fs; in the medium level region (10−2–101 J), the frequency decreases with increasing fs; in the high-level region (>101 J), the frequency in general increases with increasing fs. The sliding friction coefficient mainly affects the energy dissipation during the sliding of the particles on the surface. Therefore, when ep-p is small (0.05), the sliding (or the tangential contact force) accounts for a larger share of the energy dissipation, which also increases with increasing fs, which is similar to the total wear rate (Figure 2).
Figure 6 presents the normalized average tangential stress distribution on mill liners, revealing distinct parametric dependencies. Using the same e, the stress increases with increasing fs. Unlike the curves of the total wear rate, the increasing rate of the stress increases with increasing fs (which is true when fs increases from 0.005 to 0.3), which indicate that a maximum sliding intensity exists, i.e., the sliding intensity first increases and then decreases with increasing fs. Using the same fs, the average tangential stress decreases with increasing e, which supports that when e is smaller, the sliding plays a more important role.
When stress prediction is achieved with reasonable accuracy in coarse-grain simulations, the energy dissipation occurring at liner surfaces is inevitably overestimated. The reason for this can be given as follows: assuming that during the impact between the particles and the surfaces, the kinetic energy transformed into the spring elastic potential energy of the coarse-grain particles is the same as the original particles in the benchmark case, which means that the spring elastic potential energy is l2 times that of the original particles of the group represented by the coarse-grain particle (only approximately l2 original particles can directly impact the liners). If no sliding occurs:
1 2 k t , cg δ t , cg 2 = l 2 1 2 k t , o δ t , o 2
Because kt,cg = kt,o in this work (the subscript cg denotes the coarse-grain case and o means the original case),
δ t , cg = l δ t , o
According to Equation (3), because the relative tangential velocity is 0 (note that no sliding occurs),
F c , t , cg = l F c , t , o
Therefore, if the kinetic energy transformed into the spring elastic potential energy of the coarse-grain particles is the same as the original particles in the benchmark case, then,
σ c , t , cg = F c , t , cg A liners = l F c , t , o A liners = l i = 1 l 2 F c , t , o , i l 2 A liners = σ c , t , o l
When sliding occurs, the tangential stress should be calculated using the normal contact force.
1 2 k n , cg δ n , cg 2 = l 2 1 2 k n , o δ n , o 2
Because kn,cg = kn,o in this work,
δ n , cg = l δ n , o
According to Equation (2), assuming that the relative normal velocity is low in the bulk toe,
F c , n , cg l F c , n , o
According to Equation (7),
F c , t , cg l F c , t , o
Therefore,
σ c , t , cg = F c , t , cg A liners l F c , t , o A liners = l i = 1 l 2 F c , t , o , i l 2 A liners = σ c , t , o l
Based on the analysis above, when the kinetic energy transformed into the spring elastic potential energy of the coarse-grain particles is the same as the original particles in the benchmark case during the impact exerted on the liners, σc,t,cg is approximately l times σc,t,o. Because σc,t,cg is significantly larger than σc,t,o/l even when fs = 0.05, the energy consumed on the liners is inevitably overestimated and should be modified using the coarse-grain ratio l. As shown in Figure 5a, the energy dissipation is still overestimated after the modification, which indicates that the energy dissipation due to the normal contact force is indeed significantly overestimated.
Figure 7 depicts the normalized combined translational and rotational kinetic energies of particles within the mill system. Specifically, using the same e, both the translational and rotational kinetic energy increase with increasing fs. Moreover, the increasing rate also increases with increasing fs (which is true when fs increases from 0.005 to 0.3), which also supports that fs altered the sliding intensity. Based on these results, it can be concluded that an artificial parameter is not necessary for obtaining an accurate total energy dissipation rate and energy spectrum, whereas the total kinetic energy can be in general accurately calculated using the coarse-grain ratio l.

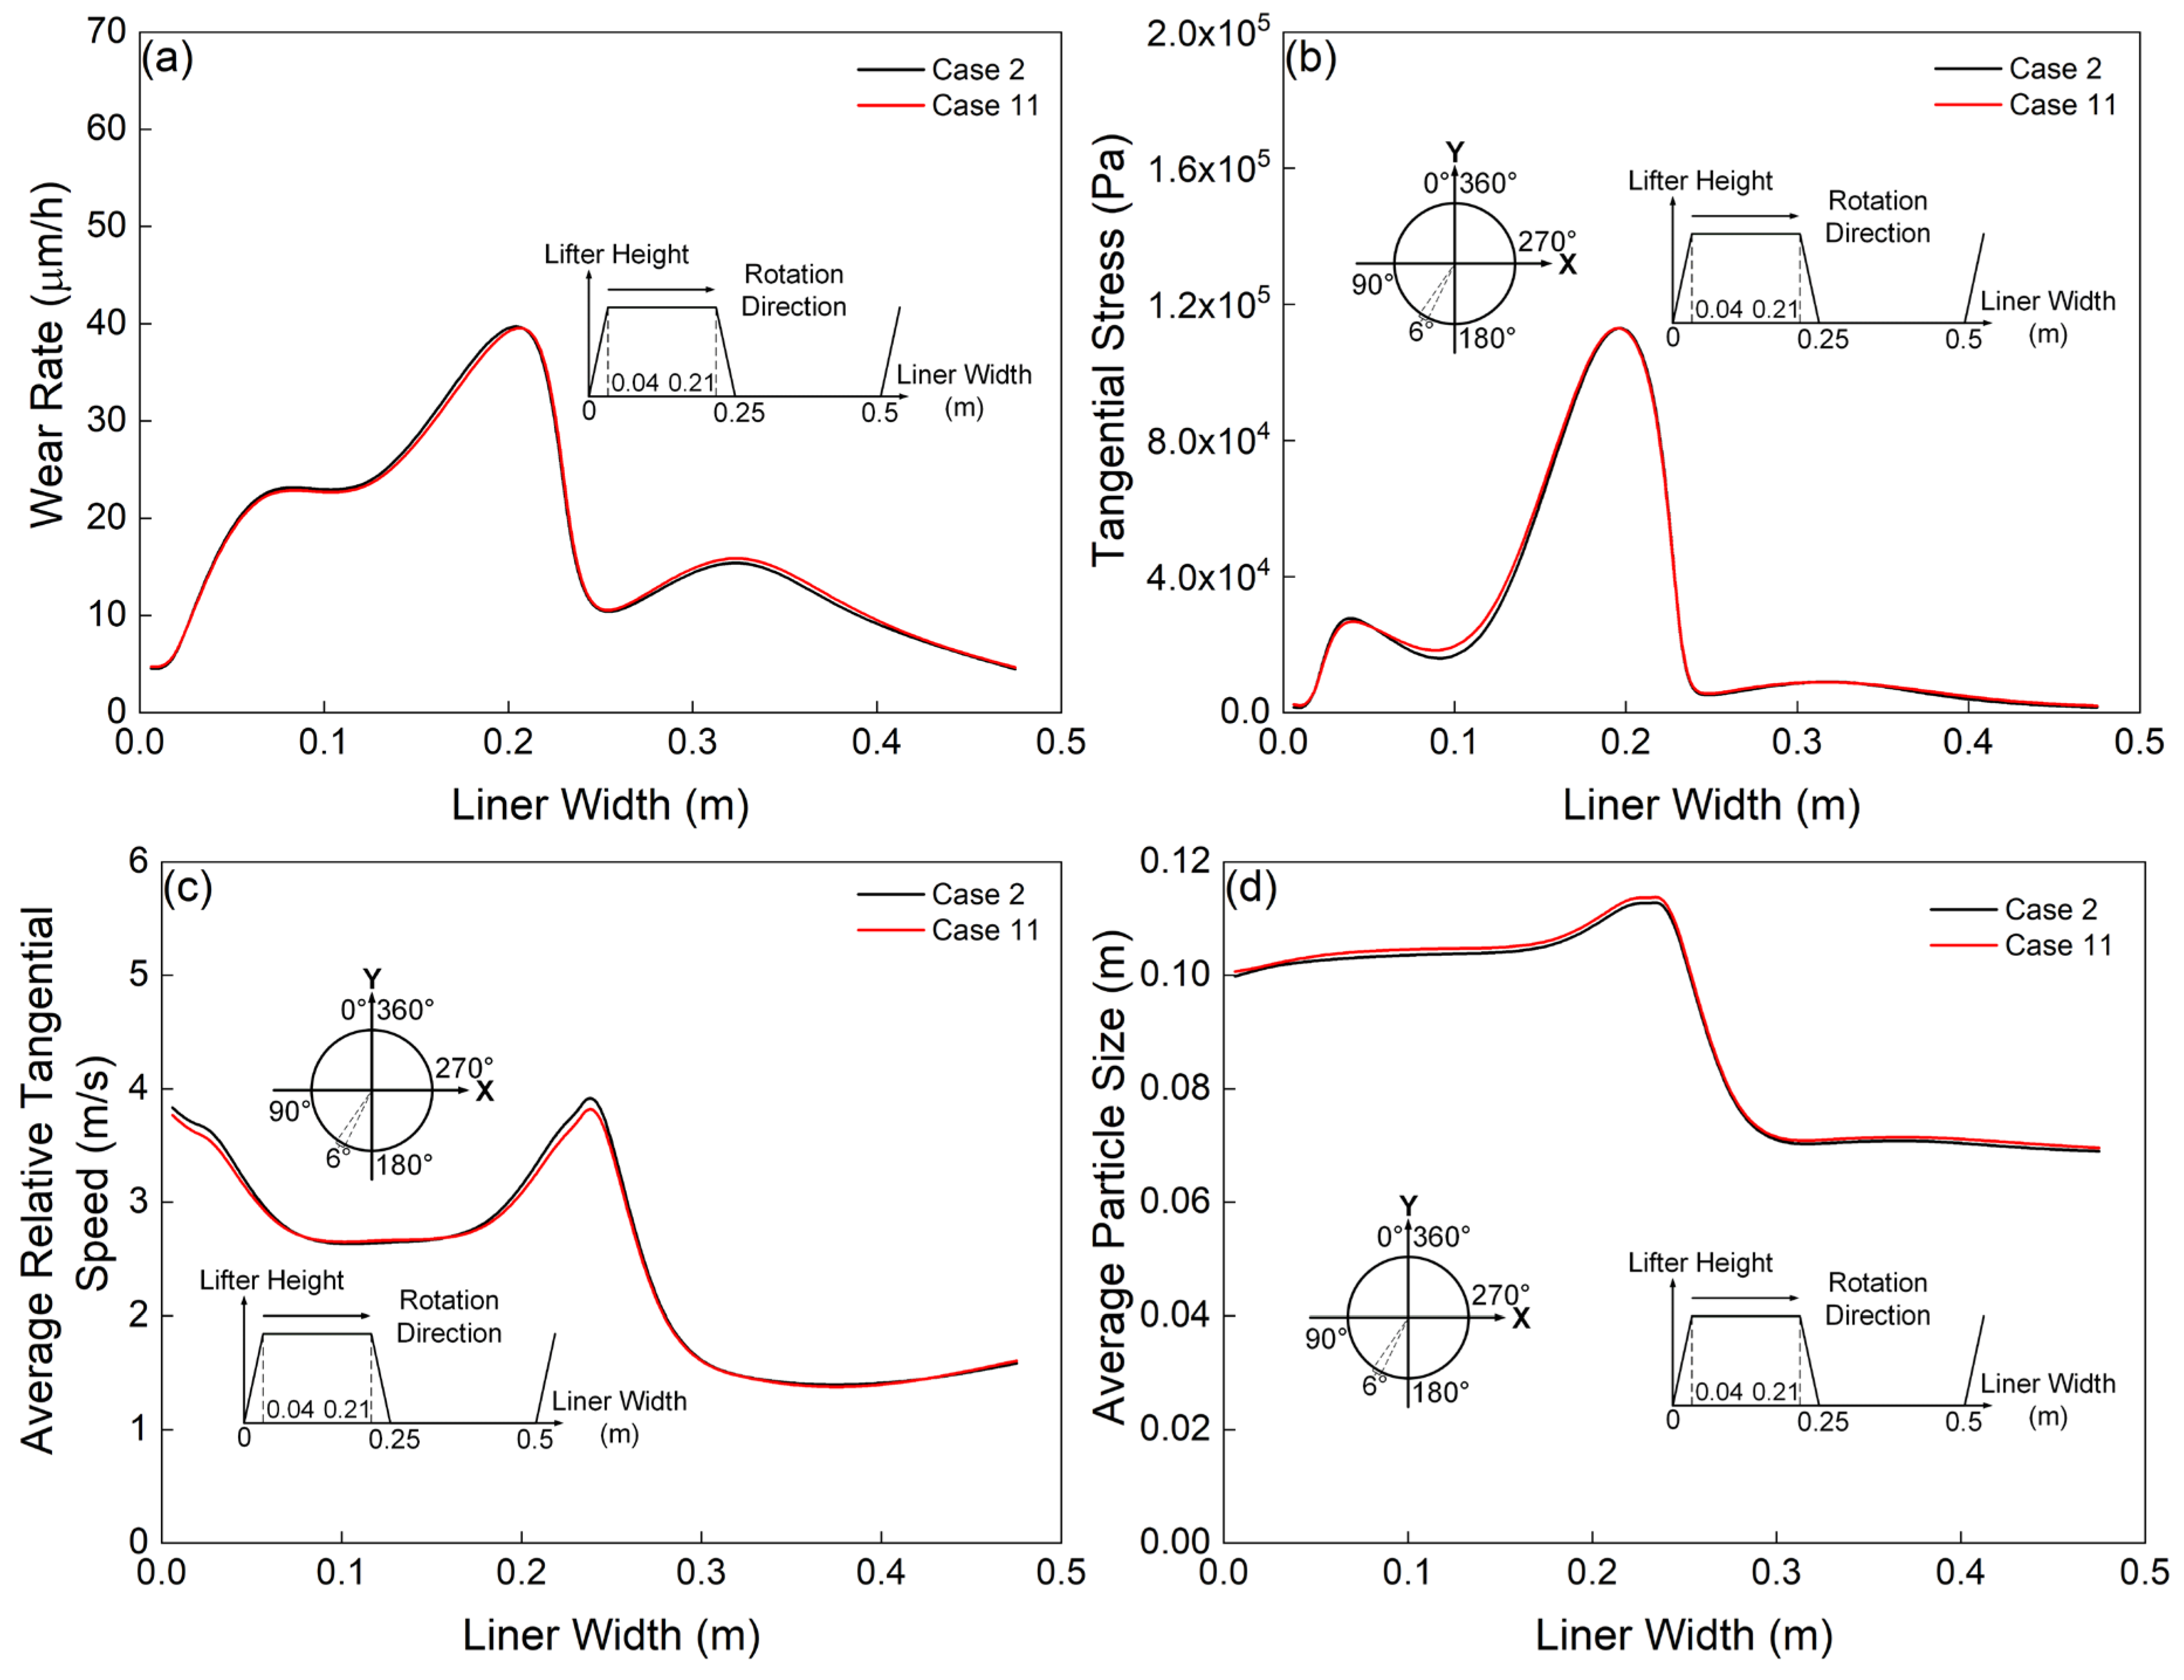
3.2. Effect of the Contact Parameters on Wear Rate Profiles and the Reasons for the Deviations

Figure 8 illustrates the wear profile characteristics of an individual lifter simulated under varying contact parameter configurations. The analysis consistently demonstrates that wear predominantly localizes on the lifter bars across all experimental conditions. Using the same e, the wear rate evidently increases with increasing fs; using the same fs, the wear rate slightly increases with increasing e. These findings align closely with the observed influence of the two contact parameters on the overall wear rate characteristics, consistent with the trends demonstrated in Figure 2. In addition, the curves of the case 2, 5, 8 (e = 0.05, 0.15, 0.30, fs = 0.10) generally agree with that of the benchmark data in the range of 0–0.25. However, the deviations of the coarse-grain cases are not negligible in the range of 0.25–0.5, i.e., the wear of the liners between two lifter bars cannot be accurately predicted by the current approach. Because the relative height of the lifter bar has significant influence on the charge motion [13], the accuracy of the current approach is still not enough for quantitative analysis. The reasons for the deviations are given in the following.
Figure 9 presents the average tangential stress distribution acting on an individual lifter within the target region, where this critical zone is operationally defined by the spatial coordinates associated with peak transient wear rates identified in Figure 8. For instance, the position of the maximum transient wear rate of the benchmark case is 138°, then the target region is 135–141°, which is exactly the range of a liner (as mentioned in the Section 2.3, 60 rail type liners cover the inner surface of the mill). Clearly, using the same e, the stress increases with increasing fs. A maximum stress exists at the position of approximately 0.2 m in all the cases, which is the same as the wear profiles. In addition, the maximum stresses of the coarse-grain cases are evidently larger than that of the benchmark case. For instance, when fs = 0.10, the maximum stress is approximately three times that of the benchmark data, whereas the stress exerted on the liners between the lifter bars is similar to the benchmark data. Based on these results, it can be speculated that the sliding intensity on the top right corner of the lifter bar (i.e., at the position of 0.2 m) is probably accurately predicted using fs = 0.10 (i.e., case 2, 5, 8), whereas the sliding intensity on the liners between two lifter bars (i.e., 0.25–0.5 m) is overestimated.
Figure 10 illustrates the mean relative tangential velocity among particle ensembles within the target region, delineated through the spatial criteria established in the preceding analysis. Clearly, using the same e, the average relative tangential speed in the range of 0–0.25 m (i.e., the lifter bar) in general increases with increasing fs, whereas the curves of the coarse-grain cases are similar to each other in the range of 0.3–0.5 m (i.e., the liners between lifter bars). Compared to the benchmark data, it can be concluded that the relative tangential speed is significantly underestimated. Therefore, prolonged sliding distances and elevated sliding frequencies constitute the primary factors contributing to the overestimated wear predictions for liners positioned between lifter bars. The relatively indistinct correlation between the increased frequency of large contacts and elevated fs values observed in Figure 5 suggests that prolonged sliding distance may exert a more dominant influence on the phenomenon under investigation.
The wear on the liners between bars is larger when fs = 0.10 rather than when fs = 0.30. However, both the tangential stress and relative tangential speed increase with increasing fs. Therefore, a factor decreasing with increasing fs should exist for explaining why the wear is the largest when fs = 0.10. As shown in Figure 11, the average particle size generally distribution proximal to the lifter within the target region reveals that particles near the lifter bar consistently exhibit larger dimensions compared to those adjacent to liners between lifter bars across all experimental conditions. Using the same e, the average size in generally decreases with increasing fs, especially in the range of 0.25–0.5 m, i.e., the liners between lifter bars, which at least indicates that the factor for explaining why the wear is the largest when fs = 0.10 has a positive relation with the average particle size. As mentioned above, the longer sliding distance and the larger frequency of the sliding are the main reasons for the overestimation of the wear on the liners between lifter bars. Notably, the sliding distance exclusively exhibits a direct positive correlation with particle size, suggesting that the observed overestimation of liner wear between lifter bars is primarily attributable to corresponding inaccuracies in sliding distance quantification.

3.3. Effect of the Time Step on Wear Predicted by the Coarse-Grain Model

All simulations maintained temporal consistency with the benchmark case by employing identical time steps, while existing studies indicate that computational efficiency in coarse-grain simulations of fluidized bed gas-particle flows can be enhanced through time step adjustments [54]. In the current work, the effect of the time step on the wear was investigated. As shown in Figure 12, only the simulation results of fs = 0.10 (i.e., case 2, 5, 8) are given for brevity. Clearly, the time step has little influence on the total wear rate. Figure 13 only shows the transient wear rate of case 2 and 11 (e = 0.05, fs = 0.10). Clearly, the time step has little effect on the transient wear rate. Figure 14 presents a multivariate analysis of temporal resolution effects, illustrating time step influences on wear rate profiles, lifter-associated tangential stress within the target zone, relative tangential velocity magnitudes, and particle size distribution near the lifter wall in the monitored region (the target region has been defined in the Section 3.3). Again, no evident difference has been observed. Therefore, the larger time step can be used in the coarse-grain level simulations.

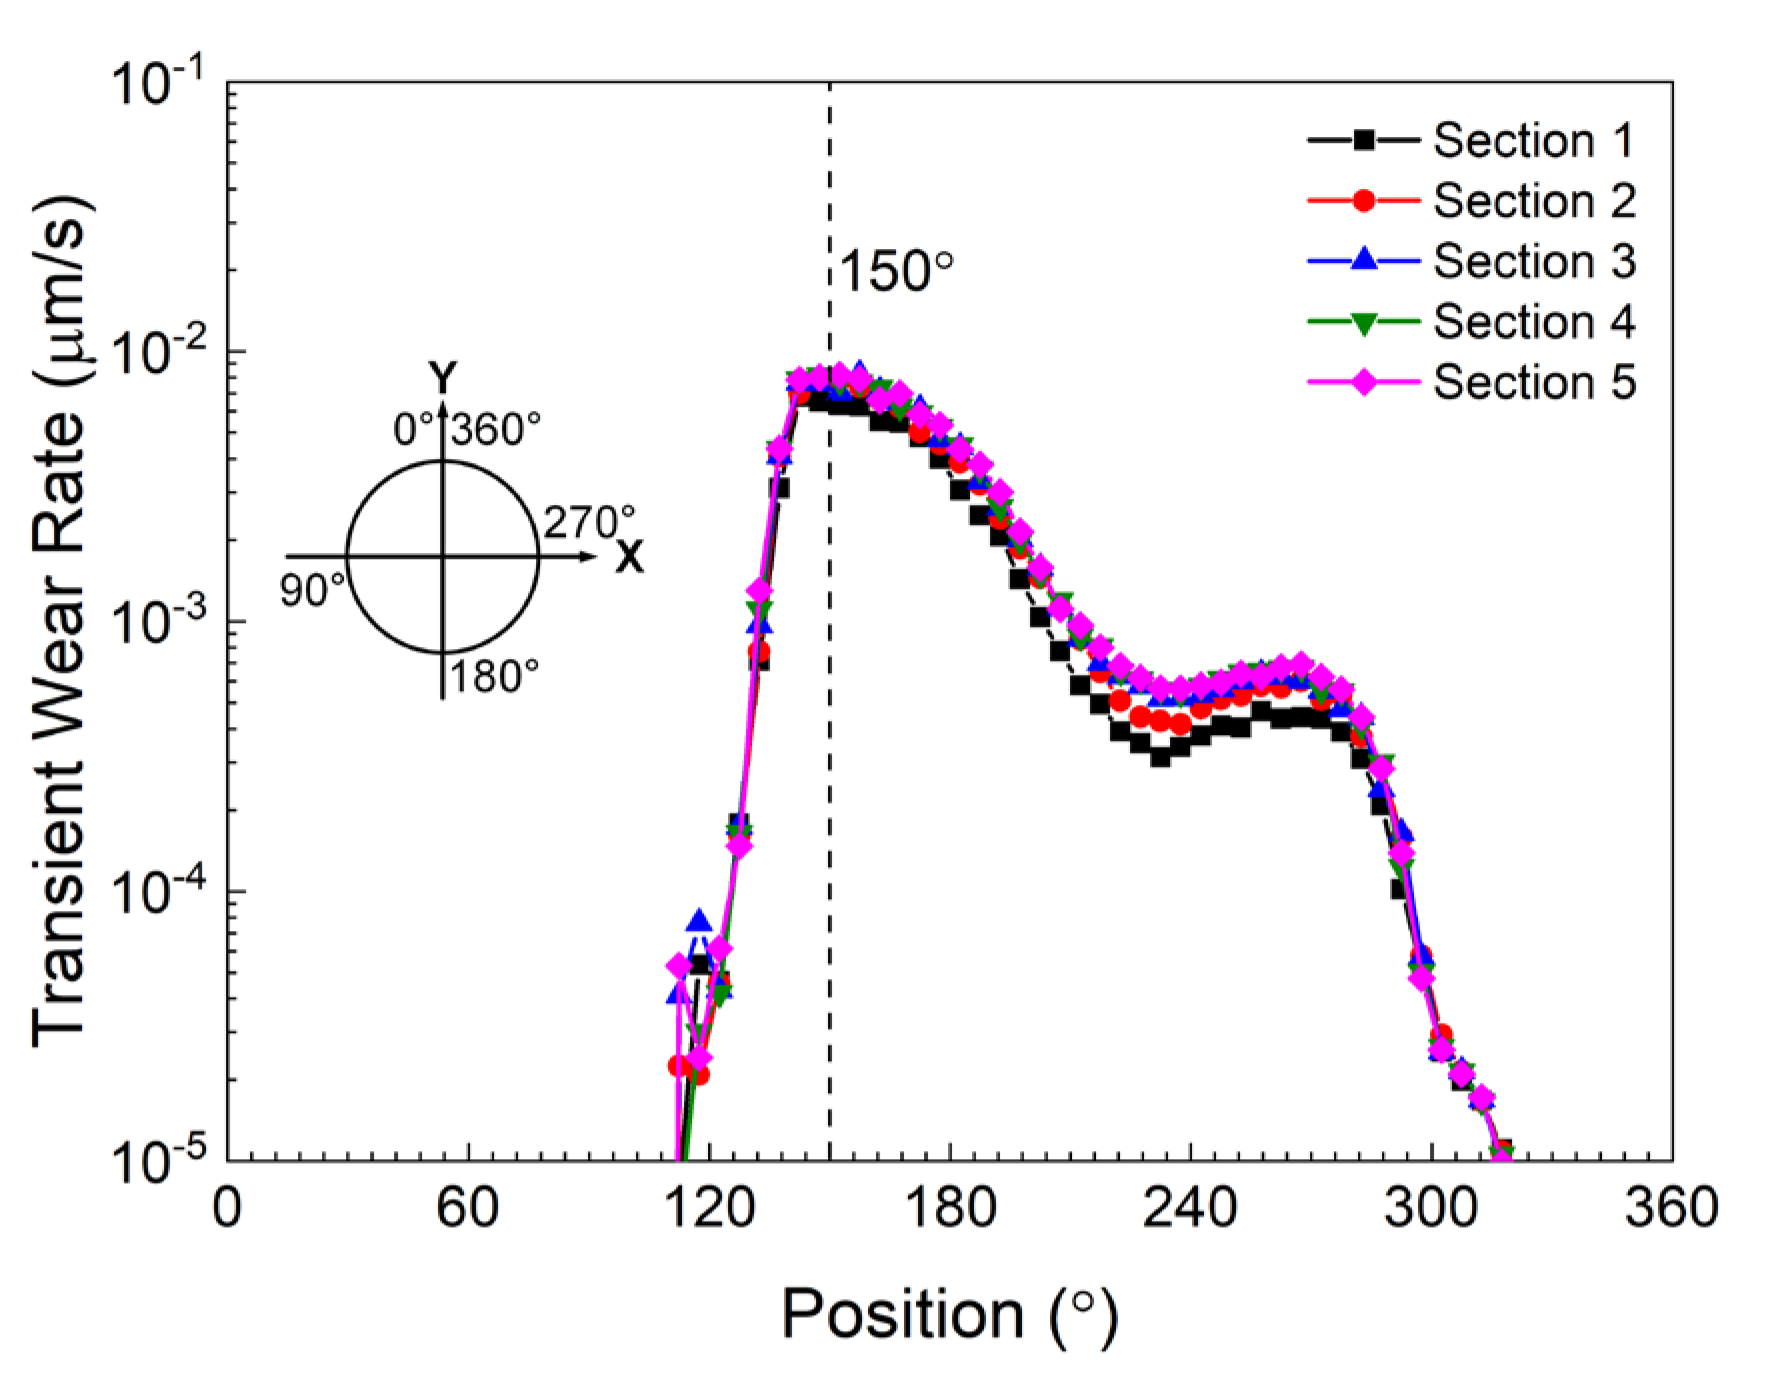
3.4. The Validity of the Approach for Predicting the Wear Distribution in the Axial Direction

To validate the coarse-grain methodology, a full-scale industrial mill liner wear simulation was conducted. The computational model, as depicted in Figure 15a, features two axially positioned liners comprising the mill’s internal surface, each segmented into five discrete zones for localized wear quantification. Figure 15b,c presents spatial distributions of wear intensity and quantitative wear progression metrics across individual zones, respectively. Notably, peak wear magnitude occurs in central liner regions, demonstrating qualitative consistency with experimental measurements [52]. Figure 16 shows the transient wear rate of each section along the circumference of the inner surface of the mill. Clearly, the positions of the maximum transient wear rates of the sections are similar to each other. The results of the transient wear rate are in line with that of the total wear rate: the wear becomes larger when the position of the section is closer to the center of the mill.
Figure 17a illustrates the wear distribution patterns across five segmented lifters in the proximal liner region, demonstrating progressive escalation of material degradation with decreasing radial distance from the mill’s central axis—a phenomenon consistent with both cumulative and temporal wear behaviors previously characterized. Specifically, the maximum wear rate (at the position of approximately 0.2 m) in Section 1 is significantly less than that of the other sections. Figure 17b shows the tangential stress exerted on a lifter of the five sections in the target region. Clearly, tangential stress also increases when the position of the section is closer to the center of the mill. Intriguingly, the maximum wear rates of Sections 3, 4 and 5 are almost identical to each other, which is different to the results of tangential stress (increases from Section 3 to 5). The mechanical interactions proximal to the mill’s central region suggest sliding intensity exerts predominant influence over maximum wear rates compared to tangential stress contributions. Furthermore, wear magnitude within the 0.25–0.5 m radial zone demonstrates progressive escalation across sequential segments (1–5), while tangential stress profiles maintain comparable magnitudes throughout all analyzed sections.
Figure 17c,d characterizes relative tangential velocity profiles and granulometric distributions proximal to lifters across five monitored zones, revealing that tangential velocity demonstrates progressive escalation with diminishing radial distance from the rotational axis. Particle dimensions exhibit maximum median values in Section 3 (0–0.25 m radial range), displaying a non-monotonic radial dependency characterized by initial growth followed by reduction approaching central mill regions. The particle sizes in the five adjacent sections exhibit comparable averages (ranging from 0.25 to 0.5 m), corresponding to the liners positioned between lifter bars. As previously noted, while the maximum tangential stress progressively increases from Section 1 to Section 5, the peak wear rates remain nearly consistent across Sections 3 to 5. Based on the data of the relative tangential speed and the particle size, it can be observed that the differences at the position of the maximum wear rate (approximately 0.2 m) between different sections are in general negligible. Therefore, it can be speculated that when tangential stress is greater than a critical value, the sliding distance decreases rapidly, which eliminates the effect of the increasing of the tangential stress on the maximum wear rate. In addition, the average relative tangential speed slightly increases from Section 1 to 5 in the range of 0.25–0.5 m, which is likely the main reason for increasing the wear as shown in Figure 17a.

4. Conclusions

This study performed sensitivity analysis on simulation parameters to assess the coarse-grain DEM’s predictive capacity for liner wear. It should be noted that the conclusions of this study are derived from comparisons with a non-coarse-grain base model, while the SAG mill model incorporates critical simplifications: spherical particles are employed for computational tractability, particles smaller than 15 mm are excluded from the granular assembly. The results demonstrate that Case 2 parameters from Table 1. enable accurate prediction of total wear rates induced by polydisperse particle flows, while the model successfully predicts maximum lifter wear rates with precision. Notably, the contact parameter configuration in Case 2 effectively captures both cumulative and localized wear phenomena despite material heterogeneity. The methodology established in this study demonstrates applicability for predicting wear rates of liners in full-scale SAG mills under practical engineering conditions, while enabling qualitative prediction of wear distribution patterns along the axial direction. In addition, the computation time of Case 2 was compared with that of the original case. The results demonstrate that the computation time required for Case 2 is only 0.0196 times that of the original case, highlighting the substantial enhancement in computational efficiency enabled by the coarse-grain method.
However, the model underestimates peak transient wear rates, primarily attributed to insufficient sliding intensity characterization. Conversely, inter-lifter liner wear rates show overestimations despite employing Case 2 contact parameters, principally resulting from excessive sliding intensity predictions in these regions. Notably, proper parameter selection enables accurate prediction of tangential stresses acting on liners, particularly total tangential stress components. Though the current approach is still not perfect, some analysis can be carried out based on a full-size simulation using a time step significantly larger than that of the particle level cases. Moreover, because the total wear rate and the maximum wear rate of a lifter can be accurately predicted, the approach can be a quantitative tool once the relation between the maximum wear rate and the wear on the liners between lifter bars is revealed. The ongoing development of a multi-level coarse-grain approach for tumbling mills focuses on conducting simulations in critical transition regions, thereby laying the groundwork for an advanced coarse-grain methodology.

Supplementary Materials

The following supporting information can be downloaded at: https://www.mdpi.com/article/10.3390/min15030305/s1, Data Set S1.

Author Contributions

Conceptualization: X.Z., H.Y. and X.D.; Funding acquisition: X.D.; Methodology: X.Z., H.Y. and X.D.; Project administration: X.Z.; Supervision: X.Z., Z.Z. and X.D.; Visualization: Y.S., Z.Z. and H.Y.; Writing—original draft: X.Z.; Writing—review & editing: X.D.; All authors have read and agreed to the published version of the manuscript.

Funding

This research is funded by the National Natural Science Foundation of China (NSFC, Grant No. 52205172), and Zhejiang Provincial Natural Science Foundation (Grant No. LY23E050015 and No. LTGS24E010002).

Data Availability Statement

Data are contained within the article and Supplementary Materials. The raw data supporting the conclusions of this article will be made available by the authors on request.

Conflicts of Interest

Xiaoteng Zheng, Huanwei Yu, Zheming Zhu, Xiyong Du are employees of Shaoxing Special Equipment Testing Institute. The paper reflects the views of the scientists and not the company.

Abbreviations

DEMDiscrete element method
SIEMShear Impact Energy Model
MLCGmulti-level coarse-grain
SAGsemi-autogenous grinding

References

  1. Cleary, P.W.; Morrison, R.D. Comminution mechanisms, particle shape evolution and collision energy partitioning in tumbling mills. Miner. Eng. 2016, 86, 75–95. [Google Scholar] [CrossRef]
  2. Cleary, P.W. Ball motion, axial segregation and power consumption in a full scale two chamber cement mill. Miner. Eng. 2009, 22, 809–820. [Google Scholar] [CrossRef]
  3. Gates, J.D.; Dargusch, M.S.; Walsh, J.J.; Field, S.L.; Hermand, M.J.-P.; Delaup, B.G.; Saad, J.R. Effect of abrasive mineral on alloy performance in the ball mill abrasion test. Wear 2008, 265, 865–870. [Google Scholar] [CrossRef]
  4. Cleary, P.W. Predicting charge motion, power draw, segregation and wear in ball mills using discrete element methods. Miner. Eng. 1998, 11, 1061–1080. [Google Scholar] [CrossRef]
  5. Weerasekara, N.S.; Powell, M.S.; Cleary, P.W.; Tavares, L.M.; Evertsson, M.; Morrison, R.D.; Quist, J.; Carvalho, R.M. The contribution of DEM to the science of comminution. Powder Technol. 2013, 248, 3–24. [Google Scholar] [CrossRef]
  6. Kuwagi, K.; Takeda, H.; Horio, M. Similar Particle Assembly (SPA) Model. An Approach to Large-Scale Discrete Element (DEM) Simulation. In Proceedings of the Fluidization XI, Ischia, Italy, 9–14 May 2004; pp. 243–250. [Google Scholar]
  7. Xu, L.; Luo, K.; Zhao, Y. Numerical prediction of wear in SAG mills based on DEM simulations. Powder Technol. 2018, 329, 353–363. [Google Scholar] [CrossRef]
  8. Mishra, B.K.; Rajamani, R.K. The discrete element method for the simulation of ball mills. Appl. Math. Model. 1992, 16, 598–604. [Google Scholar] [CrossRef]
  9. Cleary, P.W. Charge behaviour and power consumption in ball mills: Sensitivity to mill operating conditions, liner geometry and charge composition. Int. J. Miner. Process. 2001, 63, 79–114. [Google Scholar] [CrossRef]
  10. Cleary, P.W. Axial transport in dry ball mills. Appl. Math. Model. 2006, 30, 1343–1355. [Google Scholar] [CrossRef]
  11. Cleary, P.W.; Hoyer, D. Centrifugal mill charge motion and power draw: Comparison of DEM predictions with experiment. Int. J. Miner. Process. 2000, 59, 131–148. [Google Scholar] [CrossRef]
  12. Cleary, P.W.; Morrisson, R.; Morrell, S. Comparison of DEM and experiment for a scale model SAG mill. Int. J. Miner. Process. 2003, 68, 129–165. [Google Scholar] [CrossRef]
  13. Cleary, P.W.; Owen, P. Development of models relating charge shape and power draw to SAG mill operating parameters and their use in devising mill operating strategies to account for liner wear. Miner. Eng. 2018, 117, 42–62. [Google Scholar] [CrossRef]
  14. Cleary, P.W.; Owen, P. Effect of particle shape on structure of the charge and nature of energy utilisation in a SAG mill. Miner. Eng. 2019, 132, 48–68. [Google Scholar] [CrossRef]
  15. Jayasundara, C.T.; Yang, R.Y.; Yu, A.B.; Curry, D. Discrete particle simulation of particle flow in IsaMill—Effect of grinding medium properties. Chem. Eng. J. 2008, 135, 103–112. [Google Scholar] [CrossRef]
  16. Kalala, J.T.; Bwalya, M.; Moys, M.H. Discrete element method (DEM) modelling of evolving mill liner profiles due to wear. Part II. Industrial case study. Miner. Eng. 2005, 18, 1392–1397. [Google Scholar] [CrossRef]
  17. Mishra, B.K. A review of computer simulation of tumbling mills by the discrete element method: Part I—Contact mechanics. Int. J. Miner. Process. 2003, 71, 73–93. [Google Scholar] [CrossRef]
  18. Mishra, B.K.; Murty, C.V.R. On the determination of contact parameters for realistic DEM simulations of ball mills. Powder Technol. 2001, 115, 290–297. [Google Scholar] [CrossRef]
  19. Weerasekara, N.S.; Liu, L.X.; Powell, M.S. Estimating energy in grinding using DEM modelling. Miner. Eng. 2016, 85, 23–33. [Google Scholar] [CrossRef]
  20. Cleary, P.W.; Morrison, R.D.; Delaney, G.W. Incremental damage and particle size reduction in a pilot SAG mill: DEM breakage method extension and validation. Miner. Eng. 2018, 128, 56–68. [Google Scholar] [CrossRef]
  21. Krok, A.; Peciar, P.; Coffey, K.; Bryan, K.; Lenihan, S. A combination of density-based clustering method and DEM to numerically investigate the breakage of bonded pharmaceutical granules in the ball milling process. Particuology 2021, 58, 153–168. [Google Scholar] [CrossRef]
  22. Kuang, D.M.; Long, Z.L.; Ogwu, I.; Chen, Z. A discrete element method (DEM)-based approach to simulating particle breakage. Acta Geotech. 2022, 17, 2751–2764. [Google Scholar] [CrossRef]
  23. Xu, M.; Jin, D.; Zhou, W. An experimental study on the time-dependent behavior of crushable granular materials using 3D-printed particles. Acta Geotech. 2022, 17, 93–104. [Google Scholar] [CrossRef]
  24. Fang, C.; Gong, J.; Jia, M.; Nie, Z.; Li, B.; Mohammed, A.; Zhao, L. DEM simulation of the shear behaviour of breakable granular materials with various angularities. Adv. Powder Technol. 2021, 32, 4058–4069. [Google Scholar] [CrossRef]
  25. Akhondizadeh, M.; Fooladi Mahani, M.; Rezaeizadeh, M.; Mansouri, S. Prediction of tumbling mill liner wear: Abrasion and impact effects. Proc. Inst. Mech. Eng. Part J J. Eng. Tribol. 2016, 230, 1310–1320. [Google Scholar] [CrossRef]
  26. Xu, L.; Luo, K.; Zhao, Y.; Fan, J.; Cen, K. Influence of particle shape on liner wear in tumbling mills: A DEM study. Powder Technol. 2019, 350, 26–35. [Google Scholar] [CrossRef]
  27. Yin, Z.; Peng, Y.; Li, T.; Zhu, Z.; Yu, Z.; Wu, G. Effect of the operating parameter and grinding media on the wear properties of lifter in ball mills. Proc. Inst. Mech. Eng. Part J J. Eng. Tribol. 2020, 234, 1061–1074. [Google Scholar] [CrossRef]
  28. Katterfeld, A.; Wensrich, C. Understanding granular media: From fundamentals and simulations to industrial application. Granul. Matter 2017, 19, 83. [Google Scholar] [CrossRef]
  29. Sakai, M. How Should the Discrete Element Method Be Applied in Industrial Systems: A Review. KONA Powder Part. J. 2016, 33, 169–178. [Google Scholar] [CrossRef]
  30. Gidaspow, D. Multiphase Flow and Fluidization: Continuum and Kinetic Theory Descriptions; Academic Press: Cambridge, MA, USA, 1994. [Google Scholar]
  31. Guo, Y.; Buettner, K.; Lane, V.; Wassgren, C.; Ketterhagen, W.; Hancock, B.; Curtis, J. Computational and Experimental Studies of Flexible Fiber Flows in a Normal-Stress-Fixed Shear Cell. AIChE J. 2019, 65, 64–74. [Google Scholar] [CrossRef]
  32. Ottino, J.M.; Lueptow, R.M. On Mixing and Demixing. Science 2008, 319, 912–913. [Google Scholar] [CrossRef]
  33. Sakai, M.; Koshizuka, S. Large-scale discrete element modeling in pneumatic conveying. Chem. Eng. Sci. 2009, 64, 533–539. [Google Scholar] [CrossRef]
  34. Sakai, M.; Abe, M.; Shigeto, Y.; Mizutani, S.; Takahashi, H.; Viré, A.; Percival, J.R.; Xiang, J.; Pain, C.C. Verification and validation of a coarse grain model of the DEM in a bubbling fluidized bed. Chem. Eng. J. 2014, 244, 33–43. [Google Scholar] [CrossRef]
  35. Sakai, M.; Takahashi, H.; Pain, C.C.; Latham, J.-P.; Xiang, J. Study on a large-scale discrete element model for fine particles in a fluidized bed. Adv. Powder Technol. 2012, 23, 673–681. [Google Scholar] [CrossRef]
  36. Sakai, M.; Yamada, Y.; Shigeto, Y.; Shibata, K.; Kawasaki, V.M.; Koshizuka, S. Large-scale discrete element modeling in a fluidized bed. Int. J. Numer. Methods Fluids 2010, 64, 1319–1335. [Google Scholar] [CrossRef]
  37. Jia, Y.; Zhang, Y.; Xu, J.; Duan, C.; Zhao, Y.; Ge, W. Coarse-grained CFD-DEM simulation to determine the multiscale characteristics of the air dense medium fluidized bed. Powder Technol. 2021, 389, 270–277. [Google Scholar] [CrossRef]
  38. Zhou, L.; Zhao, Y. CFD-DEM simulation of fluidized bed with an immersed tube using a coarse-grain model. Chem. Eng. Sci. 2021, 231, 116290. [Google Scholar] [CrossRef]
  39. Takabatake, K.; Mori, Y.; Khinast, J.G.; Sakai, M. Numerical investigation of a coarse-grain discrete element method in solid mixing in a spouted bed. Chem. Eng. J. 2018, 346, 416–426. [Google Scholar] [CrossRef]
  40. Chu, K.; Chen, J.; Yu, A. Applicability of a coarse-grained CFD–DEM model on dense medium cyclone. Miner. Eng. 2016, 90, 43–54. [Google Scholar] [CrossRef]
  41. Napolitano, E.S.; Renzo, A.D.; Maio, F.P.D. Coarse-grain DEM-CFD modelling of dense particle flow in Gas–Solid cyclone. Sep. Purif. Technol. 2022, 287, 120591. [Google Scholar] [CrossRef]
  42. Thakur, S.C.; Ooi, J.Y.; Ahmadian, H. Scaling of discrete element model parameters for cohesionless and cohesive solid. Powder Technol. 2016, 293, 130–137. [Google Scholar] [CrossRef]
  43. Kazidenov, D.; Khamitov, F.; Amanbek, Y. Coarse-graining of CFD-DEM for simulation of sand production in the modified cohesive contact model. Gas Sci. Eng. 2023, 113, 204976. [Google Scholar] [CrossRef]
  44. Chan, E.L.; Washino, K. Coarse grain model for DEM simulation of dense and dynamic particle flow with liquid bridge forces. Chem. Eng. Res. Des. 2018, 132, 1060–1069. [Google Scholar] [CrossRef]
  45. Cai, R.; Zhao, Y. An experimentally validated coarse-grain DEM study of monodisperse granular mixing. Powder Technol. 2020, 361, 99–111. [Google Scholar] [CrossRef]
  46. Queteschiner, D.; Lichtenegger, T.; Pirker, S.; Schneiderbauer, S. Multi-level coarse-grain model of the DEM. Powder Technol. 2018, 338, 614–624. [Google Scholar] [CrossRef]
  47. Rong, W.; Feng, Y.; Schwarz, P.; Yurata, T.; Witt, P.; Li, B.; Song, T.; Zhou, J. Sensitivity analysis of particle contact parameters for DEM simulation in a rotating drum using response surface methodology. Powder Technol. 2020, 362, 604–614. [Google Scholar] [CrossRef]
  48. Ge, W.; Wang, L.; Xu, J.; Chen, F.; Zhou, G.; Lu, L.; Chang, Q.; Li, J. Discrete simulation of granular and particle-fluid flows: From fundamental study to engineering application. Rev. Chem. Eng. 2017, 33, 551–623. [Google Scholar] [CrossRef]
  49. Zhao, Y.; Xu, L.; Zheng, J. CFD-DEM simulation of tube erosion in a fluidized bed. AIChE J. 2017, 63, 418–437. [Google Scholar] [CrossRef]
  50. Cundall, P.A.; Strack, O.D.L. A discrete numerical model for granular assemblies. Géotechnique 1979, 29, 47–65. [Google Scholar] [CrossRef]
  51. Finnie, I. Erosion of metals by solid particles. J. Mater. 1967, 2, 682. [Google Scholar]
  52. Banisi, S.; Hadizadeh, M. 3-D liner wear profile measurement and analysis in industrial SAG mills. Miner. Eng. 2007, 20, 132–139. [Google Scholar] [CrossRef]
  53. Ting, J.M.; Corkum, B.T. Computational laboratory for discrete element geomechanics. J. Comput. Civ. Eng. 1992, 6, 129–146. [Google Scholar] [CrossRef]
  54. Lin, J.; Luo, K.; Wang, S.; Hu, C.; Fan, J. An augmented coarse-grained CFD-DEM approach for simulation of fluidized beds. Adv. Powder Technol. 2020, 31, 4420–4427. [Google Scholar] [CrossRef]
Figure 1. Meshing of the SAG mill model.
Minerals 15 00305 g001
Figure 2. Normalized total wear rate of the liners predicted by the coarse-grain level wear model, the total wear rate predicted by the particle level wear model was used to normalize the coarse-grain level data.
Minerals 15 00305 g002
Figure 3. Liner wear contour of Case 2.
Minerals 15 00305 g003
Figure 4. Particle distribution in SAG of Case 2.
Minerals 15 00305 g004
Figure 5. (a) Normalized energy dissipation rate consumed by liners modified using the coarse-grain ratio l = 3.0 (the total energy dissipation rate predicted by the particle level approach was used to normalize the coarse-grain level data) and collision frequency spectra of the impact exerted on liners: (b) ep-p = 0.05, (c) ep-p = 0.15, (d) ep-p = 0.30.
Minerals 15 00305 g005
Figure 6. Normalized average stress exerted on the liners, the average stress predicted by the particle level approach was used to normalize the coarse-grain level data.
Minerals 15 00305 g006
Figure 7. Normalized (a) translational and (b) rotational kinetic energy, the kinetic energy predicted by the particle level approach was used to normalize the coarse-grain level data.
Minerals 15 00305 g007
Figure 8. Predicted wear profiles of a lifter, comparing the benchmark data and: (a) Case 1, 2, 3; (b) Case 4, 5, 6; (c) Case 7, 8, 9.
Minerals 15 00305 g008
Figure 9. Predicted average tangential stress profiles of a lifter in the target region, comparing the benchmark data and: (a) Case 1, 2, 3; (b) Case 4, 5, 6; (c) Case 7, 8, 9.
Minerals 15 00305 g009
Figure 10. Predicted average relative tangential speed profiles of a lifter in the target region, comparing the benchmark data and: (a) Case 1, 2, 3; (b) Case 4, 5, 6; (c) Case 7, 8, 9.
Minerals 15 00305 g010
Figure 11. Predicted average size profiles of the particles adjacent to a lifter in the target region, comparing the benchmark data and: (a) Case 1, 2, 3; (b) Case 4, 5, 6; (c) Case 7, 8, 9.
Minerals 15 00305 g011
Figure 12. Comparing the normalized total wear rates consumed by liners predicted by the coarse-grain approach using different time steps.
Minerals 15 00305 g012
Figure 13. Comparing the transient wear rates of a lifter at different positions along the circumference of the inner surface of the mill predicted by the coarse-grain approach using different time steps.
Minerals 15 00305 g013
Figure 14. Comparing the (a) wear profiles of a lifter, (b) tangential stress profiles on a lifter in the target region, (c) average relative tangential speed and (d) average size profiles of the particles adjacent to a lifter in the target region predicted by the coarse-grain approach using different time steps.
Minerals 15 00305 g014
Figure 15. (a) Snapshot of the 2 liners of the full-size industrial mill, (b) wear contours on the liners of the mill, (c) the total wear rate of each section in the axial (z) direction, L is the length of the full-size mill.
Minerals 15 00305 g015
Figure 16. Transient wear rate of a lifter of each section at different positions along the circumference of the inner surface of the mill predicted by the coarse-grain level wear model. The vertical dash line marked the positions of the maximum transient wear rates.
Minerals 15 00305 g016
Figure 17. Comparing the (a) wear profiles of a lifter of each section, (b) tangential stress profiles on a lifter of each section in the target region, (c) average relative tangential speed and (d) average size profiles of the particles adjacent to a lifter of each section in the target region predicted by the coarse-grain approach.
Minerals 15 00305 g017
Table 1. Coefficients and time step used in the 14 coarse-grain cases. The coarse-grain ratio l is 3.0.
Case IndexRestitution Coefficient Between Ore Particles ep-p (−), Ore Particles and Steel ep-s (−), Ball Particles and Wall es-s (−)Friction
Coefficient fs (−)
Time Step (s)
10.05, 0.083, 0.1330.052 × 10−5
20.05, 0.083, 0.1330.12 × 10−5
30.05, 0.083, 0.1330.32 × 10−5
40.15, 0.25, 0.40.052 × 10−5
50.15, 0.25, 0.40.12 × 10−5
60.15, 0.25, 0.40.32 × 10−5
70.3, 0.5, 0.80.052 × 10−5
80.3, 0.5, 0.80.12 × 10−5
90.3, 0.5, 0.80.32 × 10−5
100.05, 0.083, 0.1330.0052 × 10−5
110.05, 0.083, 0.1330.11 × 10−4
120.15, 0.25, 0.40.11 × 10−4
130.3, 0.5, 0.80.11 × 10−4
14 (full size)0.05, 0.083, 0.1330.11 × 10−4
Table 2. Ore particle size distribution used in the coarse-grain cases.
Ore Particle Size (cm)Volume Fraction of the Ore Particles (%)
(1.5–2.5) × 3.025
(2.5–3.5) × 3.018
(3.5–4.5) × 3.015
(4.5–7.5) × 3.015
(7.5–12.5) × 3.015
(12.5–17.5) × 3.012
Table 3. Parameters used in the simulations.
ParametersValue
Parameters of the liners
Vickers hardnessHV370
Height of the lifters (mm)152
Angle of the lifter face (°)14
No. of the lifters60
Parameters of the particle
Shapesphere
Density (kg/m3)4500 (Ore), 7800 (Ball)
Vickers hardnessHV160 (Ore), HV370 (Ball)
Normal spring stiffness kn (N/m)2.8 × 106
Tangential spring stiffness kt (N/m)8 × 105
Parameters of the mill
Rotation speed (rpm)10.5
Mill filling by volume (%)35
Ball filling by volume (%) (only SSD cases)15
Disclaimer/Publisher’s Note: The statements, opinions and data contained in all publications are solely those of the individual author(s) and contributor(s) and not of MDPI and/or the editor(s). MDPI and/or the editor(s) disclaim responsibility for any injury to people or property resulting from any ideas, methods, instructions or products referred to in the content.

