Abstract
This review provides a comprehensive analysis of the petrophysical controls influencing greensand reservoirs, with an emphasis on the role of glauconite and associated clay minerals in determining porosity, permeability, and water saturation. Greensands contain iron-rich clay minerals that exert paramagnetic and conductive effects, challenging conventional well-log interpretations and often leading to biased estimates of reservoir parameters. Several challenges for petrophysical property measurements are faced in the laboratory due to clay-induced pore-throat obstruction and microporosity, which underscores the importance of tailored interpretation workflows and data integration. In this paper we highlight the necessity of integrated approaches such as combining core analysis, spectral gamma-ray, and nuclear magnetic resonance (NMR) logging with conventional well logs to calibrate petrophysical models using shale–sand water saturation models, such as Waxman–Smits and Simandoux, to better characterise economical pay zones. Finally, future research directions are indicated, which include refining the calibration of saturation and permeability models, advancing rock-typing methodologies, and understanding mineralogical influences on reservoir quality to optimise hydrocarbon recovery from greensand reservoirs.
1. Introduction
Greensand reservoirs are present in mature basins and marginal plays, where reliable petrophysical evaluation is essential to reduce uncertainty in reserve calculations and optimising production planning. Greensands—or glauconitic sandstones—are a complex rock type that produce oil or gas throughout the world, including the North Sea region of northern Europe, New Zealand, India, Brazil, Argentina, and Chile (see Table 1). These siliciclastic rocks are distinguished due to the predominant presence of glauconite along with other clay minerals such as illite–smectite mixed layers and chlorite in minor proportions. Often greensands have poor to moderate porosity (<15% v/v) and ultra-low to low permeability, classifying them as tight reservoirs, making hydraulic fracturing the only viable technology to make them economically producible.
In addition to their relevance as hydrocarbon-bearing formations, greensands are of increasing interest within the mineralogical community due to their high content of the clay mineral glauconite. The petrophysical behavior of these reservoirs is fundamentally governed by the mineralogical composition, diagenetic evolution, and microstructural characteristics of glauconite and associated clays. These minerals influence key reservoir properties, including porosity, permeability, and water saturation, through their surface area, cation-exchange capacity, and microporosity. This review aligns with the scope of minerals by highlighting the mineralogical controls on reservoir quality and by emphasising the role of clay minerals in subsurface energy systems, including their implications for hydrocarbon production, CO2 storage, and even agricultural applications.
The term “greensand” stems from the greenish colour of the rock, which is primarily attributed to the presence of glauconite but is also enhanced by other clay minerals such as chlorite and illite–smectite [1,2,3,4,5]. The presence of these clay minerals in greensands results in several unique properties, such as a bimodal pore-size distribution due to the presence of macropores between framework grains and micropores between clay minerals [1]. Chemical analysis suggests that they often have a high iron, potassium [6], and boron content [7]. They also have a moderate cation-exchange capacity (7.8 to 32.4 MEQ/100 g) [8] due to the high specific surface area owing to the presence of mixed clay minerals. These features significantly affect commonly used wire-line log measurements (e.g., gamma-ray, density, neutron, and resistivity measurements), making standard well-log interpretation techniques unreliable for estimating porosity, clay volume, and water saturation.
Archie’s [9] standard water saturation equation remains widely used to estimate hydrocarbon volumes in clay-bearing sandstones, despite being formulated for clean sandstones without conductive clay minerals. In reservoirs like greensands, the assumptions behind Archie’s model break down, particularly in conditions of low water salinity or in rocks with high clay content (e.g., [10]). This challenge is part of the “shaly sand problem,” where clay minerals distort resistivity-based saturation estimates. Glauconite, in particular, complicates interpretation due to its dual porosity and elevated iron content, which significantly increases rock conductivity. These properties result in low resistivity readings and misleading water saturation estimates. While shale–sand water saturation models such as the Waxman–Smits [11] and the dual-water models [12] attempt to incorporate the effects of clay conductivity, their application is still limited, and their parameters are not well calibrated for glauconitic systems. The selection of a suitable water saturation model for greensand reservoirs is still debated, especially when logs are acquired in low-salinity environments or reservoirs with mixed clay mineralogy.
Net pay is one of the most valuable outcomes of petrophysical interpretation and evaluation; however, greensand reservoirs are inherently complex. Due to their heterogeneous mineralogy, laboratory services confront issues in routine core analysis (RCA) programs, delaying petrophysical and petrological measurements; hence, in many fields, interpreters rely heavily on logging tools. In addition, the cut-off criteria for porosity, clay volume, and water saturation are often inconsistent, and applying fixed thresholds often leads to poor reservoir characterisation. Advanced tools like nuclear magnetic resonance (NMR) and mercury injection capillary pressure (MICP) have improved estimates of fluid saturation and permeability by probing pore structure more directly [13]. These methods also enable cross-calibration (e.g., using NMR T2 distributions to infer pore-body sizes and MICP to define pore throats), but their integration into consistent workflows tailored to greensands remains underdeveloped.
A few published studies have proposed petrophysical models and workflows for greensand reservoirs (e.g., [8,14,15,16,17,18,19]); however, these are case-specific and do not fully address the underlying physical mechanisms controlling petrophysical behaviour in greensands. However, a systematic literature review on glauconite research undertaken by Nong et al. [20] indicates that research prospects are increasing, with a special focus on fertilisation, composition features, and provenance as emerging frontiers. This trend is further supported by recent advances in glauconite applications in agriculture, as reviewed by Dasi et al. [21], highlighting the mineral’s broader relevance beyond subsurface energy systems.
This review paper critically examines the petrophysical properties of greensand reservoirs, focusing on
- Key physical and mineralogical controls on porosity, permeability, and irreducible water saturation;
- Measurement and interpretation challenges, particularly in log analysis and saturation modelling;
- Recent advances in core–log integration and workflow development for more reliable reservoir characterisation.
By synthesising the available literature in English and Spanish and identifying the limitations of current models and assumptions, this review contributes to the development of more appropriate interpretation frameworks. It emphasises that many conventional petrophysical tools and models—particularly those based on clean sandstones—are inadequate for glauconitic systems. The review concludes with recommendations for integrated interpretation workflows that combine advanced logging methods, core and laboratory calibration, and tailored petrophysical models—incorporating mineralogical complexity, adjusted NMR parameters, and electrochemical analysis—while emphasising the need for future research in core–log–digital rock physics integration and machine learning approaches to improve reservoir characterisation and management in greensand reservoirs.

Table 1.
Porosity and permeability data reported from some greensand reservoirs worldwide.
Table 1.
Porosity and permeability data reported from some greensand reservoirs worldwide.
| Reservoir Type | Reservoir Name | Location | Geological Period or Epoch | Porosity * (%v/v) | Permeability * (mD) | Glauconite Content * (%v/v) | Ref. |
|---|---|---|---|---|---|---|---|
| Oil | Matulla Formation from Nezzazat Group | Lower Senonian, Gulf of Suez, Egypt | Upper Cretaceous | 3.5 to 25 | <1 to 90 | 20 to 45 | [8] |
| Oil and gas | Glauconite member from Mannville Group | Lake Newell, Southern Alberta, Canada | Lower Cretaceous | 9 to 33 | 10 to 10,200 | Not available | [22] |
| Tight oil | Albian “A” Sand Formation from Greensand Group | North Celtic Sea Basin | Lower Cretaceous | ≤30 | ≤50 | ≤45 | [23] |
| Oil | Pona Reservoir, Chonta Formation | Peruvian forest region | Cretaceous | 1 to 20 | 1 to 1000 | Not available | [24] |
| Tight oil | Caballos Formation | Putumayo Basin, Colombia | Lower Cretaceous | 2 to 19 | 0.01 to 1200 | 10 to 60 | [25] |
| Tight oil | Mardie Greensand Formation | Carnarvon Basin, Australia | Early Cretaceous | 15 to 28 | 0 to 100 | Not available | [14,15] |
| Oil | Hermod and Ty Formations | Siri Canyon, Danish North Sea | Palaeocene | 25 to 40 | 60 to 1000 | 20 to 30 | [26] |
| Tight gas | Magallanes Formation | Campo Indio field, Austral Basin, Argentina | Upper Cretaceous | 15 to 35 | 0.01 to 1 | Not able to be determined ** | [9,10] |
| Tight gas | Zona Glauconitica | Austral-Magallanes Basin, Chile | Palaeocene | 10 to 25 | 0.001 to 1 | Not able to be determined ** | [18] |
| Tight oil | Upper T of Napo Formation | Oriente Basin, Ecuador | Cretaceous | 5 to 20 | ≤500 | 10 to 40 | [27] |
* Reported either from core analysis or reservoir evaluation. ** XRD analysis could not identify glauconite since it overlapped with illite presence.
2. Geological and Mineral Framework of Greensands
2.1. Mineral Composition and Diagenesis
This subsection outlines the primary mineral constituents and the process of glauconitisation that governs greensand reservoirs, with an emphasis on how mineral evolution influences petrophysical behaviour.
Greensands are iron-rich sandstones dominated by the clay mineral glauconite, a member of the mica group. Other clay minerals such as chlorite, smectite, and illite are frequently present [1,2,3,4,5]. Glauconitic pellets form through a process called glauconitisation, in which K-poor smectite transforms into K-rich glauconite mica pellets during burial diagenesis [6].
As glauconitisation advances, potassium and iron contents increase within these pellets, while aluminium content decreases (Figure 1). The resulting sedimentary rock comprises a complex mixture of clay minerals, with diagenetic alterations that directly affect the texture and reservoir quality of greensands [6]. For example, transformations from smectite to illite or glauconite alter the cation-exchange capacity and permeability. The development of clay mineral coatings or pore-filling cements during diagenesis modifies both the intergranular cohesion and the pore-throat geometry, significantly affecting porosity and increasing surface area. Other clay minerals—chlorite, smectite, and illite—also play significant roles in the mineralogical and petrophysical behaviour of greensands. Chlorite generally occurs as a pore-filling and grain-coating material, whereas smectite and illite commonly exist as fine matrix minerals or mixed-layer clays (see, e.g., [1,2]). As shown in Figure 2, these minerals often act as grain coating or pore-filling phases, contributing to microporosity and reduced permeability.
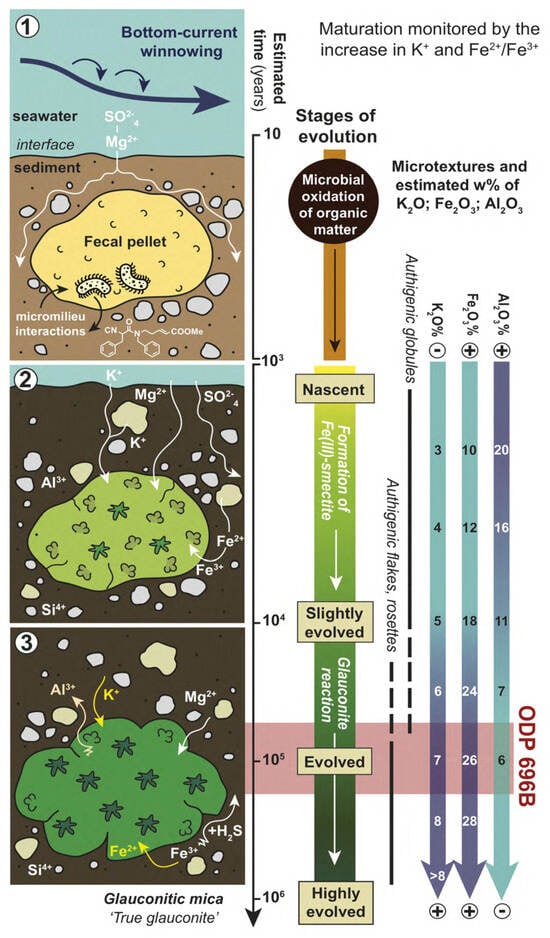
Figure 1.
Glauconitisation model in the studied grains (modified after López-Quirós et al. [28], following the concepts of Odin and Matter [29] and Baldermann et al. [30]). Adapted from López-Quirós et al. [31]. Nascent stage: After deposition at the seafloor, glauconite grains begin forming within semi-confined environments. Early pore networks start developing alongside the incorporation of detrital clay minerals. During this stage, dissolution of carbonate components occurs, and iron is primarily present as Fe3+-smectite precursors. Microbial oxidation of organic matter contributes to the early geochemical conditions, typically over a period of ~10–103 years. Slightly evolved stage: The grains mature as ions from the formation water re-accommodated within the mineral structure, promoting the neoformation of glauconitic smectite (G/S). Detrital minerals gradually diminish, coinciding with an increase in Fe and K ion content and the transformation of iron oxides to Fe2+ and Fe3+ forms. This stage generally spans ~103–104 years. Evolved stage: Continued recrystallisation and rearrangement of mineral composition result in more consolidated grains with the development of superficial cracks. Crystal growth accelerates particularly in the centre of the grain. The chemical composition evolves significantly as Si, Al in octahedral coordination (AlVI), Mg, Ca, and Na are progressively substituted by Al in tetrahedral coordination (AlIV), Fe (primarily Fe2+), and K. This reaction from Fe(III)–smectite to glauconite occurs over a period of between ~104 and 106 years. Highly evolved stage: At this final stage, a new generation of glauconitic minerals forms on the grain periphery, encapsulating the original glaucony pellets. This process involves advanced recrystallisation, leading to the development of glauconitic micas with distinctive microtextures, such as authigenic flakes and rosettes, indicative of full maturation.

Figure 2.
Diagram of greensand major grains and clay distribution types as grain-coating and -filling pore throats; glauconite exhibits microporosity [32].
2.2. Diagenetic Alteration and Textural Controls
Beyond mineral composition, the diagenetic evolution of greensands plays a critical role in shaping reservoir quality. This subsection examines grain morphology, cementation, and depositional textures that influence pore structure and connectivity.
Glauconite grains exhibit diverse morphologies, including spherical, ovoid, tabular, vermiform, and lobate shapes, and may be incorporated within microfossils [33]. These grains typically tend to be part of the rock framework rather than acting as a pore-filling phase, thereby reducing the pore-throat area and connectivity. Silica cement is typically present in glauconitic sandstones that strengthen the pore network but reduce the overall porosity. Carbonate (e.g., calcite) or berthierine cement may also occur locally, blocking intergranular pore throats. Some authors describe the glauconitic grains as having angular to subangular (i.e., irregular) shapes with highly rough surfaces. Sorting varies from locally poor to moderate, while packing ranges from moderately poor to a tight arrangement (e.g., [27,34,35,36]). Therefore, reservoir quality in greensands is principally controlled by their characteristic poor sorting, rough grain surfaces, and tight grain packing—features inherited from depositional conditions and modified by diagenesis. These textural heterogeneities lead to complex pore networks with restricted pore-throat sizes and reduced connectivity, especially where clay minerals are abundant.
These textural features are not only the result of diagenesis processes but are also inherited from the original depositional environment. As shown in Figure 1, greensand formation is closely tied to specific depositional environments, typically low-energy settings with slow sedimentation rates, such as outer shelf or upper slope conditions. These environments favour the authigenic development of glauconite through prolonged residence times at the sediment–water interface (i.e., glauconitisation), allowing gradual transformation of smectite precursors into mature glauconitic pellets [28,29]. The depositional setting also influences grain sorting, packing, and the abundance of detrital versus authigenic clay minerals, which in turn affect reservoir quality. Poor sorting and tight grain arrangements inherited from these environments contribute to reduced pore-throat connectivity. This, in turn, increases microporosity, as further described in the next subsection. Consequently, the depositional environment exerts a first-order control on the petrophysical behaviour of greensands, particularly porosity, permeability, and irreducible water saturation (Section 3.2, Section 3.3 and Section 3.4), which are essential for classifying greensand reservoir quality and guiding petrophysical model calibration. Finally, because glauconite functions simultaneously as a framework grain and a conductive clay phase, many standard petrophysical models that assume a strict partitioning between sand and clay fractions are not fully applicable to greensands.
2.3. Microstructure and Dual Porosity
The pore architecture of greensands is notably complex, characterised by a dual porosity system [1,34]. This subsection explores the distribution of macropores and micropores, their petrophysical implications, and challenges for reservoir evaluation.
Macroporosity corresponds to intergranular pore spaces between framework grains, whilst microporosity is mainly controlled by the presence of clay minerals—especially glauconite and chlorite—that create fine networks of isolated pores [34]. Microporosity is generally defined as pores smaller than 0.5 μm [37] and is linked to the high surface area contributed by detrital and authigenic clay minerals.
Figure 3 presents backscattered electron (BSE) images of two greensand samples, with a notable scale bar of 1 μm for micropores. The coexistence of macropores and micropores results in a bimodal pore-throat size distribution (PSD) (Figure 4). These micropores retain bound water, causing high irreducible water saturation [38,39]. This phenomenon presents critical implications for reservoir performance, including fluid storage capacity, flow characteristics, and hydrocarbon recovery strategies.

Figure 3.
(a) BSE image of the North Sea greensand; scale bar for greensand is 100 μm, and the image represents macroporosity. Q, quartz; Gl, glauconite; M, mica. (b) BSE glauconite grain image from Arnager greensand; scale bar for glauconite grain is 1 μm. Micropores reside within glauconite grain. Source: Hossain et al. [34]. © Society of Exploration Geophysicists (SEG). Reproduced with permission. DOI: https://doi.org/10.1190/1.3064151.

Figure 4.
NMR T2 curve distribution for greensand samples: (a) T2 spectra for three Well-A core plugs from a Late Paleocene/Early Eocene sandstone, North Sea [2]; (b) Nini field, North Sea [40]. © Society of Exploration Geophysicists (SEG). Reproduced with permission. DOI: https://doi.org/10.1190/geo2010-0366.1. A peak close to 1 ms represents microporosity, and a peak close to 100 ms represents macroporosity.
Because micropores are often isolated from the macropore network, effective porosity is reduced due to poor pore interconnectivity. However, this pore structure tends to preferentially retain water over hydrocarbons (a water-wet rock), which renders greensands economically viable reservoirs. From a pore-volume standpoint, microporosity largely controls key petrophysical properties such as capillary pressure, porosity, permeability, and water saturation. Additionally, abundant dispersed, laminated, or structurally incorporated clays commonly obstruct pore throats, further reducing effective porosity. This contributes to highly scattered and atypical porosity–permeability trends that differ significantly from those observed in clean sandstones (Figure 5). Such complexity poses considerable challenges for the evaluation and modelling of greensand reservoirs, requiring tailored workflows and calibration strategies to accurately assess reservoir quality.
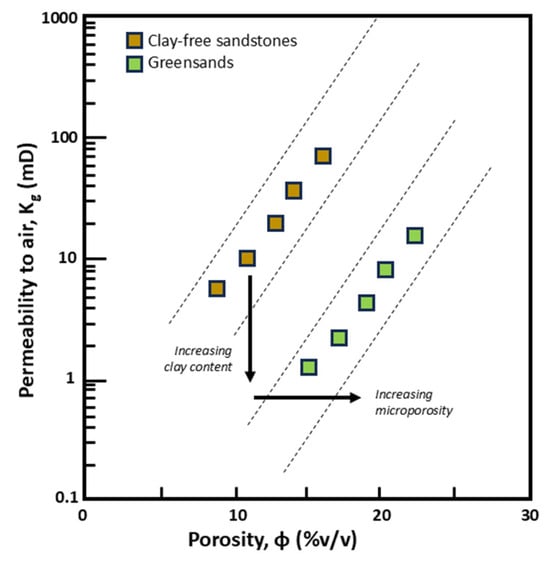
Figure 5.
Total porosity and air permeability cross-plot diagram showing the different trends of clay-free sandstones and greensands [32].
3. Greensand Measurement Challenges
3.1. Mineralogical Analysis
Petrographic analysis using transmitted and reflected light microscopy remains a fundamental tool in the mineralogical characterisation of reservoir rocks. This technique enables geologists to visually examine mineral grains, textures, and their spatial relationships at the microscopic scale. It provides direct insights into the identification of minerals, grain morphology, and diagenetic features, thereby complementing bulk analytical techniques such as X-ray diffraction (XRD). In particular, petrographic observations allow the discrimination of clay minerals based on optical properties such as birefringence, pleochroism, and interference colours, which are often indistinguishable by XRD alone. Furthermore, ternary diagrams plotting the relative proportions of key clay minerals—such as glauconite, chlorite, and smectite—are widely used to classify mineral assemblages and interpret diagenetic pathways in greensand reservoirs [31]. Such a mineralogical framework, integrating petrographic observations and quantitative analyses, supports the evaluation of reservoir quality and geological history by quantifying the relative abundance and interplay between these clay minerals. However, due to the greenish colour imparted by glauconite, these sandstones may be misidentified as containing other clays, such as odinite, clinochlore, or chamosite (all from the chlorite group), and berthierine (from the kaolin group). These minerals like glauconite, typically develop at a slow sedimentary deposition rate [41].
In addition, glauconite can be difficult to identify precisely by XRD because its basal reflections often overlap with those of other 10 Å lattice clay minerals, such as illite and mixed-layer clays [42,43,44,45,46,47]. Recent clay XRD studies have demonstrated that the deconvolution of ethylene glycol-treated samples and the detailed analysis of basal reflections provide a reliable means to distinguish glauconite from mixed-layer silicates, revealing its R3-ordered glauconite–smectite structure with minor expandable layers [31]. Therefore, XRD software tools must be appropriately calibrated to apply such deconvolution techniques effectively and prevent misinterpretation of clay minerals.
3.2. Porosity
Common porosity measurement methods include gas porosimetry based on Boyle’s law—typically using helium or nitrogen; brine porosity, determined by the Archimedes’ method using fully brine-saturated core samples [48]; and nuclear magnetic resonance (NMR) techniques, which measure the transverse relaxation time (T2) decay [49]. Gas porosimetry accurately measures both connected and microporous pore volumes due to the small molecular size of the gas, although some isolated pores may remain undetected. In contrast, brine porosity measurements can be influenced by the presence of clay-bound and irreducible water [48]. NMR porosity measurements are increasingly used because they can discriminate between fluid types within pore spaces and are non-invasive [50]. Moreover, laboratory technicians should report a drying protocol and a test for residual bound water and discuss the potential underestimation of pore volume when conventional drying is assumed to be complete.
Porosity measurement in greensand reservoirs is complicated by the presence of iron-rich clay minerals and heterogeneous pore systems. Hossain et al. [40] conclude that helium core porosity effectively measures total porosity because the molecular size of this inert gas is small enough to access the micropore network and clay-bound water. In contrast, the Archimedes method, applied to fully brine-saturated core plugs, measures effective porosity since the water molecule is larger than helium and cannot penetrate tightly bound pores. Their core NMR porosity closely matched the brine porosity, with an average absolute error of 2.88 porosity units (p.u.), and was significantly lower than the core helium porosity, with an average absolute error of 3.77 p.u. This finding matches Rueslatten et al.’s [2] studies on oil greensands, since glauconite is paramagnetic due to its iron content, which generates a shortened T2 relaxation time curve distribution, and it can also lead to surface relaxivity miscalculations for converting the NMR data to a PSD.
Because iron-bearing glauconite produces local magnetic-susceptibility contrasts and strong internal field gradients, empirical adjustments to T2 cut-off values have to be considered—typically between 10 and 30 milliseconds for oil reservoirs, according to Dodge et al. [1]—which is significantly lower than the conventional sandstone T2 cut-off of 33 milliseconds [50], but applying these lower thresholds without independent validation risks misclassification of bound versus free fluids when susceptibility-driven relaxation dominates. Empirical T2 thresholds can mask fundamental signal distortion caused by inhomogeneous magnetic susceptibility; therefore, reliance on such corrections should be stated explicitly as provisional pending physics-based models.
To reduce ambiguity and increase confidence in NMR-based porosity and PSD interpretations of glauconitic greensands, we recommend the following workflow: measure and report bulk magnetic susceptibility for core plugs and cuttings; report full NMR acquisition parameters and justify any T2 threshold or relaxivity adjustments; calibrate NMR-derived porosity and PSD against independent pore-scale measurements (helium porosity, brine-saturated/Archimedes porosity, MIP, µCT, and core NMR) and report calibration metrics; use complementary tests (comparison of brine and helium porosities, MIP/µCT constraints, and electrical conductivity measurements) to distinguish bound from free fluids; and, where feasible, adopt or test physics-based, susceptibility-aware NMR approaches (field-dependent relaxometry, susceptibility-corrected models, or joint inversions) rather than relying solely on empirical T2 cut-offs—these steps document the limits of empirical corrections and provide a pathway to more physically consistent NMR interpretations in greensand systems.
3.3. Permeability
Permeability in greensands exhibits highly scattered trends when plotted against porosity, reflecting the complex pore structure and clay distribution (Figure 5). The presence of mixed clay minerals—especially glauconite and chlorite—substantially affects permeability by coating grain surfaces and plugging pore throats, thus reducing interconnected flow pathways. The pore-throat space of a rock can be measured with the specific surface area (SSA), and clay minerals generally display moderate to high SSA values (see Table 2), which correlate with their greater microporosity and lower permeability. Hossain et al. [40] reported a range of SSA from 17 to 23 m2/g through nitrogen adsorption (the SSA of quartz is ~2.5 m2/g) and found an inverse relationship with the macroporosity and permeability. Hossain and Zhou [51] show a relationship between porosity and permeability, with the SSA discriminated by the greensand’s pore-filling clay distribution.
Table 2.
Cation-exchange capacity range and total surface area for clay minerals (from Navarro-Perez et al. [52]; adapted from Van Olphen and Fripiat [53]; McPhee et al. [48]).
Several researchers have developed innovative methodologies to determine the permeability of greensand in the subsurface by calibrating well-log data using core measurements. The discrimination of iron content, rock matrix density, and NMR parameters is important to define an optimised permeability prediction. Table 3 summarises the main permeability equations in the literature used for greensands. The Kozeny, Timur–Coates, and SDR equations are most frequently applied, either in their classical or modified style. The latter two, NMR-based permeability models, have been developed to integrate relaxation and diffusion properties; these approaches show promise for more reliable permeability estimation in clay-rich reservoirs by accounting for pore-size heterogeneity and clay influence. Further information on the methods for permeability estimation for greensands in the literature is displayed in Table 4. Moreover, permeability predictions based on total SSA must be reconsidered in glauconitic systems because a portion of the surface is associated with hydraulically ineffective microporosity and bound water; models using Kozeny require filtering or redefinitions in their inputs.
Table 3.
Permeability equations applied for greensand reservoirs.
Table 4.
Permeability estimation methods found in the literature review used on greensand reservoirs.
3.4. Irreducible Water Saturation
Since greensands have a complex microstructure due to the presence of clay, it is expected that the irreducible water saturation (Swirr) and the capillary pressure curves will be high (Figure 6). The glauconitic grains are water-wet [16], favouring storing water in the micropore range and leaving hydrocarbon in the macropore range (Figure 7). Table 5 summarises reported values for the irreducible water saturation in greensands, with values of up to 78% v/v, according to the literature.

Figure 6.
Capillary pressure and water saturation cross-plot comparing clay-free sandstone and greensand trends [32].

Figure 7.
NMR T2 distribution diagram comparing clay-free sandstone and greensand distributions [32].
Table 5.
Irreducible water saturation values found in greensands worldwide along with the technique used to define them.
As previously stated in Section 3.2, the iron content in greensands affects the NMR T2 readings and hence the estimated Swirr; that is why the authors mentioned in Table 5 used lower T2 cut-off values. Dodge et al. [1] suggest that the T2 cut-off value needs to be lower than 10 ms to quantify Swirr [38]. Typical T2 cut-off values of 33 ms for free mobile fluid and 3 ms for clay-bound water for greensand reservoirs are incorrect for greensands. The T2 decays faster due to the iron paramagnetic properties and narrower pore-size distribution; thus, the T2 cut-off value must be lowered (e.g., [59]). Hossain et al. [40] went further, and using the capillary pressure curves, they defined a cut-off value of 100 psig to separate the microporosity from the meso- and macroporosity zone equivalent to a T2 cut-off value of 5.21 ms.
Furthermore, the gas–water permeability curve for greensands is expected to shift to the right (Figure 8) owing to the high Swirr and its microporosity portion. The water relative permeability curve will start at a moderate to high Swirr and effectively flow from 2% of krw onwards [60]. In comparison, the gas relative permeability curve will start at 100% krg and reach a small value of residual gas saturation (1-Srg), where the remaining hydrocarbon gets trapped.

Figure 8.
Gas–water relative permeability and water saturation cross-plot comparing the trend of clay-free sandstones (continuous line) and greensands (dashed line). Krg is gas relative permeability, Krw is water relative permeability, Swirr is irreducible water saturation, and Srg is residual gas saturation [32].
3.5. Water Saturation Modelling
Greensands often have high rock conductivity due to the significant cation-exchange capacity of glauconitic grains. Weaver [61] reports values from 5 to 12 meq/100 gr for glauconites with up to 5% expandable clays, and with 50% expandable layers, CEC values reach up to 40 meq/100 gr. Patchett et al. [8] reports values from 7.8 to 32.4 meq/100 gr (13 to 81% glauconite). In contrast, values for greensand deep resistivity logs range from 1 to 5 ohm·m [19,38,62]. Since these values are low, a reservoir can be confused with freshwater rather than a hydrocarbon zone.
Greensands are referred to as low-resistivity pays, according to the definition by Worthington [63] (p.78): “a lack of useful positive contrast in measured electrical resistivity between zones that contain and produce hydrocarbons in commercial quantities and zones that contain and produce only water, within the same reservoir system”. Sneider [64] uses the term “low-resistivity, low-contrast” (LRLC) to refer to sandstones with very low resistivities (<2 ohms·m) that have low contrast in resistivity with adjacent shales. Excess clay minerals, fine grains, and microporosity are some of the leading causes of low-resistivity pays, which are features of greensands.
Archie [9], Waxman–Smits [11], and Simandoux [65] are the three models used frequently for greensands worldwide (Table 6 and Table 7). Waxman–Smits is the main representative of the double-layer models and uses the cation-exchange capacity parameter. Simandoux represents Vsh models since it adds a shaley term. The Vsh models are based on the wetted-shale/clay volume fraction, meaning that they implicitly assume that the electrical properties of clays, independent of how they are distributed in sandstones, are the same as the layers of the detrital clay adjacent to the sandstones. The advantage of using them is that shale/clay parameters can be estimated from log data alone [10].
Table 6.
Water saturation models used on greensands from literature.
Table 7.
Water saturation models expressed in conductivity terms used in greensands.
The double-layer models offer a better scientific understanding of the rock’s electrical behaviour. However, they require core data to calibrate their terms, such as Qv, for log-derived parameters (e.g., [48]). It is important to note that these water saturation models—Archie, Simandoux, and Waxman–Smits—do not use glauconitic sandstones as empirical data for their postulates, so care should be taken when applying them to other rock-type reservoirs such as greensands.
4. Impact of Greensand Well Logs
The interpretation of well logs in greensand reservoirs poses significant challenges due to their complex mineralogical and petrophysical characteristics (see Table 8). A prominent issue is the notably high gamma-ray response, primarily attributed to the elevated potassium content in glauconite. This can be misinterpreted as shaliness, resulting in overestimation of clay volume if standard clay or shale cut-offs are applied. Spectral gamma-ray logs are especially valuable where available. In particular, K/Th ratios combined with the photoelectric factor log can be employed to identify glauconite [70].
Table 8.
Summary table showing how greensand affects well-log readings and which petrophysical properties are consequently under- or overestimated.
Due to the greensand effect observed in well logs, core analysis is essential for reliable calibration and petrophysical model development. For example, as shown in Figure 9, the Hermod and Ty formations display the lowest resistivity readings and minimal density–neutron separation, even though core helium porosity and permeability indicate that these intervals remain permeable (permeability greater than 200 mD) and porous (porosity between 38 and 43% v/v).

Figure 9.
Nini-1 well logs showing the greensand reservoirs intervals (Hermod and Ty sands from the North Sea): (a) gamma-ray log; (b) porosity logs: bulk density, neutron porosity, and helium porosity from core analysis; (c) resistivity log; and (d) permeability log (using Kozeny’s equation) from core analysis [26].
Figure 10 presents a schematic summary of typical well-log responses, illustrating the gas effect in clay-free sandstones (neutron–density crossover) and its absence in greensands. Electrical resistivity logs often produce deceptively low values in glauconitic formations. The high cation-exchange capacity of clay minerals, together with clay-bound and capillary-bound water, enhances the rock’s electrical conductivity, resulting in resistivity readings that may underestimate hydrocarbon saturation and complicate petrophysical interpretations.

Figure 10.
Diagram of conventional well-log responses in quartz sandstone and greensand formations, from left to right: gamma-ray log (GR), deep resistivity log (Rdeep), neutron log (NEU), bulk density log (DEN), and photoelectric factor log (PEF) [32].
Neutron logs tend to overestimate porosity and fluid content due to the significant hydrogen content in iron-rich clay minerals and the associated bound water. Conversely, bulk density logs frequently underestimate porosity, as the higher density of glauconitic and chloritic minerals biases measurements upward. The increased mineral density thus reduces calculated porosity when standard matrix density values are used.
Nuclear magnetic resonance (NMR) logging underestimates mobile fluid volumes because iron-bearing clays increase surface relaxivity, causing rapid decay of NMR signals—seen as shorter T2 relaxation times. Combined with the dominance of microporosity-hosted fluids, this impedes effective discrimination between movable and bound fluids if conventional T2 cut-off values are used [1,2,38].
5. Interpretation Framework for Greensand Reservoirs
5.1. Greensands’ Petrophysical Controls
The literature identifies four key controls (Figure 11) that underpin porosity, permeability, water saturation, and electrical behaviour in these formations. These controls are interrelated and manifest at both the grain and pore scale, shaping the overall petrophysical signature of greensands. First, the presence of glauconite and associated clay minerals, including chlorite and illite/smectite, exerts a dominant influence. These minerals may be embedded in the framework or occur as pore linings and fillings, directly contributing to heterogeneity in rock texture and anisotropy in physical properties. This mineralogical composition modifies lithological identification, pay zone identification, and permeability characterisation. Their distribution influences grain packing, introduces paramagnetism, and reduces the reliability of standard well-log interpretation techniques.

Figure 11.
Conceptual framework of petrophysical controls in greensand formations as identified through literature review [32].
Second, microporosity—often defined by pore-throat diameters smaller than 1 μm—is a ubiquitous feature in glauconitic grains. These micropores frequently lack connectivity with macropores, reducing effective porosity and flow potential. However, they preferentially retain water over hydrocarbons due to strong capillary forces and water-wet rock conditions. Thus, microporosity impacts reservoir quality, fluid distribution, and Swirr estimations. Third, the specific surface area (SSA) of greensands is high due to the abundance of fine-grained clays and poorly sorted textures. SSA is directly proportional to microporosity and inversely related to permeability and porosity. This relationship challenges upscaling efforts from core to log data and contributes to misleading poro–perm correlations unless mineralogy is explicitly considered.
Fourth, electrical conductivity induced by clay minerals introduces a secondary current path in resistivity measurements. These conductive clays react electrochemically with formation water, particularly under low-salinity conditions, through cation-exchange mechanisms. The presence of glauconite, which exhibits a moderate to high CEC, increases this conductivity and distorts resistivity-derived saturation calculations. As a result, models based on Archie’s law tend to overestimate Sw unless compensated with shale/clay-based models such as Waxman–Smits or Simandoux. These four petrophysical controls—mineralogical heterogeneity, microporosity, high SSA, and clay conductivity—must be accounted for in any reliable interpretation workflow for greensand reservoirs. Neglecting them not only compromises reservoir characterisation but also affects volumetric estimates, net pay quantification, and ultimately development decisions.
5.2. Interpretation Workflows and Tool Recommendations
Interpretation workflows in greensand formations must begin with a careful selection of tools that respond appropriately to their mineralogical and pore-scale complexity. Table 9 outlines these challenges and offers recommended approaches across four categories: (1) lithology identification, (2) porosity estimation, (3) saturation and electrical properties, and (4) permeability determination.
Table 9.
Challenges and recommended tools for reservoir property estimation in greensands [32].
Lithology identification in greensands is complicated by the response of gamma-ray and density–neutron logs to glauconite and other clays. Traditional indicators like spontaneous potential and gamma-ray logs are influenced by high potassium and iron contents, often leading to lithological misclassification. To improve discrimination, tools such as the photoelectric factor (PEF) and spectral gamma-ray logs are recommended. Elemental spectroscopy tools like ECS (Elemental Capture Spectroscopy) offer further refinements by quantifying elemental composition, including iron, silicon, and potassium, which can distinguish glauconitic from other clay-rich zones [71]. Integrating core mineralogy with these logs significantly enhances lithological models. However, defining petrofacies remains challenging due to scattered porosity–permeability trends. Capillary pressure curves and pore-size distribution (PSD) analysis can help clarify pore-throat geometries, and acoustic logs may serve as proxies for reservoir quality in texturally heterogeneous intervals [25].
Porosity estimation is equally complex due to the bimodal distribution and high microporosity in glauconitic sands. Conventional porosity logs—neutron, density, and sonic—must be calibrated against core porosity data, preferably derived from helium expansion or brine saturation methods. NMR tools such as CMR (Combinable Magnetic Resonance) can characterise free-fluid and bound-water volumes and differentiate pore systems. However, the paramagnetic effect of glauconite—due to its iron content—shortens T2 relaxation times, requiring careful adjustment of cut-off values to avoid underestimating mobile porosity [1,2]. To strengthen interpretation, complementary laboratory techniques such as mercury intrusion porosimetry (MIP) and micro-computed tomography (µCT) are recommended, as they provide independent pore-size distribution data and can help validate NMR-derived porosity estimates. In some cases, µCT may also assist in estimating glauconite content if density contrast permits.
Saturation and electrical properties are strongly affected by clay conductivity and water-wet rock behaviour. Greensands often require modified saturation models, such as Waxman–Smits or Simandoux, since Archie’s model typically underestimates Sw due to the additional conductive path introduced by clays. Core-based measurements of cation-exchange capacity (CEC), multi-salinity tests, and capillary pressure curves (e.g., mercury injection capillary pressure, MICP) are vital for calibrating saturation models. These measurements reveal elevated irreducible water saturation and steep capillary pressure profiles, both of which reflect the dominance of micropores in storing formation water [47].
Permeability estimation also demands a combined approach. While NMR-based models such as Timur–Coates or SDR provide log-derived permeability estimates, their accuracy is limited in greensands without calibration. The presence of pore-blocking authigenic clays and cementation reduces pore-throat connectivity, often leading to significant permeability impairment, particularly under low-salinity conditions where clay swelling or migration may occur. Laboratory-determined gas or brine permeability remains essential for ground-truthing log responses. Empirical models, including Kozeny’s [57] equation, must be applied cautiously, with a clear understanding of their assumptions and limits.
Finally, geomechanical logging—derived from acoustic and sonic data—can further refine reservoir quality interpretation. These measurements provide information on elastic properties, fracture propagation, and rock brittleness, offering additional insight into stress sensitivity and completion design. In moderately to well-consolidated greensand units, P-impedance and acoustic velocity data can effectively discriminate between productive and non-productive intervals [25].
6. Conclusions and Perspectives
In this review, we synthesised extensive research on the petrophysical controls governing greensand reservoirs, emphasising their distinct mineralogical and pore-scale complexities. Our study confirms that glauconite and associated clay minerals significantly influence porosity, permeability, and water saturation measurements, often leading to challenges in conventional well-log interpretation and reservoir characterisation.
Traditional petrophysical models commonly applied to sandstones frequently fail to accommodate the paramagnetic and conductive effects imparted by glauconite’s iron content and high cation-exchange capacity. This commonly results in over- or underestimation of key reservoir parameters, such as porosity and fluid saturations, when standard log interpretations are used without tailored calibrations. Consequently, core analysis remains an indispensable tool for validating log-derived petrophysical properties and developing robust interpretation frameworks.
To improve reservoir evaluation accuracy in greensand contexts, it is important to recognise that glauconite behaves as a conductive, microporous framework mineral with significant magnetic susceptibility and bound water. Integrated workflows are therefore recommended, combining spectral gamma-ray, NMR with provisional adjusted T2 cut-offs validated against independent measurements, and shale–sand saturation models like Waxman–Smits or Simandoux, calibrated against core and laboratory data from core NMR, MICP, CT, and XRD/mineralogical analysis. These combined approaches help mitigate the misleading effects caused by glauconitic minerals and fine clays, thereby enhancing pay zone identification and net reservoir quality assessments. We also recommend explicit testing of model assumptions and mandatory reporting of key supporting data, including XRD-derived mineral fractions, petrographic modal analysis, bulk magnetic susceptibility, drying protocol, and the rationale for any empirical T2 or relaxivity adjustments, before applying standard petrophysical models.
Looking forward, future research should prioritise comprehensive core–log–digital rock physics integration to better quantify the impact of mineral heterogeneity and diagenesis on reservoir properties. The development of rock-typing algorithms and machine learning workflows tailored specifically to greensand mineralogy and pore systems holds promise to refine petrophysical models further. Additionally, examining the influence of geochemical and environmental factors on glauconite stability and reservoir quality will support improved predictive capabilities under variable production conditions.
Given the increasing exploration interest in greensand reservoirs worldwide, greater collaboration between academia, industry practitioners, and technology innovators is essential to evolve interpretation standards and deploy best practices. By embracing the unique petrophysical nature of greensands and advancing specialised tools and workflows, the petroleum sector can enhance hydrocarbon recovery efficiencies and optimise reservoir management in these complex lithologies.
Author Contributions
Conceptualisation, D.N.-P.; methodology, D.N.-P.; data curation, D.N.-P.; writing—original draft preparation, D.N.-P.; writing—review and editing, Q.F., P.L., A.V.A. and J.V.P.; visualisation, D.N.-P.; funding acquisition, D.N.-P. All authors have read and agreed to the published version of the manuscript.
Funding
This research work was funded by the Agencia Nacional de Investigación y Desarrollo de Chile (ANID) and the scholarship programme Doctorado en el Extranjero Becas Chile (Grant No. 2018-72190176). The APC was funded by the Facultad de Ingeniería, Universidad de Magallanes, Chile.
Acknowledgments
This work is derived from the first author’s doctoral research conducted at the University of Leeds. The author, D.N., acknowledges the support provided by Facultad de Ingeniería of the Universidad de Magallanes.
Conflicts of Interest
Authors Aníbal Velásquez Arauna was employed by the company ENAP Magallanes and Jose Valderrama Puerto was employed by the company ENAP SIPETROL S.A. The remaining authors declare that the research was conducted in the absence of any commercial or financial relationships that could be construed as a potential conflict of interest.
References
- Dodge, W.S.; Shafer, J.L.; Klimentidis, R.E. Capillary pressure: The key to producible porosity. In Proceedings of the 37th SPWLA Annual Logging Symposium, New Orleans, LA, USA, 16–19 June 1996; p. SPWLA-1996-J. [Google Scholar]
- Rueslåtten, H.; Eidsemo, T.; Slot-Petersen, C. NMR studies of iron-rich sandstone oil reservoir. In Proceedings of the International Symposium of Society of Core Analysts, The Hague, The Netherlands, 14–16 September 1998; p. SCA-9821. [Google Scholar]
- Durand, C.; Cerepi, A.; Brosse, E. Effect of pore-lining chlorite on petrophysical properties of low-resistivity sandstone reservoir. In Proceedings of the 2000 SPE Annual Technical Conference and Exhibition, Dallas, TX, USA, 1–4 October 2000; p. SPE-63070. [Google Scholar] [CrossRef]
- Bansal, U.; Banerjee, S.; Nagendra, R. Is the rarity of glauconite in Precambrian Bhuima Basin in India related to its chloritization? Precambrian Res. 2020, 336, 105509. [Google Scholar] [CrossRef]
- Thompson, G.R.; Hower, J. The mineralogy of glauconite. Clays Clay Miner. 1975, 23, 289–300. [Google Scholar] [CrossRef]
- Odin, G.S.; Letolle, R. Glauconitisation and phosphatization environments: A tentative comparison. SEPM Spec. Publ. 1980, 29, 227–237. [Google Scholar]
- Harder, H. Boron content of sediments as a tool in facies analysis. Sediment. Geol. 1969, 4, 153–175. [Google Scholar] [CrossRef]
- Patchett, J.G.; Wiley, R.; El Bahr, M. Modeling the effects of glauconite on some openhole logs from the lower Senonian in Egypt. In Proceedings of the SPWLA 34th Annual Logging Symposium, Calgary, AB, Canada, 13–16 June 1993; p. SWPLA-1993-RR. [Google Scholar]
- Archie, G.E. The electrical resistivity log as an aid in determining some reservoir characteristics. Trans. AIME 1942, 146, 54–62. [Google Scholar] [CrossRef]
- Worthington, P.F. The evolution of shaly-sand concepts in reservoir evaluation. Log Anal. 1985, 26, 23–40. [Google Scholar]
- Waxman, M.H.; Smits, L.J.M. Electrical conductivities in oil-bearing shaly sands. Soc. Pet. Eng. J. 1968, 8, 107–122. [Google Scholar] [CrossRef]
- Clavier, C.; Coates, G.; Dumanoir, J. Theoretical and experimental bases for the dual-water model for interpretation of shaly sands. Soc. Pet. Eng. J. 1984, 24, 153–167. [Google Scholar] [CrossRef]
- Worthington, P.F. Net pay—What is it? What does it do? How do we quantify it? How do we use it? In Proceedings of the SPE Asia Pacific Oil and Gas Conference & Exhibition. Jakarta, Indonesia, 4–6 August 2009; p. SPE-123561. [Google Scholar] [CrossRef]
- Hatcher, G.B.; Chen, H.; Rahman, S.S.; Hogg, P.F. Evaluating formation damage risks in a glauconitic sandstone reservoir: A case history from the offshore North West Shelef of Australia. In Proceedings of the SPE Asia Pacific Oil and Gas Conference, Adelaide, Australia, 28–31 October 1996; p. SPE-37014. [Google Scholar] [CrossRef]
- Zhang, Y.; Salisch, H.A.; Arns, C. Permeability evaluation in a glauconite-rich formation in the Carnarvon Basin, Western Australia. Geophysics 2000, 65, 46–53. [Google Scholar] [CrossRef]
- Thomas, W.H.; Ringen, J.K.; Rasch, S.O. Effect of glauconite on petrophysical properties as revealed by core analysis. In Proceedings of the International Symposium of the Society of Core Analysts, Pau, France, 21–24 September 2003; p. SCA2003-32. [Google Scholar]
- Klein, J.D.; Little, L.; Scheihing, M.; Seifert, D. Formation evaluation and permeability prediction in a highly heterogeneous reservoir: The Kuparuk C-Sand. In Proceedings of the SWPLA 47th Annual Logging Symposium, Veracruz, Mexico, 4–7 June 2006; p. SPWLA-2006-FFF. [Google Scholar]
- Hossain, Z. Rock-Physics Modelling of the North Sea Greensand. Ph.D. Thesis, Technical University of Denmark, Kongens Lyngby, Denmark, 2011. [Google Scholar]
- Prayoga, O.A.; Wicaksono, B.; Setyoko, S.; Wibowo, A.; Wijaksono, E.; Sulistyono; Momem, M.; Zulmi, I. Integrated analysis for reservoir characterization of low resistivity glauconitic shaly sand reservoir of Miocene Ngryong Sandstone: Implications for saturation modelling at low contrast hydrocarbon pay zone. In Proceedings of the 2nd SPWLA Asia Pacific Technical Symposium, Bogor, Indonesia, 26–27 November 2018; p. SPWLA-2018-1810. [Google Scholar]
- Nong, K.; Chen, S.; Ren, Z.; Zeng, M. Analysis on glauconite research trends based on citespace knowledge graph. Minerals 2024, 14, 1260. [Google Scholar] [CrossRef]
- Dasi, E.; Rudmin, M.; Banerjee, S. Glauconite applications in agriculture: A review of recent advances. Appl. Clay Sci. 2024, 253, 107368. [Google Scholar] [CrossRef]
- Broger, K.; Syhlonyk, G. Glauconite sandstone exploration: A case study from the Lake Newell project, Southern Alberta, Canada. In Proceedings of the AAPG Annual Convention, Denver, CO, USA, 12–15 June 1994. [Google Scholar]
- Taber, D.R.; Vickers, M.K.; Winn, R.D., Jr. The definition of the Albian ‘A’ Sand reservoir fairway and aspects of associated gas accumulation in the North Celtic Sea Basin. Geol. Soc. Lond. Spec. Publ. 1995, 93, 227–244. [Google Scholar] [CrossRef]
- Garamendi, R.; Atau, H. Estrategia de explotacion en reservorios de bajo restablecimiento de presion. In Proceedings of the INGEPET 1999, Lima, Peru, 26–29 October 1999. [Google Scholar]
- Diaz, E.; Prasad, M.; Mavko, G.; Dvorkin, J. Effect of glauconite on the elastic properties, porosity and permeability of reservoir rocks. Lead. Edge 2003, 22, 42–45. [Google Scholar] [CrossRef]
- Hossain, Z.; Grattoni, C.A.; Solymar, M.; Fabricius, I.L. Petrophysical properties of greensand as predicted from NMR measurements. Pet. Geosci. 2011, 17, 111–125. [Google Scholar] [CrossRef]
- Yang, X.F.; Ma, Z.Z.; Zhou, Y.B.; Zhang, Z.W.; Liu, Y.M.; Wang, D.D.; Zhao, Y.B. Reservoir characteristics and hydrocarbon accumulation of the glauconitic sandstone in the Tarapoa Block, Oriente Basin, Ecuador. J. Pet. Sci. Eng. 2019, 173, 558–568. [Google Scholar] [CrossRef]
- López-Quirós, A.; Escutia, C.; Sánchez-Navas, A.; Nieto, F.; Garcia-Casco, A.; Martín-Algarra, A.; Evangelinos, D.; Salabarnada, A. Glaucony authigenesis, maturity and alteration in the Weddell Sea: An indicator of paleoenvironmental conditions before the onset of Antarctic glaciation. Sci. Rep. 2019, 9, 13580. [Google Scholar] [CrossRef]
- Odin, G.S.; Matter, A. De glauconiarum origin. Sedimentology 1981, 28, 611–641. [Google Scholar] [CrossRef]
- Baldermann, A.; Warr, L.N.; Grathoff, G.H.; Dietzel, M. The rate and mechanism of deep-sea glauconite formation at the Ivory Coast-Ghana marginal ridge. Clays Clay Miner. 2013, 61, 258–276. [Google Scholar] [CrossRef]
- López-Quirós, A.; Sánchez-Navas, A.; Nieto, F.; Escutia, C. New insights into the nature of glauconite. Am. Mineral. 2020, 105, 674–686. [Google Scholar] [CrossRef]
- Navarro-Perez, D.J. Improved Reservoir Characterisation of a Chilean Tight Sandstone Reservoir. Ph.D. Thesis, University of Leeds, Leeds, UK, 2024. [Google Scholar]
- Wilson, L.; Wilson, M.J.; Green, J.; Patey, I. The influence of clay mineralogy on formation damage in North Sea reservoir sandstone: A review with illustrative examples. Earth-Sci. Rev. 2014, 134, 70–80. [Google Scholar] [CrossRef]
- Hossain, Z.; Fabricius, I.L.; Christense, H.F. Elastic and nonelastic deformation of greensand. Lead. Edge 2009, 28, 86–88. [Google Scholar] [CrossRef]
- Atahualpa, G. Efecto de la Glauconita en las Propiedades Petrofísicas del Reservorio Arenisca “T” Superior del Bloque Tarapoa. Bachelor’s Thesis, Universidad Central de Ecuador, Quito, Ecuador, 2013. [Google Scholar]
- Guanochanga, J. Modelo Geológico, Caracterización Petrofísica y Cálculo de Reservas, en la Arenisca “T” Superior del Campo Mariann 4A y Mariann Norte en el Bloque Tarapoa. Bachelor’s Thesis, Universidad Central de Ecuador, Quito, Ecuador, 2013. [Google Scholar]
- Pittman, E.D. Porosity, diagenesis and productive capability of sandstone reservoirs. Soc. Econ. Paleontol. Mineral. (SEPM) Spec. Publ. 1979, 26, 159–173. [Google Scholar]
- Slot-Petersen, C.; Eidesmo, T.; White, J.; Rueslatten, H.G. NMR formation evaluation applications in a complex low-resistivity hydrocarbon reservoir. In Proceedings of the SPWLA 39th Annual Logging Symposium, Keystone, CO, USA, 26–29 May 1998; p. SPWLA-1998-TT. [Google Scholar]
- Markley, M.; Seminario, F.; Gabulle, J.; Luquez, J. Microporosity and laminations in Non-Archie reservoirs create challenges for water-saturation computation and reserves evaluation: Camisea, Peru. In Proceedings of the SPE Latin American & Caribbean Petroleum Engineering Conference, Lima, Peru, 1–3 December 2010; p. SPE-139424. [Google Scholar] [CrossRef]
- Hossain, Z.; Mukerji, T.; Dvorkin, J.; Fabricius, I.L. Rock physics model of glauconite greensand from the North Sea. Geophysics 2011, 76, E199–E209. [Google Scholar] [CrossRef]
- Hugget, J.M. Glauconites. In Encyclopedia of Geology; Alderton, D., Scott, A.E., Eds.; Academy Press: Cambridge, MA, USA, 2021; pp. 334–340. [Google Scholar]
- Burst, J.F. Mineral heterogeneity in “glauconite pellets”. Am. Mineral. J. Earth Planet. Mater. 1958, 43, 481–497. [Google Scholar]
- Hower, J. Some factors concerning the nature and origin of glauconite. Am. Mineral. J. Earth Planet. Mater. 1961, 46, 313–334. [Google Scholar]
- Cimbalnikova, A. Chemical variability and structural heterogeneity of glauconites. Am. Mineral. J. Earth Planet. Mater. 1971, 56, 1385–1392. [Google Scholar]
- Cimbalnikova, A. Influence of 10Å/14Å interlayering on the layer charge of glauconites. Am. Mineral. J. Earth Planet. Mater. 1971, 56, 1393–1398. [Google Scholar]
- Abudelgawad, G.; Page, A.L.; Lund, L.J. Chemical weathering of glauconite. Soil Sci. Soc. Am. J. 1975, 39, 567–571. [Google Scholar] [CrossRef]
- El-Amamy, M.M.; Page, A.L.; Abudelgawad, G. Chemical and mineralogical properties of glauconitic soils as related to potassium depletion. Soil Sci. Soc. Am. J. 1982, 46, 426–430. [Google Scholar] [CrossRef]
- McPhee, C.; Reed, J.; Zubizarreta, I. Core Analysis: A Best Practice Guide, 64; Elsevier: Amsterdam, The Netherlands, 2015. [Google Scholar]
- Navarro-Perez, D. Quantifying the porosity of natural reservoirs with nuclear magnetic resonance. Nat. Rev. Earth Environ. 2023, 4, 599. [Google Scholar] [CrossRef]
- Coates, G.R.; Xiao, L.; Prammer, M.G. NMR Logging Principles and Applications; Elsevier Science: Houston, TX, USA, 1999. [Google Scholar]
- Hossain, Z.; Zhou, Y. Petrophysics and rock physics modeling of diagenetically altered sandstone. Interpretation 2015, 3, 107–120. [Google Scholar] [CrossRef]
- Navarro-Perez, D.; Fisher, Q.; Allshorn, S.; Grattoni, C.; Lorinczi, P. Multi-salinity core flooding study in clay-bearing sandstones, a contribution to geothermal reservoir characterisation. Adv. Geosci. 2024, 62, 71–80. [Google Scholar] [CrossRef]
- Van Olphen, H.; Fripiat, J.J. Data handbook for clay materials and other non-metallic minerals. Soil Sci. 1979, 131, 62. [Google Scholar] [CrossRef]
- Timur, A. An investigation of permeability, porosity, and residual water saturation relationships. In Proceedings of the SPWLA 9th Annual Logging Symposium, New Orleans, LA, USA, 23–26 June 1968; p. SPWLA-1968-J. [Google Scholar]
- Kenyon, W.E. Petrophysical principals of applications of NMR logging. Log ASnal. 1997, 38, 21–43. [Google Scholar]
- Kozeny, J. Ueber kapillare Litung des Wassers im Boden. Sitz.-Berichte Der Kais. Akad. Der Wiss. Wien 1927, 136, 271–306. [Google Scholar]
- Hossain, Z.; Cohen, A.J. Relationship among porosity, permeaility, electrical and elastic properties. In Proceedings of the 2012 SEG Annual Meeting, Las Vegas, NV, USA, 4–9 November 2012; p. SEG-2012-1496. [Google Scholar]
- Zhang, Y.J.; Lollback, P.A.; Rojahn, J.S.; Salisch, H.A.; Stuart, W.J. A methodology for estimating permeability from well logs in a formation of complex lithology. In Proceedings of the SPE Asia Pacific Oil and Gas Conference and Exhibition, Adelaide, Australia, 28–31 October 1996; p. SPE-37025-MS. [Google Scholar] [CrossRef]
- Simpson, G.A.; Fishman, N.S.; Hari-Roy, S. New Nuclear Magnetic Resonance Log T2 Cut-off Interpret Parameters for the Unconventional Tight Oil of the Bakken Petroleum System Using 2-D NMR Core Laboratory Measurements on Native State and Post-Cleaned Core Samples. In Proceedings of the SPWLA 59th Annual Logging Symposium, London, UK, 2–6 June 2018; p. SPWLA-2018-GGGG. [Google Scholar]
- Cluff, R.M.; Byrnes, A.P. Relative permeability in tight gas sandstone reservoirs—The “permeability jail” model. In Proceedings of the SPWLA 51st Annual Logging Symposium, Perth, Australia, 19–23 June 2010; p. SPWLA-20120-58470. [Google Scholar]
- Weaver, C.E. Clays, Muds, and Shales; Elsevier: Amsterdam, The Netherlands, 1989. [Google Scholar]
- Pratama, E.; Ismail, M.S.; Ridha, S. An integrated workflow to characterize and evaluate low resistivity pay and its phenomenon in a sandstone reservoir. J. Geophys. Eng. 2017, 14, 513–519. [Google Scholar] [CrossRef]
- Worthington, P.F. Recognition and evaluation of low-resistivity pay. Pet. Geosci. 2000, 6, 77–92. [Google Scholar] [CrossRef]
- Sneider, R.M. Worldwide examples of low resistivity pay. Houst. Geol. Soc. Bull. 2003, 45, 47–59. [Google Scholar]
- Bardon, C.; Pied, B. Formation water saturation in shaly sands. In Proceedings of the SWPLA 10th Annual Logging Symposium, Houston, TX, USA, 25–28 May 1969; p. SWPLA-1969-Z. [Google Scholar]
- Hossain, Z.; Mukerji, T.; Fabricius, I.L. Vp-Vs relationship and amplitude variation with offset modeling of glauconitic greensand. Geophys. Prospect. 2012, 60, 117–137. [Google Scholar] [CrossRef]
- Gonzalez-Gonzalez, A.; Valderrama, J.M.; Gschaider, C.T.; Carcamo, R.A.; Verdugo-Dobronic, M.; Canessa, N.D.; Perez-Perez, A.; Velasquez-Arauna, A.; Sanchez-Ojeda, J.; Ahumada-Villar, M.; et al. Desarrollo del play tight gas zona glauconitica, Bloque Arenal, Cuenca de Magallanes—Chile: Caso estudio. In Proceedings of the 10° Congreso de Exploracion y Desarrollo de Hidrocarburos, Mendoza, Argentina, 5–9 November 2018. [Google Scholar]
- Aimar, E.; Cevallos, M.; Cangini, A.; Mas-Cattapan, F.; Vega, V. Extension y desarrollo de los reservorios de baja permeabilidad del yacimiento Campo Indio, Formación Magallanes (Maastricchtiano Tardío-Daniano), Cuenca Austral Argentina. In Proceedings of the 10° Congreso de Exploracion y Desarrollo de Hidrocarburos, Mendoza, Argentina, 5–9 November 2018. [Google Scholar]
- Kennedy, W.D.; Herrick, D.C. Conductivity models for Archie rocks. Geophysics 2012, 77, WA109–WA128. [Google Scholar] [CrossRef]
- Eslinger, E.; Pevear, D. Clay Minerals for Petroleum Geologists and Engineers, SEPM Short Course 22; Society for Sedumentary Geology: Tulsa, OK, USA, 1988. [Google Scholar]
- Schlumberger. ECS Elemental Capture Spectroscopy Sonde. 2006. Available online: https://www.slb.com/-/media/files/fe/brochure/ecs-brochure (accessed on 26 February 2021).
Disclaimer/Publisher’s Note: The statements, opinions and data contained in all publications are solely those of the individual author(s) and contributor(s) and not of MDPI and/or the editor(s). MDPI and/or the editor(s) disclaim responsibility for any injury to people or property resulting from any ideas, methods, instructions or products referred to in the content. |
© 2025 by the authors. Licensee MDPI, Basel, Switzerland. This article is an open access article distributed under the terms and conditions of the Creative Commons Attribution (CC BY) license (https://creativecommons.org/licenses/by/4.0/).