Abstract
This study examines the influence of tectonically induced mineralogical and microfabric changes on the strength of different rocks within the Hanzel Fault Damage Zone (FDZ) in the Tethyan Himalayas, Pakistan. Integrating field observations, petrographic analysis, and laboratory experiments (uniaxial compressive strength (UCS), Brazilian tensile strength (BTS), ultrasonic pulse-wave velocity (UPV), and porosity), this study systematically characterizes the spatial variations in intact rock strength across horizontal distance from the fault core to the outer limit of the FDZ. Seven rock units—granites (biotite granite, leucogranite schist, granodiorite schist, and diorite) and amphibolites (foliated amphibolite, amphibolite, and plagioclase amphibolite)—were sampled at varying distances (−500 to +4035 m) from the fault core. Results reveal that proximity to the fault core correlates with significant strength reductions (40%–70%): granitic rocks exhibit lower UCS (41–59 MPa) and BTS (4.8–6.7 MPa) compared to distal amphibolites and diorites UCS (75–107 MPa) and BTS (10–13.67 MPa). Petrographic analysis identifies key factors that reduce strength, including high mica content (up to 33%), pervasive micro-fracturing, S-C fabrics, and mineral alteration. These features increase porosity (up to 1.21%) and reduce UPV (2867–3315 m/s) in fault-proximal rocks. Moderate inverse relationships (R2 = 0.68–0.72) between mica percentage and UCS/UPV confirm phyllosilicates as primary strength controls. The spatial variation in rock strength is attributed to ductile–brittle deformation processes, with foliated or schistose textures increasing in proximity to the fault core. This study demonstrates that tectonic processes significantly influence the mineralogy and microfabric within FDZs, leading to variations in rock strength with direct implications for stability in tectonically active regions.
1. Introduction
Fault damage zones (FDZs) are critical structural components of crustal faults, characterized by a specific architecture that influences rock strength, deformation behavior, and fluid flow in the upper crust [1]. A typical FDZ consists of two primary elements: the fault core and the surrounding damage zone (Figure 1). The fault core is the high-strain area where the main displacement occurs, often containing fault gouge, cataclasite, and mylonites. Surrounding this core is the damage zone, characterized by a network of penetrative tectonic structures [1,2]. These structures can be classified into two categories: primary tectonic structures, which include breccias, shear joints, and subsidiary faults, and secondary tectonic structures, such as veins, reactivation joints, and clay mineralization [1]. The intensity of fracturing and fabric development within the FDZ progressively increases toward the high-strain fault core [1,2]. The spatial extent and architecture of an FDZ can range from tens to hundreds of meters and are influenced by factors such as lithology, displacement magnitude, pre-existing fabric, and depth-related conditions like temperature and fluid pressure [2,3]. Therefore, a comprehensive understanding of rock mechanical properties across FDZs is crucial for evaluating infrastructure resilience in tectonically active regions.
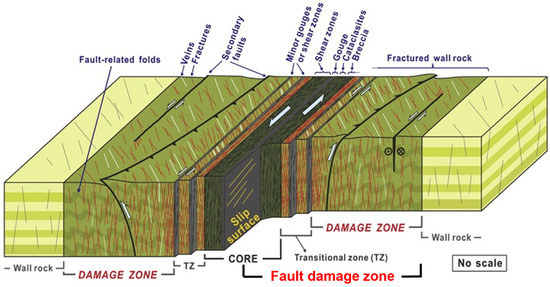
Figure 1.
Block diagram of FDZ across a fault (modified after [1]). This figure illustrates the architecture of the FDZ, including the fault core and surrounding damage zone, and highlights how structural and geological changes are distributed spatially.
Generally, the mechanical properties of rocks are influenced by both geological properties and environmental and tectonic factors [4,5,6,7]. In the case of metamorphic rocks associated with FDZs, intact rock strength is strongly influenced by tectonic factors [6,7,8]. This is due to later-stage mineralogical and microfabric changes induced by tectonic stresses. The microfabric refers to the spatial arrangement of minerals, grain boundaries, micro-tectonic fractures, foliations/schistosity, and other textural features (grain size, shape, etc.) that have developed during formation and subsequent tectonic history. Several investigations have established the relationship between these microfabric parameters and the mechanical properties of rocks [5,7,9,10,11,12]. For instance, studies have identified mineral composition as a dominant feature in determining rock strength and deformation characteristics [13,14]. Specifically, phyllosilicate minerals like micas (biotite and muscovite) diminish rock strength by creating mechanically weak discontinuities along their sheet-like crystal structure [11,12], which serves as anisotropy in these rocks [10]. Ali et al. (2020) found that tectonic stresses cause S-C fabrics (where S refers to asymmetric crenulated cleavages and C represents the prominent crenulation cleavage), which create planes of weakness and significantly affect rock strength characteristics [6]. Additionally, Sajid et al. (2016) demonstrated that increased porosity and water absorption resulting from mineralogical changes reduce the strength of rocks [9]. Several other studies focusing on intact rock texture have found that grain size, shape, degree of interlocking, type of contacts, and spatial arrangement all influence rock strength and deformation behavior [13,15]. Micro-fractures are another important petrographic feature that affect porosity [7,8], p-wave velocity [16], and the strength of rocks [16,17]. Overall, at the microscopic scale, FDZ development involves the growth of microcracks [7,8], changes in the original fabric [6], dynamic recrystallization, and alteration of minerals [7,9]. These petrographic features, developed through millions of years of deformation, metamorphism, and tectonic stresses, ultimately create anisotropy that significantly affects rock strength characteristics [6,7,8]. Beyond these anisotropy observables—as determined through petrographic study—the petrophysical properties of rocks, such as ultrasonic pulse-wave velocity and porosity, are also critical indicators of structural integrity, durability, and susceptibility to degradation [18,19,20]. Thus, for understanding the tectonic implications on intact rock strength, characterization and quantification of these properties, along with detailed petrography, are necessary.
Despite significant advances in understanding FDZ architecture and rock anisotropy, a critical knowledge gap exists regarding the quantification of and spatial variation in intact rock strength parameters within FDZs. Previous studies have established that the interplay between fractures and anisotropic rock fabrics controls deformation and failure processes in crustal rocks [6,7,8,10,12]; however, the systematic characterization of strength parameters spatially, from the fault core to the outer boundary of the FDZs, remains limited, particularly in the Tethyan Himalayas Sequence (THS), which represents an exceptional geological setting for investigating the relationship between tectonic deformation and rock strength parameters. The THS has experienced a complex deformation history spanning multiple orogenic phases [21], resulting in well-developed fault systems (Figure 1) with clearly defined FDZs that exhibit gradational changes in deformation intensity. Recent studies have also highlighted the influence of tectonic processes on rock fracturing and mechanical properties. For example, Li et al. (2025) demonstrated that natural tectonic fractures in low-permeability conglomerates can significantly enhance reservoir pore space and serve as critical fluid conduits [22]. Likewise, investigations of FDZs show that the wall rocks adjacent to major faults often experience intense fracturing and associated strength reduction due to repeated tectonic activity [23]. Additionally, the spatial variability in rock strength within FDZs affects not only the suitability of materials for construction purposes but also the design parameters for foundations, tunnels, and other critical infrastructure components [24,25,26,27,28]. These findings underscore a broad, renewed interest in how tectonic history governs rock strength and fracture networks, thereby providing important context and motivation for our study.
Building on the identified knowledge gaps regarding spatial variations in rock strength within the FDZs, this research aims to systematically characterize the relationship between tectonically induced mineralogical and microfabric changes and the mechanical properties of different rocks in the Tethyan Himalayas, Pakistan. This study employs a multidisciplinary approach, combining field observations, petrographic analysis, and laboratory testing to achieve three primary objectives. Firstly, we aim to investigate tectonically induced mineralogical and microfabric changes and alterations in various rocks within the FDZ. Secondly, this study seeks to quantify the influence of these tectonically induced petrographic features on both petrophysical (UPV, porosity, and weathering grade) and geomechanical (UCS, BTS, and SHR) properties of granite and amphibolite. Thirdly, we aim to characterize the spatial variation in intact rock strength parameters from the fault core to the edge of the FDZ. This objective addresses the critical knowledge gap regarding how strength parameters evolve across the FDZ and has been achieved through systematic sampling and testing of specimens collected along transects perpendicular to the fault plane. The novelty of this research lies in its systematic investigation of strength variations across a well-defined deformation gradient, contrasting with previous studies that have typically focused on either the mechanical properties of anisotropic rocks under controlled laboratory conditions or the structural characteristics of FDZs without detailed mechanical characterization. By bridging this gap, this study will provide valuable insights into the complex interplay between tectonic processes, microstructural evolution, and rock strength, with significant implications for both the fundamental understanding of FDZ mechanics and practical applications in engineering geology and infrastructure development in tectonically active regions.
2. Regional Geology and Tectonics
The regional geology of northern Pakistan is highly complex, comprising three significant tectonic domains: the Eurasian, Tethyan, and Indian domains, as illustrated in Figure 1. The study area is situated in the Kohistan Island Arcs (KIA), which is regarded as a key unit of the Tethyan domain. Kohistan Island Arc and Ladakh Island Arc (KLIA) are sandwiched between the Eurasian plate to the north and the Indian plate to the south. The Nanga Parbat Syntaxes (NPS) divide the KIA and LIA into western and eastern arcs, respectively. The continuous subduction of the Indian plate under Eurasia gives rise to major features, such as the Main Karakorum Thrust (MKT) to the north and the Main Mantle Thrust (MMT) to the south, respectively [29]. Crustal compression, underthrusting, subduction, and the subsequent crustal thickness and uplifting at a rate of 1 cm/yr result in several other brittle and ductile deformation features [30,31]. Particularly, the geology of KIA is complex, consisting of metavolcanic, metasedimentary, plutonic, and sedimentary rocks of Quaternary to Cretaceous age (Figure 2).
The Kohistan batholith almost intruded into all the rock units of the KIA [21]. The batholith comprises a wide range of lithologies, from hornblendite to leucogranite, but is predominantly composed of gabbroic rocks, including gabbroic diorite, as well as granite or trondhjemite. Batholithic intrusions are mostly small–medium to medium–large volume plutons with significant vertical and horizontal dimensions. Intrusive bodies also take the form of sills, dykes, sheets, lopoliths, and other smaller geometries. Petterson [32] reported three main phases of the batholith intrusion. The earlier foliated gabbrodiorites and quartz monzodiorites (102–85 Ma), followed by a second phase of undeformed gabbros, diorites, and granites with a mafic to acidic trend (85–40 Ma). The last stage is swarms of calcite, leucogranitic sheets, and dykes (34–29 Ma). These three distinct phases of batholithic intrusion can be differentiated by the presence or absence of well-developed penetrative fabrics, with earlier gneissic-like gabbros and granitoids intruded by undeformed plutons that in turn were intruded by late granite sheets. The batholith is largely intrusive into the Chalt Volcanic Group (CVG) and the Jaglot Group, a metasedimentary-dominated unit [21,33].

Figure 2.
Geology and tectonics of the Tethyan Himalayas in northern Pakistan (after [34]). BS = Besham Syntax, MBT = Main Boundary Thrust, MCT = Main Central Thrust, MMT = Main Mantle Thrust, MKT = Main Karakoram Thrust, NPS = Nanga Parbat Syntax, KIA = Kohistan Island Arc, LIA = Ladakh Island Arc, and KKH = Karakoram Highway.
3. Study Area
The Hanzel oblique-slip fault (HF) damage zone of the study area lies within the CVG of KIA (Figure 2). The fault shows sinistral (left-lateral) strike-slip motion, with the north block displaced westward relative to the south block (Figure 3). The CVG consists of rock units from the Hunza and Ghizer Formations, including metabasites, rhyolite flows, dacites, andesite, conglomerates, tuffs, and breccias. The geological characteristics of this area have been extensively documented in previous studies [21,32,33]. The study area is characterized by rock units like amphibolites, granodiorites, schist, diorites, biotite granites, and leucogranite schist (Figure 2). Late Jurassic to early Cretaceous amphibolites (metabasites) in the study area are the protoliths of island-arc basalt and exhibit a calc-alkaline differentiation trend [21]. The age of these rock units is presented in Table 1.

Table 1.
Age of different rocks in the study area (after [35,36]).
Petterson (1985) and other authors [35,36] attribute the granodiorite schist as the first phase (102–85 Ma), while diorite and biotite granites in the study area are the second phase of batholith magmatism (85–40 Ma), and leucogranites are the third and last stage of magmatism (34–29 Ma). Amphibolites, granodiorites, and leucogranites in the study area show schistosity/foliations at a large scale, although some non-foliated amphibolites are also present. The HF and shear zones associated with the deformation process are presented in Figure 3a and cross-section Figure 3b. This complex deformation history has resulted in overprinting relationships between different fabric elements, providing an opportunity to assess how the mechanical properties of rocks evolve in response to progressive and multiphase deformation. The geological map of the study area was developed and reinterpreted following the Hanzel Hydro Power Project (HHP) feasibility report and Searle et al. [37].

Figure 3.
(a) Geology and structures across the study area fault damage zone (after [37]); and (b) cross-section A-A’ from (a).
4. Materials and Methods
4.1. Field Investigations and Sampling
A comprehensive field survey was designed to record macroscopic observations of the rock mass and collect samples for laboratory testing. To access the implications of active tectonics-associated deformation on intact rock petrophysical and geomechanical properties, an integrated methodology was devised (Figure 4). The fault core is taken as the reference point (0 m), while sampling sites were selected based on the following: (1) various distance intervals from the fault core; and (2) covering different rock units of various ages. To study the tectonic impacts on intact rock petrophysical and geomechanical properties, a total of 30 bulk representative samples from seven rock units were taken across the horizontal distance of the FDZ. For four non-foliated rocks, twelve samples were collected (4 × 3), while in the case of three foliated rocks, eighteen samples were taken both parallel (3 × 3) and perpendicular (3 × 3) to foliations. Three block samples per unit ensured representative fabric heterogeneity. The Hanzel biotite granite (HBG) samples were collected from the northwest block at −500 m. In contrast, all other samples were taken from the southwest block (+), where maximum deformation (ductile–brittle) is depicted. The horizontal distance of Hanzel leucogranite schist (HLS) is 550 m, while Hanzel granodiorite schist (HGS) is 660 m. Hanzel foliated amphibolite (HFA) sample distance from the fault core is 2975 m. Hanzel plagioclase-rich amphibolite (HPA) and Hanzel amphibolite (HZA) are at 3845 m and 3950 m, respectively. The Hanzel diorite (HZD) samples were collected at a distance of about 4035 m from the fault core. HPA and beyond samples were collected from outside of the observed ductile deformation zone (3810 m).
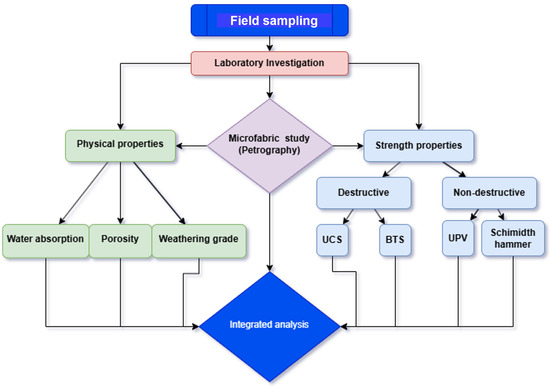
Figure 4.
Workflow diagram of this study outlining the step-by-step procedure of rock mechanics testing program and integrated analysis.
For petrographic examination, a total of 14 (7 × 2) representative bulk samples were collected from the same rock units. Details of sampling and mesoscopic field observations at each site are given in Table 2. The survey recorded general logging descriptions, including color, rock type, rock wall strength, joints (both shear and tensional joints), and weathering conditions. Joint set orientation (dip/dip direction) was also focused on at each site to map shear deformation (Table 2). J1 and J2 are the shear joints formed parallel to the main fault and shear zones, whereas J3 and J4 are reactivation and tensional joints across the FDZ.
4.2. Laboratory Investigations
To examine the intact rock properties, the petrophysical tests—including porosity and ultrasonic pulse-wave velocity (UPV)—were conducted. The UPV tests examined the effect of tectonic deformation on homogeneity, crack presence, and void space [18]. To analyze the effect of tectonically induced changes on geomechanical properties, tests such as uniaxial compressive strength (UCS), Brazilian tensile strength (BTS), as well as non-destructive Schmidt hammer rebound (SHR), were conducted. UCS and BTS were obtained from core cylinders and disc samples, whereas Schmidt hammer rebounds were measured at field outcrops per standards (ASTM D5873-14) [38]. Foliated rocks create strong directional dependencies on strength [10,11]; therefore, in the case of foliated granitic rocks (HLS and HGS) and amphibolite (HFA), three samples were taken parallel, while three were taken perpendicular to foliations/schistosity. The angle between the applied load and foliation in the parallel and perpendicular directions was maintained at 0° and 90°, respectively. For the UCS and BTS of samples, a semi-automatic machine (45-C7022/S), (Controls s.p.a, Liscate, Italy) was used (Figure 5a,b). Moreover, all ASTM protocols (ASTM C170-90 [39], ASTM D2938 [40], and ASTM D3976 [41]) were followed during sample preparation and testing. Harrison’s [42]) approach was adopted to calculate porosity from core cylinders. UPV was tested on cores using a 58-E4800 portable tester (Controls s.p.a, Liscate, Italy), which is equipped with 54 kHz transducers (Figure 5c). The protocols for UPV (ASTM D2845-08 [43]) testing were followed appropriately.
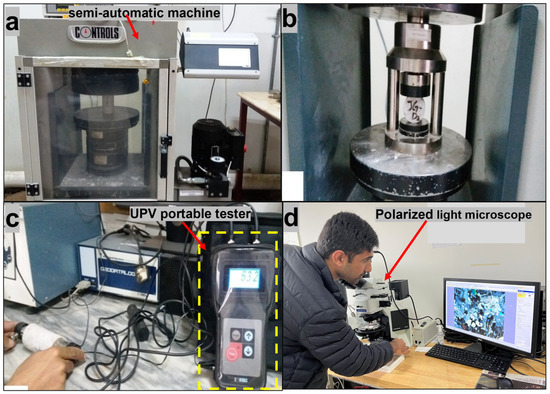
Figure 5.
Laboratory photographs: (a) UCS testing in the laboratory; (b) BTS test on disc cores; (c) UPV on core samples using portable tester; (d) petrographic study under microscope.
Table 2.
Mesoscopic rock mass observations and details of samples collected during the fieldwork.
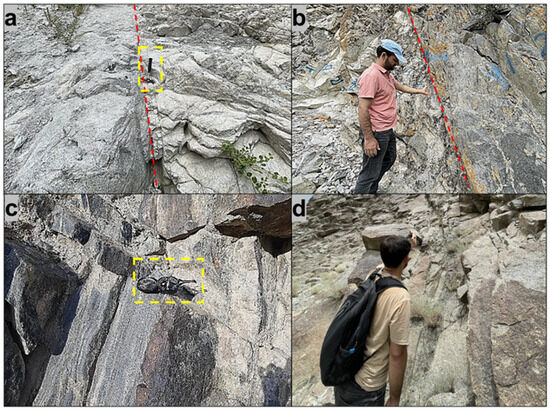
Figure 6.
Filed photographs: (a) intrusive contact between Hanzel biotite granite (HBG) and Hanzel leucogranite schist (HLS), geological hammer for scale; (b) sharp intrusive contact between Hanzel leucogranite schist (HLS) and Hanzel granodiorite schist (HGS); (c) Hanzel foliated amphibolite (HFA) outcrop view, compass for scale; (d) Hanzel diorite (HZD) outcrop view.
Table 2.
Mesoscopic rock mass observations and details of samples collected during the fieldwork.
| Rock Type | Abbreviation | Sample Distance from Fault Core (m) | Mean Joint Orientation | Mesoscopic Rock Mass Observations |
|---|---|---|---|---|
| Hanzel biotite granite | HBG | −500 | J1 142°/70°, J2 333°/66°, J3 034°/61° | This rock unit is greenish/grayish white, medium- to coarse-grained, hard, massive but blocky at places (Figure 6a). It is moderately to highly weathered, highly fractured, well-jointed, and sheared at places. Outcrops have quartz veins and lenses in places. |
| Hanzel leucogranite schist | HLS | 550 | J2 326°/71°, J3 052°/51°, J4 230°/67° | It has intrusive contact downstream granodiorite schist (Figure 6b). Mesoscopically, the HLS is white with almost no dark minerals. This rock is slightly to moderately weathered, medium-hard to hard, and fractured in places. |
| Hanzel granodiorite schist | HGS | 660 | J1 170°/69°, J2 289°/73°, J3 054°/58° | HGS has a sharp contact with HLS (Figure 6b). It is slightly weathered, jointed, and hard to very hard rock. The HGS indicates several shear zones (Figure 6b). Foliations/schistosity are also noted where HGS is in sharp contact with HLS. |
| Hanzel foliated amphibolite | HFA | 2975 | J1 115°/69°, J2 297°/83°, J3 039°/70°, J4 219°/30° | Mesoscopically, it is mostly uniform; however, foliated in some places (Figure 6c). Prominent alteration is also noted in the field, which forms the banded appearance of the rock on site (Figure 6c). The altered rocks are mostly chloritized, exhibiting a greenish to brown appearance in the field, and show low- to medium-grade metamorphism associated with the alteration process. |
| Hanzel amphibolite | HZA | 3845 | J1 138°/69°, J2 296°/64°, J3 039°/62°, J4 206°/51° | Amphibolite is brownish gray, fine- to coarse-grained, hard to very hard, slightly weathered, fractured at places, well-jointed, joints are interlocked with each other, and good exposures are present. |
| Hanzel plagioclase amphibolite | HPA | 3950 | ||
| Hanzel diorite | HZD | 4035 | J1 107°/52°, J3 042° 45°, J4 193°/70° | Mesoscopically, fresh to slightly weathered, medium-strong to strong, moderately spaced to widely spaced, jointed and fractured at places (Figure 6d). It displays half-dark and half white-grayish color. |
Petrographic examination was conducted to evaluate the nature and extent of the relationship between tectonically induced petrographic changes and strength properties. A total of 14 thin sections (2 × 7) were made following ASTM standards (C1721-09 [44]). Detailed petrographic characterization involves optical microscopy to document mineralogical composition and microfabric elements (e.g., mineral ratios, grain size, shape, alignment, micro-fractures, S-C fabrics, mineral deformation, recrystallization textures, and alteration products). The primary focus of the microscopic analysis was on identifying key features that reduce strength, which develop as a result of tectonic processes. Thin sections of petrographic analysis were taken under 4× and 10× lenses with plain and cross-Nicols light (Figure 5d). Rocks were characterized into different types based on petrography and modal mineralogy. To analyze various strength parameters (e.g., porosity, mica%, UCS, BTS, UPV, SHR), a Pearson correlation heat map was developed. This provides quantitative relationships among different petrographic, physical, and rock strength properties.
5. Results
5.1. Petrographic Examination
Petrographically, all samples were examined across the FDZ horizontal distance from the fault core. Table 3, alongside Figure 7 and Figure 8 below, presents the modal mineralogy of rock samples. Overall, the hand specimen’s color, texture, modal composition, and petrographic microfeatures show variability due to differentiation in the parent magma, later metamorphism, and the effects of ductile and brittle deformation. Based on detailed petrographic studies, the rock samples are categorized into granitic rocks (Hanzel biotite granite (HBG), Hanzel leucogranite gneiss (HLS), Hanzel granodiorite schist (HGS), and Hanzel diorite (HZD)), and amphibolites/metabasites (Hanzel foliated amphibolite (HFA), Hanzel amphibolite (HZA), and Hanzel plagioclase amphibolite (HPA)). Microscopically, near the fault core to the edge of the FDZ, tectonically induced fabric changes in rock units are evaluated and presented in the following sections.
Table 3.
Modal mineralogy of rock samples across the horizontal distance of the FDZ.
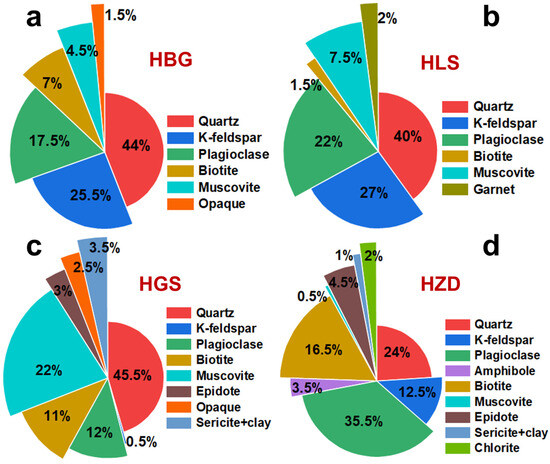
Figure 7.
Modal minerology of rock samples: (a) Hanzel biotite granite (HBG); (b) Hanzel leucogranite schist (HLS); (c) Hanzel granodiorite schist (HGS); and (d) Hanzel diorite (HZD).
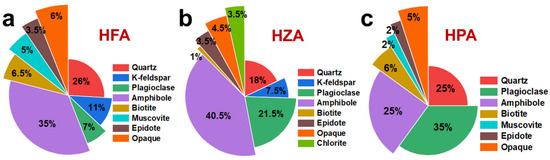
Figure 8.
Modal minerology of rock samples: (a) Hanzel foliated amphibolite (HFA); (b) Hanzel amphibolite (HZA); and (c) Hanzel plagioclase amphibolite (HPA).
5.1.1. Hanzel Biotite Granite
The Hanzel biotite granite (HBG) is microscopically white with dark spots showing slight (II) weathering conditions (Figure 9a). It has a medium- to coarse-grained, fissured, cataclastic texture (32% porphyroclasts; 68% matrix) with subhedral to anhedral mineral grains (Figure 9b). This depicts mechanical crushing of ground mass (matrix/cataclasite). Mica weak sheet minerals are present in a considerable amount (11.5%), which provides weak planes for failure upon loading [6,12]. The quartz exhibits strained/undulose extinction and dynamic recrystallization, which indicates lattice distortion and deformation due to a close shear zone. The role of increasing porosity and weakening strength by this process is evident in a previous study [9]. Plagioclase shows polysynthetic twinning while k-feldspar displays Carlsbad twinning (Figure 9b). Inter- and intra-granular tectonically induced fractures are frequent. In comparison, some fractures are calcite- or muscovite-filled (Figure 9c). These fractures increase solubility and enhance porosity and permeability [7]. The HBG represents granite-derived cataclasite formed in a brittle–ductile transition zone, with evidence of syn- to post-tectonic fluid infiltrations.
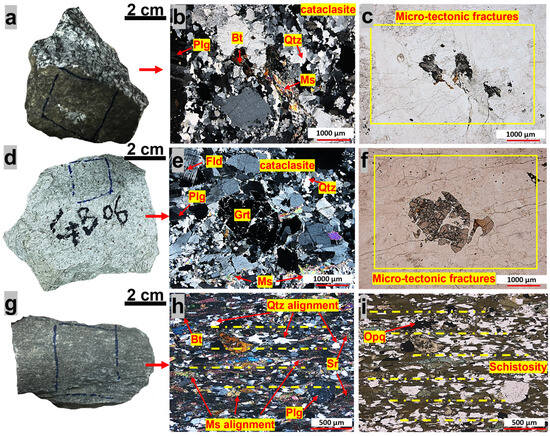
Figure 9.
Hand specimens and microphotographs: (a) Hanzel biotite granite (HBG) hand specimen; (b) cross-polarized view of HBG; (c) plane-polarized view showing inter- and intra-granular micro-tectonic fracture in HBG; (d) Hanzel leucogranite gneiss (HLS) hand specimen; (e) cross-polarized view of HLS; (f) plane-polarized view showing inter- and intra-granular micro-tectonic fracture in HLS; (g) Hanzel granodiorite schist (HGS) hand specimen; (h) cross-polarized view of HGS; and (i) plane-polarized view showing schistosity in HFG. Plg = Plagioclase, Bt = Biotite, Qtz = Quartz, Ms = Muscovite, Fld = Alkali Feldspar, Grt = Garnet, Opq = Opaque.
5.1.2. Hanzel Leucogranite Schist
Microscopically, leucogranite has medium- to coarse-grained anhedral to euhedral texture and a schistose structure (Figure 9d). It exhibits slight weathering in the thin section. It is primarily composed of K-feldspar, plagioclase, quartz, muscovite, and biotite (Table 3 and Figure 7). Garnet is distributed throughout as a minor constituent (2%), indicating high-temperature and high-pressure conditions of magmatism. In contrast, intracrystalline fractures are developed, partially filled by fine-grained biotite flakes (Figure 9e). About 9% of mica occurs as platy crystals, which provide weak failure planes in HLS (Figure 9e). K-feldspar occurs as anhedral tabular grains displaying grid twinning, intracrystalline fractures, and minor argillization (Figure 9e). Quartz grains are strained and exhibit parallel extinction. At the same time, some are found as small patches (Figure 9e). Subhedral to anhedral plagioclase displays polysynthetic twinning, with occasional apatite grains occurring as inclusions on crustal surfaces. Frequent, intense micro-fracturing is evident in plane-polarized light, which subsequently provides sufficient space for porosity (Figure 9f). The petrography features of HLS align with those of an orthogneiss derived from granitoid precursors, subjected to medium-grade metamorphism and subsequent brittle–ductile deformation.
5.1.3. Hanzel Granodiorite Schist
Hanzel granodiorite schist (HGS) exhibits a lepidogranoblastic texture and schistose structure, characterized by a light gray color under moderate (III) weathering conditions (Figure 9g). It features a fine- to medium-grain size with subhedral to anhedral grains. The primary mineral composition of the HGS is quartz, plagioclase, biotite, muscovite, with a significant amount of secondary minerals (sericite and clays) and opaque minerals (Figure 7 and Table 3). Quartz, muscovite, and biotite exhibit preferred orientation, defining foliations or schistosity (Figure 9h,i). Both flaky, weak mica minerals (33%) create alignment that creates anisotropic weakness planes and defines primary schistosity (S1 fabric). According to Waqas et al. [10], such anisotropies in metamorphic rocks affect strength. About 22.0% of anhedral quartz grains show strong strain extinction. At the same time, microstructures such as sub-grain development and straightened grain boundaries (indicating boundary migration recrystallization) were also observed (Figure 9h). These microstructures suggest syn-kinematic sub-grain rotation and recrystallization during shearing, accompanied by post-tectonic retrograde alteration. K-feldspar is pervasively altered to clay and sericite minerals with partial argillization and irregular fracturing (Figure 9h). Chlorite is present as an alteration product of biotite.
5.1.4. Hanzel Diorite
Hanzel diorite (HZD) exhibits a coarse-grained, subhedral to anhedral hypidiomorphic texture. It displays half dark and half white-grayish colors in the hand specimen (Figure 10a). Quartz (24%), k-feldspar (12.5%), plagioclase (35.5%), biotite (16.5%), amphibole (3.5%), epidote (4.5%), and secondary minerals (3%) are found in varying amounts depicting differentiation of magma (Figure 7). The epidote, muscovite/sericite, and chlorite occur as an alteration product of plagioclase and biotite, respectively (Figure 10b,c). The plagioclase is zoned, saussuritized, and at places, cut by secondary veins of epidote ± quartz (Figure 10b). Biotite is poikilitic, enclosing quartz and ore, and altered to chlorite (±epidote) on the margins and along the cleavage planes. At some places, k-feldspar shows alteration to clays and mica. Micro-fractures are comparatively few in the rock fabric (Figure 10c).
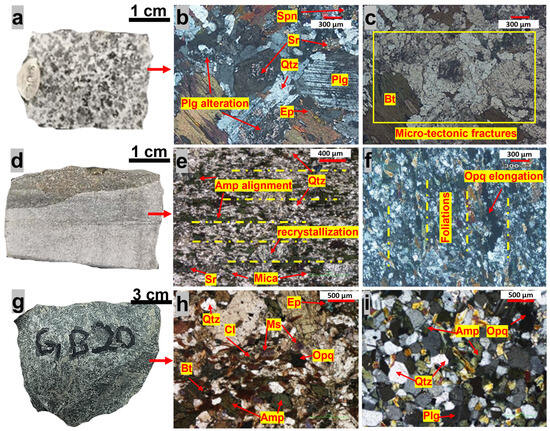
Figure 10.
Hand specimens and microphotographs: (a) Hanzel diorite (HZD) hand specimen; (b) cross-polarized view of HZD; (c) plane-polarized view showing inter- and intra-granular micro-tectonic fracture in HZD; (d) Hanzel foliated amphibolite (HFA) hand specimen; (e) cross-polarized view of HFA depicting quartz and amphibolite alignment and dynamic recrystallization of plagioclase; (f) showing opaque elongation and foliations in HFA; (g) Hanzel amphibolite (HZA) hand specimen; (h) cross-polarized view of HZA; and (i) cross-polarized view of fresh fabric of Hanzel plagioclase amphibolite (HPA). Spn = Sphene, Sr = Sericite, Ep = Epidote, Cl = Chlorite, Amp = Amphibole, Plg = Plagioclase, Bt = Biotite, Qtz = Quartz, Ms = Muscovite, Opq = Opaque.
5.1.5. Hanzel Foliated Amphibolite
Microscopically, Hanzel foliated amphibolite (HFA) is dark gray, having a fine-grained foliated texture (Figure 10d). Amphibole, quartz, feldspar, and plagioclase are major minerals, and are present in varying percentages (Figure 8 and Table 3). Quartz and amphibole have a preferred orientation that defines foliation or banding in the rock (Figure 10e,f). Quartz porphyroblasts are scattered in the matrix, while about 20% of the quartz is strained. The foliations are also clearly marked by the alignment of micaceous minerals (Figure 10e). Furthermore, moderate micro-fractures and S-C fabrics indicate shear deformation of HFA. Overall, weak mica sheets and clay minerals are present in a perceptible amount. S-C fabrics, mica, and clay minerals provide anisotropies [6,10]. Some minor amount of biotite has been altered to sphene. Some ore grains are also aligned in the direction of foliation. At the same time, others are equant and enclosed within quartz and amphibole (Figure 10f). Alteration of micas to clay minerals is also observed in the thin section (Figure 10e). Opaque minerals (6%) and epidote (about 6%) are also present in the modal mineralogy.
5.1.6. Hanzel Amphibolite
Hanzel amphibolite (HZA) shows medium- to coarse-grained anhedral to subhedral texture with a dark gray to green color (Figure 10g). The thin section study shows slight (Grade II) weathering conditions. At the same time, foliations are absent in the samples. The major mineral compositions are amphibole (40.5%), quartz (18%), and plagioclase (21.5%), while k-feldspar (7.5%) is present in a minor percentage (Table 3). Quartz is fresh and unstrained. In addition, a considerable amount of epidote, chloride, biotite, and opaque minerals are also present (Figure 10h). However, few inter- and intra-granular discontinuities are present in the microfabric of the rock (Figure 10h).
5.1.7. Hanzel Plagioclase Amphibolite
The Hanzel amphibolite (HPA) is fine-grained, plagioclase-rich, and greenish gray. Essential minerals are plagioclase (35%), amphibole (25%), quartz (25%), biotite (6%), and muscovite (2%). Opaque minerals (6%) and epidote (2%) are also present in modal mineralogy (Figure 8 and Table 3). The rock is relatively fresh and fine- to medium-grained (Figure 10i). The plagioclase is mostly albitic and slightly altered to epidote along its margins. At the same time, the amphibole is chloritized, while the quartz remains fresh and unstrained. At places, quartz porphyroblasts are scattered in the matrix. Overall, HPA displays very few micro-fractures.
5.2. Petrophysical Properties
All of the petrophysical test results are presented in Table 4, and are spatially displayed across the horizontal distance of the FDZ in Figure 11. Within both ductile and brittle damage zones, granitic rock exhibits higher porosity values, except in the HZD, whereas amphibolite rocks have lower porosity. HBG, HLS, and HGS, which are located close to the fault core, have significantly higher porosity values of 1.12%, 1.03%, and 1.21%, respectively. Very low porosity values in HZD (0.17%) may be due to few micro-fractures present (Figure 10c) compared to other granitic rocks. High porosity was found in granitic rocks close to the fault core, explaining the observed mechanical crushing and intense micro-fracturing (Figure 9) as well as the higher mica content of these granitic rocks (Figure 7). Despite 17% biotite, low micro-fracture density, HZD preserves moderate UCS (75.77 MPa). Interestingly, the low trend in UPV (m/s) is also depicted in granitic rocks, explaining structural defects and low density of these rocks (Figure 11 and Table 4).
Table 4.
Petrophysical and geomechanical test results of intact rocks.
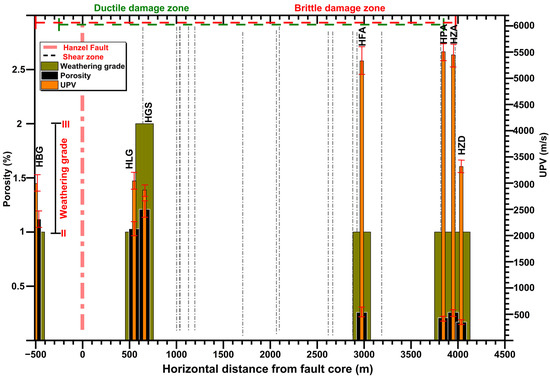
Figure 11.
Mean values of porosity (%), UPV (m/s), and weathering grade of all rocks across the FDZ’s horizontal distance.
Overall, the P-wave velocities of both granitic and mafic rocks differ due to their mineral composition and rock homogeneity; however, both foliated granodiorite and foliated amphibolite have a lower P-velocity compared to their non-foliated counterparts. Amphibolite samples that are distant from the fault core have a porosity range of 0.21% to 0.26%, whereas UPV values range between 5331 and 5506 m/s. Among amphibolite samples, foliated samples (HFA) show the lowest mean values (5331 m/s) compared to non-foliated samples outside the ductile damage zone. In Table 5, we present the anisotropic velocity data for foliated rocks. Compared to perpendicular values, parallel values exceed by 8%–12% due to faster wave propagation along foliation. Ali et al. [6] attribute this to the influence of foliation. Among all rocks, HGS displays moderate weathering (III) conditions, while all others show slight weathering (II) conditions on surface exposure as well as in the thin section (Table 4).
Table 5.
Anisotropic strength and velocity data with standard deviations for foliated rocks.
5.3. Geomechanical Properties
The geomechanical test results of both UCS and BTS are presented in Table 4 and Figure 10. Granitic and mafic rocks include HBG, HLS, HGS, and HFA, which are close to the fault and exhibit schistosity/foliations and intense fabric changes (Figure 9 and Figure 10). These rocks have UCS, SHR, and BTS values of less than 59 MPa, 52 MPa, and 6 MPa, respectively. Conversely, distant rocks from the core that have comparatively preserved fabric display UCS and BTS values between 76 and 107 MPa and 10 and 13 MPa, respectively. While SHR values generally show a trend of increasing with distance from the fault core, granitic rocks close to the fault core show lower values compared to distal amphibolites (Table 4 and Figure 12). However, SHR values do not increase as much as UCS increases towards the edge of the FDZ. Anisotropic UCS and BTS data for foliated rocks show disparity, with parallel to foliation values 15%–25% higher than perpendicular (Table 5) due to the minimized activation of weak planes. Previous studies also found such variations due to mineral lineations and alignment [6,10,11]. Regarding rock specific anisotropic behavior (Table 5), HGS show strongest anisotropy in UCS (parallel/perpendicular ratio = 1.36) due to high mica content (33%, Table 3) and alignment (Figure 9h,i), while HFA exhibits moderate anisotropy (parallel/perpendicular ratio = 1.27) from amphibolite and quartz alignment (Figure 10e,f). Overall, strength values are very low for both granitic and mafic rocks compared to the average values reported in the literature [47,48].
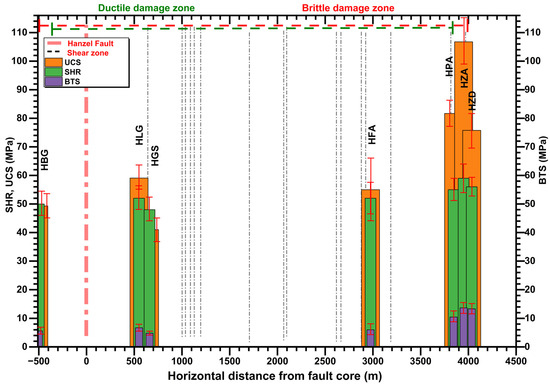
Figure 12.
Mean values of UCS (MPa), BTS (MPa), and SHR of all rocks across the FDZ horizontal distance.
6. Discussion
6.1. Impact of Mineralogical and Microfabric Modifications on Rock Strength
Tectonically induced mineralogical and microfabric changes—such as foliation/schistosity, mineral alignment, micro-fractures, strained minerals, grain boundary recrystallization, and alteration—significantly reduce the geomechanical properties of rocks [5,6,7,9,10,11,12]. According to Fletcher et al. [2], across the FDZ, penetrative fabric and fracturing increase towards the high-stain core. This implies that, from the fault core to the outer edge of the FDZ, rocks should be geomechanically analyzed considering their spatial distance from the core, as ductile and microfabric deformation decrease outward. In the general evaluation of geomechanical properties of rocks, particularly across FDZs, both spatial distance and changes in mineralogy and microfabric are often overlooked. In the microphotographs (Figure 9 and Figure 10), we examined the tectonically induced mineralogical and fabric changes in granitic and amphibolite rocks across the spatial extent of the FDZ. The thin-section study reveals the effects of ductile–brittle deformation on the mineralogy and microfabric of rocks. We inferred that these changes have a significant impact on the mechanical behavior of different rocks. In Table 6, we semi-quantitatively presented the tectonically induced strength-reducing petrographic features of all rock units analyzed in this study.
Table 6.
Tectonically induced strength-reducing petrographic features in rock samples from the study area.
Strength-reducing petrographic features are observed in all rock units (Figure 9 and Figure 10, and Table 6). However, their density and ratio vary spatially and lithologically. Rock units close to the fault core (HBG, HLS, HGS, and HFA) exhibit frequent inter- and intra-granular fractures, strained minerals, grain boundary recrystallization, and alteration (Figure 9 and Figure 10, and Table 6). Mica is present as a major constituent, formed as a product of the recrystallization of quartz and feldspar, while secondary minerals are also present in a considerable amount (<1%–3.5%). Close to the core on the northwest block, HBG lacks schistosity and S-C fabric (Figure 6) and only preserves a cataclastic brittle effect on micro-fabric due to its proximity to the fault shear zone, whereas other granitic rocks on the southeast block exhibit schistosity in thin section. Consequently, these rock units have very low petrophysical and geomechanical values (Figure 11 and Figure 12, and Table 4). Contrary to this, rocks distant to core and shear zones have few to no (absent) micro-fractures, stain minerals, grain boundary recrystallization, and alteration (Figure 10), while the mica content in non-foliated amphibolite is low (1%–8%) compared to foliated amphibolite (11%–5%). In the case of HZD, mica is exceptionally high (17%). Nevertheless, the mica is non-aligned compared to HGS, which may explain its higher UCS despite the elevated mica content. Secondary mineral percentage is almost similar to that of rock close to the fault core (<1%–3.5%). Compared to rock units near the fault core and shear zones, these distant rock units (HZA, HPA, and HZD) exhibit high petrophysical and geomechanical values (Figure 11 and Figure 12, and Table 4).
In the correlation heat map (Figure 13), we statistically examined the petrophysical and geomechanical properties of all rocks. We inferred that, among mineralogical factors, the percentage of micaceous minerals (biotite and muscovite) significantly affects the strength properties of FDZ rocks. Mica’s role in weakening planes, leading to failure upon loading [6,11,12], increasing porosity and decreasing p-wave velocity [16,49], and decreasing strength [9,50,51], is well-established in the literature. Notably, a moderate negative correlation (R2 = 0.52–0.72) is observed between the strength parameters (UCS, BTS, SHR, and UPV) and the percentage of mica (Figure 13). In contrast, a moderate positive correlation (R2 = 0.50) between porosity and mica content is found. Additionally, higher porosity values, specifically near the fault core, and a negative relationship of porosity with UCS, BTS, SHR, and UPV confirm the role of tectonically induced inter- and intra-granular fracturing, alteration, and increased mica content in controlling strength properties. Such an inverse relationship reflects the primary roles of micro-fracturing, mineral alignment, and mica content in reducing the effective load-bearing area and providing stress concentrations, which ultimately compromise mechanical integrity. Anisotropic strength and velocity findings for foliated rocks clearly depict this effect on intact rock behavior (Table 5). The moderate to significant inverse relationship of mica, UCS, BTS, and SHR with UPV further validates the role of weak minerals and micro-fracturing in the weakening of the intact rock across FDZs (Figure 13). The relationship of petrophysical properties (porosity, UPV) with geomechanical properties (UCS, BTS, and SHR) and the relationship of different destructive (UCS and BTS) and non-destructive geomechanical parameters provide good indicators of the mechanical behavior of rocks across the FDZ’s horizontal distance (Figure 13). Such relationships have also been observed in previous studies [12,49,50,51]. The influence of weathering on rock strength is also observed, with more weathered samples showing lower UCS and BTS values (Table 4; specifically, HGS). This correlation suggests that weathering may play a role in weakening rock strength, particularly through increased porosity (Table 4) and mineral alteration (Figure 9 and Figure 10). It should be noted that the relationship derived in this study is based on three specimens per rock unit; while sufficient for initial analysis, it may limit the statistical significance of the results. Future work could increase the sample size to enhance the robustness of statistical conclusions.
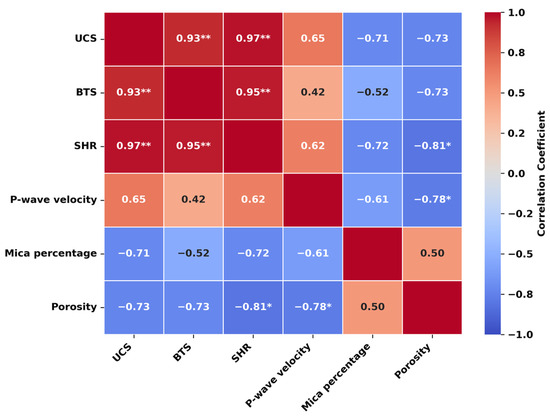
Figure 13.
Heat map for correlation (Pearson’s correlation) of different strength parameters with significant markers (* for p < 0.05, ** for p < 0.01). Positive values for direct relationship and negative values for inverse relationship.
Within the ductile damage zone, both granitic and amphibolite units—characterized by foliations and schistose textures—exhibit very low strength properties (Figure 11 and Figure 12, and Table 5). However, in the brittle damage zone, among granitic and amphibolite rocks without foliation or schistosity, only granitic rocks show lower values, while amphibolite shows higher values. We attribute the low strength of granite to its frequent inter- and intra-granular fracturing (Figure 9 and Figure 10), resulting from its brittle behavior (due to higher quartz content 40%–45.5%), as well as its higher mica mineral content (9%–17%). Both factors increase porosity and the number of weak planes, ultimately weakening the rock. On the contrary, amphibolite (HZA/HPA) lacks both strength-reducing factors, with a higher ratio of hard minerals and interlocking amphibole networks resisting micro-fracture propagation (Figure 10d–i). Temperature and fluid activity can further enhance tectonically induced microstructural changes. Previous studies show that hydrothermal alteration produces chlorite and sericite, which reduces strength [3], while thermal and hydrothermal effects accelerate microcrack growth and chemical weakening [7,9,34]. Collectively, all these factors drive long-term rock deterioration and weaken rocks within FDZs. Recent studies on granitic rocks in active tectonic regions also found low strength values due to the above-mentioned changes [6,7]. In Figure 14, we compare the strength of granitic rocks in the FDZ with other studies on granitic rocks globally [48,52,53,54,55,56,57]. Interestingly, we found a significant disparity in UCS values, with very low UCS for granitic rocks in the study area, the FDZ. We attribute this strength reduction to the association of granitic plutons with active tectonic deformation along the HF in the Tethyan Himalayas of Pakistan. It is important to consider the mineralogical and grain size differences, as these inherent properties of the granitic rocks may also affect their mechanical behavior and the degree of tectonic weakening [7,9,34].
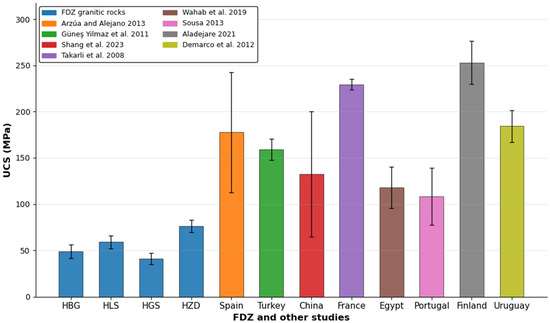
Figure 14.
Comparison of UCS values from this study with global studies [47,48,52,53,54,55,56,57]. The lower strength in this study is attributed to tectonic weakening within the FDZ, in contrast to the typically stronger intact granites from other regions.
Field evidence from large FDZs suggests that unit thickness and lithology significantly influence damage patterns. Thicker, more competent units tend to exhibit less dense fracturing, while thinner or weaker layers within the FDZ are often more shattered [58,59]. In our study, the FDZ encompasses various rock types (Figure 3), each possessing distinct intact strengths and fracture behaviors. These lithological factors can sometimes overshadow general trends related to distance from the fault. We note that specific variations, or spikes, in geomechanical parameters (UCS, BTS, UPV, etc.) align with transitions between rock units and foliations/schistosity as well as weathering conditions associated with ductile shear zones (Figure 11 and Figure 12). This suggests that the geomechanical profile of the intact rock across the FDZ is not a uniform gradient solely determined by distance; rather, it reflects a combination of fault-induced damage and the intrinsic properties of each rock type encountered.
6.2. Failure Mechanism in Foliated Rocks and Implications
Previous studies argue that tectonically deformed rocks predominantly fail by reactivating pre-existing planes of weakness [6,60,61]. In our study area, multiple tectonic events have also created pre-existing weaknesses in foliated rocks (Figure 15). We infer that the variability in strength properties (UCS, BTS, and UPV), both parallel and perpendicular to the foliations (Table 5), is due to the effects of S-C fabrics and mineral alignment. The schematic diagram (Figure 15) below illustrates how the S-C cleavage preserved in the microlithon of the well-developed S2 crenulation cleavage affects the rock UCS. The orientation of S-C cleavages and the alignment of minerals relative to the applied load directly influence rock strength [6]. The UCS significantly increased in the S2 parallel core samples that contained mineral alignment and S1 crenulated cleavages in the microlithon, as they opposed the applied load due to load-parallel shear at the main matrix crenulation cleavage. A previous study in the Himalayas also found a significant effect of S-C fabrics on rock geomechanical properties [6]. Moreover, the experimental results demonstrating shear failure modes in foliated rocks reflect the intrinsic mechanical behavior of the tested rock specimens. This provides reliable insights into how mineral alignment and S-C fabrics influence failure processes in response to the applied load direction in tectonically induced foliated rock types. The microfabric would remain undetectable without detailed petrographic analysis. Therefore, the main differential stresses preserved in rocks as simple or complex foliations and lineations must be determined before using foliated rocks in any engineering constructions or as aggregates.
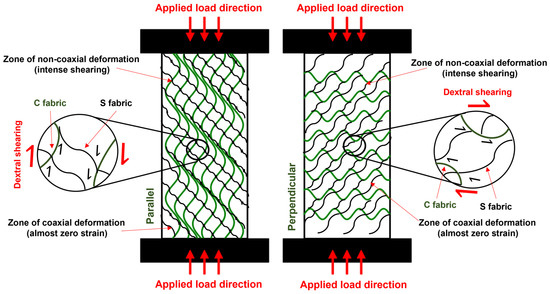
Figure 15.
Schematic diagram displaying the impact of the parallel and perpendicular tectonic weak plane (schistosity/foliations) on the UCS of the foliated/schistose rocks (modified [6]). The angle between the applied load and foliation in the parallel and perpendicular directions was maintained at 0° and 90°, respectively.
Although previous studies in the Tethyan and Indian Himalayas focused well on petrographic factors for rock characterization [9,62,63,64], we urge that, for a better understanding and characterization of tectonites in the future, the ages of rock units, their distance from the fault core, and the resulting microfabric deformation and mineralogical changes induced by tectonic evolution should be added to the evaluation framework. This will provide reliable characterization, considering tectonic effects. Furthermore, tectonically induced changes have practical implications for the use of these rocks. As these tectonites exhibit a significant inclusion of strained minerals (e.g., quartz and feldspar) and mica content (1%–17%), they are unsuitable for use in concrete and asphalt works with ordinary Portland cement as they are prone to alkali–silica reaction (ASR). Additionally, studies found that tectonically disturbed rocks significantly fail by reactivation of pre-existing planes of weakness (foliations and fractures) [6,60,61]. Thus, this also has implications for the design of engineering structures across FDZs. Therefore, for sustainable and safe infrastructure development and appropriate material usage, tectonically induced mineralogical and microfabric changes should be incorporated into the geological assessment framework.
7. Conclusions
Our study finds that intense fracturing and mineralogical alteration (especially clay enrichment) in the FDZ have led to a ~30%–50% reduction in rock strength relative to unaffected wall rock. The key conclusions are outlined below:
- Tectonic stress and fluid–rock interaction in the FDZ cause microfabric changes (grain size reduction and crack propagation) and mineral transformations (e.g., feldspar to sericite) that weaken the rock;
- Dynamic recrystallization, the growth of phyllosilicates (such as biotite and muscovite), and alteration products (like chlorite and sericite) increase porosity (up to 1.21%) and decrease cohesion and strength;
- Strength parameters correlate inversely with proximity to the fault core, with granitic rocks (e.g., HBG and HGS) most susceptible due to brittle fracturing and mica abundance.
These findings emphasize that conventional rock mass characterization inadequately predicts rock strength in FDZs; therefore, tectonic, mineralogical, and microfabric changes must be integrated. In practice, foliated or schistose rocks near faults pose implications for construction due to their low strength and the risks of alkali–silica reaction. Based on the findings, we recommend avoiding fault-proximal rocks as aggregate materials and additionally, incorporating FDZ spatial mapping into geotechnical site assessments, specifically identifying safe distances from fault cores for construction. While FDZ transects with sampling from selected rocks at various distances from the core provide preliminary insights, secondary faults and more localized deformation effects warrant detailed investigation. Future work should explore the spatial–temporal evolution of fabric changes and validate predictive models for rock strength in analogous tectonic settings.
Author Contributions
I.A. contributed to the conceptualization, methodology, field investigations, data analysis, original draft preparation, and visualization; Y.S. provided supervision, methodology oversight, field investigation support, funding acquisition, technical guidance, and critical revisions of the manuscript; L.S. managed the technical guidance, data curation, and critical revisions of the manuscript; X.Y., Q.M., H.R. and R.A. assisted with field and laboratory work and reviewed the manuscript. All authors have read and agreed to the published version of the manuscript.
Funding
This study received financial support from the Shanghai Cooperation Organization’s Science and Technology Partnership Program, the International Science and Technology Cooperation Program, and the Xinjiang Department of Science and Technology, China (Grant No. 2023E01005). This research was also supported by the Third Xinjiang Scientific Expedition Program (Grant No. 2022xjkk1305). This study APC was funded by the “Fundação para a Ciência e a Tecnologia” in the frame of the UIDB/00073/2025 and UIDP/00073/2025 projects of the I & D unit of the Geosciences Center (CGEO).
Data Availability Statement
All data generated or analyzed during this study are included in this article. Further inquiries can be directed to the corresponding author.
Acknowledgments
The authors express their gratitude to the University of Chinese Academy of Sciences (UCAS), the State Key Laboratory of Lithospheric and Environmental Coevolution, and the Institute of Geology and Geophysics (IGG) for their scholarship support and the opportunity to conduct this research. We also thank the Hanzel Hydro Power project office and the Water and Power Department of the Government of Gilgit–Baltistan, Pakistan, for supplying the essential geological maps and discontinuity survey data.
Conflicts of Interest
The authors declare no conflicts of interest.
References
- Choi, J.H.; Edwards, P.; Ko, K.; Kim, Y.S. Definition and Classification of Fault Damage Zones: A Review and a New Methodological Approach. Earth Sci. Rev. 2016, 152, 70–87. [Google Scholar] [CrossRef]
- Fletcher, J.M.; Teran, O.J.; Rockwell, T.K.; Oskin, M.E.; Hudnut, K.W.; Spelz, R.M.; Lacan, P.; Dorsey, M.T.; Ostermeijer, G.; Mitchell, T.M.; et al. An Analysis of the Factors That Control Fault Zone Architecture and the Importance of Fault Orientation Relative to Regional Stress. Bull. Geol. Soc. Am. 2020, 132, 2084–2104. [Google Scholar] [CrossRef]
- Dias, F.C.; Quevedo, R.; Roehl, D.; Carvalho, B. Assessment of Geomechanical Properties of Fault Damage Zones Based on Numerical Modeling. In Proceedings of the 58th U.S. Rock Mechanics/Geomechanics Symposium, Golden, CO, USA, 23–26 June 2024. [Google Scholar] [CrossRef]
- Cao, Y.; Zhang, X.; Sun, L.; Zheng, Y.; Li, C. Mechanical Properties and Macro–Micro Failure Mechanisms of Granite under Thermal Treatment and Inclination. Geomech. Geophys. Geo-Energy Geo-Resour. 2025, 11, 8. [Google Scholar] [CrossRef]
- Lasheen, E.S.R.; Rashwan, M.A.; Azer, M.K. Effect of Mineralogical Variations on Physico-Mechanical and Thermal Properties of Granitic Rocks. Sci. Rep. 2023, 13, 10320. [Google Scholar] [CrossRef]
- Ali, A.; Hussain, S.; Khan, S.; Khan, A.S.; Mabood, S.; Ahmad, R. Effects of Tectonically Induced Fabrics on Geomechanical Properties of Rocks, NW Pakistan. Bull. Eng. Geol. Environ. 2020, 79, 4905–4916. [Google Scholar] [CrossRef]
- Ahmed, I.; Shang, Y.; Basharat, M.; Zada, K.; Khan, B.A. Influence of Stress-Induced Fabric Changes on the Strength of Granites: An Insight from the Kohistan and Ladakh Himalayas, Northern Pakistan. Bull. Eng. Geol. Environ. 2024, 83, 369. [Google Scholar] [CrossRef]
- Agliardi, F.; Dobbs, M.R.; Zanchetta, S.; Vinciguerra, S. Folded Fabric Tunes Rock Deformation and Failure Mode in the Upper Crust. Sci. Rep. 2017, 7, 15290. [Google Scholar] [CrossRef]
- Sajid, M.; Coggan, J.; Arif, M.; Andersen, J.; Rollinson, G. Petrographic Features as an Effective Indicator for the Variation in Strength of Granites. Eng. Geol. 2016, 202, 44–54. [Google Scholar] [CrossRef]
- Waqas, U.; Qureshi, M.U.; Saqib, S.; Rashid, H.M.A.; Rasool, A.M. Evaluation of Strength Anisotropy in Foliated Metamorphic Rocks: A Review Focused on Microscopic Mechanisms. Geosciences 2024, 14, 253. [Google Scholar] [CrossRef]
- Ridl, R.N.; Villenueve, M.C.; Bell, D.H.; Macfarlane, D.F. Mineralogical Control on the Intact Strength of Schist in Central Otago, New Zealand. IOP Conf. Ser. Earth Environ. Sci. 2021, 833, 012037. [Google Scholar] [CrossRef]
- Saeidi, M.; Mercier-Langevin, A.; Rouleau, P.; Askaripour, M.; Saeidi, A.; Mercier-Langevin, P.; Rouleau, A. A Review of Relationship between Texture Characteristic and Mechanical Properties of Rock. Geotechnics 2022, 2, 262–296. [Google Scholar] [CrossRef]
- Esmailzadeh, A.; Behnam, S.; Mikaeil, R.; Naghadehi, M.Z.; Saei, S. Relationship between Texture and Uniaxial Compressive Strength of Rocks. Civ. Eng. J. 2017, 3, 480–486. [Google Scholar] [CrossRef]
- Firdaus, G.; Prasad, M.; Behura, J. A Novel Anisotropy Template for an Improved Interpretation of Elastic Anisotropy Data. Sci. Rep. 2023, 13, 16160. [Google Scholar] [CrossRef]
- Strzałkowski, P.; Kaźmierczak, U. Wear and Fragmentation Resistance of Mineral Aggregates—A Review of Micro-Deval and Los Angeles Tests. Materials 2021, 14, 5456. [Google Scholar] [CrossRef]
- Alcock, T.; Bullen, D.; Benson, P.M.; Vinciguerra, S. Temperature-Driven Micro-Fracturing in Granite: The Interplay between Microstructure, Mineralogy and Tensile Strength. Heliyon 2023, 9, e13871. [Google Scholar] [CrossRef]
- Qi, F.; Ma, Z.; Yang, D.; Li, N.; Li, B.; Wang, Z.; Ma, W. Stability Control Mechanism of High-Stress Roadway Surrounding Rock by Roof Fracturing and Rock Mass Filling. Adv. Civ. Eng. 2021, 2021, 6658317. [Google Scholar] [CrossRef]
- Sakcali, A.; Yavuz, H.; Sahin, S. Quality Assessment of Natural Stone Blocks by an Ultrasonic Method. Bull. Eng. Geol. Environ. 2016, 75, 959–966. [Google Scholar] [CrossRef]
- Siegesmund, S.; Snethlage, R. Stone in Architecture: Properties, Durability, 5th ed.; Springer: Berlin/Heidelberg, Germany, 2014; pp. 1–550. [Google Scholar] [CrossRef]
- Ribeiro, R.P.; Paraguassú, A.B.; Rodrigues, J.E. Sawing of Blocks of Siliceous Dimension Stone: Influence of Texture and Mineralogy. Bull. Eng. Geol. Environ. 2007, 66, 101–107. [Google Scholar] [CrossRef]
- Petterson, M.G. A Review of the Geology and Tectonics of the Kohistan Island Arc, North Pakistan. Geol. Soc. Spec. Publ. 2010, 338, 287–327. [Google Scholar] [CrossRef]
- Li, H.; Duan, H.; Qin, Q.; Zhao, T.; Fan, C.; Luo, J. Characteristics and Distribution of Tectonic Fracture Networks in Low Permeability Conglomerate Reservoirs. Sci. Rep. 2025, 15, 5914. [Google Scholar] [CrossRef] [PubMed]
- Mitchell, T.M.; Faulkner, D.R. The Nature and Origin of Off-Fault Damage Surrounding Strike-Slip Fault Zones with a Wide Range of Displacements: A Field Study from the Atacama Fault System, Northern Chile. J. Struct. Geol. 2009, 31, 802–816. [Google Scholar] [CrossRef]
- Callahan, O.A.; Eichhubl, P.; Davatzes, N.C. Mineral Precipitation as a Mechanism of Fault Core Growth. J. Struct. Geol. 2020, 140, 104156. [Google Scholar] [CrossRef]
- Jin, K.; Kim, Y.S. The Importance of Surface Ruptures and Fault Damage Zones in Earthquake Hazard Assessment: A Review and New Suggestions. Geol. Soc. Spec. Publ. 2021, 501, 205–224. [Google Scholar] [CrossRef]
- Li, J.; Guo, S.; Qi, S.; Wei, Q.; Zheng, B.; Zou, Y.; Li, Y.; Zhang, Y.; Lu, X. Spatial Variations of Deformation along a Strike-Slip Fault: A Case Study of Xianshuihe Fault Zone, Southwest China. Appl. Sci. 2024, 14, 2439. [Google Scholar] [CrossRef]
- Li, J.; Guo, S.; Yang, G.; Qi, S. The Influence of Faults on Adjacent Rock Mechanical Behavior and Acoustic Emission Characteristics: A Case Study of the Xianshuihe Fault Zone. Rock Mech. Bull. 2025, 4, 100210. [Google Scholar] [CrossRef]
- Cappa, F.; Rutqvist, J. Impact of CO2 Geological Sequestration on the Nucleation of Earthquakes. Geophys. Res. Lett. 2011, 38. [Google Scholar] [CrossRef]
- ur Rehman, Q.; Ahmed, W.; Waseem, M.; Khan, S.; Farid, A.; Shah, S.H.A. Geophysical Investigations of a Potential Landslide Area in Mayoon, Hunza District, Gilgit-Baltistan, Pakistan. Rud.-Geološko-Naft. Zb. 2021, 36, 127–141. [Google Scholar] [CrossRef]
- Ur Rehman, M.; Zhang, Y.; Meng, X.; Su, X.; Catani, F.; Rehman, G.; Yue, D.; Khalid, Z.; Ahmad, S.; Ahmad, I. Analysis of Landslide Movements Using Interferometric Synthetic Aperture Radar: A Case Study in Hunza-Nagar Valley, Pakistan. Remote Sens. 2020, 12, 2054. [Google Scholar] [CrossRef]
- Khan, S.D.; Walker, D.J.; Hall, S.A.; Burke, K.C.; Shah, M.T.; Stockli, L. Did the Kohistan-Ladakh Island Arc Collide First with India? Bull. Geol. Soc. Am. 2009, 121, 366–384. [Google Scholar] [CrossRef]
- Petterson, M.G.; Treloar, P.J. Volcanostratigraphy of Arc Volcanic Sequences in the Kohistan Arc, North Pakistan: Volcanism within Island Arc, Back-Arc-Basin, and Intra-Continental Tectonic Settings. J. Volcanol. Geotherm. Res. 2004, 130, 147–178. [Google Scholar] [CrossRef]
- Ullah, M.; Klötzli, U.; Rentenberger, C.; Sláma, J.; Younas, M.; Khubab, M.; Goudarzi, M.; Ahmad, T. Unravelling the Geochemical and Geochronological Diversities of the Pre-Collisional Magmatism: Implications for the Subduction Dynamics in the Kohistan Island Arc and Karakorum Block, Pakistan. Geosci. Front. 2025, 16, 102003. [Google Scholar] [CrossRef]
- Ahmed, I.; Shang, Y.; Sousa, L.; Meng, Q.; Tanoli, J.I.; Waqar, M.F. Geomechanical Evaluation of Fault Damage Zone in the Active Himalayas of Northern Pakistan. Environ. Earth Sci. 2025, 84, 644. [Google Scholar] [CrossRef]
- Petterson, M.G.; Windley, B.F. RbSr Dating of the Kohistan Arc-Batholith in the Trans-Himalaya of North Pakistan, and Tectonic Implications. Earth Planet. Sci. Lett. 1985, 74, 45–57. [Google Scholar] [CrossRef]
- Heuberger, S.; Schaltegger, U.; Burg, J.P.; Villa, I.M.; Frank, M.; Dawood, H.; Hussain, S.; Zanchi, A. Age and Isotopic Constraints on Magmatism along the Karakoram-Kohistan Suture Zone, NW Pakistan: Evidence for Subduction and Continued Convergence after India-Asia Collision. Swiss J. Geosci. 2007, 100, 85–107. [Google Scholar] [CrossRef]
- Searle, M.P.; Khan, M.A.; Fraser, J.E.; Gough, S.J.; Jan, M.Q. The Tectonic Evolution of the Kohistan-Karakoram Collision Belt along the Karakoram Highway Transect, North Pakistan. Tectonics 1999, 18, 929–949. [Google Scholar] [CrossRef]
- ASTM D5873-14; Standard Test Method for Determination of Rock Hardness by Rebound Hammer Method. ASTM International: West Conshohocken, PA, USA, 2014.
- ASTM C170-90; Standard Test Method for Compressive Strength of Dimension Stone. ASTM International: West Conshohocken, PA, USA, 1999.
- ASTM D2938-95; Standard Test Method for Unconfined Compressive Strength of Intact Rock Core Specimens. ASTM International: West Conshohocken, PA, USA, 2002.
- ASTM D3976; Standard Test Method for Splitting Tensile Strength of Intact Rock Core Specimens. ASTM International: West Conshohocken, PA, USA, 2001.
- Harrison, D.J.; Bloddworth, A.J. Industrial Minerals Laboratory Manual: Technical Report; British Geological Survey: Nottingham, UK, 1994. [Google Scholar]
- ASTM D2845-08; Standard Test Method for Laboratory Determination of Pulse Velocities and Ultrasonic Elastic Constants of Rocks. ASTM International: West Conshohocken, PA, USA, 2001.
- ASTM C1721-09; Standard Guide for Petrographic Examination of Dimension Stone. ASTM International: West Conshohocken, PA, USA, 2015.
- Irfan, T.Y.; Dearman, W.R. Engineering Classification and Index Properties of a Weathered Granite. Bull. Int. Assoc. Eng. Geol. 1978, 17, 79–90. [Google Scholar] [CrossRef]
- Borrelli, L.; Greco, R.; Gullà, G. Weathering Grade of Rock Masses as a Predisposing Factor to Slope Instabilities: Reconnaissance and Control Procedures. Geomorphology 2007, 87, 158–175. [Google Scholar] [CrossRef]
- Wahab, G.M.A.; Gouda, M.; Ibrahim, G. Study of Physical and Mechanical Properties for Some of Eastern Desert Dimension Marble and Granite Utilized in Building Decoration. Ain Shams Eng. J. 2019, 10, 907–915. [Google Scholar] [CrossRef]
- Aladejare, A.E. Characterization of the Petrographic and Physicomechanical Properties of Rocks from Otanmäki, Finland. Geotech. Geol. Eng. 2021, 39, 2609–2621. [Google Scholar] [CrossRef]
- Singh, H.O.; Ansari, T.A.; Singh, T.N.; Singh, K.H. Development of Statistical Models to Predict the Mechanical Properties of Some Metamorphic Rocks from P-Wave Velocity and Certain Physical Properties. Geotech. Geol. Eng. 2022, 40, 4247–4268. [Google Scholar] [CrossRef]
- Eroğlu, G.; Çalik, A. Relationship of Petrographic and Mineralogical Characteristics with Mechanical Strength Properties of Granitic Rocks: A Case Study from the Biga Peninsula, NW Turkey. Turk. J. Earth Sci. 2023, 32, 126–143. [Google Scholar] [CrossRef]
- Wang, Z.; Li, W.; Wang, Q.; Liu, S.; Hu, Y.; Fan, K. Relationships between the Petrographic, Physical and Mechanical Characteristics of Sedimentary Rocks in Jurassic Weakly Cemented Strata. Environ. Earth Sci. 2019, 78, 131. [Google Scholar] [CrossRef]
- Arzúa, J.; Alejano, L.R. Dilation in Granite during Servo-Controlled Triaxial Strength Tests. Int. J. Rock Mech. Min. Sci. 2013, 61, 43–56. [Google Scholar] [CrossRef]
- Güneş Yilmaz, N.; Mete Goktan, R.; Kibici, Y. Relations between Some Quantitative Petrographic Characteristics and Mechanical Strength Properties of Granitic Building Stones. Int. J. Rock Mech. Min. Sci. 2011, 48, 506–513. [Google Scholar] [CrossRef]
- Shang, Y.J.; Zhao, B.; Jiang, D.T. Discussion on the Maximum Height of Vertical Scarp of Fresh and Intact Granite from Different Approaches. Xinjiang Geol. 2023, 41, 72–80. [Google Scholar]
- Takarli, M.; Prince, W.; Siddique, R. Damage in Granite under Heating/Cooling Cycles and Water Freeze–Thaw Condition. Int. J. Rock Mech. Min. Sci. 2008, 45, 1164–1175. [Google Scholar] [CrossRef]
- Sousa, L.M.O. The Influence of the Characteristics of Quartz and Mineral Deterioration on the Strength of Granitic Dimensional Stones. Environ. Earth Sci. 2013, 69, 1333–1346. [Google Scholar] [CrossRef]
- Morales Demarco, M.; Oyhantçabal, P.; Stein, K.J.; Siegesmund, S. Granitic Dimensional Stones in Uruguay: Evaluation and Assessment of Potential Resources. Environ. Earth Sci. 2013, 69, 1397–1438. [Google Scholar] [CrossRef]
- Savage, H.M.; Brodsky, E.E. Collateral Damage: Evolution with Displacement of Fracture Distribution and Secondary Fault Strands in Fault Damage Zones. J. Geophys. Res. Solid Earth 2011, 116, B03405. [Google Scholar] [CrossRef]
- Shipton, Z.K.; Soden, A.M.; Kirkpatrick, J.D.; Bright, A.M.; Lunn, R.J. How Thick Is a Fault? Fault Displacement-Thickness Scaling Revisited. In Earthquakes: Radiated Energy and the Physics of Faulting; American Geophysical Union: Washington, DC, USA, 2006; pp. 193–198. [Google Scholar]
- Everall, T.; Sanislav, I. The Influence of Pre-Existing Deformation and Alteration Textures on Rock Strength, Failure Modes and Shear Strength Parameters. Geosciences 2018, 8, 124. [Google Scholar] [CrossRef]
- Waqar, M.F.; Guo, S.; Qi, S.; Karim, M.A.M.; Zada, K.; Ahmed, I.; Shang, Y. Influence of Mineralogical and Petrographic Properties on the Mechanical Behavior of Granitic and Mafic Rocks. Minerals 2025, 15, 747. [Google Scholar] [CrossRef]
- Asif, A.R.; Sajid, M.; Ahmed, W.; Nawaz, A. Weathering Effects on Granitic Rocks in North Pakistan: Petrographic Insights, Strength Classifications, and Construction Suitability. Environ. Earth Sci. 2024, 83, 351. [Google Scholar] [CrossRef]
- Yasir, M.; Ahmed, W.; Islam, I.; Sajid, M.; Janjuhah, H.T.; Kontakiotis, G. Composition, Texture, and Weathering Controls on the Physical and Strength Properties of Selected Intrusive Igneous Rocks from Northern Pakistan. Geosciences 2022, 12, 273. [Google Scholar] [CrossRef]
- Mustafa, S.; Khan, M.A.; Khan, M.R.; Sousa, L.M.O.; Hameed, F.; Mughal, M.S.; Niaz, A. Building Stone Evaluation-A Case Study of the Sub-Himalayas, Muzaffarabad Region, Azad Kashmir, Pakistan. Eng. Geol. 2016, 209, 56–69. [Google Scholar] [CrossRef]
Disclaimer/Publisher’s Note: The statements, opinions and data contained in all publications are solely those of the individual author(s) and contributor(s) and not of MDPI and/or the editor(s). MDPI and/or the editor(s) disclaim responsibility for any injury to people or property resulting from any ideas, methods, instructions or products referred to in the content. |
© 2025 by the authors. Licensee MDPI, Basel, Switzerland. This article is an open access article distributed under the terms and conditions of the Creative Commons Attribution (CC BY) license (https://creativecommons.org/licenses/by/4.0/).