Abstract
Fluid flow prediction in clastic heterogeneous reservoirs is a universal issue, especially when diagenetic development supplants structural and depositional controls. We consider this issue in the Middle Miocene Belayim Formation of the Gulf of Suez, a principal syn-rift reservoir where extreme, diagenetically induced pore system heterogeneity thwarts production. Although fault compartmentalization is understood as creating first-order traps, sub-seismic diagenetic controls on permeability anisotropy and reservoir within these traps are not restricted. This study uses a comprehensive set of petrophysical logs (ray gamma, resistivity, density, neutrons, sonic) of four key wells in the western field of Tawila (Tw-1, Tw-3, TW-4, TN-1). We apply an integrated workflow that explicitly derives permeability from petrophysical logs and populates it within a seismically defined structural framework. This study assesses diagenetic controls over reservoir permeability and fluid flow. It has the following primary objectives: (1) to characterize complicated diagenetic assemblage utilizing sophisticated petrophysical crossplots; (2) to quantify the role of shale distribution morphologies in affecting porosity effectiveness utilizing the Thomas–Stieber model; (3) to define hydraulic flow units (HFUs) based on pore throat geometry; and (4) to synthesize these observations within a predictive 3D reservoir model. This multiparadigm methodology, involving M-N crossplotting, Thomas–Stieber modeling, and saturation analysis, deconstructs Tawila West field reservoir complexity. Diagenesis that has the potential to destroy or create reservoir quality, namely the general occlusion of pore throats by dispersed, authigenic clays (e.g., illite) and anhydrite cement filling pores, is discovered to be the dominant control of fluid flow, defining seven unique hydraulic flow units (HFUs) bisecting the individual stratigraphic units. We show that reservoir units with comparable depositional porosity display order-of-magnitude permeability variation (e.g., >100 mD versus <1 mD) because of this diagenetic alteration, primarily via pore throat clogging resulting from widespread authigenic illite and pore occupation anhydrite cement, as quantitatively exemplified by our HFU characterization. A 3D model depicts a definitive NW-SE trend towards greater shale volume and degrading reservoir quality, explaining mysterious dry holes on structurally valid highs. Critically, these diagenetic superimpressions can replace the influence of structural geometry on reservoir performance. Therefore, we determine that a paradigm shift from a highly structured control model to an integrated petrophysical and mineralogical approach is needed. Sweet spot prediction relies upon predicting diagenetic facies distribution as a control over permeability anisotropy.
1. Introduction
In the world’s rift basins, the economic perspectives of syn-rift clastic reservoirs often suffer due to incomplete knowledge of permeability anisotropy. Although structural compartmentalization and sediment-controlled supply by tectonic evolution are recognized as first-order controls in the reservoir distribution (e.g., [1]), sub-seismic diagenetic restrictions on fluid flow are often underestimated. The manifestation of permeability anisotropy is a ubiquitous characteristic of syn-rift systems globally due to a complicated interplay between structural, sedimentary, and diagenetic elements. For example, in the East African Rift System, permeability has been directionally controlled strongly by fault segmentation, relay ramps, and directionally selective dike and fracture intrusions to establish strong directional flow corridors [2]. Analogously, the Reconcavo Basin (Brazil) and Huanghekou Sag (China) lacustrine syn-rift deposits exemplify how bedding architecture, turbidite channelization, and soft-sediment deformation control bed-parallel flow bias and the creation of complicated lateral baffles [1,3]. Again, in the post-rift Niger Delta, turbidite reservoir compartmentalization due to segmented fault arrays of various throws serves to exemplify the universal importance of fault geometry in the creation of dynamic flow corridors and barriers [4]. As shown in other screwdrivers, such as Huanghekou, tectonic activity determines sediment initiation and distribution [1]. However, we show that in mature reservoirs, diagenetic processes can supplant these primary controls to exert excessive influence on permeability and productivity.
The effects of diagenesis on clastic reservoirs are complex, involving processes that destroy and improve the quality of the reservoir. The Gulf of Suez, a perfect example of a rift basin, is an excellent place to study this paradigm because its Middle Miocene Belayim Formation is very heterogeneous, which cannot be explained only by its structure [5,6,7]. This is not just a lithological heterogeneity, but a diagenetic one that has a specific dominance over the movement of the pore fluids and the economic feasibility. To quantitatively unravel this diagenetic control, this study focuses on the Belayim Formation’s sandstone reservoirs within the Gulf of Suez. The Middle Miocene syn-rift clastic reservoirs of the Belayim Formation, mainly composed of sandstones in Sidri and Hammam Faraun, are significantly heterogeneous. Here, petrophysical characterization shows that high-quality flow units are generated by dissolution porosity in well-sorted sandstones, while sections with wide calcite or anhydrite cementation are close-packed with low reservoir quality [8,9,10,11,12,13].
Furthermore, the authigenic clays’ distribution, described by Thomas–Stieber modeling as predominantly dispersed and laminated occluding pore throats and capping permeability, is a dominant control for the flow unit behavior. For this reason, a deep appreciation of diagenesis, including mineralogy, timing, and distribution for cement and clays, is essential to realistically predict the reservoir’s behavior and optimize exploration and production methodology in rift basins. The Middle to Late Miocene Belayim Formation provides the keystone of the Gulf of Suez petroleum system as a significant reservoir unit accounting for approximately 10.5% of its total oil production from major oil-bearing fields such as Belayim Marine, Morgan, and Shoab Ali [9,14,15]. Their economic significance belies a complex stratigraphy. Four members comprise the formation and record an energetic evolution of marine transgression and a resultant evaporitic restriction (Figure 1) [16]. Regional seal rocks are the evaporitic Baba and Feiran members, and the main reservoirs are contained in the Hammam Faraun and Sidri members [17,18,19].
The reservoir potential of the Belayim Formation is contained primarily in the Sidri and Hammam Faraun members. The Sidri Member was formed in inner neritic to littoral environments. Its sandstones are seen as deposits of wave and tidal channel-dominated coastal environments. Their properties are well-classified, thin-to-medium-grained sand deposited with good primary permeability and porosity. Their reservoir facies are bounded by dolomitic shales and siltstones, which are lower-energy deposits (Figure 1).
In contrast, the Hammam Faraun Member has a more complex mosaic of open tidal marine facies. It is a heterolithic assemblage of sandstones, carbonated rocks, and shale. Sandstone units are typically associated with tide sand bars and coastal deposits subjected to storms, and carbonate units have subtle intertidal zones, including bioturbated wackestone and localized grainstone shoals. Such a complex intercalation between lithologies provides a usually complex reservoir fabric, with widely fluctuating pore systems that have been subsequently drastically altered by diagenesis [18,19,20,21,22,23]. Despite this clearly defined depositional structure, production in the Belayim Formation is difficult. The petrophysical characterization of the Tawila West field reveals a confusing dichotomy: the interpreted intervals of logs, such as sedimentary facies with similar initial deposition porosity, exhibit radically different flow behavior and hydrocarbon saturation. The petrophysical characterization of the Tawila West field reveals a central paradox that defines the conceptual gap for this study: stratigraphically contiguous layers with similar deposition porosity exhibit variations in magnitude orders in permeability and behavior of fluid flow. This extreme permeability anisotropy, a manifestation of pore system heterogeneity, cannot be explained only by the structural position or depositional fabric. Therefore, we hypothesize that the primary control of the reservoir’s quality is diagenetic. These sandstones produce comprehensive permeability anisotropy with complex cementation, clay authigenesis, and dissolution.

Figure 1.
Summary stratigraphic column of the Miocene rock in the Tawila West field, showing member subdivisions, lithology, interpreted depositional environments, and hydrocarbon potential (modified after [24]).
This study integrates petrophysical analysis and 3D modeling to deconstruct the dominant control of diagenetic processes—dispersed clay invasion and anhydrite cementation—on extreme permeability anisotropy within the syn-rift clastic reservoirs of the Belayim Formation.
2. Geological Setting
2.1. Regional Tectono-Stratigraphic Framework
The Gulf of Suez is a 320 km wide and 80 km long Cenozoic rift basin formed as a result of the northwestward continuation of the Red Sea rift system and anticlockwise rotation of the Arabian plate [25,26]. A series of north–northwest–south–southeast domino-like trending delineates its basic framework tilted fault blocks, which dissect the basin into three central half-graben provinces alternating in dip polarity—the Darag, Belayim, and Amal-Zeit provinces separated by complex accommodation zones (Figure 2a; [26,27]). This classic structural style, characterized by domino-style tilted fault blocks creating a series of half-grabens, is illustrated in the schematic cross-section in Figure 2d.
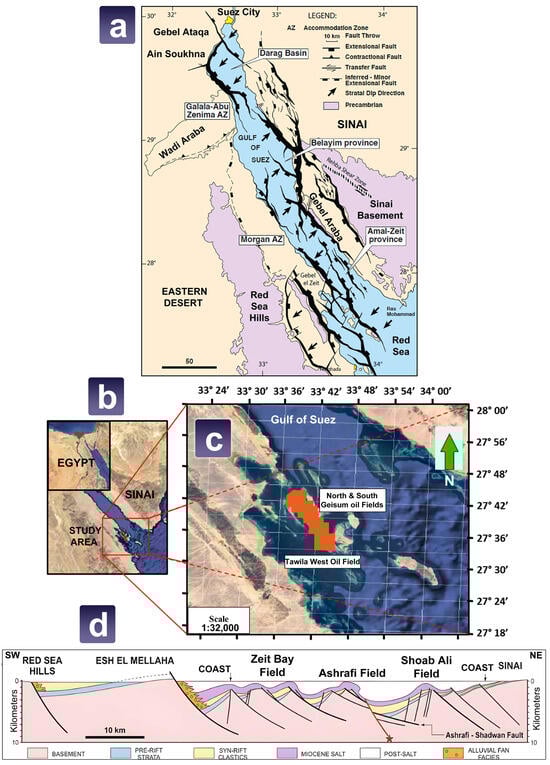
Figure 2.
(a) Structural framework of the Gulf of Suez rift basin, illustrating the major half-graben provinces and fault trends (modified after [5]). (b) Regional location map of the Gulf of Suez, showing its position within Egypt and neighboring regions, with a red rectangle indicating the area covered in panel C. (c) Detailed map of the Tawila West field location within the Gulf of Suez, as indicated in panel B. (d) Schematic SW-NE cross-section demonstrating the classic domino-style tilted fault block structure of the southern Gulf of Suez (modified after [25].
The Miocene syn-rift stratification captured in this structurally complicated environment results from the interaction between tectonic subsidence and changing sea levels globally [28]. Productivity occurred at a crucial second stage in this rifting history with an episode of markedly reduced tectonic subsidence between 16 and 13 Ma when an initially developing sinistral Agaba–Dead Sea transform faulting system became active [7,29,30,31,32]. This tectonic rearrangement, commonly called the post-Kareem event, caused a significant regression that extended into the deeper regions within a graben [33].
Consequently, the Belayim Formation unconformably overlies the Kareem Formation. The biostratigraphic data from foraminifera confirm an age of the Middle Miocene (Langhian–Serravallian) for the formation in this region [11]. It represents the onset of the primary Miocene evaporitic cycle, depositing in a vastly fluctuating environment that alternated between restricted lagoonal conditions (evaporitic Baba and Feiran members) and more open marine inner neritic to littoral settings (classic carbonate Sidri and Hammam Faraun members) [13,16,21,34]. It is within this specific tectono-stratigraphic context, a period of tectonic quiescence, evaporitic drawdown, and marine restriction, that the mineralogical complexity and diagenetic overprint of the Belayim reservoirs, which are the focus of this study, were fundamentally preconditioned.
2.2. Study Area
The field under this exploration is the Tawila West field, located some 40 km north of the city of Hurghada in the offshore southern province of the Gulf of Suez and with an area of about 78 km2 (Figure 2b,c).
The field is structurally in the southwestern dip province of the Amal-Zeit half-grabens, a prominent tectonic segment with a predominant southwestward dip; the controlling rift trend normal faults are downthrown to the northeast (Figure 2a; [25,32,35]). The dataset used in this research includes four deviated wells, namely TW-1, TW-3, TW-4, and TN-1, whose locations within the field are shown in Figure 3. These wells are drilled down to the Middle Miocene Belayim and Kareem formations (Figure 3). These wells have very different results that cannot be ascribed to their structural positions. TW-1 well discovery indicated productivity in the Belayim Formation through the Baba Sandstone units, but TW-4 indicated a smaller, but commercially viable, pay zone.
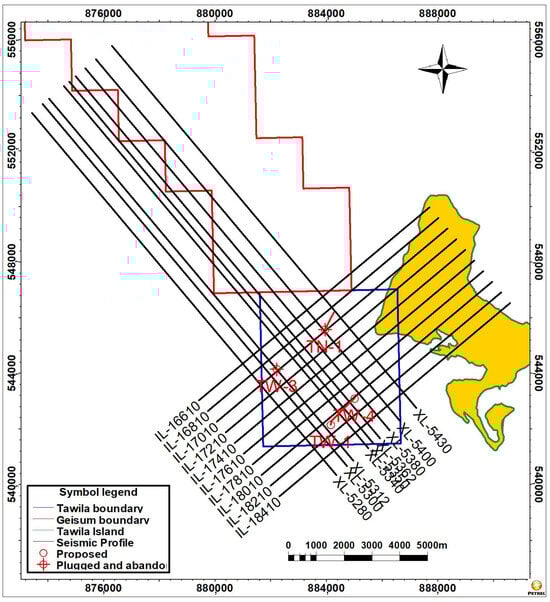
Figure 3.
Base map of the Tawila West field showing the interpreted seismic survey lines and the locations of the four study wells (TW-1, TW-3, TW-4, TN-1) used for petrophysical analysis and 3D modeling.
Conversely, wells TW-3 and TN-1, which were drilled on apparent structural closures, were dry. This sudden change in performance, where the traps determined by seismic interpretation did not trap hydrocarbons, initially indicated a complicated subsurface control beyond fault-bound compartments. The spatial layout of these wells on slightly differentiated structural blocks, TW-1, on a horst, and TW-4, on a step block, furnishes the necessary backbone to experiment with the activity, that diagenetic heterogeneity, and not merely the structural geometry, is the main factor in determining the distribution of fluids and reservoir productivity in this field.
3. Materials and Methods
3.1. Datasets
A high-resolution digital dataset for the Tawila West field, comprising seismic 3D research and comprehensive petrophysical log suites, assists the study. These suites were developed to allow petrophysical characterization and detailed diagenetic characterization of the Belayim Formation. A comprehensive wireline log suits four major wells, TW-1, TW-3, TW-4, and TN-1. It comprises the primary data whose combined broad coverage covers all reservoir intervals of interest (Figure 3).
The respective available log suites for the observed Baba and Kareem units are gamma ray (GR), caliper (CAL), deep (Rt) and shallow (Rxo) resistivities, borehole compensated sonic (DT), photoelectric factor (PEF), and most notably for the determination of lithology and porosity–formation density compensated (RHOB) and compensated neutron porosity (NPHI) logs (Table 1). A major issue and object of this analysis was the lack of density–neutron information in well TW-3, so strong petrophysical techniques had to fill this gap.

Table 1.
Summary of key petrophysical parameters for the non-productive (dry) TW-3 well. Despite moderate total porosity in some intervals, high dispersed shale volume and consequent low effective porosity result in 100% water saturation.
The log information was carefully depth-matched, and environment-corrected prior to interpretation for accuracy. All subsequent petrophysical interpretation and crossplot analysis were conducted using the Schlumberger Techlog™ platform (version 2018.1). In addition, this research employs a 3D seismic survey, consisting of twenty in-lines and crosslines, interpreted previously to delineate major fault framework and structural horizons (Figure 3). Although this seismic volume supplied the basic structural framework for the model, this study intentionally shifts its focus to take advantage of abundant high-resolution petrophysical information within the wells themselves. These integrated log datasets comprise a basic input for sophisticated crossplot analysis, shale modeling, and later 3D property modeling integral for unraveling the diagenetic controls on reservoir quality.
3.2. Petrophysical Workflow
A quantitative petrophysics workflow was employed to deconstruct complex diagenetic controls over reservoir quality within the Belayim Formation. In parallel, an endeavor was carried out to estimate mineralogical and textural heterogeneity in addition to the regular sand–shale discriminations.
3.2.1. Lithology and Diagenetic Mineral Identification
The initial stage involved detailed lithology and diagenetic mineral characterization with advanced crosses. The initial differentiation between central mineralogy in the versus adjacent verse and carbonate units was made using neutron–density crosses. More significantly, subsequent use was made of M-N graphics for more rigorous discrimination among the complex diagenetic mineral assembly. The technique M-N is a standard method that normalizes the Sonic Logs (Δt) and density (ρb) against neutron porosity (Nphi) to create mineral sensitive parameters: M = (Δt − Δt_m)/(ρ_b − ρ_m) * 0.01 and N = (ϕ_N − ϕ_Nm)/(ρ_b − ρ_m) Log for the matrix mineral. This standardization minimizes the effect of porosity, allowing data points to group around values characteristic for specific minerals. We apply this to delineate pore occlusion forms, such as anhydrite and salt, as well as dolomite stretch marks, which have a dramatic impact on porosity and permeability. Thus, we were able to move from a basic binary model towards an elaborate mineralogical model, which forms a base for all subsequent analyses.
3.2.2. Shale Distribution Modeling
Since we knew that the volume of shale alone is insufficient, we used the Thomas–Stieber method to model the distribution and pore-occluding effects of clay [36,37]. This model critically differentiates between depositional (laminated) and diagenetic (dispersed, structural) clay morphologies. The clustering of data along the ‘dispersed shale’ trend is a diagnostic indicator of post-depositional clay infiltration and growth within the pore space, a texture highly detrimental to permeability. This model is essential because it estimates the individual dispersed, laminated, and structural shale volume, which differentially affects the effective porosity. Dispersion clays, which are most detrimental to permeability, clog pore throats, and laminated shales inhibit vertical flow.
They are plotted together in a crossplot, which allows us to calculate laminar the shale volume (VL), dispersed shale volume (VD), and structural shale volume (VS) sand laminae porosity according to the following formulas:
- -
- Laminated shale only:
(Vsh = VL) ϕT = ϕmax − VL (ϕmax − ϕTsh)
- -
- Dispersed shale only:
(Vsh = VD) ϕT = ϕmax − VD (ϕmax − ϕTsh)
- -
- Structure shale only:
(Vsh = VS) ϕT = ϕmax − VS (ϕmax − ϕTsh)
- -
- Material equilibrium for shales:
Vsh = VL + VD + VS
The outcome, represented on crossplots of shale volume versus overall porosity, determined dispersed and laminated shales to be the overarching control of Tawila West reservoir quality, enabling a quantitative account for the anisotropy of permeability across wells.
3.2.3. Saturation and Flow Unit Analysis
Finally, to apply in shaly sands, fluid saturations were calculated using the Simandoux equation [38]. This resulted in water saturation in the uninvaded zone (Sw). The flushed zone water saturation (Sxo) was also determined using the shallow resistivity (Rxo) log to differentiate between movable and residual hydrocarbons. The movable hydrocarbon saturation (Shm) was subsequently calculated as Shm = Sxo − Sw, which is the proportion of the hydrocarbons that are replaced by the invasion of mud filtrate and can be produced. On the other hand, the residual hydrocarbon saturation (Shr) was determined as Shr = 1 − Sxo, which is the fraction of saturation held by the capillary forces within the invaded zone. This was important to determine periods of good storage (high Sh and porosity) and poor flow capacity (high Shr), a typical feature of pore throat plugging due to diagenesis.
Correlating these saturations to lithological and shale distribution maps gave the diagnostic conditions to define hydraulic flow units (HFUS) based on diagenetic facies instead of texture alone. Notably, these HFUs were quantitatively characterized in depth groups of equal flow field indicator (FGI) values, parameters, and a parameter derived from porosity, which captures the characteristics widely in the following section. This FZI-based clustering provided the objective, numerical foundation for HFUs, which was then interpreted in the context of diagenetic faculties.
3.2.4. Permeability Derivation and Anisotropy Analysis
To directly address the main problem of permeability anisotropy, permeability (K) was not measured directly, but derived from the established hydraulic flow (HFU) methodology [39]. This method served as the specific, quantitative criterion for delineating HFUs. The workflow involved calculating the Reservoir Quality Index (RQI) and FZI for each depth interval using the following equations:
where k is the permeability in millidarcies and ϕe is the effective porosity. We then applied a clustering algorithm to the calculated FZI values, grouping intervals with similar FZIs into seven distinct HFUs. This clustering was based on FZIs, giving the conclusive, quantitative criterion for defining the HFUs. The periods with similar FZI values were lumped into the seven HFUS. Each HFU had a specific porosity–permeability transform ((e.g., K = a × exp (b × ϕe)), so that we could fill out a continuous permeability log on a well-by-well basis. It should be mentioned that this derived permeability is an immediate product of the HFU classification. Consequently, the resulting permeability log is a quantitative measure of the population of the FZI-based groups and not an independent measure. This FZI-based approach therefore offers a numerically based system of categorizing the observed anisotropy, the orders-of-magnitude change in K at comparable 0-e, which, as independent mineralogical and shale distribution studies demonstrate, is largely dominated by diagenesis.
RQI = 0.0314 * √ (k/ϕe) and FZI = RQI/(ϕe/(1 − ϕe))
3.3. Three-Dimensional Static Modeling
The 3D static modeling workflow was created to incorporate seismic structural data alongside high-resolution petrophysical interpretations to capture the sub-seismic diagenetic heterogeneity. Figure 4 summarizes the methodology that followed the following two primary stages. Visualization, besides estimating variations in diagenetic homogeneity and its consequent effect on reservoir properties. The integration of petrophysical and seismic data was a two-stage process. Firstly, the structural arrangement, represented by fault surfaces and stratigraphic horizons (Top Baba, Top Kareem, Top Rudeis), was established from seismic data interpreted to create the 3D structural grid (Figure 4). Secondly, and more critically, the properties were petrophysically derived, and the diagenetic facies, effective porosity, and newly calculated permeability were filled in this structural grid (Figure 4). This fusion creates the definitive model: the seismic provides the structural container, while advanced petrophysics defines the internal architecture of the fluid, linking the large-scale structure to anisotropy sub-seismic permeability. The 3D structural framework, grid construction, and property population were performed using Schlumberger’s Petrel™ software (2018 V.). This geologic 3D grid, derived with a cell size of 50 m × 50 m × 0.5 m, was conditioned with properties using the platform’s Sequential Gaussian Simulation (SGS) algorithm [40]. This step was crucial, distinguishing the resulting model from one solely structurally derived. The “facies” used were not depositional but diagenetically defined. Critically, discrete diagenetic facies identified from the M-N and Thomas–Stieber analysis in well places (e.g., ‘clean sand’, dispersed clay sand, anhydrite zone) were increased and used as a 3D trend to restrict geostatistical simulation. This workflow converts petrophysical interpretations into a predictive 3D volume of diagenetic heterogeneity [41].
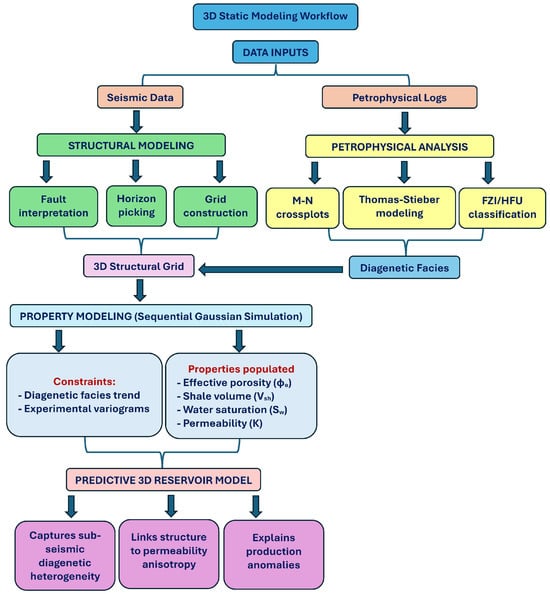
Figure 4.
Integrated 3D static reservoir modeling process, superimposing structural information from seismic data and diagenetically estimated facies from petrophysics to estimate permeability anisotropy and reservoir quality.
Properties such as the effective porosity (PHIE), shale volume (Vsh), and water saturation (Sw) were then simulated for each zone using SGS. Critically, the simulation was restricted by two main parameters: firstly, the 3D diagenetic facies model, which served as a trend model to guide the distribution of properties, and secondly, experimental variograms derived from well data. This two-layer constraint guarantees that the model respects the complex data yet realistically generates spatial continuity and heterogeneity that has been witnessed in the diagenetic system. By conditioning petrophysical property populations by such diagenetic units, the end-of-work 3D model does not simply interpolate between wells; it forecasts reservoir quality based on that which has been interpreted as diagenetic overprint, enabling a robust device for de-mystifying baffling production discrepancies across the Tawila West field.
4. Results
4.1. Diagenetic Facies and Their Petrophysical Signature
4.1.1. M-N Crossplot Analysis
M-N crossplot analysis was the first conclusive argument for a complex diagenetic mineral assembly in Belayim’s sandstone units, going beyond a simplistic sand model. Although this method provides a robust qualitative identification of minerals that reduce key permeability, such as anhydrite, halite, and dolomite, it does not produce accurate volumetric content. Following the standard interpretation rules, the dominant matrix mineralogy determines the positions of the data points. Observations indicate mineralogical heterogeneity, the central control element of recorded permeability anisotropy.
Most importantly, a significant trend of data points shifts decisively towards the anhydrite and halite fields. This trajectory, corroborated by high bulk density (>2.8 g/cc) and low neutron porosity readings, provides diagnostic evidence for the presence of anhydrite cement occluding the pore system. Observations indicate that this mineralogical heterogeneity is the central control of recorded permeability anisotropy. In the BABA-1 unit, approximately 60% of the database cluster is in the sandstone and limestone fields. However, a significant trend, which accounts for approximately 25% of the gap, points to an apparent change towards the anhydrite and halite fields, indicating the widespread distribution of these dense and porous occlusions. The same tendency is evident in the BABA-4 unit, where a similar proportion of points (about 20 to 30%) also tends to the evaporite minerals, reinforcing the importance of this diagenetic phase in Baba sands (Figure 5b).
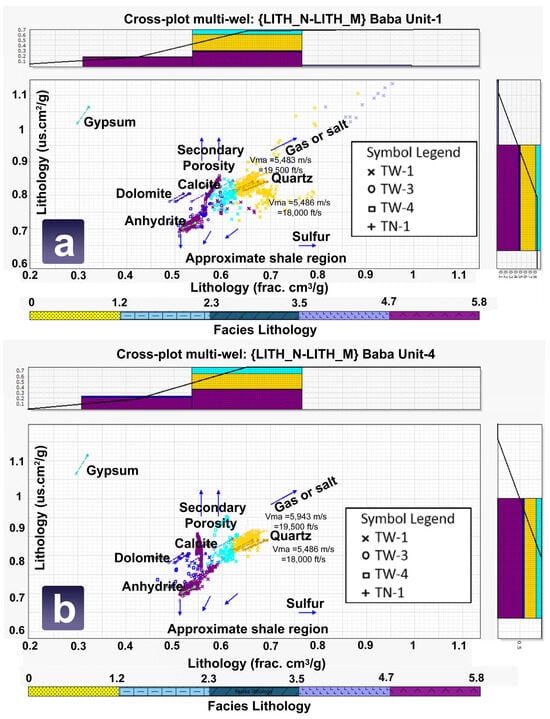
Figure 5.
M-N crossplots for the Baba Sandstone Member, used to discriminate complex diagenetic mineralogy. (a) Baba Unit-1 data points cluster in the sandstone and limestone fields, with a significant trend towards anhydrite and halite. (b) Baba Unit-4 shows a similar pattern, indicating a significant presence of pervasive distribution of pore-occluding evaporitic cements. The plotted mineral endpoints provide the reference framework for interpretation, where data clusters indicate the dominant mineral composition at each depth.
The Kareem Unit-1 Sub-Member displays a significantly different signature with points distributed between the sand, dolomite, and limestone fields. Almost half of the data points (approximately 45%) in the dolomite field represent a mixture of sandstone with clay, dolomite, and calcite bands (Figure 6). A petrophysical fingerprint that directly interprets the erratic porosity–permeability relationships and poor performance of some high-porosity intervals is the prevalence of anhydrite cement, dolomite streaks, and halite minerals, all with drastically different acoustic and density characteristics than quartz. Therefore, these M-N crossplot figures effectively discriminate the diagenetic minerals, finally determining the reservoir quality and channeling fluid flow.
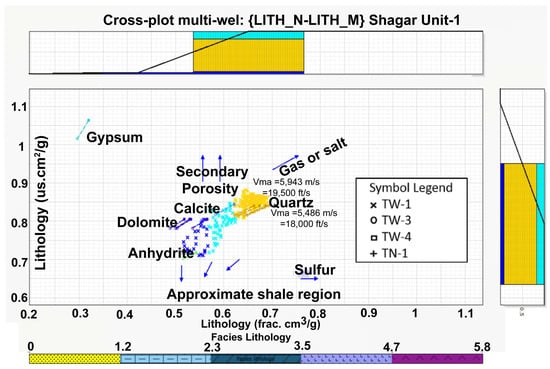
Figure 6.
M-N crossplot of the Shagar Unit-1 Sub-Member of the Kareem Formation. Data points are dispersed between sandstone, dolomite, and limestone fields due to a complex intermingling of sandstone mineralogy with argillaceous dolomite and calcite bands, complicating porosity and permeability relationships. This dispersion over several mineral fields directly proves the complex diagenetic overprint found in this unit.
4.1.2. Impact on Reservoir Properties
The mineral clusters, identified in the M-N crossplots, directly translate into the diagnostic log signal and, most seriously, an estimated effect on the reservoir properties. The gaps dominated by anhydrite and halite cement (Figure 7), reduce exceptionally high bulk density (>2.8 g/cc) and neutron porosity, creating “fool’s porosity” effects where the total porosity appears moderate but the effective porosity and permeability are destroyed (Figure 7). At these zones, the permeability obtained using the HFU model is always lower than 1 mD, regardless of the overall porosity value (Figure 8, Figure 9 and Figure 10). Conversely, the gaps with significant dolomite cement, while also showing high density, can preserve some starting connectivity through the intercrystalline porosity, resulting in a moderate permeability limit (5–50 md). However, it is highly dependent on the crystal shape and fabric. These mineral-specific effects form a quantitative link between the M-N cluster and permeability anisotropy.
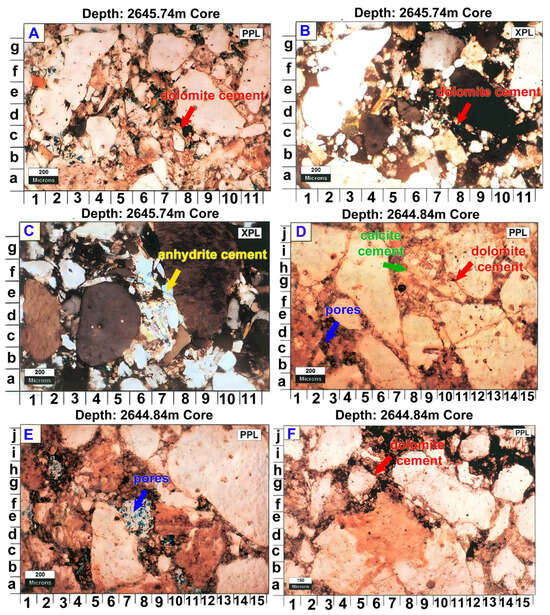
Figure 7.
Thin-section photomicrographs of the Baba Sandstone (TW-1 well) showing the principal diagenetic features. (A,D,E,F) Plane-polarized light (PPL). (B,C) Cross-polarized light (XPL); the reddish and bluish background tints in (B,C) are a result of using a gypsum plate (λ-tint) to enhance interference colors. (A,B) Dolomite cement (red arrows) fills pores in feldspathic quartz arenite. (C) Altered feldspar and anhydrite cement (yellow arrows) in the same rock. (D–F) Conglomerate of polymictic composition where the pores are filled by dolomite and calcite; blue areas indicate residual porosity. Note that the feldspar was sericitized (F) and the quartz grains corroded. These modifications and cements create pervasive, sub-seismic barriers for fluid movement.
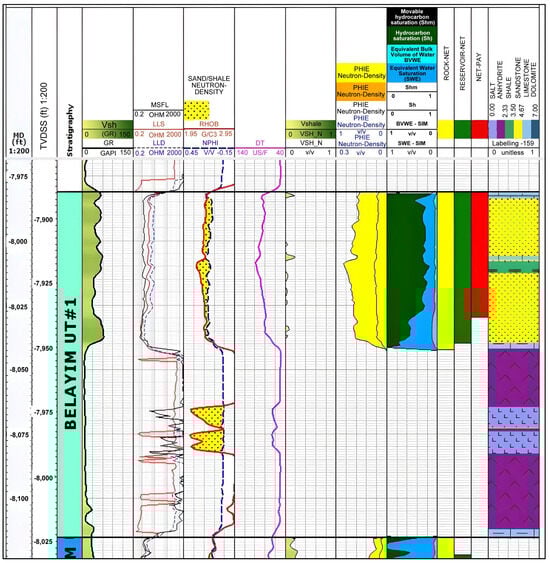
Figure 8.
Petrophysical log display for the Baba Unit-1 interval in the productive TW-1 well. Track conventions: ND = neutron–density crossplot (neutron porosity in red, density porosity in blue); SIM = water saturation from Simandoux equation (typically green). Tracked parameters (GR, resistivity, density, neutron, Vsh, PHIE, Sw) identify a pay zone with good effective porosity (~19%) and high movable hydrocarbon saturation (Shm), despite the presence of local dispersed clay.
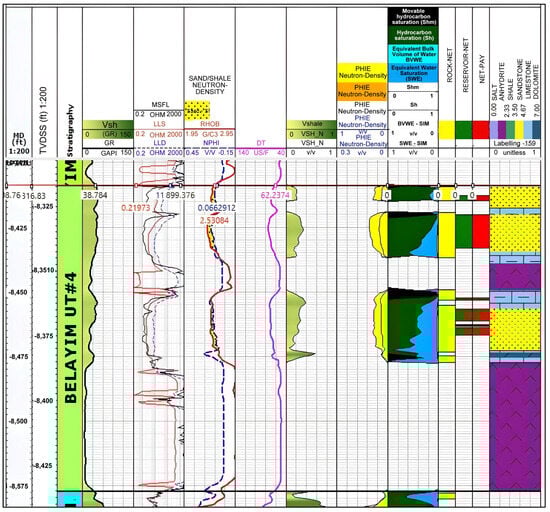
Figure 9.
Petrophysical log display for the Baba Unit-4 interval in well TW-1. Curve colors follow standard conventions: ND (neutron—red, density—blue), SIM (water saturation—green). A high-porosity streak (19% PHIE) exhibits total hydrocarbon immobilization (Shr = 98%) due to pore throat occlusion by anhydrite cement, demonstrating how diagenesis can create non-productive “fool’s porosity”.
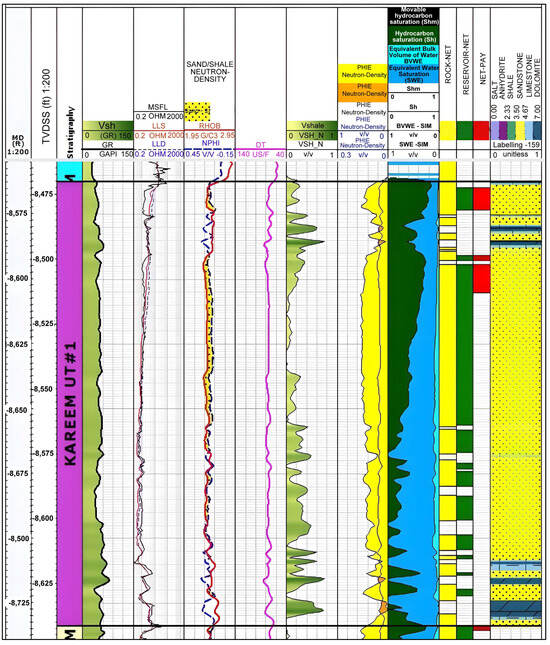
Figure 10.
Petrophysical log display for the Shagar Unit-1 interval in well TW-1. Log curves use standard color schemes: ND (neutron—red, density—blue) and SIM (water saturation—green). Intervals with similar porosity show contrasting fluid dynamics: hydrocarbons are mobile where dolomite cement preserves connectivity but remain residual where anhydrite cement blocks pore throats.
The log-based identification of pore-occluding minerals is decisively corroborated by the petrographic analysis of core samples from the productive TW-1 well. The petrographic analysis of the samples of the productive core of the TW-1 well is a decisive support of the log-based identification of pore-occluding minerals. In-plane polarized light and cross-polarized light were used to perform thin-section analysis, and some cross-polarized observations were improved with the help of a gypsum plate. Thin-section observations reveal the physical mechanisms behind the permeability heterogeneity: extensive authigenic clay formation from feldspar alteration and the precipitation of evaporite cements directly within pore throats. For instance, in the feldspathic quartzarenite (2645.74 m), anhydrite (yellow arrows) and dolomite cements (red arrows) occlude intergranular pores (Figure 7A–C), while altered feldspar grains promote dispersed, permeability-killing illite. Similarly, the conglomeratic facies (2644.84 m) show pervasive pore filling by secondary dolomite (red arrows) and calcite (green arrows) (Figure 7D–F).
These diagenetic textures—widespread clay infiltration and evaporite cementation—create sub-seismic baffles that explain the orders-of-magnitude permeability reduction at similar porosity, transitioning reservoir quality from excellent (HFU 1) to non-productive (HFU 7) within the same structural block.
The difference between the TW-1 well, where the Baba-1 unit displays more than 100 md permeability, and the dry TW-3 wells, where the mineral is permeable below 1 MD in the same interval, is directly related to the different abundance of these permeability-cutting inclusions (Table 1 and Table 2).
Table 2.
Summary of key petrophysical parameters for the productive TW-1 well. Intervals with moderate to high effective porosity and low water saturation define the producible pay zones, underscoring the impact of favorable diagenesis.
In contrast, optimal reservoir zones, which are defined by well-sorted sandstone containing minimal diagenetic cement, demonstrate a typical response: moderate density (~2.4 g/cc) and neutron porosity, along with a high, unsorted resistivity profile that indicates the presence of movable hydrocarbons. The implications of this are remarkably quantitative. Within the TW-1 productive well, the BABA-1 unit interval displays an average effective porosity of 19% and a 27% water saturation. Critically, the derived permeability in this unit typically exceeds 100 mD. On the other hand, in the dry TW-3 well, the intervals classified in the same type of general facies show analog schist volumes and total porosity that are ineffective due to diagenetic mineralization, culminating in 100% water saturation (Table 1 and Table 2). The derived permeability in these intervals plummets to values below 1 mD. This stark contrast—a two-orders-of-magnitude difference in permeability at similar porosity—establishes a profound anisotropy that transcends stratigraphic layers and definitively outlines the productive sweet spots. This relationship proves that diagenetic mineralogy is the decisive factor instead of just a depositional fabric. The permeability values derived vividly illustrate the following: In the TW-1 productive well, the BABA-1 unit displays permeability usually exceeding 100 MD. In comparison, mineralogically similar intervals in the permeability of the dry Tw-3 well have permeability below 1 MD. This establishes a deep anisotropy of permeability that transcends stratigraphic layers and outlines the productive sweet spots.
4.2. Quantifying the Baffles: Shale Distribution and Pore Occlusion
4.2.1. Thomas–Stieber Model Results
The Thomas–Stieber analysis gives a quantitative estimate of the destruction caused by the distribution rather than the volume of shales on reservoir quality throughout the Tawila West field. There is no doubt that dispersed shale is the dominant form of clay in the Baba Sandstone units, the most destructive form of pore occlusion. On a plot for the Baba Unit-1 Sub-Member, all the data points for the wells (TW-1, TW-3, TW-4, TN-1) are grouped closely together on the dispersed shale trend, while a significant minority are grouped on the laminated shale line (Figure 11 and Figure 12).
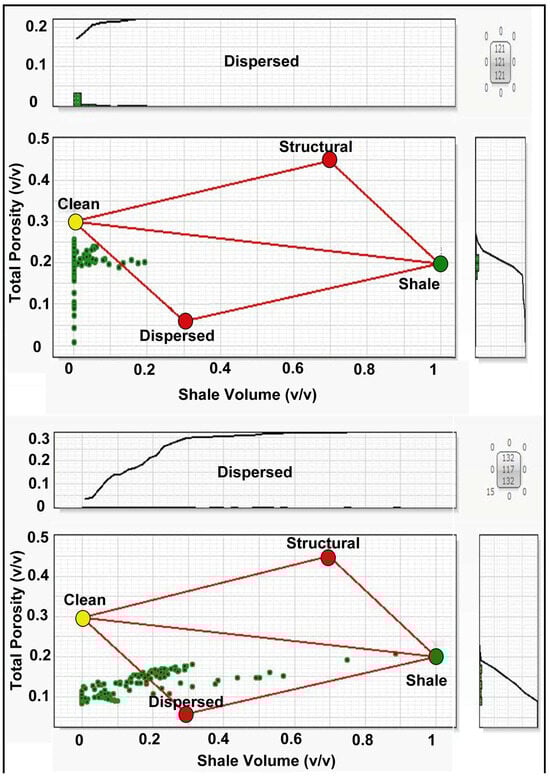
Figure 11.
Thomas–Stieber crossplot for the Baba Unit-1 Sub-Member in wells TW-1 and TW-3. Total porosity (PHIT, v/v, y-axis) and shale volume (VSH, v/v, x-axis) are derived from petrophysical log analysis. The marginal histograms show the frequency distribution of data points for each parameter. Data points predominantly follow the dispersed shale trend, indicating that clay minerals infill pore spaces—the most detrimental morphology for permeability—and explain the performance contrast between these wells.
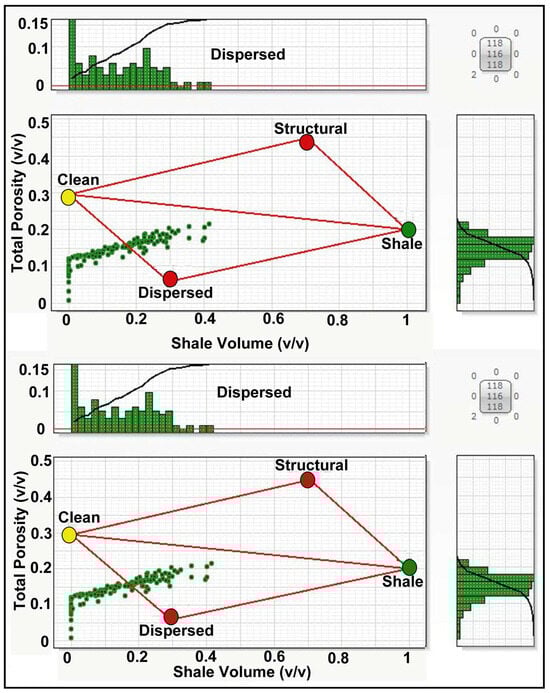
Figure 12.
Thomas–Stieber crossplot for the Baba Unit-1 Sub-Member in wells TW-4 and TN-1. Axes and histogram interpretations follow Figure 11. The persistence of the dispersed and laminated shale trends across all wells confirms that this diagenetic character is field-wide and transcends structural position.
This grouping indicates that clay minerals primarily infill pore spaces between grains, drastically reducing permeability by narrowing pore throats, while the laminations create additional vertical barriers. The same pattern holds for the Baba Unit-4 Sub-Member, where the plotted points again show a strong affinity for the dispersed and laminated shale fields, with a near-complete absence of points indicating structural shale (Figure 13 and Figure 14). This prevalence of dispersed and laminated morphologies directly explains the observed disconnect between the total porosity (PHIT) and effective porosity (PHIE) in many intervals.
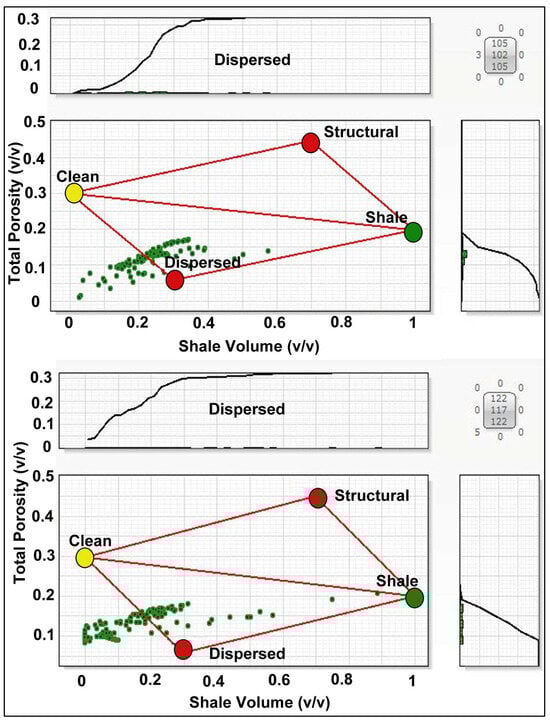
Figure 13.
Thomas–Stieber crossplot for the Baba Unit-4 Sub-Member in wells TW-1 and TW-3. PHIT and VSH are from petrophysical analysis; marginal histograms show data distribution. The strong affinity for the dispersed and laminated shale fields further validates dispersed clay as the dominant control on pore occlusion and permeability anisotropy in the Baba sands.

Figure 14.
Thomas–Stieber crossplot for the Baba Unit-4 (TW-4) and Shagar Unit-1 (TW-1) Sub-members. Parameters and histograms are as defined in previous figures. The model effectively differentiates the shale distribution patterns between two distinct reservoir units, aiding in the definition of hydraulic flow units (HFUs).
Critically, this shale distribution model transcends structural position; both the productive TW-1 well and the dry TW-3 well exhibit this same dominant diagenetic character. The results prove that permeability anisotropy is not a function of gross shale volume but is intrinsically governed by the diagenetic process that emplaced the clay within the pore system, creating pervasive, sub-seismic baffles to fluid flow.
4.2.2. Porosity Destruction
The Thomas–Stieber model is a quantitative transformation of the distribution of shale into quantifiable porosity loss, which visually represents the reduction in reservoir capacity caused by the dispersed clay by clogging microscopic pores. Well log panels provide graphic confirmation of this effect with direct negative relationships between high volumes of shale and low values of effective porosity. As an illustration, sections in the TW-3 well provide evidence of dispersed volumes of shale in the Baba Unit-1 Member that rise to 86% (Figure 15). These regions almost destroy porosity, dropping the effective porosity below 3 percent. However, the total porosity is measured as moderate readings, an archetypal sign of dispersed clay filling pore space instead of replacing grains of sand. The TW-1 well offers a more complex story: effective porosity exists with an average of 15–20 percent, where the volumes of shale are kept below 20.
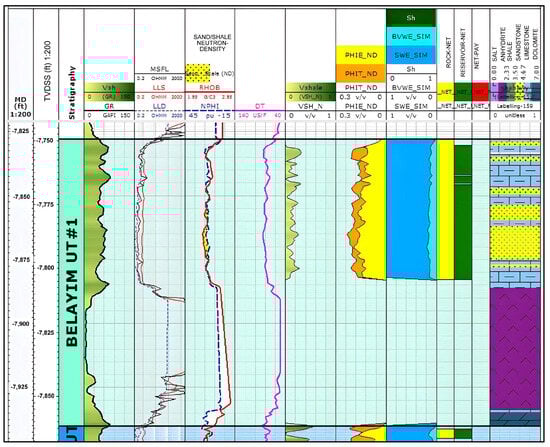
Figure 15.
Petrophysical log display for the Baba Unit-1 interval in the dry TW-3 well. Extremely high dispersed shale volume (Vsh up to 86%) destroys effective porosity (<3%), resulting in 100% water saturation and confirming diagenetic destruction is the cause of the dry hole.
However, even in this context, thin yet widespread bands of dispersed shale (Vsh 30%–50%) decrease the local porosity by 40%–60% (Figure 8). These shale-filled intervals form sub-seismic barriers that also compartmentalize the reservoir, both horizontally and vertically, thus explaining why the seismic-scale structural mapping could not predict the existence of dry holes at TW-3 and TN-1. Most instructive patterns are those obtained simply by direct comparison: intervals with similar values of total porosity have very different values of effective porosity in an absolute sense, due to the mode of shale distribution.
The explanation of such a gap between the total and effective porosity through the Thomas–Stieber model confirms that such diagenetic pore-filling processes, rather than depositional texture, can eventually determine whether porosity will be translated into permeability or be trapped in closed, non-functional pore systems.
4.3. Hydraulic Flow Units and Saturation Characteristics
4.3.1. Defining Flow Units
The combination of diagenetic minerals and distribution modeling depicts seven separate hydraulic flow units (HFUs) within the Belayim Formation. These HFUs were quantitatively defined by applying a clustering algorithm to the log-type Flow Zone Indicator (FZI) values, grouping the depth intervals with similar pore throat characteristics. As a result, each HFU is defined by a unique porosity–permeability transform and capillary pressure characteristics, which cross traditional stratigraphic grading. These range in quality from high-quality, diagenetically modified intervals (HFU 1) with porosity >20% and permeability >100 mD, to fully cemented non-reservoir units (HFU 7) with permeability <0.01 mD. Intermediately, HFU 2–4 exhibit 12%–18% porosities but sharply variable permeabilities of 5–50 mD, 1–5 mD, and 0.1–1 mD, respectively (Table 3). The definitive signature of diagenetic overprint is measured by the multi-order-of-magnitude permeability range characterized by the HFU model at comparable porosity intervals (Table 3). Its association with independent indicators highly justifies this classification: high permeability intervals (HFU 1–2) are associated with low levels of diagenetic cement, whereas low permeability (HFU 5–7) is associated with high levels of dispersed shale content (15%–35%) and high levels of anhydrite cement (Figure 16).
Table 3.
Characteristic porosity and permeability ranges for the seven defined hydraulic flow units (HFUs).
Figure 16.
Contour map of shale volume (Vsh) for the Baba Unit-1 Sub-Member. The map reveals a northwest-to-southeast trend of increasing clay content, providing a spatial context for the diagenetic degradation observed in the well data.
Capillary pressure profiles for each hydro facies unit (HFU) show increasingly higher entry pressures and shallower slopes for HFU 1 up to HFU 7, implying that pore throats are increasingly a function of diagenetic change rather than primary depositional texture. These units are so important because their cross-cutting relations are identical: the same HFUs are found in both the Baba and the Kareem Formations; proof is given here that it is not depositional conditions that control ultimate flow capacity but rather some result of diagenetic events. These HFU classes thus establish the necessary link between the flow behavior and compositional characteristics, and account for why zones whose values are alike in porosity have huge variation in production (Figure 17a,b).
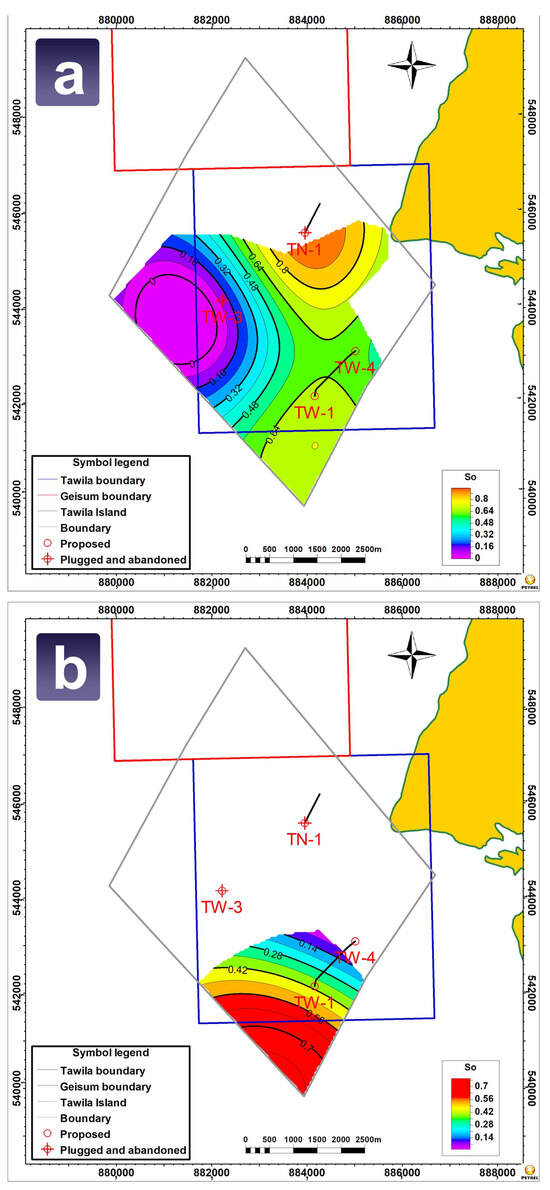
Figure 17.
Contour maps of shale volume (Vsh) illustrating the dominant NW-SE diagenetic gradient. (a) Baba Unit-4. (b) Shagar Unit-1. The increasing Vsh trend towards the southeast correlates with the location of dry wells (TW-3, TN-1).
4.3.2. The Movable vs. Residual Hydrocarbon Concept
The distinction between movable (Shm) and residual (Shr) hydrocarbon saturation, which is determined by the difference between deep and shallow resistivities, is, according to the methodology, a direct measure of the final diagenetic effect on producibility. This is why high porosity is not a sufficient condition to ensure flow. Examples of this significant rule can be observed in well log panels in a dramatic form: several intervals have good average porosity (12%–18%). However, they are controlled by residual hydrocarbons trapped in micropores or diagenetic dams.
One case in point is in the Baba Unit-1 of TW-1, in which a 17 percent porosity in the range of a depth of 2440–2444 m contains a whopping 82 percent of the hydrocarbons, a storage sector of extremely minute flow capacity due to pore throat clogging by dispersed clays (Figure 8). More severe is the case in the Baba Unit-4, containing an analogous high-porosity streak (19% PHIE) with complete hydrocarbon immobilization (Shr = 98) despite a structurally favorable position, which demonstrates severe microporosity development due to authigenic growth of clays (Figure 9).
Most illustratively, the Kareem Unit-1 demonstrates how a set of diagenetic regimes yield drastically differing fluid dynamics: intervals of equivalent porosity (14%–16% of pore volume) have 65% of their hydrocarbons being actively mobile (where dolomite cement has preserved pore linkage) or 80% of their hydrocarbons remaining stationary (where anhydrite cement has closed pore throats) (Figure 10). These saturation profiles confirm that diagenetic processes form so-called fools’ porosity—periods recorded as hydrocarbon-filled yet generate primarily water because they cannot release the stored hydrocarbons. This movable/residual principle finally accounts for the confusing production nature of the field: the dry TW-3 well was full of hydrocarbons, but they were irreversibly stuck in diagenetically altered pore systems.
4.4. Spatial Distribution of Shale Volume and Its Impact on Reservoir Quality
4.4.1. Petrophysical Contour Maps
The spatial pattern of reservoir degradation, primarily controlled by the diagenetic distribution of argillaceous material, has a coherent NW-SE trend, which explains the production behavior observed throughout the Tawila West field. This trend can be traced very clearly by the petrophysical contour maps of the Baba Unit-4. Shale volume (Vsh) increases monotonically in the northwest sector around TW-1 to 22, and in the southeast around TW-3 and TN-1 (Figure 17a). This increase in dispersed clay content directly triggers the corresponding degradation in the quality of the reservoir; the effective porosity reduces to 10 percent in the northwest to only 5 percent in the southeast (Figure 18a). Saturation maps of hydrocarbons also indicate the outcome of this diagenetic gradient value drop to 97 to 91 percent between the northwestern high-quality reservoir areas and the southeastern impaired regions (Figure 18b).
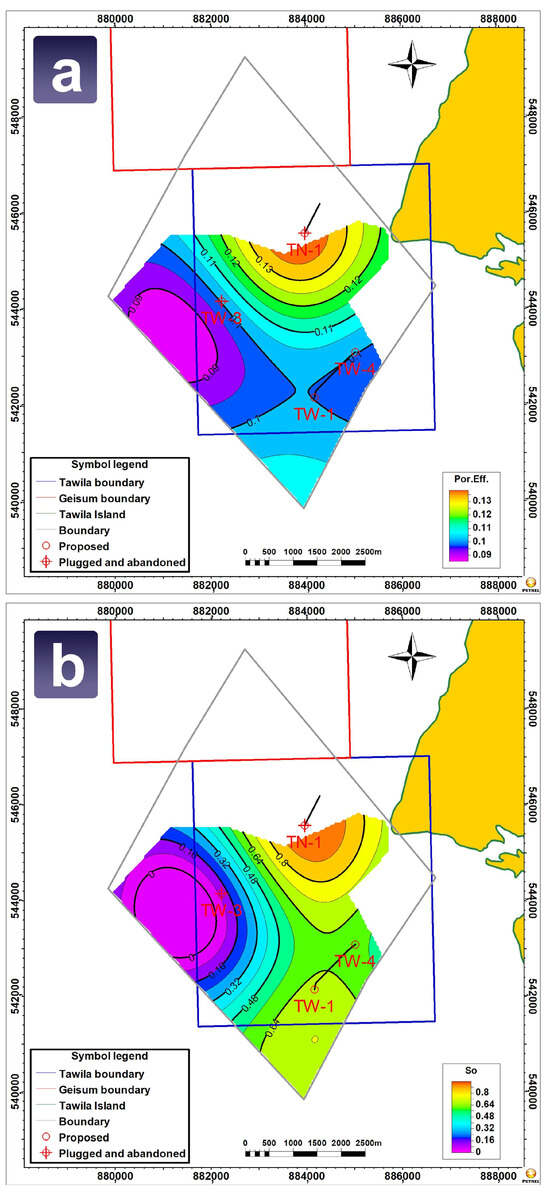
Figure 18.
Contour maps for the Baba Unit-4 Sub-Member showing the result of diagenetic gradient. (a) Effective porosity (PHIE) decreases towards the SE. (b) Hydrocarbon saturation (Sh) correspondingly drops, confirming that diagenetic pore occlusion, not structure, controls fluid distribution.
The trend (NW-SE) is also present in all the parameters and reservoir units, showing that regional diagenetic control dominates the local structural characteristics. The contour patterns show smooth transitions in their occurrence, not sudden fault control boundaries, which confirm that fluid distribution is mainly dominated by diagenesis, not structural controls. The aggregate of these maps gives the explicatory framework of the performance of the field, productive wells being concentrated in the northwestern area of good diagenesis, and dry wells being in the southeastern area where processes of pore occluding eroded reservoir potential even when apparently intact structural closures were present.
4.4.2. Three-Dimensional Property Models
The three-dimensional property models remodel our ideas about the heterogeneity of reservoirs from conceptual to spatial in that the degradation patterns in terms of diagenesis are associated, as they relate, to structural features, in a way that is not visible in traditional seismic interpretation. Such a relationship is exhibited by the porosity model (Figure 19) with breathtaking clarity: low-porosity areas (ϕ < 8%) take the form of large, interconnected bodies, preferentially oriented along fault damage zones and structural lows as highlighted by the annotations. This was particularly apparent in the southeastern sector, where well TW-3 encountered almost exclusively non-reservoir facies. High-porosity corridors (ϕ > 18), by contrast, develop tortuous, winding, and twisting routes cutting across stratigraphic boundaries and form hydraulic connections between sand bodies that would otherwise be compartmentalized on structural maps alone.
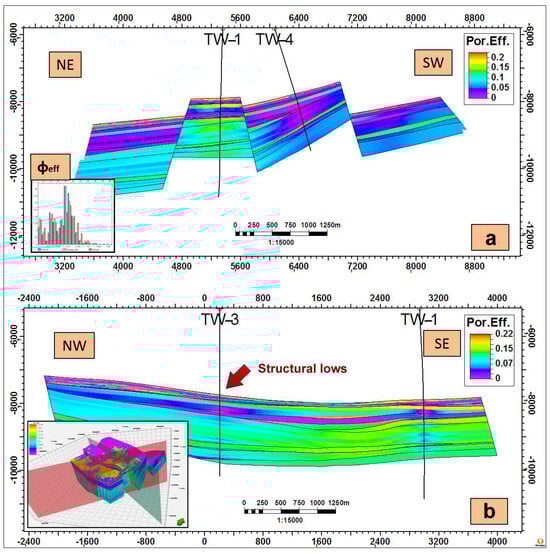
Figure 19.
Three-dimensional porosity model of the Tawila West field. Views in (a) NE-SW and (b) NW-SE directions show low-porosity bodies (ϕ < 8%) forming interconnected, sub-seismic barriers along fault zones, particularly in the SE sector near well TW-3. Arrows and labels highlight key fault zones and their associated diagenetic degradation corridors.
A remarkable feature of the model is the preservation of a relatively narrow and high-porosity track in the TW-1 well at higher depths. This phenomenon challenges the simple trends of depth compaction. This paradox is resolved by recognizing diagenetic dominant control: the high occupied by TW-1 experienced minimal cementation, preserving primary porosity. At the same time, adjacent lower structural areas were subjected to diffusive diagenesis of diffusive pores that dramatically reduce porosity.
Even more instructive patterns are seen in the hydrocarbon saturation model (Figure 20): high-saturation zones (Sh > 70%) are always found in structural positions that have undergone little to no diagenetic change, whereas low-saturation areas are always found in those regions that have higher fault density and structural complexity, as indicated by the arrows and labels on the model. This linear association indicates that fault zones acted as a medium through which diagenetic fluids formed porosity-dependent minerals, especially in the southeastern region, where the combination of the various fault systems resulted in an ideal storm of diagenetic alteration. The 3D models finally show that the most fruitful reservoir zones are those where structural location and history are conducive, where faults gave the required trapping geometries without the later destruction of porosity to fluid flow.
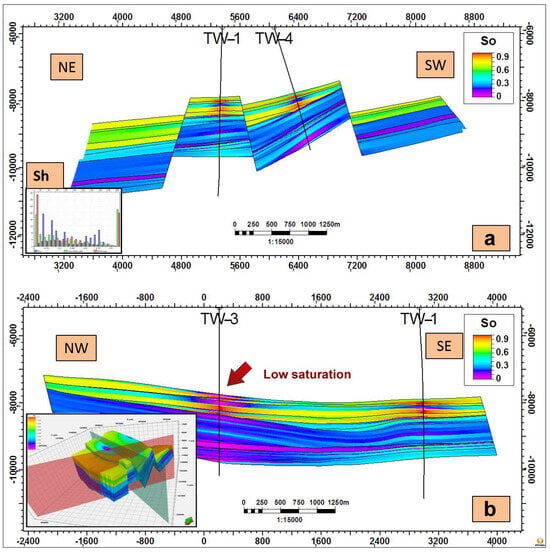
Figure 20.
Three-dimensional hydrocarbon saturation model of the Tawila West field. Views in (a) NE-SW and (b) NW-SE directions reveal that high-saturation zones (Sh > 70%) are restricted to areas with minimal diagenetic alteration, while fault corridors (annotated) are associated with low saturation due to cementation.
5. Discussion
5.1. The Diagenetic Overprint: Dominant Control on Permeability
Our results challenge the primacy of an exclusively structural model to predict the rift basin reservoirs. We demonstrate that although the faults define the main architectural compartments and, as seen in other systems, the initial sediment supply is governed by tectonic elevation [1], in the Belayim Formation, diagenetic facies within each fault block constitute primordial control fluid flow, and economic viability. This represents a paradigm shift from a tectono-sedimentary model to a diagenetic model to predict the sweet points of the reservoir. The dramatic contrast between the TW-1 productive well and the dry TW-3 well in equivalent structural elevations is strong evidence for this diagenetic replacement. The dramatic contrast between the productive TW-1 well and dry TW-3 well, situated on equivalent structural highs but with radically opposite results, is strong evidence for this diagenetic control (Table 1 and Table 2).
A critical question is whether the observed heterogeneity only expresses the inherent variation in sedimentary facies. Central and log-based facies analysis of the study wells indicates that productive intervals (e.g., TW-1) and non-productive (e.g., TW-3) are composed of well-classified sandstone facies deposited in neritic to coastal environments. The texture or composition of primary deposition cannot explain the strong contrast in its performance. Instead, diagenetic superimpression—specifically the variable infiltration of scattered clays and the precipitation of cements identified as anhydrite—has effectively imprinted the original depositional signature. Our data conclusively show that these minerals dominate permeability anisotropy, not early sedimentary facies. This diagenetic control is quantitatively represented by the seven hydraulic flow units (HFUS) that were determined by the clustering of the log-derived Flow Zone Indicator (FZI). This shows that heterogeneously flowing reservoir behavior is not a direct function of early sedimentary facies but of their diagenetic impression.
In structural highs, clean sands with low diagenetic change (HFU 1–2) are characterized by high derived permeability, consistently >50 mD, consistently measuring >50 MD, and mainly maintain moveable hydrocarbons. In heavy contrast, the sands subjected to severe diagenetic destruction (HFU 5–7) see the collapse of permeability at values below 1 MD, making them non-productive despite the sometimes-moderate porosity. On structural lows and specifically fault-proximal areas, otherwise-equivalent sands are subjected to severe diagenetic destruction in mechanisms self-evident in our study: pervasive anhydrite cementation that jams pore throats (Figure 5a,b) and disseminated clay invasion responsible for microporosity traps (Figure 11 and Figure 12).
Ironically, such diagenetic processes conjure an illusion of productive reservoirs with retained total porosity while simultaneously killing flow capacity with pore throat occlusion. The genesis of these cements is directly linked to the evaporative configuration. We interpret that hypersaline, rich in calcium sulfate, probably derived from the evaporites of the superjacent Baba Member, circulated during the funeral. These fluids entered the reservoir and deposited anhydrite cement, especially along permeability paths, i.e., fault zones and permeable intervals. They also enable the authigenesis of illitic clay that otherwise closes the pore throats. Such excess is directly traceable to the evaporative, restricted depositional environment for the Belayim Formation in which hypersaline brines operated in the basin both at deposition time and subsequently [16,21,42,43,44,45,46,47]. Such brine-rich evaporites flowed preferentially along fault regimes and structural lows, depositing a blanket of commensurately comprised pore-destroying minerals, which now cause permeability anisotropy bisecting structural divides. Therefore, the overprinting diagenesis, more than its structural architecture, comes to determine the final control for the reservoir behavior in the Belayim Formation.
This work enables us to suggest a conceptual model in which syn-rift clastic reservoir characteristics are controlled by a balance between two competing diagenetic paths strongly controlled by structural architecture. Firstly, a high-flow path occurs in structurally elevated blocks or fault-remote areas. Here, the pore fluids are stagnant or under the influence of meteoric influx, which maintains primary porosity and may build it by the dissolution of unstable detrital grains, and generates the high-permeability flow units (HFUs 1–3) that are the key to the producible sweet spots. The second, a low-flow path, prevails in structural lows and near-fault zones. These are zones of circulation for evolved basinal brines, which in evaporite-bearing rifts like the Gulf of Suez are generally hypersaline and abundant in calcium sulfate. This precipitates pervasively as pore-occluding anhydrite cement, generates authigenetically permeability-killing illite clays, and generates low-permeability units (HFUs 5–7) and “fool’s porosity.” This scenario obviates the key Tawila West field paradox: a fault may build a structural trap but, at the same time, provide a route for the diagenetic fluids that deliquesce its reservoir quality, and make successful exploration dependent on the prediction of these diagenetic zones.
5.2. Flow Unit Architecture: Explaining Production Anomalies
Calculating movable and residual hydrocarbon saturation based on the resistivity difference between the deep and shallow reading logs solves the long-running puzzle of the so-called high-porosity, low-production zones in the Tawila West field. Our research demonstrates conclusively that time-honored “net pay”-based computations utilizing just porosity and saturation cutoff values are unable to discern between effective reservoir intervals and diagenetic traps, whether hydrocarbons are trapped permanently in microporosity or behind pore throat bottlenecks. A particularly instructive example comes from the Baba Unit-4: a 19% porosity and 93% complete hydrocarbon saturation zone would customarily be classified as an exemplary reservoir zone, but is discovered in our research product to comprise 98% residual hydrocarbons (Shr) since pore-occluding anhydrite cements are generated (Figure 9). That accounts for why the likes of such intervals test unsuccessfully despite robust log responses—they have the capacity to store statically but not to deliver.
Quantitatively defined by separated FZI clusters, the seven flow units we have delineated have enabled us to overcome the previous limit since each unit demonstrates characteristic Shm/Shr relations that override structural position. Flow units 1–3, for instance, maintain Shm values higher than 60% even at moderate porosity (12%–16%), while flow units 5–7 exhibit predominantly residual saturation regardless of whatever values are used as input for porosity (Figure 17a,b). Permitting specified perforation schemes where units have favorable Shm values are prioritized over just pursuing the thickest “net pay” are enabled in this FZI-based flow unit paradigm. The model accounts for such an anomalous TW-3 well containing hydrocarbons, but in flow units 6–7, where Shr dominates, there is a de facto natural storage depot instead of a productive reservoir. Such a paradigm shift in thickness-based versus flow capacity-based characterization of reservoirs essentially changes how we design well placement and completion schemes in diagenetically complex reservoirs.
5.3. Integrated Model: Synthesis of Structure and Diagenesis
This paper describes a conceptual model whereby construction and diagenetic processes interact to create the complex Tawila West reservoir structure. Fault blocks provide first-order compartmentalization, potential trap creation, and hydraulic boundary creation; diagenetic overprint in each block ultimately dictates whether the traps produce oil.
The impact of moving compartmentalization on hydrocarbon accumulation is therefore double. Firstly, faults create structural closures that form the initial traps. Secondly, and crucially, they usually act as conduits for diagenetic fluids. Our 3D models show that fault zones are associated with diagenetic degradation corridors, where evaporitic fluids circulated, concealing porosity (Figure 19 and Figure 20). This explains the paradox of the dried holes in valid structural highs: a fault can provide the trap but later serves as a path for pore occlusion that destroys the reservoir quality within this trap. Thus, the role of a fault evolves from a migration channel and seal that connects the trap to a potential reservoir degradation agent, a critical nuance for a precise evaluation of the perspective.
The 3D property models clearly show this interaction: fault zones are always associated with diagenetic degradation corridors where the evaporitic fluids have moved through the network of fractures to form porosity-occluding minerals (Figure 19 and Figure 20). This synthesis provides a complete account of the confusing nature of the TW-3 well: it is not only in a different fault block but one on which the reservoir has experienced a severe diagenetic decay.
The well was met with large amounts of dispersed shale (up to 86% Vsh) and pervasive cementation of anhydrite (Figure 15 and Figure 7C), resulting in a reservoir with sufficient storage capacity and low potential of flow owing to the occlusion of pore throats. On the other hand, the TW 1 productive well is advantageous in its structural location and good diagenetic story, where there is minor scattered shale and good pore connectivity.
According to this combined model, structural mapping antagonizes the producible product: faults make up the containers, but diagenesis differentiates between containers containing producible hydrocarbons and containers containing geological curiosities. This application is deep-seated; successful exploration in analogous rift basins must map structural closure and diagenetic pathways, neither of which is economically predictive.
5.4. Implications for Global Rift Basins
Diagenetic controls quantified in Belayim’s clastics are fundamental in rift basins worldwide. Our workflow, which solves the competing effects of diagenesis that increase porosity and porosity occlusion, provides a model for reservoirs of character units in various contexts, from the North Sea quartz-cemented to the pre-salt carbonates of South Atlantic dissolution.
Such observations indicate dramatic similarities with other key hydrocarbons where diagenesis eventually dictates economic viability. The Brent Group of the Middle Jurassic of the North Sea offers a useful parallel. Although they experience a common structural and thermal history, there is a dramatic variation in quartz cement volumes between less than 1 per cent and almost 30 per cent within short distances due to the quartz grain size and grain-coating inhibitions [48]. Here, the kinetics of precipitation-based quartz cementation, fronted by the quartz surface area, becomes the prevailing influence of porosity reduction, with porosity maintained solely where porosity inhibition occurs at the grain-coating micro-quartz or authigenic clays [49].
Likewise, the pre-salt lacustrine carbonates of the South Atlantic are an even more complicated diagenetic riddle, where original depositional materials have been significantly distorted by dissolution, dolomitization, and silicification, thus forming diagenetic facies that are often mistaken to be entirely depositional [50]. This principle of increased porosity through fluid-mediated processes extends beyond the lacustrine configurations. For example, in the Sichuan Basin, detailed geochronological studies of Dengying and Maokou formations demonstrate how multiphase dolomitization and hydrothermal circulation, critically controlled by fault systems, can create a substantial quality of deeply buried carbonates [51,52]. In all these cases, the best reservoir units are not the initial deposition facies but the diagenetically altered rocks, where pro-defenders such as dissolution and dolomitization create superb secondary porosity. The composition of companion Mg clay minerals (e.g., stevensite) and the impact of marine incursion that brings in ions and changes diagenetic processes [53] become decisive factors in determining the performance of the reservoir.
The presented workflow is beneficial due to its applicability to the following different contexts: the combination of M-N crossplots to identify minerals (Figure 5 and Figure 6), Thomas–Stieber modeling to estimate the distribution of shale (Figure 11, Figure 12, Figure 13 and Figure 14), and the detailed saturation analysis (Figure 8, Figure 9 and Figure 10) provides a solid template in the analysis of similar permeability anisotropy problems in different rift basins. Between the North Sea and the South Atlantic, the general law is obvious: the key to successful reservoir forecasting lies not in the continuation of structural mapping but in the description of the diagenetic facies that ultimately determine whether the hydrocarbons are going to move or should be trapped in the delicate porosity structures.
6. Conclusions
This paper shows that the major control of permeability anisotropy in Belayim Formation reservoirs is not structural geometry but diagenetic imprinting. Petrophysical analysis is used to verify that scattered clay and anhydrite cement block pore throats, decreasing the permeability by over a couple of orders of magnitude at comparable porosity values. The Thomas–Stieber model makes it clear that the structure of the shale distribution is such that the baffles are sub-seismic, which explains the dry holes in structurally high locations. We numerically characterize seven hydraulic flow units (HFUs) cutting through the stratigraphy, each with a distinctive porosity–permeability relationship associated with diagenetic facies.
More importantly, disconnecting between storage and flow results in fools’ porosity, wherein, when the overall porosity is high, only a trace amount of hydrocarbons will be trapped. The 3D models of fluid distribution are controlled by an NW-SE diagenetic gradient, which declines the quality of reservoirs to the southeast. Therefore, a paradigm change is needed to achieve successful exploration by replacing a structural paradigm with a diagenetically informed paradigm in which it is essential to predict the distribution of pore-occluding minerals to determine the locations of producible sweet spots.
Author Contributions
Conceptualization, M.F. and H.M.A.; methodology, software, validation, M.F., H.M.A., and M.M.A.; statistical analysis M.M.A. formal analysis M.F. and H.M.A.; investigation M.F. and H.M.A.; resources, M.M.A.; data curation, M.F., H.M.A., and M.M.A.; writing—original draft preparation, M.F. and H.M.A.; writing—review and editing, M.F., H.M.A., and M.M.A.; visualization, M.F. and H.M.A.; supervision, M.F. and H.M.A.; project administration, M.F., H.M.A., and M.M.A. All authors have read and agreed to the published version of the manuscript.
Funding
This work was supported and funded by the Deanship of Scientific Research at Imam Mohammad Ibn Saud Islamic University (IMSIU) (grant number IMSIU-DDRSP2502).
Data Availability Statement
The datasets are not publicly available, but interested parties can request access directly from the corresponding author. Please include a clear explanation of your intended use of the data and any relevant qualifications in your request. The corresponding author will assess requests based on relevance and appropriateness, ensuring compliance with ethical guidelines and regulations.
Conflicts of Interest
The authors declare no financial interests or personal relationships that could influence the results or conclusions of this work. They uphold transparency to ensure the research’s integrity remains unbiased and free from conflicts.
References
- Yang, H.-F.; Qian, G.; Zhao, M.; Gao, Y.-F.; Su, W.; Xu, Y.-H. Sediment supply mechanism and its influence on hydrocarbon accumulation in the Paleogene of the northern Huanghekou Sag, Bohai Bay Basin, China. J. Palaeogeogr. 2023, 12, 229–245. [Google Scholar] [CrossRef]
- Emishaw, L.; Katumwehe, A.; Leseane, K.; Demissie, Z.; Mickus, K.; Abdelsalam, M. The legacy of the East African rift system in understanding continental rifts worldwide from geophysical studies (with emphasis on gravity and magnetic studies). J. Afr. Earth Sci. 2025, 226, 105589. [Google Scholar] [CrossRef]
- Amorim, C.E.d.S.; Leite, C.d.M.M.; Barbosa, J.S.F.; Corrêa-Gomes, L.C. The influence of the structural framework on the sedimentation of the Maracangalha Formation in the southern compartment of the Recôncavo Basin. J. S. Am. Earth Sci. 2025, 164, 105627. [Google Scholar] [CrossRef]
- Spina, V.; Olagundoye, O.; Chizea, C.; Pellettier, J.; Onyeanuna, C.; Parsa, A.; Joubert, T.; Fashanu, M.; Enuma, C.; Ifihan, J.J.; et al. Unravelling the impact of geological heterogeneities in the reservoir management. An integrated study of the deep-water Akpo field (Niger delta). Mar. Pet. Geol. 2023, 150, 106132. [Google Scholar] [CrossRef]
- Bosworth, W.; McCaly, K. Structural and stratigraphic evolution of the Gulf of Suez rift, Egypt: A synthesis. In Peri-Tethyan Rift/Wrench Basins and Passive Margins; Ziegler, P.A., Cavazza, W., Robertson, A.H.F., Crasquin-Soeau, S., Eds.; Mémoire Musee Histoire Naturelle, PeriTethys Memoir 6; Publ. sc. du Muséum: Paris, France, 2001; Volume 186, pp. 567–606. [Google Scholar]
- Moustafa, A.R. Controls on the Geometry of Transfer Zones in the Suez Rift and Northwest Red Sea: Implications for the Structural Geometry of Rift Systems. Am. Assoc. Pet. Geol. Bull. 2002, 86, 979–1002. [Google Scholar]
- Hewaidy, A.G.A.; Ayyad, H.M.; Abd El-Moghny, M.W.; Gameel, O. Sequence stratigraphy and biozonation of the Upper Eocene Anqabiya Formation, Gebel Anqabiya, Egypt. Geosci. J. 2019, 23, 357–375. [Google Scholar] [CrossRef]
- Salah, M.G.; Alsharhan, A.S. The Miocene Kareem Formation in the southern Gulf of Suez, Egypt: A review of stratigraphy petroleum geology. J. Pet. Geol. 1997, 20, 327–346. [Google Scholar] [CrossRef]
- Alsharhan, A.S. Petroleum geology and potential hydrocarbon plays in the Gulf of Suez rift basin, Egypt. Am. Assoc. Pet. Geol. Bull. 2003, 87, 143–180. [Google Scholar]
- Hewaidy, A.G.A.A.G.A.; Farouk, S.; Ayyad, H.M.H.M. Nukhul formation in wadi baba, southwest sinai peninsula, Egypt. GeoArabia 2012, 17, 103–120. [Google Scholar] [CrossRef]
- Ayyad, H.M.; Bazeen, Y.S.; Samir, A.; Ghanem, S.G.; Ali, A.H.; Gaafar, A.T.; Abdel-Gawad, A. Foraminiferal Proxies Reveal Miocene Climatic Shifts in the Gulf of Suez: Insights from the Rudeis and Kareem Formations on Lithostratigraphic Ambiguities and Central Paratethys Climatic Linkages During Burdigalian-Langhian Intervals. Geol. J. 2025. [Google Scholar] [CrossRef]
- Gawad, E.A.; Fathy, M.; Reda, M.; Ewida, H. Source rock evaluation of the Central Gulf of Suez, Egypt: A 1D basin modelling and petroleum system analysis. Geol. J. 2021, 56, 3850–3867. [Google Scholar] [CrossRef]
- Ayyad, H.M.; Hewaidy, A.G.A.; Farouk, S.; Samir, A.; Bazeen, Y.S. Sequence stratigraphy of the upper Oligocene–middle Miocene succession in west–central Sinai, Egypt. Geol. J. 2023, 58, 264–282. [Google Scholar] [CrossRef]
- Hewaidy, A.G.A.; Farouk, S.; Ayyad, H.M. Foraminifera and sequence stratigraphy of Burdigalian—Serravallian successions on the eastern side of the Gulf of Suez, southwestern Sinai, Egypt. Neues Jahrb. Geol. Palaontol.—Abh. 2013, 270, 151–170. [Google Scholar] [CrossRef]
- Ayyad, H.M.; Semary, H.E.; Fathy, M.; Hassan, A.H.; Ben Ghorbal, A.; Reda, M. Multifactorial Controls on Carbonate–Clastic Sedimentation in Rift Basins: Integrated Foraminiferal, Sequence Stratigraphic, and Petrophysical Analysis, Gulf of Suez, Egypt. Minerals 2025, 15, 864. [Google Scholar] [CrossRef]
- EGPC. Oligocene and Miocene Rock Stratigraphy of the Gulf of Suez Region; Egyptian General Petroleum Corporation (EGPC): Cairo, Egypt, 1964. [Google Scholar]
- Hewaidy, A.G.A.; Farouk, S.; Ayyad, H.M. Integrated biostratigraphy of the upper Oligocene-middle Miocene successions in west central Sinai, Egypt. J. Afr. Earth Sci. 2014, 100, 379–400. [Google Scholar] [CrossRef]
- Nabawy, B.S.; El Sharawy, M.S. Hydrocarbon potential, structural setting and depositional environments of Hammam Faraun Member of the Belayim Formation, Southern Gulf of Suez, Egypt. J. Afr. Earth Sci. 2015, 112, 93–110. [Google Scholar] [CrossRef]
- Abuhagaza, A.A.; Kassab, M.A.; Wanas, H.A.; Teama, M.A. Reservoir quality and rock type zonation for the Sidri and Feiran members of the Belayim Formation, in Belayim Land Oil Field, Gulf of Suez, Egypt. J. Afr. Earth Sci. 2021, 181, 104242. [Google Scholar] [CrossRef]
- NSSC. Miocene rock stratigraphy of Egypt. Egypt J. Geol. 1976, 18, 59. [Google Scholar]
- Youssef, A. Coastal to Shallow Marine Miocene Facies in Zeit Bay area, Gulf of Suez. In Proceedings of the 8th EGPC, Exploration Seminar, Cairo, Egypt; 1986; Volume 1, pp. 344–359. [Google Scholar]
- Ayyad, H.M.; El-Sharnoby, A.A.; El-Morsy, A.M.; Ahmed, M.A.; El-Deeb, A.A. Quantitative reconstruction of paleoenvironmental conditions in the Gulf of Suez during the Burdigalian-Langhian (early to middle Miocene) using benthic foraminifera. Palaeogeogr. Palaeoclimatol. Palaeoecol. 2018, 503, 51–68. [Google Scholar] [CrossRef]
- Reda, M.; Salem, T.; Abdel-Fattah, M.I.; Fathy, M.; Farouk, S.; Al-Kahtany, K.; Gentzis, T. Petroleum system analysis of the Ras Ghara oil Field: Geochemical evaluation and 2D basin modelling of pre-rift and syn-rift formations in the southern Gulf of Suez, Egypt. Mar. Pet. Geol. 2025, 180, 107464. [Google Scholar] [CrossRef]
- Bosworth, W.; Khalil, S.; Clare, A.; Comisky, J.; Abdelal, H.; Reed, T.; Kokkoros, G. Integration of outcrop and subsurface data during the development of a naturally fractured Eocene carbonate reservoir at the East Ras Budran concession, Gulf of Suez, Egypt. Geol. Soc. Spec. Publ. 2014, 374, 333–359. [Google Scholar] [CrossRef]
- Moustafa, A.R.; Abdeen, M.M. Structural setting of the Hammam Faraun block, eastern side of the Suez rift. J. Univ. Kuwait 1992, 19, 291–309. [Google Scholar]
- Bosworth, W. A high-strain rift model for the southern Gulf of Suez (Egypt). Geol. Soc. Lond. Spec. Publ. 1995, 80, 75–102. [Google Scholar] [CrossRef]
- Khalil, S.M.; McClay, K.R. Structural control on syn-rift sedimentation, northwestern Red Sea margin, Egypt. Mar. Pet. Geol. 2009, 26, 1018–1034. [Google Scholar] [CrossRef]
- Khalil, S.; McClay, K. Extensional hard linkages, eastern Gulf of Suez, Egypt. Geology 1998, 26, 563–566. [Google Scholar] [CrossRef]
- Garfunkel, Z.; Bartov, Y. The tectonics of the Suez Rift. Geol. Surv. Isr. Bull. 1977, 71, 1–44. [Google Scholar]
- Richardson, M.; Arthur, M.A. The Gulf of Suez-northern Red Sea neogene rift: A quantitive basin analysis. Mar. Pet. Geol. 1988, 5, 247–270. [Google Scholar] [CrossRef]
- Patton, T.L.; Moustafa, A.R.; Nelson, R.A.; Abdine, S.A. Tectonic Evolution and Structural Setting of the Suez Rift. In Interior Rift Basins; American Association of Petroleum Geologists: Tulsa, OK, USA, 1994; pp. 9–55. [Google Scholar]
- Othman, A.A.A.; Fathy, M.; Hashem, M.E. Three-dimensional static reservoir modelling of Kareem sandstone reservoir, Tawilla Oil Field, at the southern region of Gulf of Suez, Egypt. Geol. J. 2024, 59, 3258–3277. [Google Scholar] [CrossRef]
- Evans, A.L. Neogene tectonic and stratigraphic events in the Gulf of Suez rift area, Egypt. Tectonophysics 1988, 153, 235–247. [Google Scholar] [CrossRef]
- Ayyad, H.; Hewaidy, A.G.; Hewaidy, A. Chattian-Aquitanian calcareous nannofossil biostratigraphy of the Nukhul Formation in Wadi Baba Section, West Central Sinai, Egypt. Stratigraphy 2016, 13, 67–81. [Google Scholar] [CrossRef]
- Mansour, S.; Abdelfadil, K.M.; Hasebe, N.; Tamura, A.; Abdelrahman, K.; Gharib, M.A.; Fnais, M.S.; Shehata, A.A. Thermochronological Constraints on the Tectonic History of the Arabian–Nubian Shield’s Northern Tip, Sinai, Egypt. Minerals 2024, 14, 1246. [Google Scholar] [CrossRef]
- Juhasz, I. Assessment of the distribution of shale, porosity and hydrocarbon saturation in shaly sands. In Proceedings of the 10th European Formation Evaluation Symposium Transactions, Aberdeen, UK, 22–25 April 1986; Volume 10. [Google Scholar]
- Thomas, E.C.; Stieber, S.J. The distribution of shale in sandstones and its effect upon porosity. In Proceedings of the SPWLA Annual Logging Symposium, New Orleans, LA, USA, 4–7 June 1975; p. SPWLA-1975. [Google Scholar]
- Simandoux, P. Dielectric Measurements on Porous Media: Application to Measurement of Water Saturation. Study of the Behaviour of Argillaceous Formatio; SPWLA: Houston, TX, USA, 1963; pp. 97–124. [Google Scholar]
- Amaefule, J.O.; Altunbay, M.; Tiab, D.; Kersey, D.G.; Keelan, D.K. Enhanced Reservoir Description: Using Core and Log Data to Identify Hydraulic (Flow) Units and Predict Permeability in Uncored Intervals/Wells. In Proceedings of the SPE Annual Technical Conference and Exhibition, Houston, TX, USA, 3–6 October 1993; pp. 205–220. [Google Scholar]
- Deutsch, C.V.; Journel, A.G. GSLIB Geostatistical Software Library and User’s Guide, 2nd ed.; Oxford University Press: New York, NY, USA, 1997. [Google Scholar]
- Dubois, M.K.; Byrnes, A.P.; Bohling, G.C.; Seals, S.C.; Doveton, J.H. Statistically-based lithofacies predictions for 3-D reservoir modeling: Examples from the Panoma (Council Grove) Field, Hugoton Embayment, Southwest Kansas. In Proceedings of the American Association of Petroleum Geologists Annual Convention, Salt Lake City, UT, USA, 11–14 May 2003; Volume 12, p. A44. [Google Scholar]
- Hewaidy, A.G.A.; Ayyad, H.M.; Abdallah, A. Subsurface lower–middle Miocene biostratigraphy of Ras El Ush oil field, G. Zeit Area, Gulf of Suez, Egypt. Al Azhar Bull. Sci. 2018, 29, 1–18. [Google Scholar]
- Ayyad, H.M.; Hewaidy, A.G.A.; Al-Labaidy, N.A. Sequence stratigraphy of the Miocene siliciclastic–carbonate sediments in Sadat Area, north-west of Gulf of Suez: Implications for Miocene eustasy. Geol. J. 2022, 57, 2255–2270. [Google Scholar] [CrossRef]
- Ayyad, H.M.; Hewaidy, A.G.A.; Omar, M.; Fathy, M. Sequence stratigraphy and reservoir quality of the Gulf of Suez syn-rift deposits of the Nukhul formation: Implications of rift initiation and the impact of eustacy and tectonic on deposition. Mar. Pet. Geol. 2023, 156, 106459. [Google Scholar] [CrossRef]
- Mansour, S.; Hasebe, N.; Abdelrahman, K.; Fnais, M.S.; Tamura, A. Reconstructing the Tectonic History of the Arabian–Nubian Shield in Sinai: Low-Temperature Thermochronology Implications on Wadi Agar Area. Minerals 2023, 13, 574. [Google Scholar] [CrossRef]
- Farouk, S.; Fagelnour, M.; Zaky, A.S.; Arafat, M.; Salama, A.; Al-Kahtany, K.; Gentzis, T.; Jovane, L. Petroleum System Evaluation: Hydrocarbon Potential and Basin Dynamics in Abu Darag Sub-Basin, Northern Gulf of Suez (Egypt). Minerals 2024, 14, 1154. [Google Scholar] [CrossRef]
- Saleh, G.M.; Kamar, M.S.; Khaleal, F.M.; Azer, M.K.; Nasr, T.; Lasheen, E.S.R. Petrogenesis and tectonic evolution of tourmaline- bearing leucogranites, Sikait area, Southeastn desert of Egypt utilizing mineralogical and bulk rock analysis. Sci. Rep. 2025, 15, 20191. [Google Scholar] [CrossRef]
- Walderhaug, O. Modeling Quartz Cementation and Porosity in Middle Jurassic Brent Group Sandstones of the Kvitebjørn Field, Northern North Sea. Am. Assoc. Pet. Geol. Bull. 2000, 84, 1325–1339. [Google Scholar] [CrossRef]
- Khan Niazi, A.M.; Jahren, J.; Mahmood, I.; Javaid, H. Reservoir quality in the Jurassic sandstone reservoirs located in the Central Graben, North Sea. Mar. Pet. Geol. 2019, 102, 439–454. [Google Scholar] [CrossRef]
- Azerêdo, A.C.; Duarte, L.V.; Silva, A.P. The challenging carbonates from the Pre-Salt reservoirs offshore Brazil: Facies, palaeoenvironment and diagenesis. J. S. Am. Earth Sci. 2021, 108, 103202. [Google Scholar] [CrossRef]
- Su, A.; Chen, H.; Feng, Y.; Zhao, J.; Wang, Z.; Hu, M.; Jiang, H.; Duc Nguyen, A. In situ U-Pb dating and geochemical characterization of multi-stage dolomite cementation in the Ediacaran Dengying Formation, Central Sichuan Basin, China: Constraints on diagenetic, hydrothermal and paleo-oil filling events. Precambrian Res. 2022, 368, 106481. [Google Scholar] [CrossRef]
- Su, A.; Wang, Z.; Chen, H.; Feng, Y.; Zhao, J.; Jiang, H.; Nguyen, A.D.; Sun, P. Temporal constraints on hydrothermal circulation associated with strike-slip faulting in the Permian Maokou carbonates, central Sichuan Basin (SW China). Mar. Pet. Geol. 2024, 160, 106643. [Google Scholar] [CrossRef]
- Cui, X.; Wignall, B.; Freeman, K.H.; Summons, R.E. Early Cretaceous marine incursions into South Atlantic rift basins originated from the south. Commun. Earth Environ. 2023, 4, 6. [Google Scholar] [CrossRef]
Disclaimer/Publisher’s Note: The statements, opinions and data contained in all publications are solely those of the individual author(s) and contributor(s) and not of MDPI and/or the editor(s). MDPI and/or the editor(s) disclaim responsibility for any injury to people or property resulting from any ideas, methods, instructions or products referred to in the content. |
© 2025 by the authors. Licensee MDPI, Basel, Switzerland. This article is an open access article distributed under the terms and conditions of the Creative Commons Attribution (CC BY) license (https://creativecommons.org/licenses/by/4.0/).