Abstract
The provenance of the Middle-Upper Permian in the Lintan and Jiangligou areas, remnants of rift basin sedimentation within the West Qinling, remains controversial, hindering understanding of the basin-range coupling evolution of the Qinling Orogenic Belt and its periphery. Heavy minerals, major and trace elements, rare earth elements, detrital zircon U-Pb dating, and in situ Lu-Hf isotopes were analyzed to determine the provenance of the Middle-Upper Permian sandstones. Results were integrated with previous studies to investigate basin-range coupling processes. The results reveal the following: (1) The Upper Member of the Shilidun Formation in the Lintan area was deposited during the Late Permian. Heavy minerals are dominated by moderately to highly stable species. Source rocks were derived from intermediate-acidic magmatic rocks and low- to medium-grade metamorphic terrains. The provenance was primarily situated in a continental island arc tectonic setting. Diverse source rock types were identified, including materials from felsic igneous, quartzose recycled, and mafic igneous provenances. Detrital zircon U–Pb age spectra display two major peak ages at 285 Ma and 442 Ma, along with five subordinate peaks at 818 Ma, 970 Ma, 1734 Ma, 1956 Ma, and 2500 Ma. The εHf(t) values range from –44.95 to 42.67, and TDM2 ages vary from 367 Ma to 4106 Ma. It is concluded that the sedimentary materials were mainly derived from the North Qinling Orogenic Belt, with minor contributions from the basement of the North China Craton. (2) In the Jiangligou area, the Shiguan Formation is characterized by highly and stable heavy minerals. The provenance is dominated by intermediate-acidic magmatic rocks, within an oceanic island arc tectonic setting. Detrital zircon U–Pb age spectrum displays a prominent peak at 442 Ma. The εHf(t) values range from –0.5 to 10.55, with TDM2 ages ranging from 744 Ma to 897 Ma. These results indicate that the sedimentary materials were derived from the North Qilian Orogenic Belt. (3) The Permian in the Western Qinling exhibit multi-provenance supply, dominated by the North Qinling Orogenic Belt and the North China Craton basement, with local contributions from the North Qilian Orogenic Belt. Significant regional variations in provenance contributions were identified. This study further constrains the closure of the Shangdan Ocean to pre-Late Permian. It reveals that the Western Qinling was situated in a back-arc rift basin setting during the Late Paleozoic. Key sedimentary evidence is provided for understanding the tectonic evolution of the Paleo-Tethys Ocean and the collision between the North China and Yangtze cratons.
1. Introduction
Sedimentary basins and orogenic belts are fundamental tectonic units of the continental lithosphere, forming interdependent components within unified geodynamic systems [1]. These coupled systems exhibit spatial coexistence, mass transfer, evolutionary transformation, and dynamic interchange [1]. Provenance analysis of the basin plays a crucial role in deciphering the connections between sedimentary basins and orogenic belts. Numerous studies worldwide have employed various methods for provenance analysis. For instance, Dickinson et al. (2015) utilized detrital zircon U–Pb geochronology to trace the provenance of the Glen Canyon and San Rafael Groups on the Colorado Plateau and adjacent regions [2]. Fornelli et al. (2019) integrated petrography, whole-rock geochemistry, and detrital zircon U–Pb geochronology to investigate the provenance of the Bifurto Formation in the Southern Apennines, Italy [3]. More recently, Asmussen et al. (2023) applied stratigraphic logging, sandstone petrography, detrital zircon, and rutile U–Pb dating to study the provenance of the Adavale and Darling Basins in Australia [4].
The Qinling Orogenic Belt (QinOB), located between the North China and Yangtze blocks (China), has a prolonged and complex tectonic history, making it one of the most debated regions [5]. Previous research has predominantly focused on the eastern segment (East Qinling Tectonic Belt). The West Qinling Tectonic Belt remains less studied. Detailed investigation of the West Qinling Tectonic Belt is crucial for understanding the complete tectonic evolution of the QinOB [5]. The West Qinling Tectonic Belt borders the North China Craton (NCC) to the north, the Qilian Tectonic Belt and Qaidam Basin to the west, and the Songpan-Ganzi Block to the south (Figure 1) [6]. It represents the western extension of the QinOB and is a key component of the Central Orogenic System [5]. Its northern boundary is defined by the Wushan-Tianshui Fault, and its southern boundary by the Maqin-Diebu Fault. It connects with the East Qinling Tectonic Belt via the Huicheng Basin to the east and adjoins the East Kunlun Orogenic Belt via the Gonghe Basin to the west [5].
Previous provenance studies on Permian sandstones within the West Qinling rift basins have been conducted [5,6,7,8]. For instance, Chen et al. (2008) analyzed Permian sandstones from northern Hezuo and northwestern Longxian using whole-rock geochemistry, suggesting primary derivation from the North China Craton basement (NCCB) and secondary contributions from the North Qinling Orogenic Belt (NQinOB) [6]. Zhang et al. (2014) investigated the provenance of the Middle Permian Maomaolong Formation (Fm.) near Hezuo (MML Fm., Figure 1) using detrital zircon U-Pb dating and Lu-Hf isotopes, indicating sources from the NCC, NQinOB, Qilian Tectonic Belt, and Kunlun Orogenic Belt [9]. Yan (2017) analyzed the Permian Ganjia Fm. in the southern Xunhua area (adjacent to Jiangligou area, GJ Fm., Figure 1) using sandstone petrography, whole-rock geochemistry, and detrital zircon U-Pb dating, suggesting derivation from the Qilian Tectonic Belt [8]. Chang (2019) studied the Middle Member Shilidun Fm. of the Middle-Upper Permian in the Minxian area (MX-M, Figure 1), proposing primary sources from the NQinOB and eastern North Qilian Orogenic Belt (NQiOB), with minor potential input from the NCCB [10]. Gao et al. (2019) analyzed the Upper Member Shilidun Fm. of the Middle-Upper Permian in Lintan area (LT-U, Figure 1) using detrital zircon U-Pb dating, indicating main derivation from the NCCB, followed by the northern West Qinling Tectonic Belt and eastern Qilian Tectonic Belt [5]. Feng et al. (2023) concluded that the Shilidun Fm. in Lintan area was mainly sourced from the NCCB based on major and trace element analysis [7].
Despite these efforts, significant discrepancies remain regarding the provenance of Permian sandstones within the West Qinling, and the basin-range coupling relationships with surrounding orogenic belts are still poorly constrained. This study integrates heavy mineral analysis, major and trace element geochemistry, detrital zircon U-Pb geochronology, and in situ Lu-Hf isotopes to determine the sedimentary-tectonic attributes, material composition, and provenance of the Middle-Upper Permian in Lintan and Jiangligou areas. Results are compared with previous Permian provenance studies in the West Qinling to elucidate the Permian basin-range coupling processes, providing new evidence for the Late Paleozoic tectonic evolution of the QinOB.
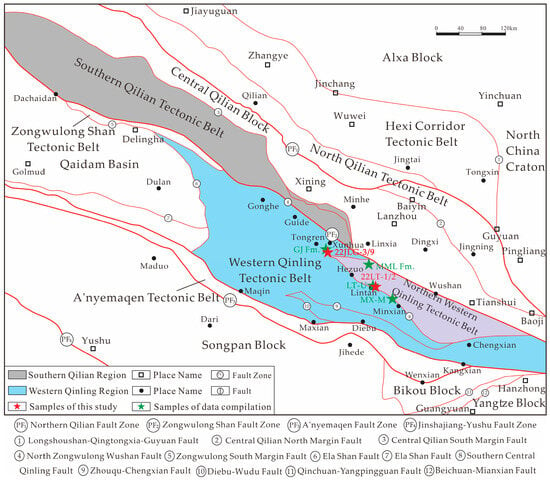

Figure 1.
Tectonic unit map of the West Qinling-Qilian Orogenic Belt. The base map is according to Chen, 2019 [11]; the 22LT-1/2 (Upper Shilidun Fm., Upper Permian, Lintan area) and 22JLG-3/9 (Shiguan Fm., Upper Permian, Jiangligou area) samples are from this study; the GJ Fm. (Ganjia Fm., Permian, Xunhua area) data are from Yan, 2017 [8]; the MML Fm. (Maomaolong Fm., Middle Permian, Hezuo area) data are from Zhang et al., 2014 [9]; the LT-U (Upper Shilidun Fm., Middle-Upper Permian, Lintan area) data are from Gao et al., 2019 [5]; the MX-M (Middle Shilidun Fm., Middle-Upper Permian, Minxian area) data are from Chang, 2019 [10].
2. Geological Background
The Lintan area is located in Gansu Province, China. Tectonically, it lies within a rift basin on the western margin of the West Qinling northern belt (Figure 1). The exposed strata range from Late Paleozoic to Cenozoic, including Upper Devonian Dacaotan Fm. (D3dc), Lower Carboniferous Badu Fm. (C1b), Upper Carboniferous Xiajialing Fm. (C2x), Middle-Upper Permian Shilidun Fm. (P2−3sl), Lower Triassic Longwuhe Fm. (T1l), Middle Triassic Guanggaishan Fm. (T2gg), Upper Triassic Daheba Fm. (T3d), Lower Cretaceous Mogou Fm. (K1m), Upper Neogene Linxia Fm. (N2l), and Quaternary (Q) (Figure 2b) [5].
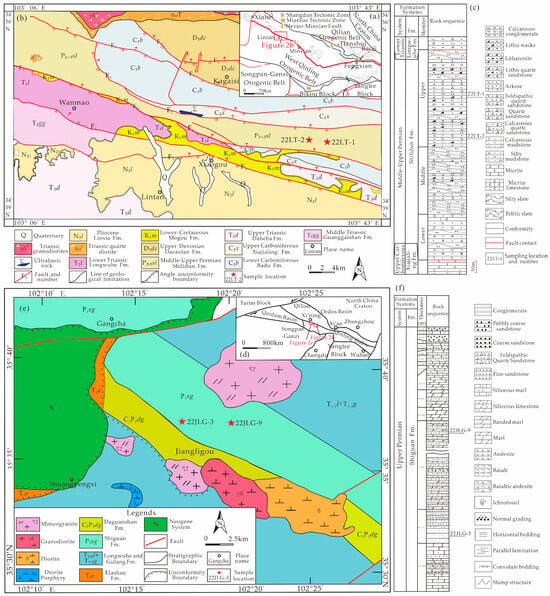
Figure 2.
Tectonic sketch map of the West Qinling Tectonic Belt ((a), after Li et al., 2019 [12]), the regional geology of the Lintan area, West Qinling ((b), after Li et al., 2019 [12]), the stratigraphic column of the Lintan area ((c), after Gao et al., 2019 [5]), the tectonics of central–western China ((d), after Sun et al., 2013 [13]), the regional geology of the Jiangligou area ((e), modified from Sun et al., 2013 [13]), and the stratigraphic column of the Jiangligou area (f).
The Middle-Upper Permian Shilidun Fm. is exposed in the central–northern Lintan area, covering a large area distributed along a NWW-SEE trend between Shenzang towns, Xiezangdagou, and Meiwu towns (Figure 2b) [5]. It is divided into three members (Figure 2c): The Lower Member comprises grey medium-to-thickly bedded medium-coarse quartz sandstone and fine feldspathic sandstone interbedded with minor black silty slate. The Middle Member consists of bluish-grey to grey-black silty slate interbedded with medium-thick fine feldspathic quartz sandstone, medium-thick medium-coarse lithic quartz sandstone, and medium-thin fine quartz sandstone. The Upper Member is dominated by grey to grey-black medium-thick medium-coarse to medium-fine feldspathic quartz sandstone, lithic greywacke, arkose, fine quartz sandstone, and lithic sandstone, interbedded with silty slate, carbonaceous argillaceous slate, calcareous conglomerate, and thin micritic limestone [5]. Fresh surfaces of Shilidun Fm. sandstones are grey-black to bluish-grey (Figure 3a), while weathered surfaces are yellowish-brown (Figure 3a). It was deposited in a shallow marine shelf environment [7]. Low compositional and textural maturity indicate proximal sedimentation [5].
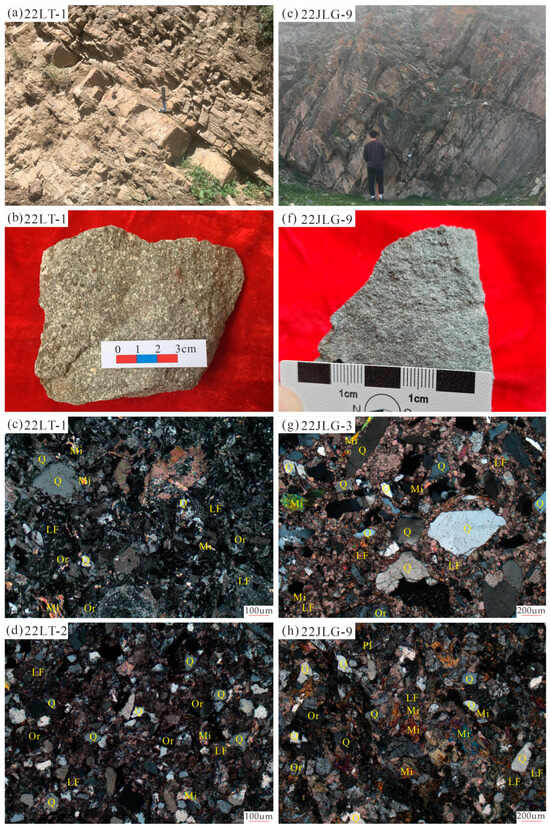
Figure 3.
Field photos (a,e), sample photos (b,f) and microscopic photos (c,d,g,h) from the Lintan and Jiangligou areas of the Western Qinling. (a) The 22LT-1 sample from Lintan area, the photos taken near the location show sandstone interbedded with mudstone and siltstone. (b) Sample 22LT-1 from Lintan area, gray medium sandstone. (c) Photomicrograph of sample 22LT-1 from Lintan area (+) 100×. (d) Photomicrograph of sample 22LT-2 from Lintan area (+) 100×. (e) The 22JLG-9 sample from the Jiangligou area, the photos taken near the location show sandstone interbedded with siltstone. (f) Sample 22JLG-9 from Jiangligou area, greyish-green medium sandstone. (g) Photomicrograph of sample 22JLG-3 from Jiangligou area (+) 50×. (h) Photomicrograph of sample 22JLG-9 from Jiangligou area (+) 50×. Q: quartz, Pl: plagioclase, Mi: mica, LF: lithic fragment, Or: orthoclase.
The Jiangligou area is located in Tongren County, Qinghai Province, China. Tectonically, it lies on the southern margin of the northern West Qinling Tectonic Belt (Figure 1 and Figure 2d) and has a complex evolutionary history [13]. Exposed strata include the undivided Middle Carboniferous-Middle Permian Daguanshan Fm. (C2P2dg), Upper Permian Shiguan Fm. (P3sg), and Lower-Middle Triassic Longwuhe Fm. (T1−2l) and Gulangti Fm. (T1−2g, Figure 2e,f). The Upper Permian Shiguan Fm. comprises grey-green siliceous marl, grey-green thin-bedded banded siliceous limestone, and grey-green medium-coarse feldspathic quartz sandstone (Figure 3d) [13].
3. Samples and Methods
3.1. Samples and Petrography
Two sandstone samples were collected from Lintan area (22LT-1 and 22LT-2, Figure 1 and Figure 2b). Sample 22LT-1 (N34°45′3.7314″, E103°37′33.1654″) is a greyish-green medium-grained greywacke (Figure 3a) from the Upper Member of the Shilidun Fm. Detrital components are ~65% quartz, ~15% feldspar, and ~20% lithic fragments. The matrix content exceeds 15% (Figure 3b), composed mainly of clay minerals and siliceous components, which uniformly fill intergranular pores. The cement is dominated by siliceous and calcareous materials. Sample 22LT-2 (N34°45′18.5908″, E103°35′49.4026″) is a dark grey fine-grained arkose from the Middle Member of the Shilidun Fm., containing ~65% quartz, ~25% feldspar, and ~10% lithic fragments (Figure 3c). The matrix content is low, primarily consisting of clay minerals and siliceous material, which uniformly fill intergranular pores. The cement is dominated by siliceous and calcareous components.
Two sandstone samples were collected from the Shiguan Fm. in Jiangligou area (22JLG-3 and 22JLG-9, Figure 1 and Figure 2e). Both are moderately sorted and poorly rounded. Sample 22JLG-3 (N35°37′5.1359″, E102°17′29.2905″) is a grey medium-coarse lithic sandstone (Figure 3d), containing ~55% quartz, ~10% feldspar, and ~35% lithic fragments (Figure 3e). The matrix content is low, primarily consisting of clay minerals and carbonate materials, which uniformly fill intergranular pores. The cement is dominated by siliceous components. Sample 22JLG-9 (N35°37′2.5613″, E102°20′21.2437″) is a greyish-green medium-grained greywacke (Figure 3d), containing ~60% quartz, ~20% feldspar, and ~20% lithic fragments. The matrix content exceeds 15% (Figure 3f), primarily consisting of clay minerals and siliceous material, which uniformly fill intergranular pores. The cement is dominated by siliceous components.
3.2. Methods
All four sandstone samples underwent thin-section petrography, heavy mineral separation/identification, and whole-rock major and trace element analysis. Samples 22LT-1 and 22JLG-9 were selected for zircon LA-ICP-MS U-Pb dating and in situ Lu-Hf isotope analysis. Thin section preparation, heavy mineral separation, and identification were performed at the Laboratory of Hebei Regional Geological Survey Team. Whole-rock major and trace element analysis, zircon U-Pb dating, and Lu-Hf isotope analysis were conducted at the State Key Laboratory of Continental Dynamics, Northwest University, China.
Heavy mineral separation followed Pan et al. (2024) [14]. The main operational procedures are as follows: (a) Pretreatment: The samples were crushed to 30–100 mesh, the samples with a particle size between 0.25 and 0.63 mm were extracted, and the samples were treated with hydrogen peroxide and dilute hydrochloric acid. (b) Heavy liquid rough separation: Bromoform was chosen as the heavy liquid and minerals were separated to obtain heavy minerals with a specific gravity greater than 2.89 g/cm3 for identification under a microscope. Zircon, rutile, tourmaline, monazite, garnet, magnetite, hematite–limonite, leucoxene, titanite, epidote, anatase, pyrite, barite, apatite, ilmenite, mica, hornblende, cassiterite, zoisite, chloritoid, anhydrite, sphalerite, and siderite were counted, and the percentage contents of the samples were calculated. The zircons selected from the heavy minerals can be used for detrital zircon U-Pb dating. Whole-rock major elements were analyzed using X-ray fluorescence (XRF; Rigaku RIX 2100) (Rigaku Corporation, Akishima-shi, Japan) on fused glass beads, following Wang et al. (2016) [15]. Controlled by the BCR-2 and GBW07105 reference standards, the elemental analysis accuracy is better than 5%, and the instrument detection limit is 10−6. A duplicate sample was taken for every ten samples to monitor the data. Whole-rock trace elements were analyzed using Perkin Elmer Elan 6100DRC ICP-MS (PerkinElmer, Waltham, MA, USA), following Liu et al. (2006) [16]. During the testing process, one quality control (QC) standard sample was analyzed for every ten samples. Each batch of solution analyses included two BHVO-2 standards, two AGV-2 standards, and one BCR-2 standard material. The analysis precision for elements, such as Y, Zr, Nb, Co, Ni, Rb, Hf, Ta, Zn, and Ga, and rare earth elements (REEs), except for Hf and Lu, was better than 5%. Meanwhile, the precision for other low-concentration elements ranged from 5% to 10% [16]. Zircon U-Pb isotopes were analyzed by LA-ICP-MS using a 193 nm ArF excimer laser coupled to an Agilent 7500a ICP-MS (Agilent Technologies, Santa Clara, CA, USA), following Yuan et al. (2004) [17]. The laser beam size and frequency were 32 μm and 6 Hz, respectively. Three international standard samples of zircon NIST SRM 610, 91500 and GJ-1 were tested for every twelve sample analyses, and one standard sample 91500 was tested after the sixth sample of those 12 sample analyses. In order to calculate zircon ages, the zircon 91500 was adopted as an external standard. 207Pb/206Pb, 206Pb/238U, 207Pb/235U, and 208Pb/232Th ratios were calculated using GLITTER (ver. 4.0, Macquarie University). Common Pb correction was applied using Andersen (2002) [18], and concordia diagrams were plotted using Isoplot 4.15. Zircon in situ Lu-Hf isotopes were analyzed using a Nu Plasma HR MC-ICP-MS (Nu Instruments, Wrexham, Wales, UK) on spots previously analyzed for U-Pb or adjacent domains, guided by cathodoluminescence (CL) images. The spot size was 44 μm. The international standard zircon 91500 was used as an external correction. Instrument conditions and analytical procedures followed Yuan et al. (2008) [19]. εHf(t), one-stage model age (TDM1), two-stage model age (TDM1), and fLu/Hf were calculated following Wu et al. (2007) [20].
4. Results
4.1. Heavy Mineral Characteristics
Heavy minerals in Lintan sandstone samples are dominated by zircon, and garnet, with minor rutile, apatite, and leucoxene (Figure 4a). Sample 22LT-1 has very low heavy mineral content, dominated by iron-bearing garnet (99.77%), with trace amounts of rutile, apatite, zircon, and leucoxene (total 0.23%, Figure 4a). Moderately stable minerals (99.77%, iron-bearing garnet) dominate, with trace stable (0.08%, apatite) and highly stable minerals (0.15%, rutile, zircon, leucoxene). Sample 22LT-2 is dominated by zircon (95.11%), with minor leucoxene (4.89%, Figure 4a). All are highly stable heavy minerals (zircon, leucoxene).
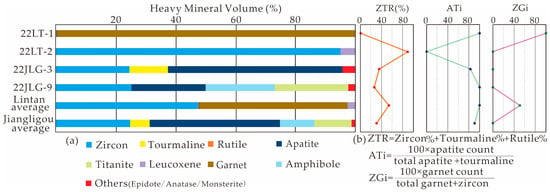
Figure 4.
Heavy mineral assemblages (a) and heavy mineral indices (b) of the sandstone samples.
Heavy minerals in Jiangligou sandstone samples are dominated by apatite, zircon, amphibole, and sphene, with minor tourmaline, epidote and monazite. Sample 22JLG-3 is dominated by apatite (58.12%) and zircon (24.79%), with minor monazite (4.28%, Figure 4a). All are stable (62.39%, apatite, monazite) and highly stable minerals (37.61%, zircon, tourmaline). Sample 22JLG-9 contains zircon (25.27%), apatite (24.91%), sphene (24.55%), and amphibole (23.1%), with minor epidote (2.17%, Figure 4a). Highly stable minerals (25.27%, zircon), moderately stable (26.72%, sphene, epidote), stable minerals (24.91%, apatite) and unstable minerals (23.1%, amphibole) are all present, with similar contents.
4.2. Geochemical Composition
4.2.1. Major Elements
Lintan sandstone samples (22LT-1, 22LT-2) show variable but relatively high SiO2 content (65.75%, 75.29%), higher than Post-Archean Australian Shale (PAAS, SiO2 = 59.52% [21]) and Upper Continental Crust (UCC, SiO2 = 66.62% [22]). They exhibit low K (K2O/Na2O = 0.73, 4.37) and high Al (Al2O3/SiO2 = 0.24, 0.10). Compared to PAAS, most major elements in Lintan samples are lower, except for SiO2, CaO, and Na2O (one sample higher/lower, Table 1).

Table 1.
Data on major (wt.%) and trace elements (×10−6) and rare earth elements (×10−6) from the sandstone samples.
Jiangligou sandstone samples (22JLG-3, 22JLG-9) have moderate SiO2 content (50.32%, 58.83%), lower than PAAS [21] and UCC [22]. They exhibit low K (K2O/Na2O = 1.22, 0.38) and relatively high Al (Al2O3/SiO2 = 0.18, 0.30). Compared to PAAS, MgO (one sample higher/lower), CaO, and Na2O are higher, while other elements are lower (Table 1).
4.2.2. Trace Elements
Most trace elements are lower than PAAS [21]. Some samples show slightly higher concentrations of High-Field-Strength Elements (Zr in 22LT-2, Hf in 22LT-2, U in 22LT-1), Low-Field-Strength Elements (Sr in 22LT-1, 22JLG-3, 22JLG-9; Ba in 22LT-1, 22JLG-9), and V and Cs in 22JLG-9 (Figure 5 and Table 1). Ratios of La/Sc (1.17–4.29, avg. 2.94), Th/Sc (0.25–1.71, avg. 1.20), and Cr/Th (3.82–20.94, avg. 8.99) are significantly higher than those typical of sandstones derived from mafic sources (La/Sc = 0.04–0.09, Th/Sc = 0.005–0.006, Cr/Th = 1.10–1.15 [21]).
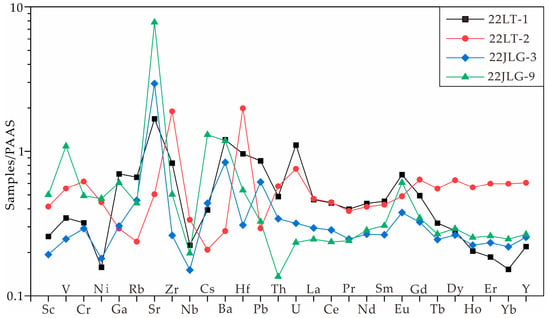
Figure 5.
Trace element (including rare earth elements) spider diagram (PAAS data from Taylor and Mclennan, 1985 [21].
4.2.3. Rare Earth Elements
Total rare earth element (REE) contents are low to moderate (62.79 × 10⁻⁶–111.56 × 10⁻⁶), lower than PAAS (242.9 × 10⁻⁶) [21] and UCC (146.37 × 10⁻⁶) [22]. High ΣLREE/ΣHREE ratios (6.54–13.62, avg. 9.47) indicate light REE enrichment. Strong LREE-HREE fractionation is observed ((La/Yb)N = 7.61–29.50, avg. 14.96). Most samples show moderate negative Eu anomalies (22LT-2, 22JLG-3; δEu = 0.66, 0.89). One sample shows a positive Eu anomaly (22JLG-9, δEu = 1.29) and one shows no anomaly (22LT-1, δEu = 1.00). Ce anomalies are negligible (δCe = 0.94–1.01, avg. 0.98). Most samples (22LT-2, 22JLG-3) exhibit right-sloping REE patterns with moderate negative Eu anomalies (Figure 6 and Table 1).
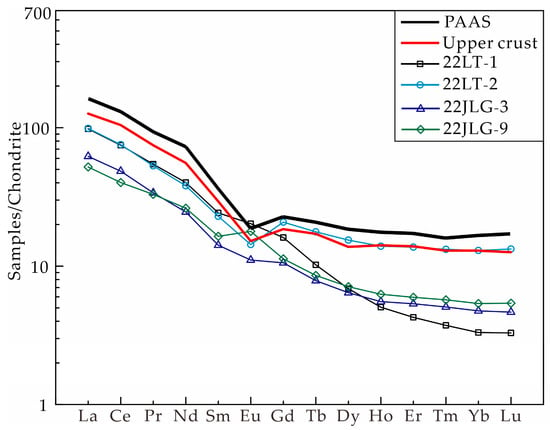
Figure 6.
Rare earth elements diagram (PAAS data from Sun et al., 1989 [23]).
4.3. Zircon U-Pb Geochronology
Detrital zircon U-Pb dating was performed on samples 22LT-1 (Lintan) and 22JLG-9 (Jiangligou). Data are presented in Supplementary Table S1. Most zircons are euhedral prisms, 80–150 μm long and 50–80 μm wide, with aspect ratios of 1:1 to 2.5:1 (Figure 7). CL images reveal oscillatory zoning typical of magmatic origin in most grains (Figure 7). Th/U ratios are mostly >0.4 (Figure 8), confirming magmatic origin. Some zircons display sector zoning, with Th/U < 0.1, indicating metamorphic origin [24,25,26]. A few grains show both features, suggesting modification of magmatic zircons by later metamorphism.
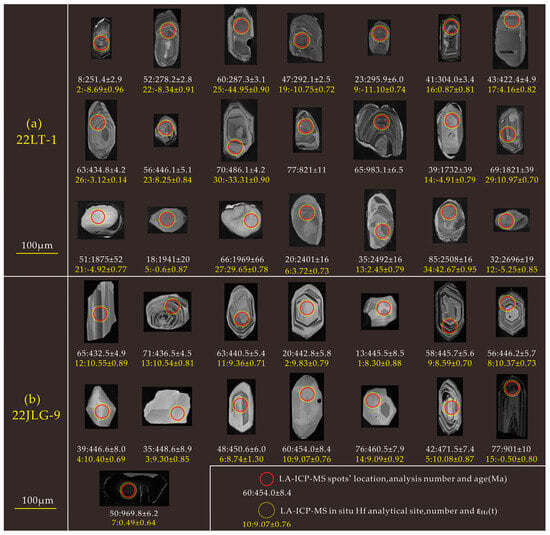
Figure 7.
Cathodoluminescence images (CL) of zircon grains from the 22LT-1 (a) and 22JLG-9 (b) samples.
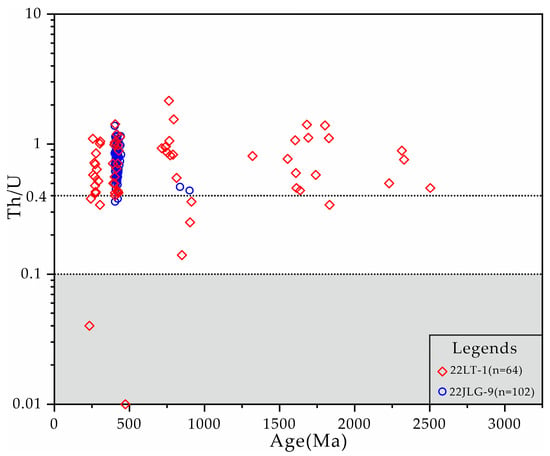
Figure 8.
U-Pb age vs. Th/U ratio diagram. The shaded area denotes values for typical metamorphic zircons with Th/U < 0.1.
For sample 22LT-1 (Lintan), 85 spot analyses yielded 64 concordant ages (<10% discordance). Some zircons exhibit core-rim structures (Figure 7a). The age spectrum displays two main peaks (285 Ma, 442 Ma) and five subordinate peaks (818 Ma, 970 Ma, 1734 Ma, 1956 Ma, 2500 Ma, Figure 9a and Figure 10a). Four zircons (6.3% of concordant) yielded ages of 2700–2400 Ma (peak ~2500 Ma); Th/U >0.4; only one shows magmatic oscillatory zoning (Figure 7a (35 spot)). Six zircons (9.38%) yielded ages of 2000–1800 Ma (peak ~1956 Ma); Th/U: one 0.1–0.4, five > 0.4; four show magmatic oscillatory zoning, indicating magmatic origin. Five zircons (7.81%) yielded ages of 1800–1600 Ma (peak ~1734 Ma); Th/U > 0.4; three show magmatic oscillatory zoning (Figure 7a (69 spot)), indicating magmatic origin. Overall, the 2700–1600 Ma age group zircons (Th/U > 0.4, magmatic oscillatory zoning) are predominantly magmatic, with minor metamorphic types. One zircon age of 1421 Ma (Th/U > 0.4) is interpreted as a mixed age based on CL features. Three zircons (4.7%) yielded ages of 985–910 Ma (peak ~970 Ma); Th/U: 0.1–0.4; two showed magmatic zoning (Figure 7a (65 spot)), indicating magmatic origin. Ten zircons (15.6%) yielded ages of 880–760 Ma (peak ~818 Ma); Th/U > 0.4; five showed magmatic oscillatory zoning, indicating magmatic origin. Nineteen zircons (29.7%) yielded ages of 490–410 Ma (peak ~442 Ma); Th/U: one < 0.1, others > 0.4; ten showed magmatic oscillatory zoning (Figure 7a (63 spot)), while one showed sector zoning, indicating predominantly magmatic origin with minor metamorphic types, and some grains showed mixed features. Sixteen zircons (25%) yielded ages of 330–250 Ma (peak ~285 Ma); Th/U: one < 0.1, two 0.1–0.4, others > 0.4; eight showed magmatic oscillatory zoning (Figure 7a (47 spot)), two showed sector zoning, indicating predominantly magmatic origin with minor metamorphic types, and some grains showed mixed features (Figure 7a and Figure 8).
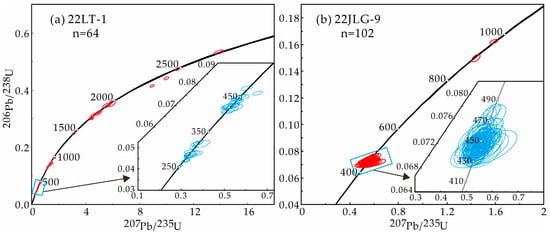
Figure 9.
U-Pb concordia diagrams of detrital zircons (a) 22LT-1, (b) 22JLG-9. Errors are quoted at the 1σ level. The red ellipses represent the data of the complete harmonious ages of the samples, while the blue ellipses represent the data of younger ages (<500 Ma) of the samples.
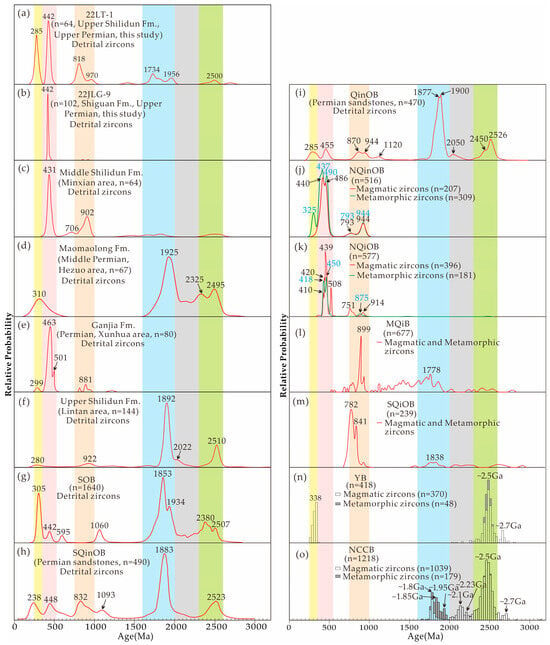
Figure 10.
Contrasting relative probability plots of zircon U-Pb ages. Only those ages with a discordance of less than 10% are used. The yellow, pink, orangered, blue, grey, and green bars show the age groups of 350–250 Ma, 550–350 Ma, 1000–750 Ma, 2000–1600 Ma, 2300–2000 Ma, and 2600–2300 Ma, respectively. Data sources: (a,b) The 22LT-1 (a) and 22JLG-9 (b) data are from this study; (c) the detrital zircon ages of the Middle Shilidun Fm. (Middle-Late Permian, Minxian area) are from Chang, 2019 [10]; (d) the detrital zircon ages of the Maomaolong Fm. (Middle Permian, Hezuo area) are from Zhang et al., 2014 [9]; (e) the detrital zircon ages of the Ganjia Fm. (Permian, Xunhua area) are from Yan, 2017 [8]; (f) the detrital zircon ages of the Upper Shilidun Fm. (Middle-Late Permian, Lintan area) are from Gao et al., 2019 [5]; (g,i) the detrital zircon ages of the Southern Ordos Basin (SOB, (g)) and QinOB (i) are from Pan et al., 2024 [14] and the references therein; (h) the detrital zircon ages of the southern Qinling Orogenic Belt (SQinOB) are from Duan et al., 2025 [27] and the references therein; (j,k,n,o) the magmatic zircon and metamorphic zircon ages of the NQinOB (j), NQiOB (k), Yinshan Block (YB, (n)), and North China Craton basement (NCCB, (o)) are from Pan et al., 2024 [14] and the references therein. (l,m) the magmatic zircon and metamorphic zircon ages of the Middle Qilian Block (MQiB, (l)) and southern Qinling Orogenic Belt (SQiOB, (m)) are from Ji et al., 2021 [28] and the references therein. The relative probability curves were drawn with the DensityPlotter program (version 8.5), using the kernel density estimation model (KED). The width of one column in Figure 10n,o is 25 Ma.
For sample 22JLG-9 (Jiangligou), 102 spot analyses yielded 102 concordant ages (<10% discordance). The age spectrum shows a single dominant peak at 442 Ma (Figure 9a and Figure 10b). Some zircons exhibit core-rim structures. One hundred zircons (98%) yielded ages of 480–430 Ma (peak ~442 Ma, Figure 10b and Table S1); Th/U: two 0.1–0.4, others >0.4. Most CL images show magmatic oscillatory zoning (Figure 7b (56, 58 spot)); some show sector zoning (Figure 7b (13, 39 spot)), indicating predominantly magmatic origin with minor metamorphic types, while some show mixed features. Two zircons (2%) yielded ages of 901 Ma and 969.8 Ma; Th/U > 0.4; one shows magmatic zoning (Figure 7b (77 spot)), indicating magmatic origin.
4.4. Zircon Hf Isotopes
In situ Lu-Hf isotopes were analyzed on 34 zircons from 22LT-1 and 15 zircons from 22JLG-9. Data are presented in Supplementary Table S2. For 22LT-1 (Lintan), nine zircons (26.5%) have positive εHf(t) values (+0.87 to +11.04), with TDM2 = 901–2843 Ma. Twenty-three zircons (67.6%) have negative εHf(t) values (−44.95 to −0.60), with TDM2 = 1346–4106 Ma (Figure 11 and Table S2). For 22JLG-9 (Jiangligou), fourteen zircons (93.3%) have positive εHf(t) values (+0.49 to +10.55; avg. +8.91), with TDM2 = 744–1793 Ma. One zircon has εHf(t) = −0.5 ± 0.8 (large error); within error, it is considered positive, with TDM2 = 1803 Ma (Figure 11 and Table S2).
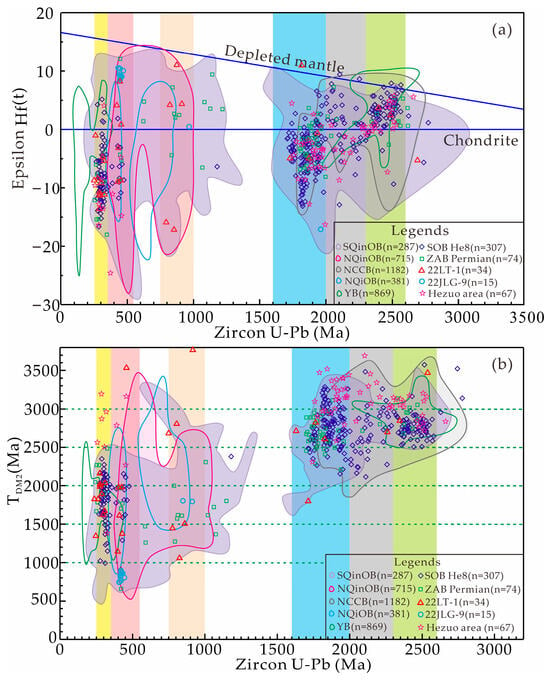
Figure 11.
εHf(t) values vs. U-Pb ages (a) and TDM2 values vs. U-Pb ages (b). The yellow, pink, orange-red, blue, grey, and green bars show the age groups of 350–250 Ma, 550–350 Ma, 1000–750 Ma, 2000–1600 Ma, 2300–2000 Ma, and 2600–2300 Ma, respectively. Data sources: The 22LT-1 and 22JLG-9 data are from this study; the detrital zircon ages of the SOB are from Pan et al., 2024 [14] and the references therein; the SQinOB are from Duan et al., 2025 [27] and the references therein; the detrital zircon ages of Maomaolong Fm. (Middle Permian, Hezuo area) are from Zhang et al., 2014 [9]; the data of the NQinOB, NCCB, NQiOB, and Yinshan Block (YB) are from Pan et al., 2024 [14] and the references therein. Data on depleted mantle are from Griffin et al., 2000 [29].
5. Discussion
5.1. Sediment Provenance Analysis
5.1.1. Heavy Mineral Provenance Analysis
The ZTR index (zircon–tourmaline–rutile) reflects heavy mineral maturity. Higher ZTR indicates greater maturity or the influence of multiple recycling processes. The ATi index (apatite–tourmaline) is positively correlated with intermediate-acidic igneous source rocks. The GZi index (garnet–zircon) is positively correlated with medium- to low-grade metamorphic source rocks.
Heavy minerals in Lintan sandstone samples are dominated by moderately stable (22LT-1) and highly stable minerals (22LT-2). ZTR, ATi, and GZi indices differ significantly between samples (Figure 4b). Sample 22LT-1 has low ZTR, high ATi, and high GZi, indicating that the source area is composed of intermediate-acidic igneous and medium–low-grade metamorphic rocks. Sample 22LT-2 has high ZTR, low ATi, and low GZi, with high content of highly stable minerals, with less material derived from intermediate-acidic igneous and metamorphic source areas.
Heavy minerals in Jiangligou sandstone samples are dominated by stable minerals and highly stable types (22JLG-3, 22JLG-9), with minor unstable (22JLG-9) and moderately stable (22JLG-9). Samples have similar low ZTR, high ATi, and low GZi indices (Figure 4b) and high unstable mineral content, dominated by intermediate-acidic igneous rocks, with minor input from medium–low-grade metamorphic rocks.
Distinct heavy mineral assemblages and indices between Lintan and Jiangligou sandstone samples suggest different provenances.
5.1.2. Sedimentary Geochemical Provenance Analysis
(1) Major Elements
Nesbitt et al. (1982) proposed the Chemical Index of Alteration (CIA) to characterize the intensity of chemical weathering [30]. Cox et al. (1995) defined the Index of Compositional Variability (ICV) to reflect the source rock composition and tectonic attributes [31]. CIA values in the study sandstone samples are low to moderate (18.55 to 67.96, avg. 47.9, mostly <60, Figure 12). This reflects weak or negligible weathering of the sandstone samples. Source rock characteristics can be accurately reflected. ICV values are relatively high to high (1.19 to 18.22, avg. 6.37, Figure 12). This reflects source rocks from tectonically active regions or proximal sedimentation. Sample 22JLG-3 has the highest ICV value (4.92). This reflects a higher content of unstable minerals, consistent with heavy mineral analysis. Chang (2019) [10] and Feng et al. (2023) [7] analyzed major elements of the Shilidun Fm. in the Minxian area and Lintan area, West Qinling. Most samples show low CIA (<70) and high ICV (>1) characteristics. A few samples show high CIA values (>75) and low ICV values (<1, Figure 12). This indicates most samples did not experience strong weathering. A few samples experienced stronger weathering. These samples represent provenance from long-term weathering zones or recycled material.
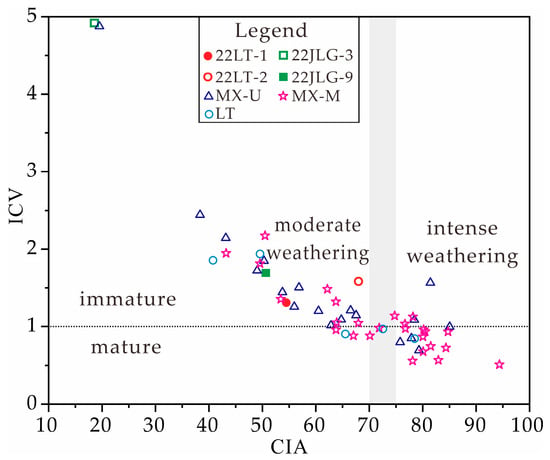
Figure 12.
The CIA–ICV index diagram of the study area. The base map is according to Nesbitt and Young, 1982 [30] and Cox et al., 1995 [31]. Data sources: The MX-U (Upper Shilidun Fm., Middle-Late Permian, Minxian area) and MX-M (Middle Shilidun Fm., Middle-Late Permian, Minxian area) data are from Chang, 2019 [10]; the LT (Shilidun Fm., Lintan area) are from Feng et al., 2023 [7].
Roser et al. (1988) established discriminant diagrams based on major element content to identify source rock types [32]. The results reveal diverse provenance signatures among the studied sandstone samples. Sample 22LT-1 falls within the felsic igneous provenance field (Figure 13). It exhibits relatively high SiO2/Al2O3 (4.16) and K2O/Na2O (0.73) values, which are slightly lower than typical for felsic igneous provenance. Minor source rocks may be from mafic igneous and/or intermediate igneous provenance. This suggests source rocks are mainly from stable continental blocks (craton or passive continental margin). Minor source rocks may be from active orogenic belts (e.g., island arc, active continental margin) and/or transitional (active orogenic belt or continental margin arc) tectonic settings. Sample 22LT-2 plots in the quartzose recycled provenance and the mafic igneous provenance field (Figure 13). It has very high SiO2/Al2O3 and K2O/Na2O values. Its characteristics are more consistent with the quartzose recycled provenance. Source rocks may be mainly from quartzose recycled provenance, with minor contribution from mafic igneous provenance. This suggests source rocks are mainly from stable continental blocks (craton interior or passive margin). Minor contributions are from active orogenic belts (e.g., island arc, active continental margin). Sample 22JLG-3 plots in the intermediate igneous provenance field (Figure 13a) and the quartzose recycled provenance field (Figure 13b). It has moderate SiO2/Al2O3 and K2O/Na2O values. It is more consistent with the intermediate igneous provenance field. Source rocks may be mainly from intermediate igneous provenance, with minor contribution from quartzose recycled provenance. This suggests source rocks are mainly from transitional (active orogenic belt or continental margin arc) tectonic settings. Minor contributions are from stable continental blocks (craton interior or passive margin). Sample 22JLG-9 plots in the intermediate igneous provenance field (Figure 13). It has moderate SiO2/Al2O3 and K2O/Na2O values. This indicates source rocks have a transitional (active orogenic belt or continental margin arc) tectonic setting. Feng et al. (2023) [7] analyzed sandstone samples from the Shilidun Fm. in the Lintan area. In the F1–F2 diagram, they mainly plot in the intermediate igneous provenance field. Some plot in the felsic provenance field (Figure 13a). In the F1*–F2* diagram, they mainly plot in the intermediate igneous provenance field. Some plot in the mafic igneous provenance field (Figure 13b). This reflects a mixed provenance for the Shilidun Fm., with diverse source rock types.
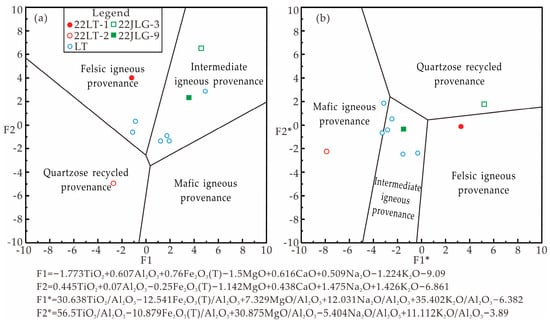
Figure 13.
Provenance discrimination plot for the major element compositions of samples. (a) F1–F2 discriminant diagram for rock provenance classification, (b) F1*–F2* discriminant diagram for rock provenance classification; the base maps are according to Roser and Korsch, 1988 [32]. Data sources: the LT (Shilidun Fm., Lintan area) data are from Feng et al., 2023 [7].
Analysis using the SiO2-K2O/Na2O diagram established by Roser et al. (1986) [33] shows that sample points fall in the active continental margin (22LT-1), passive continental margin (22LT-2), and oceanic island arc (22JLG-3, 22JLG-9, Figure 14a) tectonic environment fields. The sandstone samples from the middle member of the Shilidun Fm. in the Minxian area, West Qinling, analyzed by Chang (2019) [10], mainly plot in passive and active continental margin environments. Some plot in active continental margin and oceanic island arc environments. The sandstone samples from the upper member mainly plot in the active continental margin tectonic environment. Some plot in the passive continental margin environment. The sandstone samples from the Shilidun Fm. in the Lintan area, analyzed by Feng et al. (2023) [7], plot in the passive continental margin, active continental margin, and oceanic island arc environments (Figure 14a).
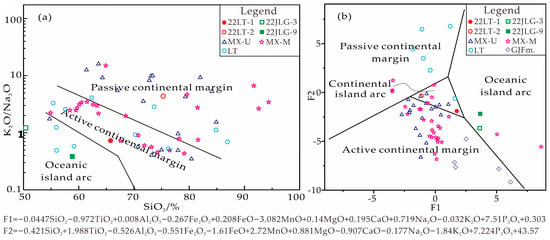
Figure 14.
Major element-based tectonic setting discrimination diagram for sandstone samples. The base map of (a,b) are according to Roser and Korsch, 1986 [33] and Bhatia, 1983 [34], respectively; Data sources: the GJFm. (Ganjia Fm., Permian, Xunhua area) data are from Yan, 2017 [8]; the MX-U (Upper Shilidun Fm., Middle-Late Permian, Minxian area) and MX-M (Middle Shilidun Fm., Middle-Late Permian, Minxian area) data are from Chang, 2019 [10]; the LT (Shilidun Fm., Lintan area) are from Feng et al., 2023 [7].
Discriminant diagrams for tectonic setting based on major elements established by Bhatia (1983) [34] show that sample points fall in the continental island arc (22LT-1 and 22LT-2) and oceanic island arc (22JLG-3, 22JLG-9, Figure 14b) tectonic environment fields. The sandstone samples from the Permian Ganjia Fm. in the Xunhua area (east of Jiangligou area), West Qinling northern margin, analyzed by Yan (2017) [8], plot in the active continental margin environment. The sandstone samples from the middle member of the Shilidun Fm. in the Minxian area, analyzed by Chang (2019) [10], mainly plot in the active continental margin environment. Some plot in the passive continental margin, continental island arc, and oceanic island arc environments. The sandstone samples from the upper member mainly plot in the active continental margin tectonic environment. Some plot in the continental island arc environment. The sandstone samples from the Shilidun Fm. in Lintan area, analyzed by Feng et al. (2023) [7], mainly plot in the passive continental margin environment. Some plot in the continental island arc environment (Figure 14b).
(2) Trace Elements
Discriminant diagrams for sandstone tectonic setting based on trace elements [35] indicate that the source regions for the study sandstones are mainly active continental island arc (22LT-1, 22LT-2), oceanic island arc (22JLG-9), and active continental margin tectonic environments (22JLG-3, Figure 15). The sandstone samples from the Permian Ganjia Fm. in the Xunhua area, West Qinling northern margin, analyzed by Yan (2017) [8], mainly plot in continental island arc and active continental margin environments (Figure 15). The sandstone samples from the Shilidun Fm. in the Minxian area, analyzed by Chang (2019) [10], mainly plot in continental island arc environments (Figure 15). Some plot in passive continental margin environments. The sandstone samples from the Shilidun Fm. in the Lintan area, analyzed by Feng et al. (2023) [7], plot in continental island arc environments (Figure 15). Some plot in passive continental margin and active continental margin environments (Figure 15).
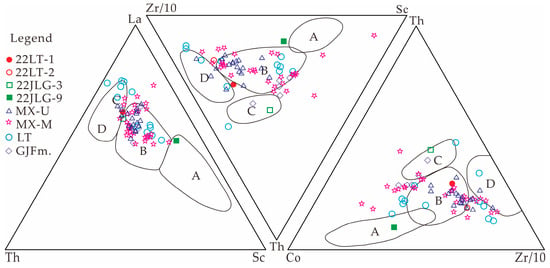
Figure 15.
Tectonic setting discrimination diagrams (La-Th-Sc, Th-Sc-Zr/10 and Th-Co-Zr/10) for the provenance analysis of the sandstone samples. A: Oceanic island arc. B: Continental island arc. C: Active continental margin. D: Passive continental margin. The base maps are according to Bhatia and Crook, 1986 [35]. Data sources: The 22LT-1, 22LT-2, 22JLG-3 and 22JLG-9 data are from this study; the GJFm. (Ganjia Fm., Permian, Xunhua area) data are from Yan, 2017 [8]; the MX-U (Upper Shilidun Fm., Middle-Late Permian, Minxian area) and MX-M (Middle Shilidun Fm., Middle-Late Permian, Minxian area) data are from Chang, 2019 [10]; the LT (Shilidun Fm., Lintan area) are from Feng et al., 2023 [7].
The above studies show that source rock types and tectonic backgrounds for the Shilidun Fm. in the West Qinling are complex and diverse (multiple types are present). This indicates mixed provenance for the Shilidun Fm. sandstones. The tectonic background of source rocks in the Jiangligou area is mainly oceanic island arc. The tectonic environment in the Xunhua area (east of Jiangligou area) is active continental margin. This indicates strong tectonic environmental variations near the Jiangligou area.
(3) Rare Earth Elements
ΣREE concentrations are low (higher in Lintan samples, 62.79 × 10⁻⁶–111.56 × 10⁻⁶; avg. 86.89 × 10⁻⁶). Source rocks are likely derived primarily from mafic rocks, with minor contributions from felsic source rocks or the upper continental crust. Light REE enrichment is observed (ΣLREE/ΣHREE = 6.54–13.62, avg. 9.47). Moderate to strong LREE-HREE fractionation is evident ((La/Yb)N = 7.61–29.5, avg. 14.96), indicating derivation from the upper continental crust (ancient crust). Moderate negative Eu anomalies are exhibited by most samples (22LT-2, 22JLG-3; δEu = 0.66, 0.89; Figure 6 and Table 1). A positive Eu anomaly is shown by one sample (22JLG-9, δEu = 1.29), while no anomaly is observed in another (22LT-1, δEu = 1). Significant Ce anomalies are absent (δCe = 0.94–1.01, avg. 0.98). These REE characteristics indicate that source rocks were likely dominated by felsic compositions or ancient upper crustal material. An oceanic island arc mafic source is inferred for sample 22JLG-9 (positive δEu anomaly). Mixing of felsic and mafic source components, or significant sediment transport prior to deposition, is suggested for sample 22LT-1 (no δEu anomaly).
5.1.3. Zircon U-Pb Geochronology and In Situ Hf Isotope Provenance Analysis
(1) Tectonic Setting Discrimination
Cawood et al. (2012) established a discriminant diagram based on detrital zircon age distribution characteristics of sandstones from typical global tectonic settings to determine the depositional tectonic environment [36] (Figure 16). Plotted on this diagram, the Lintan area (sample 22LT-1) belongs to an extensional environment (including rift and passive continental margin, region C in Figure 16). The Jiangligou area (sample 22JLG-9) belongs to a collisional environment (including foreland basins on both sides of orogenic belts, region B in Figure 16).
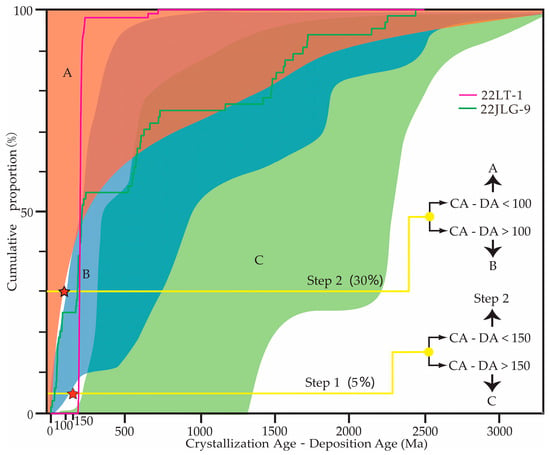
Figure 16.
CA-DA cumulative age distribution plot of detrital zircon samples from the study area (the base map is according to Cawood et al., 2012 [36]. Area A (orange region) represents the convergent environment, Area B (blue region) represents the colliding environment, and Area C (green region) represents the divergent environment.
(2) Zircon U-Pb Geochronology and In Situ Hf Isotope Provenance Analysis for Lintan Area
The age spectrum of sample 22LT-1 from Lintan exhibits two distinct main peaks (285 Ma and 442 Ma) and five subordinate peaks (818 Ma, 970 Ma, 1734 Ma, 1956 Ma, and 2500 Ma, Figure 9a and Figure 10a). The zircon age distribution and Lu-Hf isotopic composition characteristics of the Lintan area were compared with those of surrounding potential source regions. In sample 22LT-1, 15.6% of the zircon ages range between 2700 Ma and 1800 Ma (peak ages 2500 Ma and 1956 Ma). They are mainly magmatic zircons, with minor metamorphic zircons. In situ Lu-Hf isotope testing was performed on eight zircons from this group. Three zircons have εHf(t) < 0, with TDM2 between 2605 Ma and 3468 Ma. Five zircons have εHf(t) > 0, with TDM2 between 367 Ma and 2863 Ma (Figure 11 and Table S2). This indicates that zircons in this age group are mainly derived from recycling of ancient crustal material. A significant portion also involves the addition of juvenile mantle-derived material. The 2700–1800 Ma age group exhibits ~2.5 Ga and ~1.95 Ga peak ages. An amount of ~2.7 Ga zircons are present. Its zircon age distribution, εHf(t) and TDM2 distribution characteristics are similar to those of the NCCB (Figure 10l,o and Figure 11). Previous studies suggest that the NCCB had already provided provenance to the West Qinling by the Permian [6]. By the end of the Early Permian (290–280 Ma), the main peak of collision between the North China and Yangtze blocks ended. The NQinOB transitioned from compression to gravitational collapse and lithospheric extension. This caused the topography of the NQinOB to be “planed off”. Deep basement rock systems along the southern margin of the NCCB were uplifted and exposed for erosion along detachment faults. Rivers along the southern and southwestern margins of the NCC flowed south and southwest. Locally, they cut through the NQinOB. Southward and southwestward sand transport systems crossing the NQinOB were formed. These systems provided provenance from the NCCB and the NQinOB to the South Qinling (e.g., Zhen’an Basin [37]) and West Qinling rift basins [37] (Figure 10h,i and Figure 11). Therefore, the 2700–1800 Ma age group zircons are interpreted as derived from the NCCB.
Sample 7.81% of zircons have ages between 1800 Ma and 1600 Ma (peak age 1734 Ma). They are mainly magmatic zircons, with minor metamorphic zircons. In situ Lu-Hf isotope testing was performed on one zircon from this group. εHf(t) is −4.91 and TDM2 is 2711 Ma (Figure 11 and Table S2). This indicates zircons in this age group are derived from recycling of ancient crustal material. The zircon age distribution, εHf(t) and TDM2 distribution characteristics of the 1800–1600 Ma age group are similar to those of the Middle Qilian Block (MQiB). The NCC basement and South Qilian also contain minor 1800–1600 Ma age group zircons (Figure 10a,l,m). Therefore, the 1800–1600 Ma age group zircons are interpreted as derived from the NCCB and/or the Qilian Tectonic Belt (Middle Qilian Block and South Qilian Orogenic Belt, SQiOB).
The Permian strata in the Southern Ordos Basin (SOB) and the Zhen’an Basin of the South Qinling are also characterized by a distinct zircon U-Pb age population ranging from 2700 to 1600 Ma. The εHf(t) values and TDM2 of these zircons exhibit distributions similar to those observed in the Lintan area (Figure 10a,g,h and Figure 11). However, the proportion of zircons within the 2700–1600 Ma age group is significantly lower in the Lintan area compared to the SOB and the Zhen’an Basin. This indicates that the NCCB and/or the Qilian Orogenic Belt provided a weaker sediment supply to the Permian strata in the Lintan area than to those in the SOB and the Zhen’an Basin. One zircon age is 1421 Ma. Based on CL image judgment, this zircon age may be a mixed age. It has no provenance significance. Sample 4.7% of zircons have ages between 985 Ma and 910 Ma (peak age 970 Ma). They are mainly magmatic zircons. In situ Lu-Hf isotope testing was performed on two zircons from this group. One zircon has positive εHf(t), and the other one has negative εHf(t). TDM2 values are 1505 Ma and 3767 Ma (Figure 11 and Table S2). This indicates zircons in this age group include both recycled ancient crustal material and juvenile mantle-derived crustal material. Sample 15.6% of zircons have ages between 880 Ma and 760 Ma (peak age 818 Ma). They are mainly magmatic zircons. In situ Lu-Hf isotope testing was performed on four zircons from this group. Two zircons have positive εHf(t), and two have negative εHf(t). TDM2 ranges from 1057 Ma to 2804 Ma (Figure 11 and Table S2). This indicates zircons in this age group include both recycled ancient crustal material and juvenile mantle-derived crustal material. The zircon age distribution characteristics of the 985–910 Ma and 880–760 Ma age groups are similar to those of the NQinOB, NQiOB, MQiB, and SQiOB (Figure 10j–m). Compared to the NQiOB, the εHf(t) and TDM2 distribution characteristics of the 985–910 Ma and 880–760 Ma age group zircons are more similar to the NQinOB (Figure 11). Therefore, the 985–910 Ma and 880–760 Ma age group zircons are interpreted as possibly derived from the NQinOB. Provenance from the Qilian Tectonic Belt (NQiOB, MQiB, and SQiOB) cannot be excluded.
The 985–760 Ma age group is also identified in the Permian of the Zhen’an Basin, South Qinling. The εHf(t) values and TDM2 of these zircons exhibit distributions similar to those from the Lintan area (Figure 10a,h and Figure 11). The 985–760 Ma age group is slightly higher in the Lintan area than in the Zhen’an Basin. This is interpreted to indicate a slightly more intense sediment supply from the NQinOB to the Permian in the Lintan area compared to that received by the Zhen’an Basin.
Sample 29.7% of zircons have ages between 490 Ma and 410 Ma (peak age 442 Ma). They are mainly magmatic zircons, with minor metamorphic zircons. In situ Lu-Hf isotope testing was performed on seven zircons from this group. Four zircons have εHf(t) < 0, with TDM2 between 1612 Ma and 3532 Ma. Three zircons have εHf(t) > 0, with TDM2 between 901 Ma and 1376 Ma (Figure 11 and Table S2). This indicates zircons in this age group are mainly derived from recycling of ancient crustal material. Significant contributions also involve juvenile mantle-derived crustal material. The zircon age distribution characteristics of the 490–410 Ma age group are similar to those of the NQinOB and NQiOB (Figure 10a,j,k). Although the NQiOB also contains zircons of this age group, zircons between 490 Ma and 460 Ma are less developed and lack a distinct age peak. The NQinOB has a distinct age peak between 490 Ma and 460 Ma. The εHf(t) and TDM2 distribution characteristics of this age group zircons are more similar to the NQinOB (Figure 11). Therefore, the 490–410 Ma age group zircons are interpreted as derived from the NQinOB.
The 490–410 Ma age group is also identified in the Permian of the SOB and the Zhen’an Basin. In the Zhen’an Basin, the age distribution, εHf(t) values, and TDM2 of these zircons are similar to those from the Lintan area (Figure 10a,g,h and Figure 11), and are interpreted to be derived from the NQinOB. In contrast, the 490–410 Ma age group from the SOB show slightly different characteristics in age distribution, εHf(t), and TDM2 compared to the Lintan area. They are potentially sourced from both the NQinOB and the NQiOB [14]. This suggests that the possibility of the NQiOB providing sediment supply across NQinOB to the South Qinling is relatively low. The proportion of zircons within this 490–410 Ma age group is significantly higher in the Lintan area than in the Permian of the SOB and the Zhen’an Basin. This indicates a markedly more intense sediment supply from the NQinOB to the Permian in the Lintan area compared to that received by the SOB and the Zhen’an Basin.
Sample 25% of zircons have ages between 330 Ma and 250 Ma (peak age 285 Ma). They are mainly magmatic zircons, with minor metamorphic zircons. In situ Lu-Hf isotope testing was performed on twelve zircons from this group. All zircons have εHf(t) < 0. TDM2 ranges from 1346 Ma to 4106 Ma. This indicates zircons in this age group are mainly derived from recycling of ancient crustal material. The zircon age distribution characteristics of the 330–250 Ma age group are similar to those of the NQinOB (where minor magmatic and metamorphic zircons of this age have been found) and the Yinshan Block (Figure 10a,j,n). The Upper Permian Shihezi Fm. Member 8 in the SOB also contains abundant 330–250 Ma age group zircons. Previous studies suggest these zircons may originate from the NQinOB (possibly because strong erosion due to tectonic uplift means few zircons of this age are found in the orogen today). Specific evidence and discussion can be found in references [14,27,38]. Heavy mineral and sedimentary geochemical analyses indicate that the Middle-Upper Permian Shilidun Fm. in the Lintan area represents relatively proximal sedimentation. Considering the location of potential source regions, the 330–250 Ma age group zircons in the Shilidun Fm. (Lintan) and the Shihezi Fm. Member 8 (SOB) are interpreted as having the same source (Figure 10g and Figure 11), namely the NQinOB. Therefore, the 330–250 Ma age group zircons in sample 22LT-1 are interpreted as derived from the NQinOB.
The 330–250 Ma age group is also identified in the Permian of the SOB and the Zhen’an Basin. The age distribution, εHf(t) values, and TDM2 of these zircons are similar to those from the Lintan area (Figure 10a,g,h and Figure 11), and are interpreted to be derived from the NQinOB [14]. The 330–250 Ma age group is significantly higher in the Lintan area than in the SOB and the Zhen’an Basin. This indicates a stronger sediment supply from the NQinOB to the Permian in the Lintan area compared to that received by the SOB and the Zhen’an Basin.
In summary, provenance for the Middle-Upper Permian Shilidun Fm. in the Lintan area is mainly derived from the NQinOB. Minor contributions come from the NCCB. Minor provenance may be supplied from the Qilian Tectonic Belt (NQiOB, MQiB, and SQiOB).
(3) Zircon U-Pb Geochronology and In situ Hf Isotope Provenance Analysis for Jiangligou Area
The age spectrum of sample 22JLG-9 from Jiangligou shows one distinct main peak age (peak age 442 Ma, Figure 9a and Figure 10b). Zircons are mainly magmatic, with minor metamorphic zircons. Zircon εHf(t) values are all positive. TDM2 ranges from 744 Ma to 897 Ma (Figure 11b and Table S2). This indicates zircons are derived from juvenile mantle-derived crustal material. Two zircon ages are 901 Ma and 969.8 Ma. They are magmatic zircons. Zircon εHf(t) values are both positive (one zircon εHf(t) is positive within error). TDM2 is 1803 Ma and 1793 Ma (Figure 11b and Table S2). This indicates zircons are derived from juvenile mantle-derived crustal material.
Comparison of the zircon age distribution and Lu-Hf isotopic composition characteristics of the Shiguan Fm. (Jiangligou area) with surrounding potential source regions shows that the main peak age (442 Ma) and the two zircons (901 Ma and 969.8 Ma) have age distributions, εHf(t) and TDM2 distribution characteristics similar to the NQinOB and the NQiOB (Figure 10b,j,k and Figure 11). Therefore, provenance for the Upper Permian Shiguan Fm. in the Jiangligou area is interpreted as derived from the NQinOB and/or the NQiOB.
5.1.4. Comprehensive Provenance Analysis
(1) Comprehensive Provenance Analysis for Study Area
Heavy mineral analysis reveals distinct differences between the Lintan and Jiangligou areas, indicating different sediment sources for these two regions. Sample 22LT-1 source area consists of intermediate-acidic igneous rocks and medium- to low-grade metamorphic rocks. In contrast, sample 22LT-2 material derived from intermediate-acidic igneous and medium- to low-grade metamorphic source rocks is limited. The two sandstone samples from Jiangligou source area consists of intermediate-acidic igneous rocks.
Sedimentary geochemical provenance analysis indicates complex and diverse source rock types and tectonic backgrounds for the Middle-Upper Permian sandstones in Lintan and Jiangligou areas. Sample 22LT-1 has mixed provenance. Source rocks are mainly from felsic igneous provenance (e.g., NQinOB, Qilian Tectonic Belt igneous rocks). Some mixing with mafic rocks (e.g., NCCB, NQinOB, Qilian Tectonic Belt mafic rocks) may occur. Source rocks mainly formed in a continental island arc tectonic setting. The Cawood diagram result indicates an extensional environment for sample 22LT-1 (Lintan). Sample 22LT-2 also has mixed provenance. Source rocks may be mainly from quartzose recycled provenance (e.g., recycled weathering products from sedimentary rocks or felsic igneous rocks along the southern NCC margin). Minor contributions are from mafic igneous provenance (e.g., mafic-ultramafic rocks from the NQinOB or Qilian Tectonic Belt). Source rocks are mainly from stable continental blocks (craton interior or passive continental margin). Minor contributions are from active orogenic belts (e.g., island arc, active continental margin). Sample 22JLG-3 has mixed provenance. Source rocks are mainly from intermediate igneous provenance (e.g., intermediate rocks from the NQinOB or Qilian Tectonic Belt). Minor contributions are from quartzose recycled provenance. Source rocks are mainly from transitional (active orogenic belt or continental margin arc) tectonic settings. Minor contributions are from stable continental blocks (craton interior or passive continental margin). Source rocks for sample 22JLG-9 are from intermediate igneous provenance. The source region has an oceanic island arc tectonic background. The Cawood diagram result indicates a collisional environment for Shiguan Fm. (Jiangligou, sample 22JLG-9).
In summary, the provenance area for the Shilidun Fm. in the Lintan area is interpreted as a continental island arc tectonic setting, with minor contributions from active and passive continental margins. Source rock types are diverse, incorporating detritus from felsic igneous, quartzose recycled, and mafic igneous provenance fields. Therefore, the Shilidun Fm. in the Lintan area is interpreted as a sedimentary basin developed on an active continental margin under an extensional rift background. The detrital provenance area consists of rocks related to subduction-orogenic belts and formed in continental island arc tectonic environments. This interpretation is consistent with the lithological assemblage observed in the region (Figure 2c), which is dominated by clastic rocks with minor marine carbonate rocks and a general absence of igneous rocks. The provenance area for the Shiguan Fm. in the Jiangligou area is mainly an oceanic island arc tectonic background. This interpretation is consistent with the lithological assemblage observed in the region (Figure 2f), which is characterized by dominant marine carbonate rocks, abundant clastic rocks, and minor marine carbonate rocks, with developed igneous rocks. Source rocks are mainly from intermediate igneous provenance.
Comparison of zircon age distribution and Lu-Hf isotopic composition characteristics of the Middle-Upper Permian in Jiangligou and Lintan areas with surrounding potential source regions indicates that the provenance of the Shilidun Fm. (22LT-1) in Lintan is mainly from the NQinOB, with minor contributions from the NCCB. Minor provenance may be supplied from the Qilian Tectonic Belt (NQiOB, MQiB and SQiOB). However, sedimentary geochemical provenance analysis shows that the provenance area for the Shilidun Fm. (22LT-1) in Lintan is mainly a continental island arc tectonic environment. The main body of the NQinOB was a continental island arc environment during the Early Paleozoic (516–400 Ma). The main body of the NQiOB was an Ordovician oceanic island arc environment. The MQiB was a stable block. The SQiOB was a collisional orogenic environment. This excludes the possibility of provenance from the Qilian Tectonic Belt. Therefore, provenance for the Shilidun Fm. (22LT-1) in the Lintan area is mainly from the NQinOB, with minor contributions from the NCCB. The zircon age distribution and Lu-Hf isotopic composition characteristics of remnant sedimentary basins within the QinOB (e.g., Liuyehe Basin, Zhen’an Basin) are similar to those of the Middle-Upper Permian strata in the Lintan area (Figure 10 and Figure 11). Previous studies show that provenance for the Middle-Upper Permian in the Liuyehe and Zhen’an basins is mainly from the NQinOB, with partial contributions from the NCCB [37,39]. This is basically consistent with the provenance results for the Middle-Upper Permian in the Lintan area.
The zircon age composition of the Upper Permian Shiguan Fm. (22JLG-9) in Jiangligou is relatively simple, mainly between 480 Ma and 430 Ma. Its age distribution and Lu-Hf isotopic composition characteristics show similarities to those of both the NQinOB and the NQiOB, suggesting potential provenance from one or both of these terrains. However, sedimentary geochemical provenance analysis shows that the provenance area for the Shiguan Fm. (22JLG-9) is mainly an oceanic island arc tectonic environment. The main body of the NQinOB was a typical continental island arc environment during the Early Paleozoic. The main body of the NQiOB was an Ordovician oceanic island arc environment. This excludes the possibility of provenance from the NQinOB. Therefore, provenance for the Upper Permian Shiguan Fm. (22JLG-9) in the Jiangligou area is interpreted as derived from the NQiOB.
In summary, the Upper Member of the Middle-Upper Permian Shilidun Fm. (22LT-1) in the Lintan area was mainly derived from the NQinOB, with minor contributions from the NCCB. In contrast, the Upper Permian Shiguan Fm. (22JLG-9) in the Jiangligou area was sourced from the NQiOB.
(2) Permian Provenance Analysis in West Qinling
The detrital zircon age characteristics of the Permian Ganjia Fm. in the Xunhua area, West Qinling, are similar to the NQinOB and NQiOB (Figure 10e,j,k). However, sedimentary geochemical provenance analysis indicates the provenance area is mainly an active continental margin continental island arc environment. The main active period of the NQinOB (Early Paleozoic) was a continental island arc environment. Therefore, provenance for the Permian Ganjia Fm. in the Xunhua area is interpreted as derived from the NQinOB (Table 2). The detrital zircon age composition, εHf(t), and TDM2 distribution characteristics of the Middle Permian Maomaolong Fm. in the Hezuo area, West Qinling, are similar to the NCCB and NQinOB (Figure 10d,j,k and Figure 11). The proportion of 2700–1800 Ma age group zircons is very high (79%). This indicates provenance is mainly from the NCCB, with minor contributions from the NQinOB (Table 2). The detrital zircon age characteristics of the Upper Member of the Middle-Upper Permian Shilidun Fm. in the Lintan area are similar to the NCCB and NQinOB (Figure 10f,j,k). The proportion of 2700–1800 Ma age group zircons is very high (80%). This indicates provenance is mainly from the NCCB, with minor contributions from the NQinOB (Table 2). Sedimentary geochemical provenance analysis indicates the provenance area is mainly passive continental margin and continental island arc environments. This is consistent with the NCCB (passive continental margin) and NQinOB (oceanic island arc) provenance results. The detrital zircon age distribution of the Middle-Upper Permian Shilidun Fm. in the Minxian area is similar to the NCCB, NQiOB, and NQinOB (Figure 10c,j,k). The proportion of 2700–1800 Ma age group zircons is very low (14%). Sedimentary geochemical provenance analysis indicates the provenance areas are mainly active continental margin and continental island arc environments, with minor passive continental margin environments. This excludes provenance from the NQiOB. Therefore, passive continental margin provenance is mainly from the NQinOB. Minor contributions are from the NCC basement (Table 2).

Table 2.
Statistical analysis of the provenance in different regions of the Western Qinling.
In summary, Permian sandstones in the West Qinling exhibit complex and variable provenance. Provenance is mainly from the NQinOB and the NCCB, and minor provenance from the Qilian Tectonic Belt occurs in some regions. The contribution from each source region varies significantly in different areas.
5.2. Tectonic Significance
Previous debates exist regarding the closure timing of the Shangdan Ocean: end of Caledonian [40,41,42,43] (Late Silurian-Early Devonian) vs. Late Triassic [44,45,46,47,48,49]. This study found the youngest zircon crystallization age in the Upper Member of the Shilidun Fm. (22LT-1) in Lintan area is 251.4 ± 2.9 Ma (zircon concordance 98%, Late Permian within error, Table S1). This indicates the upper member was deposited no earlier than the Late Permian. Previous studies suggest the Shilidun Fm. in Lintan is Middle-Late Permian [5]. Therefore, the upper member is interpreted as Late Permian deposition. The middle and lower members may be Middle-Late Permian deposition. This further constrains the depositional age of the Upper Member of the Shilidun Fm. to the Late Permian. Provenance for the Permian Maomaolong Fm. in Hezuo area, the Shilidun Formation in Lintan area, and the Shilidun Fm. in Minxian area are all from the NCCB and the NQinOB. This reflects that the Shangdan Ocean had closed by the time of deposition of the Upper Member of the Shilidun Fm. (22LT-1) in Lintan area. Closure occurred before the Late Permian, specifically during the Caledonian orogeny. Only after the closure of the Shangdan Ocean could the NCCB and the NQinOB have provided sediment sources across the former ocean to the Permian of the Western Qinling.
Regionally, the entire QinOB and adjacent areas were influenced by the expansion of the Paleo-Tethys Ocean. The Mianlue Ocean opened during the Devonian [50,51] and reached its maximum extent during the Carboniferous to Early Permian under a regional extensional to transtensional tectonic regime. By the end of the Late Paleozoic, it gradually entered a phase of subduction and consumption [50]. During this period, the West Qinling area likely developed an active continental margin setting. It is inferred that during the Late Paleozoic, the Yangtze Block continuously subducted westward beneath the West Qinling micro-block. This intensified tectonic activity in the West Qinling Tectonic Belt. Therefore, sedimentary basins during this stage may have been in a local extensional-expansion phase under a subduction background. The basin prototype may have been a back-arc rift basin [52].
The geographical sequence of the study area and adjacent areas from west to east is as follows: Xunhua area (Permian Ganjia Fm.) → Jiangligou area (Upper Permian Shiguan Fm., this study) → Hezuo area (Middle Permian Maomaolong Fm.) → northern Lintan area (Middle-Upper Permian upper Shilidun Fm.) → northeastern Lintan area (Upper Permian upper Shilidun Fm., this study) → Minxian area (Middle-Upper Permian Shilidun Fm., Figure 1). Their corresponding provenance interpretations are summarized in Table 2. The east–west variation in provenance indicates the following: (1) Although the Xunhua and Jiangligou areas are adjacent (Figure 1), they exhibit distinct provenances: the former sourced from the NQinOB and the latter from the NQiOB. This indicates strong heterogeneity in provenance for sedimentary basins at the junction between the West Qinling northern margin and the Qilian Tectonic Belt. Provenance changes rapidly and strongly laterally. (2) The proportion of provenance supplied by the NCCB changes from west to east: no supply (0%) in Xunhua and Jiangligou areas → strong supply (~80%) in Hezuo and northern Lintan area → weak supply (23% in northeastern Lintan area, 14% in Minxian area, Table 2). This indicates the NCCB generally supplied provenance to areas east of Hezuo area. The tectonic environment of the northern West Qinling northern belt may have provided favorable conditions for sediment transport pathways. (3) The Qilian Tectonic Belt supplied limited provenance to the Permian in the West Qinling. Significant supply only occurred in the Jiangligou area. The weak supply may be because the Qilian Tectonic Belt completed amalgamation by the Devonian. It then experienced a long period of relative tectonic quiescence. It remained in a state of erosion and peneplanation. By the Permian, erosion rates in the Qilian Tectonic Belt were low. Sufficient provenance could not be supplied to the West Qinling. Alternatively, remnant Qin-Qi Sea basins may have locally persisted within the NQinOB, which closed in the Early Paleozoic, during the Permian. These basins separated the Qilian Tectonic Belt from the West Qinling. This prevented large-scale supply of Qilian provenance to the West Qinling. Only local supply was possible. Previous studies found marine deposits in the Permian of the West Qinling, particularly within the Shiguan Fm. in the Jiangligou area [5,7,10]. Stratigraphic evidence for marine transgressions exists in the Permian-Triassic delta-lacustrine facies strata of the SOB [53]. This indirectly proves the local persistence of remnant Qin-Qi Sea basins during the Permian.
6. Conclusions
(1) The Upper Member of the Shilidun Formation in the Lintan area was deposited during the Late Permian. The heavy mineral assemblage is dominated by moderately to highly stable species. Source rocks were derived from intermediate-acidic magmatic rocks and low- to medium-grade metamorphic terrains. The provenance was primarily situated in a continental island arc tectonic setting. Diverse source rock types were identified, including materials from felsic igneous, quartzose recycled, and mafic igneous provenances. Detrital zircon U–Pb age spectra display two major peak ages (285 Ma and 442 Ma) and five subordinate peak ages (818 Ma, 970 Ma, 1734 Ma, 1956 Ma, and 2500 Ma). The εHf(t) values range from −44.95 to 42.67, and TDM2 ages vary between 367 Ma and 4106 Ma. It is concluded that the sediments were mainly derived from the North Qinling Orogenic Belt, with minor contributions from the basement of the North China Craton.
(2) In the Jiangligou area, the Shiguan Formation is dominated by highly stable heavy minerals. The provenance was primarily intermediate-acidic magmatic rocks, within an oceanic island arc tectonic setting. Detrital zircon U–Pb age spectrum shows one prominent peak at 442 Ma. The εHf(t) values range from −0.5 to 10.55, and TDM2 ages vary between 744 Ma and 897 Ma. It is concluded that the sedimentary materials were derived from the North Qilian Orogenic Belt.
(3) The Permian in the Western Qinling is characterized by multiple provenance supplies. It was dominated by the North Qinling Orogenic Belt and the North China Craton basement. Local influence from the North Qilian Orogenic Belt was also observed. Significant regional variations in provenance contributions were identified.
(4) The Upper Member of the Shilidun Formation in the Lintan area, West Qinling, was deposited during the Late Permian. Its provenance was derived from the North China Craton basement and the North Qinling Orogenic Belt. These findings imply that the Shangdan Ocean had closed to pre-Late Permian. This closure enabled the North China Craton basement and the North Qinling Orogenic Belt to serve as sediment sources for the Permian strata in the West Qinling.
Supplementary Materials
The following supporting information can be downloaded at: https://www.mdpi.com/article/10.3390/min15101024/s1, Table S1: Zircon LA-ICP-MS U-Pb isotope data; Table S2: Lu-Hf isotope data.
Author Contributions
Data curation, X.L., Z.Z., Z.L., and W.Z.; software, W.P., W.Z., X.Q., and Z.T.; writing—original draft, Z.J., L.M., and S.M.; writing—review and editing, Z.J., S.M., and J.L.; supervision, S.M., J.M., and W.M.; funding acquisition, J.M. and W.M. All authors have read and agreed to the published version of the manuscript.
Funding
This research is funded by the Applied Basic Research Project of the Qinghai (China) Provincial Science and Technology Department (2023–ZJ–781).
Data Availability Statement
Data are available upon request to the corresponding author of the manuscript.
Acknowledgments
We are grateful to the journal editor and reviewers for their contributions to this article.
Conflicts of Interest
Authors Zhichao Li and Zhengtao Zhang were employed by the company PetroChina Changqing Oilfield Co., Ltd. The remaining authors declare that the research was conducted in the absence of any commercial or financial relationships that could be construed as a potential conflict of interest.
Abbreviations
The following abbreviations are used in this manuscript:
| QinOB | Qinling Orogenic Belt |
| NQinOB | North Qinling Orogenic Belt |
| NQiOB | North Qilian Orogenic Belt |
| MQiB | Middle Qilian Block |
| SQiOB | South Qilian Orogenic Belt |
| NCC | North China Craton |
| NCCB | North China Craton basement |
| SOB | Southern Ordos Basin |
| YB | Yinshan Block |
References
- Liu, S.G.; Luo, Z.L.; Zhao, X.K.; Xu, G.S.; Wang, G.Z.; Zhang, C.J. Coupling relationships of sedimentary basin-orogenic belt systems and their dynamic models in West China: A case study of the Longmenshan Orogenic Belt-West Sichuan foreland basin system. Acta Geol. Sin. 2003, 72, 177–186, (In Chinese with English Abstract). [Google Scholar]
- Dickinson, W.R.; Gehrels, G.E. U-Pb ages of detrital zircons in Jurassic eolian and associated sandstones of the Colorado Plateau: Evidence for transcontinental dispersal and intraregional recycling of sediment. Geol. Soc. Am. Bull. 2015, 121, 408–433. [Google Scholar] [CrossRef]
- Fornelli, A.; Gallicchio, S.; Micheletti, F. U-Pb detrital zircon ages and compositional features of Bifurto quartz-rich sandstones from Southern Apennines (Southern Italy): Comparison with Numidian Flysch sandstones to infer source area. Italian J. Geosci. 2019, 138, 216–230. [Google Scholar] [CrossRef]
- Asmussen, P.; Gust, D.A.; Bryan, S.E.; Purdy, D.; Murphy, D.; Allen, C.M. Multimethod provenance analysis using detrital zircon and rutile U-Pb geochronology across Devonian basin systems in the Tasmanides of eastern Australia. Gondwana Res. 2023, 118, 174–191. [Google Scholar] [CrossRef]
- Gao, X.Y.; Pei, X.Z.; Li, Z.C.; Li, R.B.; Wei, L.Y.; Wang, M.; Liu, C.J.; Gao, F.; Liang, G.B.; Shao, J.K.; et al. Age and provenance of Upper Shilidun Formation, Lintan, West Qinling Orogen: Constraints from LA-ICP-MS U-Pb dating of detrital zircons. Earth Sci. 2019, 44, 1389–1414, (In Chinese with English Abstract). [Google Scholar] [CrossRef]
- Chen, Y.L.; Li, D.P.; Zhou, J.; Zhang, H.F.; Liu, F.; Nie, L.S.; Jiang, L.T.; Liu, X.M. U-Pb ages of zircons in Western Qinling Mountain, China, and their teetonic implications. Earth Sci. Front. 2008, 15, 88–107, (In Chinese with English Abstract). [Google Scholar] [CrossRef]
- Feng, X.; Shao, X.K.; Hou, H.X.; Qin, D.H. Restoration of Devonian-Triassic sedimentary environment and basin tectonic evolution in Lintan Area, West Qinling. Geol. Res. 2023, 32, 517–527, (In Chinese with English Abstract). [Google Scholar] [CrossRef]
- Yan, Q.Z. Geologic Features and Provenance Analysis of Late Paleozoic-Early Mesozoic Sediment Strata at Qinghai Daowei Area in the Northern Margin of the West Qinling. Master’s Thesis, Chang’an University, Xi’an, China, 2017. (In Chinese with English Abstract). [Google Scholar]
- Zhang, Y.X.; Zeng, L.; Zhang, K.J.; Li, Z.W.; Wang, C.S.; Guo, T.L. Late Palaeozoic and early Mesozoic tectonic and palaeogeographic evolution of central China: Evidence from U–Pb and Lu–Hf isotope systematics of detrital zircons from the western Qinling region. Int. Geol. Rev. 2014, 56, 351–392. [Google Scholar] [CrossRef]
- Chang, L. Discussion on Stratigraphic Characteristics and Age Attribution of Shilidun Formation in Minxian Area of Western Qinling Mountains. Master’s Thesis, Chang’an University, Xi’an, China, 2019. (In Chinese with English Abstract). [Google Scholar]
- Chen, Y.Z. Research on Tectono-Sedimentary Characteristic of Marine Strata from Caboniferous to Middle Triassic in Southern Qilian Area and Northern Belt of West Qinling Mountains. Ph.D. Thesis, Northwest University, Xi’an, China, 2019. (In Chinese with English Abstract). [Google Scholar]
- Li, Z.C.; Pei, X.Z.; Wei, L.Y.; Zhao, W.C.; Wang, M.; Liu, C.J.; Li, R.B.; Pei, L.; Chen, Y.X.; Qin, L. Detrital zircon U-Pb age and provenance analysis of Lower Cretaceous-Pliocene continental strata at Lintan area in the West Qinling orogenic belt. Acta Geol. Sin. 2019, 93, 2171–2186, (In Chinese with English Abstract). [Google Scholar] [CrossRef]
- Sun, X.P.; Xu, X.Y.; Chen, J.L.; Gao, T.; Li, T.; Li, X.B.; Li, X.Y. Geochemical Characteristics and Chronology of the Jiangligou Granitic Pluton in West Qinling and Their Geological Significance. Acta Geol. Sin. 2013, 87, 330–342, (In Chinese with English Abstract). [Google Scholar]
- Pan, W.Q.; Jiang, Z.W.; Fan, L.Y.; Zhang, Z.T.; Li, Z.C.; Ma, S.W.; Wang, Z.D.; Li, X.J.; Zhao, W.R. Provenance of the He 8 Member of the Upper Paleozoic Shihezi Formation, Ordos Basin, China: Insights from Heavy Minerals, Paleocurrents, Detrital Zircon Chronology, and Hf Isotopes. Minerals 2024, 14, 1076. [Google Scholar] [CrossRef]
- Wang, J.Q.; Liu, X.M. Proficiency Testing of the XRF Method for Measuring 10 Major Elements in Different Rock Types. Rock. Miner. Anal. 2016, 35, 145–151, (In Chinese with English Abstract). [Google Scholar] [CrossRef]
- Liu, Y.; Liu, X.M.; Hu, Z.C.; Diwu, C.R.; Yuan, H.L.; Gao, S. Evaluation of accuracy and long-term stability of determination of 37 trace elements in geological samples by ICP-MS. Acta Petrol. Sin. 2006, 23, 1203–1210, (In Chinese with English Abstract). [Google Scholar]
- Yuan, H.L.; Gao, S.; Liu, X.M.; Li, H.M.; Gunther, D.; Wu, F.Y. Accurate U-Pb Age and Trace Element Determinations of Zircon by Laser Ablation-Inductively Coupled Plasma-Mass Spectrometry. Geostand. Geoanal. Res. 2004, 28, 353–370. [Google Scholar] [CrossRef]
- Andersen, T. Correction of common lead in U-Pb analyses that do not report 204Pb. Chem. Geol. 2002, 192, 59–79. [Google Scholar] [CrossRef]
- Yuan, H.L.; Gao, S.; Dai, M.N.; Zong, C.L.; Gunther, D.; Fontaine, G.H.; Liu, X.M.; Diwu, C.R. Simultaneous determinations of U–Pb age, Hf isotopes and trace element compositions of zircon by excimer laser-ablation quadrupole and multiple-collector ICP-MS. Chem. Geol. 2008, 247, 100–118. [Google Scholar] [CrossRef]
- Wu, F.Y.; Li, X.H.; Zheng, Y.F.; Gao, S. Lu-Hf isotopic systematics and their applications in petrology. Acta Petrol. Sin. 2007, 23, 185–220, (In Chinese with English Abstract). [Google Scholar]
- Taylor, S.R.; Mclennan, S.M. The Continental Crust: Its Composition and Evolution, An Examination of the Geochemical Record Preserved in Sedimentary Rocks; Blackwell Scientific Publishing: Oxford, UK, 1985; pp. 117–140. [Google Scholar]
- Rudnick, R.; Gao, S. The role of lower crustal recycling in continent formation. Geochim. Cosmochim. Acta 2003, 67, 403. [Google Scholar]
- Sun, S.S.; McDonough, W.F. Chemical and isotopic systematics of oceanic basalts: Implications for mantle composition and processes. In Magmatism in the Ocean Basins; Geological Society Special Publication: London, UK, 1989; pp. 313–345. [Google Scholar] [CrossRef]
- Belousova, E.A.; Griffin, W.L.; O’Reilly, S.Y.; Fisher, N.I. Igneous zircon: Trace element composition as an indicator of source rock type. Contrib. Mineral. Petrol. 2002, 143, 602–622. [Google Scholar] [CrossRef]
- Rubatto, D. Zircon trace element geochemistry: Partitioning with garnet and the link between U–Pb ages and metamorphism. Chem. Geol. 2002, 184, 123–138. [Google Scholar] [CrossRef]
- Hoskin, P.W.O.; Schaltegger, U. The Composition of Zircon and Igneous and Metamorphic Petrogenesis. Rev. Mineral. Geochem. 2003, 53, 27–62. [Google Scholar] [CrossRef]
- Duan, Y.L.; Pan, W.Q.; Zhang, X.; Zhang, Z.T.; Ding, Y.; Jiang, Z.W.; Li, Z.C.; Meiduo, L.M.; Li, W.H. Provenance of the Upper Paleozoic Shihezi Formation in the Luonan Region of the Qinling Orogenic Belt and Its Tectonic Implications. Minerals 2025, 15, 549. [Google Scholar] [CrossRef]
- Ji, B.; Li, X.M.; Huang, B.T.; Wang, L.; Wang, G.Q. Geochronology of detrital zircons from the Guaizhangshan Group from the southern Danghe Mountains in South Qilian and its geological implications. Acta Geol. Sin. 2021, 95, 765–778, (In Chinese with English Abstract). [Google Scholar]
- Griffin, W.L.; Person, N.J.; Belousova, E.; Jackson, S.E.; Achterbergh, E.V.; Reilly, S.Y.O.; Shee, S.R. The Hf isotope composition of cratonic mantle: LAM-MC-ICPMS analysis of zircon megacrysts in kimberlites. Geochim. Cosmochim. Acta 2000, 64, 133–147. [Google Scholar] [CrossRef]
- Nesbitt, H.W.; Young, G.M. Early Proterozoic climates and plate motions inferred from major element chemistry of lutites. Nature 1982, 299, 715–717. [Google Scholar] [CrossRef]
- Cox, R.; Lowe, D.R.; Cullers, R.L. The influence of sediment recycling and basement composition on evolution of mudrock chemistry in the southwestern United States. Geochim. Cosmochim. Acta 1995, 59, 2919–2940. [Google Scholar] [CrossRef]
- Roser, B.P.; Korsch, R.J. Provenance signatures of sandstone-mudstone suites determined using discriminant function analysis of major-element data. Chem. Geol. 1988, 67, 119–139. [Google Scholar] [CrossRef]
- Roser, B.P.; Korsch, R.J. Determination of tectonic setting of sandstone-mudstone suites using SiO2 content and K2O/Na2O ratio. J. Geol. 1986, 94, 635–650. [Google Scholar] [CrossRef]
- Bhatia, M.R. Plate tectonics and geochemical composition of sandstones. J. Geol. 1983, 91, 611–627. [Google Scholar] [CrossRef]
- Bhatia, M.R.; Crook, K.A.W. Trace element characteristics of graywackes and tectonic setting discrimination of sedimentary basins. Contrib. Mineral. Petrol. 1986, 92, 181–193. [Google Scholar] [CrossRef]
- Cawood, P.A.; Hawkesworth, C.J.; Dhuime, B. Detrital zircon record and tectonic setting. Geology 2012, 40, 875–878. [Google Scholar] [CrossRef]
- Cheng, C. The Evolution of Permian Sedimentary Sequences in Zhen’an, Shaanxi, China, and Its Response to the Changes of Permian Paleoclimate, Paleoenvironment and Paleogeography. Ph.D. Thesis, Hefei University of Technology, Hefei, China, 2018. (In Chinese with English Abstract). [Google Scholar]
- Jiang, Z.W.; Luo, J.L.; Liu, X.S.; Hu, X.Y.; Ma, S.W.; Hou, Y.D.; Fan, L.Y.; Hu, Y.H. Provenance and Implication of Carboniferous–Permian Detrital Zircons from the Upper Paleozoic, Southern Ordos Basin, China: Evidence from U-Pb Geochronology and Hf Isotopes. Minerals 2020, 10, 265. [Google Scholar] [CrossRef]
- Gao, C.Y.; Guo, A.L.; Li, X.H.; Li, K.; Liu, W.G. LA-ICP-MS U-Pb dating of detrital zircon from Liuyehe basin in North Qinling Mountains. Geol. Bull. China 2015, 34, 1689–1698, (In Chinese with English Abstract). [Google Scholar]
- Zhang, Y.; Dai, S.; Liu, F.; Qin, D.B.; Ding, L.F.; Chen, Z.Z.; Fang, Y.F.; Ma, X.N.; Wang, X.J.; Hua, Y.L. Devonian–Triassic tectonic evolution of the Western Qinling Orogenic Belt of central China: Insights from detrital zircon U–Pb chronology and rock geochemistry. Palaeogeogr. Palaeoclimatol. Palaeoecol. 2025, 676, 113155. [Google Scholar] [CrossRef]
- Lin, H.; Li, Z.; Pei, X.Z.; Li, R.B.; Zhou, H.; Wang, M.Z.; Qin, S.W.; Li, M.W. Investigating the Orogenic Evolution of the Wushan–Shangdan Ocean in the Qinling–Qilian Conjunction Zone: Insights from the Early Devonian Tailu Pluton. Minerals 2024, 14, 910. [Google Scholar] [CrossRef]
- Zhang, H.F.; Gao, S.; Zhang, B.R.; Luo, T.C.; Lin, W.L. Pb isotopes of granitoids suggest Devonian accretion of Yangtze (South China) craton to North China craton. Geology 1997, 25, 1015–1018. [Google Scholar] [CrossRef]
- Gao, S.; Zhang, B.R.; Gu, X.M.; Xie, Q.L.; Gao, C.L.; Guo, X.M. Silurian-Devonian provenance changes of South Qinling basins: Implications for accretion of the Yangtze (South China) to the North China cratons. Tectonophysics 1995, 250, 183–197. [Google Scholar] [CrossRef]
- Okay, A.I.; Sengör, A.M.C.; Satir, M. Tectonics of an ultrahigh-pressure metamorphic terrane: The Dabie Shan/Tongbai Shan Orogen, China. Tectonics 1993, 12, 1320–1334. [Google Scholar] [CrossRef]
- Ames, L.; Gaozhi, Z.; Baocheng, X. Geochronology and isotopic character of ultrahigh-pressure metamorphism with implications for collision of the Sino-Korean and Yangtze cratons, central China. Tectonics 1996, 15, 472–489. [Google Scholar] [CrossRef]
- Bradley, R.H.; Lothar, R.; Webb, L.; Trevor, I.; Doug, W.; Dong, S.W. U/Pb zircon ages constrain the architecture of the ultrahigh-pressure Qinling–Dabie Orogen, China. Earth Planet. Sci. Lett. 1998, 161, 215–230. [Google Scholar] [CrossRef]
- Enkin, R.J.; Yang, Z.; Chen, Y.; Courtillot, V. Paleomagnetic constraints on the geodynamic history of the major blocks of China from the Permian to the present. J. Geophy. Res. 1992, 97, 13953–13989. [Google Scholar] [CrossRef]
- Sengör, A.M.C. East Asian tectonic collage. Nature 1985, 318, 16–17. [Google Scholar] [CrossRef]
- Dong, Y.P.; Zhang, G.W.; Neubauer, F.; Liu, X.M.; Genser, J.; Hauzenberger, C. Tectonic evolution of the Qinling orogen, China: Review and synthesis. J. Asian Earth Sci. 2011, 41, 213–237. [Google Scholar] [CrossRef]
- Zhang, G.W. The Qinling Menglue Structural Belt and the Continental Structure of China; Science Press: Beijing, China, 2015; pp. 1–516. [Google Scholar]
- Wu, Y.B.; Zheng, Y.F. Tectonic evolution of a composite collision orogen: An overview on the Qinling–Tongbai–Hong’an–Dabie–Sulu orogenic belt in central China. Gondwana Res. 2013, 23, 1402–1428. [Google Scholar] [CrossRef]
- Xu, D.X.; Wei, L.Y.; Zhang, Z.; Kou, S.L.; Chang, L.; Cao, L. U-Pb Age, Geochemical Characteristics and Sedimentary Environment Analysis of Detrital Zircons from the Longwuhe Formation in Lintan area, West Qinling. Northwest Geol. 2020, 53, 102–125, (In Chinese with English Abstract). [Google Scholar]
- Duan, Y.L. Marine Transgression Events and Depositional Environment Evolution in the Southern Margin of the Ordos Basin during the Middle-Late Permian to Early Triassic. Ph.D. Thesis, Northwest University, Xi’an, China, 2025. (In Chinese with English Abstract). [Google Scholar]
Disclaimer/Publisher’s Note: The statements, opinions and data contained in all publications are solely those of the individual author(s) and contributor(s) and not of MDPI and/or the editor(s). MDPI and/or the editor(s) disclaim responsibility for any injury to people or property resulting from any ideas, methods, instructions or products referred to in the content. |
© 2025 by the authors. Licensee MDPI, Basel, Switzerland. This article is an open access article distributed under the terms and conditions of the Creative Commons Attribution (CC BY) license (https://creativecommons.org/licenses/by/4.0/).