Abstract
Bentonite is used as a buffer material in engineered barriers for the geological disposal of high-level radioactive waste. The buffer material will be made of bentonite, a natural clay, mixed with silica sand. The buffer material is affected by decay heat from high-level radioactive waste, infiltration of groundwater, and swelling of the buffer material. The analysis of these factors requires coupled analysis of heat transfer, moisture transfer, and groundwater chemistry. The purpose of this study is to develop a model to evaluate bentonite types and silica sand content in a unified manner for thermo-hydro-chemical (T-H-C)-coupled analysis in buffer materials. We focused on the content of the clay mineral montmorillonite, which is the main component of bentonite, and developed a model to derive the moisture diffusion coefficient of liquid water and water vapor based on Philip and de Vries, and Kozeny–Carman. The evolutions of the temperature and moisture distribution in the buffer material were analyzed, and the validity of each distribution was confirmed by comparison with the measured data obtained from an in situ experiment at 350 m in depth at the Horonobe Underground Research Center, Hokkaido, Japan.
1. Introduction
Radioactive waste is generated from reprocessing facilities of spent fuels generated from nuclear facilities such as nuclear power stations and medical facilities such as hospitals. Among radioactive wastes, high-level radioactive wastes (HLWs) have extremely high radioactivity levels. HLW is vitrified waste from liquid waste that remains after reprocessing (recovery of reusable U and Pu) spent nuclear waste generated at nuclear power plants.
Because of the high radioactivity level of HLW, a disposal method that isolates HLW from the human living environment until its toxicity declines is required. The isolation period is expected to be tens of thousands to hundreds of thousands of years, so the disposal method must be one that does not require human control. The current disposal method is called “geological disposal” [1]. In Japan, this method involves enclosing the waste in a multi-layered barrier system and burying it at a depth of 300 m or more below the surface. The multi-barrier system consists of a natural barrier composed of host rock and engineered barriers composed of vitrified waste, overpack (metal container), and buffer material. Figure 1 shows a conceptual diagram of the engineered barrier system. The roles of the components of engineered barriers are described. The role of vitrified waste is to confine radionuclides for a long period of time by taking advantage of the water insolubility of glass [1]. The role of the overpack is to prevent contact for at least 1000 years between the vitrified waste and groundwater until the radioactivity of the vitrified waste has decayed to some extent [1]. The main functions required of buffer materials are stress buffering, chemical buffering, water sealing, sorption of radionuclides, and thermal conductivity [1]. Stress buffering protects the overpack from stress from the bedrock. Chemical buffering prevents significant changes in the pH and chemical composition of the porewater. Water sealing delays the approach of radionuclides leached into groundwater to the human living environment. Radionuclide sorption delays the migration of radionuclides by allowing them to sorb onto the buffer material. Thermal conductivity suppresses the temperature rise of the vitrified product. This study focuses on the buffer material.
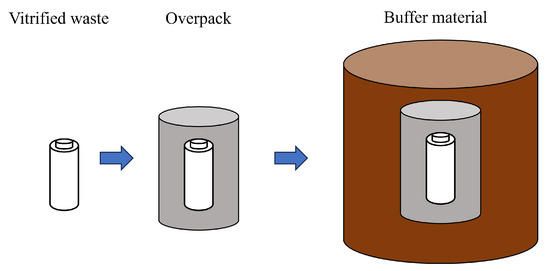
Figure 1.
Engineered barrier system.
Bentonite is a natural clay composed of mainly montmorillonite, a layered clay mineral. Low-permeability bentonite components can be manufactured and emplaced, which ensures diffusion is the dominant transport mechanism. Montmorillonite has a sheet structure, with several sheets stacked on top of each other to form a laminate. The space between crystalline sheets is called the interlayer, and cations exist in the interlayer. The cations are called exchangeable cation. When ions are mainly present in the interlayer, it is called Na-montmorillonite, and when they are of the type, it is called Ca-montmorillonite. When montmorillonite comes into contact with water, the cations between the layers hydrate, absorbing water molecules between the layers, and the interlayer distance increases. Figure 2 shows the structure of montmorillonite and the increase in basal spacing (distance from the surface of one layer to the surface of the next layer in a clay mineral crystal) due to hydration. When montmorillonite comes into contact with saline water, such as seawater, water molecules hydrate the dissolved cations, reducing the amount of free water that can hydrate the interlayer cations. Therefore, the swelling capacity of montmorillonite in salt water are reduced compared to pure water.
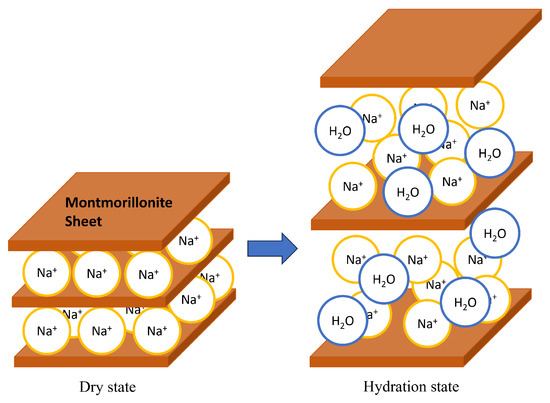
Figure 2.
Montmorillonite and its swelling.
To reduce the uncertainty in the performance evaluation of engineered barriers, it is necessary to quantify the physical and chemical phenomena occurring in the buffer material. Typical physical and chemical phenomena occurring in the buffer material include thermal transport (heat transport), moisture transport (groundwater infiltration), chemical reaction (porewater composition), and mechanical stress (swelling), which interact with each other. For example, it has been found that hydraulic conductivity is greater in saline water than in distilled water [2]. Also, the degree of heat transfer varies depending on the saturation of the buffer material [3]. Therefore, a coupled model combining these physical and chemical phenomena is necessary to evaluate the temperature and moisture distribution in the buffer material.
There are many research works on the properties of bentonite. The measured results of thermal properties such as the thermal conductivity of bentonite have shown that the higher the water content becomes, the higher the thermal conductivity becomes [3,4]. The measured results of hydraulic conductivity show that the lower the density becomes and the higher the ionic strength of water becomes, the higher the hydraulic conductivity becomes [2,4,5]. The results of water retention tests on bentonite show that the hysteresis of the moisture property curve is small and the density dependence is also small [6]. XRD analysis of saturated montmorillonite’s basal spacing has revealed a relationship between dry density (montmorillonite partial density) and basal spacing [7,8,9]. It has also been found that the basal spacing tends to decrease with increasing NaCl concentration.
Theory-based parameter prediction has also been studied. For example, the data obtained from water retention tests were used to formulate empirical equations using van Genuchten’s method, and the water diffusion coefficient was predicted using the Philip and de Vries equation [10]. For the dependence of the interlayer distance of montmorillonite on salinity, there are predictions of the variation of the interlayer distance with the NaCl concentration of solution [11] based on thermodynamic equilibrium. The prediction of hydraulic conductivity has been studied using the Kozeny–Carman equation. Recently, a more accurate prediction model based on the separation of the internal and external pores between the interlayers of montmorillonite crystals has been developed [12,13]. In these studies, the mean interlayer distance of bentonite was used to separate the external and internal pore.
Coupled model development in Japan has been conducted by Japan Atomic Energy Agency (JAEA) using the T-H-M-C-coupled analysis code, which combined the T-H-M analysis code (THAMES), the mass transport analysis code (Dtransu), and the geochemical analysis code (PHREEQC). The evolution of the temperature distribution in buffer material, including the near-field, and the time required to resaturate the buffer were then predicted [14]. In recent years, coupled models have been upgraded to take into account the salinity dependence of hydraulic conductivity [15] and the effect of dry density on the mechanical, thermal, and hydraulic properties of the buffer material [16]. In addition to simulations, in situ tests have been conducted at underground research facilities in Japan and overseas to understand coupled T-H-C phenomena. In Japan, in situ tests of engineered barriers have been conducted at the Horonobe Underground Research Center (JAEA), and measurement data such as the buffer material’s saturation and temperature distribution have been obtained [17,18].
Previous studies of coupled models have mainly used empirical equations obtained from experiments with buffer specifications in the reference case of the H12 report [1]. However, the model development is only for reference cases in the H12 report and is not exhaustive. Therefore, the applicability of the models is limited. Among the properties of buffer materials, low hydraulic conductivity is mainly attributed to montmorillonite, the main component of bentonite, and the content of montmorillonite varies depending on the kind of bentonite. The montmorillonite content in the bentonite is considered to vary even within the same locality, depending on the layer where the bentonite was extracted. Therefore, for the development of a general-purpose coupled model, it is effective to organize parameters focusing on montmorillonite content.
In this paper, a T-H-C-coupled model focusing on montmorillonite content in bentonite is developed for Na-bentonite to predict changes in temperature and moisture distribution over time in a versatile manner independent of bentonite type and silica sand content. The thermal properties are modeled by regression analysis based on previously measured data. The hydraulic properties are modeled by the moisture diffusion coefficient derived based on the Philip and de Vries equation, and the moisture potential and hydraulic conductivity are modeled focusing on the montmorillonite content in bentonite. The effect of salinity is incorporated into the model by converting the water potential and hydraulic conductivity. The performance of the model is evaluated by comparing with data obtained from in situ tests in the underground facility of the Horonobe Underground Research Center (JAEA), Hokkaido, Japan.
2. Analysis Model
The T-H-C-coupled model is used to predict the moisture and temperature distribution in the buffer material during the transient period between the installation of the buffer and full re-saturation of the buffer material, where T is the thermal action (heat transfer), H is the hydraulic action (groundwater infiltration), and C is the water composition.
In this study, the diffusion coefficient is formulated for heat and moisture transfer, and these equations are coupled by varying parameters in a weakly coupled approach. Since the buffer material is cylindrical and the analyses of moisture and temperature distribution in the radial direction are the objective, the cylindrical one-dimensional diffusion equation is used. The surface temperature of overpack is assumed to be constant throughout the analysis period, and the host rock is also constantly saturated. The governing equations and initial and boundary conditions used in this paper are given as follows.
Governing equation
Initial condition
Boundary condition
where t is the time (s), T is the temperature , is the initial temperature of the host rock , is the surface temperature of the overpack , r is the radius , is the overpack radius , is the external diameter of the buffer material , is the analysis radius , w is the water content , is the initial water content , is the saturated water content , is the thermal diffusion coefficient , is the moisture diffusion coefficient under a moisture gradient , and is the moisture diffusion coefficient under a temperature gradient .
The thermal diffusion coefficient is divided into some parameters as follows.
where is the dry density , is the thermal conductivity , and c is the specific heat .
3. Thermal Parameters
3.1. Thermal Conductivity
The effect of cations in the interlayer of montmorillonite on thermal conductivity is considered to be small. Therefore, Ca-bentonite was also included in the analysis. In addition, the change in thermal conductivity due to salinity is small [3]. From the above, in the regression analysis, previously, the measured thermal conductivity of bentonite was used [4,5], and the parameters were organized in terms of temperature , water saturation , bentonite content in the buffer material , and dry density . Although the experimental temperature is not given in the Nuclear Waste Management Organization of Japan (NUMO) as measurement data [4], it was calculated assuming a room temperature of 23 °C. The empirical equation by regression analysis is shown below.
where .
The coefficient of determination , and the adjusted . The coefficient indicates that, although temperature has no significant effect on the coefficient, the coefficient is highly dependent on the degree of saturation. The comparison with the measured values is shown in Figure 3. The horizontal axis is the measured value [4,5] and the vertical axis is the predicted value using Equation (12).
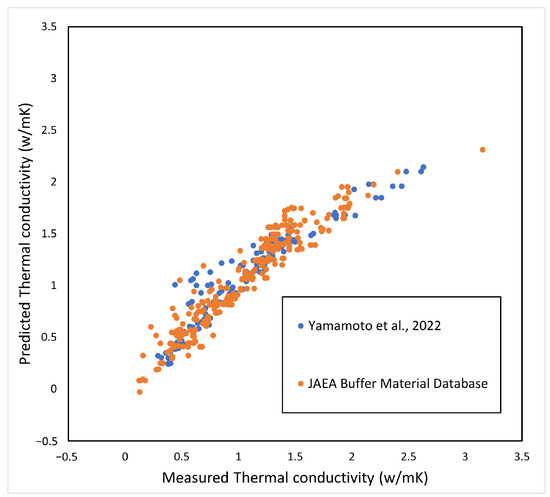
Figure 3.
Prediction of thermal conductivity.
3.2. Specific Heat
The specific heat of the whole soil is expressed by the following relation.
where c is the specific heat of the whole of soil, the specific heat of the solid phase, the specific heat of the liquid phase, the specific heat of the gas phase, the weight ratio of the solid phase per unit volume, the weight ratio of the liquid phase per unit volume, and the weight ratio of the gas phase per unit volume.
Since is quite small compared to the other parameters, Equation (13) is approximately organized as below [3].
Similar to thermal conductivity, the effect of salinity on the specific heat of the liquid phase is presumed to be small, and the specific heat of the liquid phase is modeled including Ca-bentonite. The specific heat of the liquid phase is given as below using the empirical equation [19].
where , is the absolute temperature , and W is the molecular weight of water (18.01528 ).
The specific heat c of the buffer material was calculated from the measured results of thermal conductivity [3,4], and the specific heat of the buffer solid phase was obtained. Figure 4 shows the measured results of specific heat versus the solid phase of each buffer material (bentonite) (the symbols in Figure 4 are described in Table 1, and the number after the symbol is the bentonite ratio (%)). The data were all measured at 20 °C or 23 °C. The numbers in the figure indicate the bentonite content . Figure 4 shows that the specific heat of the solid phase of the buffer material tends to decrease with increasing silica sand content, although the variation of the measured data is large. Therefore, the average value of the specific heat of the buffer solid phase was used, which is 0.6251 kJ/kgK.
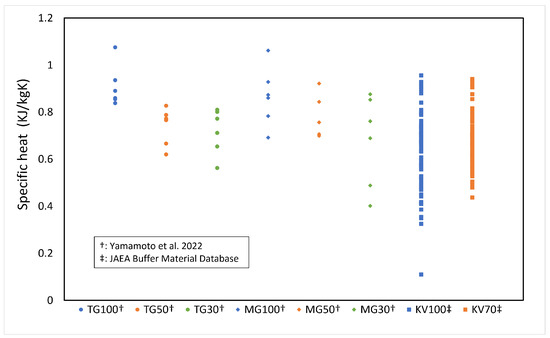
Figure 4.
Specificheat of solid phase of buffer material (refer to Table 1 for the symbols).

Table 1.
The type of bentonite used, its abbreviation, and the montmorillonite content.
Figure 5 shows the calculated results of the specific heat of the buffer material as a function of water content. Since the measured temperature is 20 °C or 23 °C, the calculation was also conducted at the same temperature.
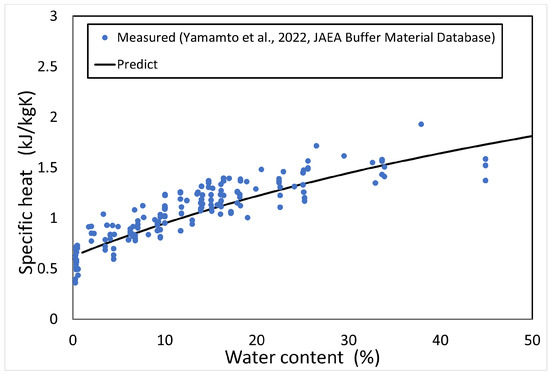
Figure 5.
Predictionof specific heat.
4. Hydraulic Parameters
The moisture diffusion coefficient, a parameter that represents moisture movement in buffer material, is derived using the Philip and de Vries equation [21], which separates the moisture diffusion coefficient under temperature gradient and under moisture gradient and, then, into liquid water movement and water vapor movement , expressed as follows.
where is the matric potential , is the relative humidity , is the enhancement factor , a is the gas phase ratio , is the unsaturated tortuosity factor , v is the math flow factor (≈1), D is the vapor diffusivity in air , is the saturated water vapor density , is the volumetric water content , is the surface tension , R is the gas constant , and K is the hydraulic conductivity . These series of relations are used to predict the moisture diffusion coefficient.
The potential of soil water under unsaturated conditions is expressed as follows.
where is the osmotic potential and is the gravity potential.
The matric potential is due to adsorption and surface tension; the osmotic potential is due to the solute dissolved in the soil water; the gravitational potential is due to the difference in potential energy. The gravity potential is generally negligible, because it is quite small compared to the other two potentials.
The relationship between the relative humidity and potential of soil water is expressed as follows.
Other parameters are shown in Table 2.
Table 2.
Parameters for the calculation of moisture diffusion coefficient.
The matric potential , which represents the water holding capacity of the soil, and the hydraulic conductivity, which represents the permeability, are thought to depend on the montmorillonite content (in the case of hydraulic conductivity, density focused on montmorillonite content) in the buffer material.
4.1. Dependence of Potential on Montmorillonite Content
It is proposed to organize the potential of soil water using water content normalized by montmorillonite content [4,25]. Water content normalized by montmorillonite content is expressed as below.
where is the montmorillonite content in the bentonite (−).
Data on the measured potential of soil water of bentonite in deionized water and artificial seawater (ionic strength of 0.64 M) have been published [4]. The data were obtained from the measurements of the vapor pressure method and psychrometer method. The water potential of soil water in deionized water can be regarded as the same as the matric potential, which is shown in Figure 6, organized by water content normalized by montmorillonite content. The vertical axis shows the potential of soil water at negative pressure, and the horizontal axis shows water content normalized by montmorillonite content. The test was carried out at room temperature (around 20 °C). In this analysis, the temperature was assumed to be 20 °C. From Figure 6, an empirical equation for the matric potential was derived as follows.
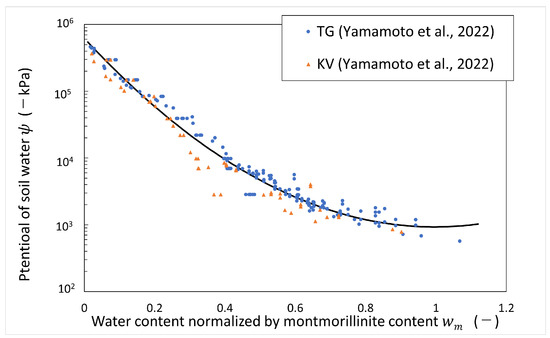
Figure 6.
Potential of soil water (matric potential) vs. water content normalized by montmorillonite content (refer to Table 1 for the symbols).
The following relationship was used to predict the temperature change of the matric potential [23].
By differential Equation (27), a prediction equation for the matric potential at an arbitrary temperature was derived as follows.
The osmotic potential is expressed as follows.
where is the osmotic coefficient, is the stoichiometric mole number of ions produced by dissolution of 1 mol, and m is the molality of the electrolyte solution (mol/kg).
The osmotic coefficient is known to be related to the molar concentration by the weight of NaCl at [26], and in this paper, the following regression equation with a cubic function is used.
Figure 7 shows the calculated results of the potential of soil water versus water content normalized by montmorillonite content in the artificial seawater system. As shown in Figure 7, the calculated results of the potential of soil water in the artificial seawater system using Equations (25) and (30) are consistent with the measured values over the montmorillonite content, so this equation is used to calculate the potential of soil water in this paper.
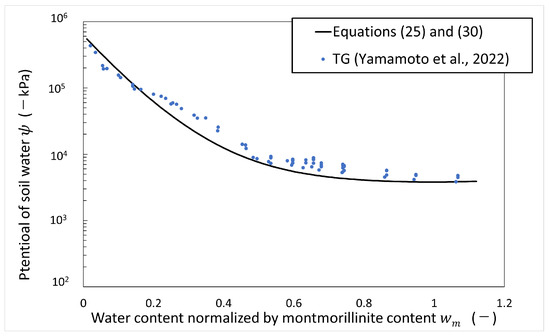
Figure 7.
Potential of soil water in artificial seawater vs. water content normalized by montmorillonite content (refer to Table 1 for the symbols).
4.2. Dependence of Hydraulic Conductivity on Montmorillonite Content
4.2.1. Kozeny–Carman Equation Focusing on Montmorillonite
The hydraulic conductivity K is expressed by a saturated hydraulic conductivity and a relative hydraulic conductivity as follows.
The relative hydraulic conductivity is given by Mualem’s equation as follows [27].
where l is the pore-connectivity parameter and is the effective degree of saturation and is defined as follows.
where is the residual soil water content. In this paper, is used.
The Kozeny–Carman equation as shown below is used to predict saturated hydraulic conductivity.
where C is the dimensionless shape constant (), is the water density , g is the acceleration of gravity , is the viscosity coefficient , S is the the specific surface area , is the tortuosity under saturated condition , and n is the porosity .
The viscosity coefficient as a function of temperature is given by the empirical equation as follows [28].
The low permeability of the buffer material is thought to be due to montmorillonite, the main component of bentonite. Therefore, in this study, the Kozeny–Carman equation is corrected by focusing on the montmorillonite content in the buffer material.
For the dry density, montmorillonite’s partial density as shown below [29] was used, focused on the density of only the montmorillonite part.
where is the average solid (particle) density of impurities (minerals except montmorillonite in bentonite) in bentonite and is the solid (particle) density of silica sand .
Using montmorillonite partial density , montmorillonite porosity is calculated from the following relation.
where is the solid (particle) density of montmorillonite .
The montmorillonite porosity can be divided into the montmorillonite interlayer and montmorillonite external pore. The interlayer distance in the saturated state varies with the montmorillonite partial density [8]. To express this, the porosity is divided into the porosity to interlayer and the porosity to external pore . These can be expressed as follows [30].
where d is the basal spacing , t is the thickness of montmorillonite sheet [31], and N is the number of sheets .
The relationship between the basal spacing d, the thickness of sheet t, and the number of sheets N is shown in Figure 8. According to Kijima et al. [30], for Na-montmorillonite; therefore, is used in this paper.
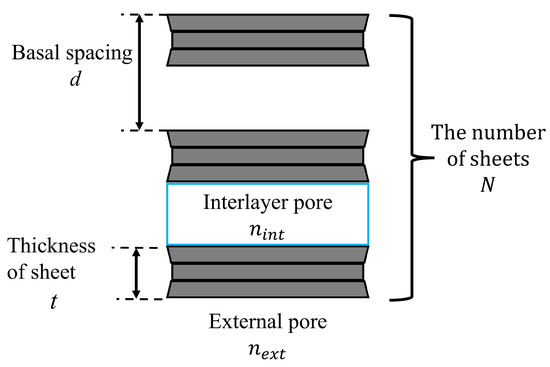
Figure 8.
Image of a montmorillonite sheet.
The specific surface areas of montmorillonite are calculated as follows [12].
where is the specific surface area of montmorillonite [31], is the internal specific surface area of montmorillonite, and is the external specific surface area of montmorillonite.
The internal specific surface area of montmorillonite and specific surface area of montmorillonite are given as follows, respectively [12].
The tortuosities to internal pore and external pore are given as follows, respectively [12].
Interlayer water is considered to have different properties from free water due to the effect of the electric double layer of montmorillonite and is considered to be structured like ice. The relationship between the viscosity coefficient of clay-surface-adsorbed water and the viscosity coefficient of free water is as follows.
where L is a constant, [32].
In this study, the viscosity coefficient of montmorillonite interlayer water is assumed to be the same as the viscosity coefficient of water adsorbed on the clay surface.
In summary, the saturated hydraulic conductivities to the internal and external pores are expressed as follows, respectively.
The saturated hydraulic conductivity of buffer material is calculated as follows.
4.2.2. Basal Spacing in Pure Water
In pure water systems, the relationship between interlayer distance (number of hydration layers) and montmorillonite partial density at saturated equilibrium has been measured by XRD analysis, and it is (2 water layers) above , a mixture of and (3 water layers) at 1.3–1.6 , at 1.0–1.3 , and a mixture of and (9 water layers) at 0.6–1.0 [33]. At low densities, empirical equation has been proposed [30].
The relationship between average interlayer distance and montmorillonite partial density in the pure water system under saturated conditions is calculated as follows.
Figure 9 shows the correlation between basal spacing and montmorillonite partial density calculated based on Equation (51).
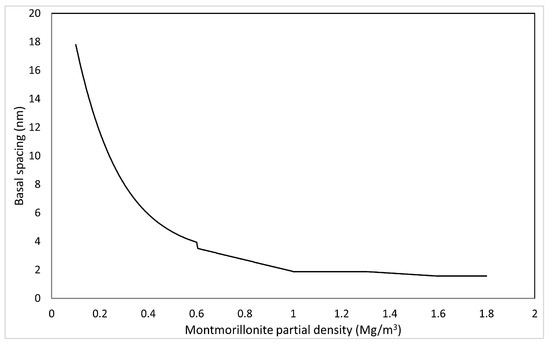
Figure 9.
Calculated results of basal spacing based on montmorillonite partial density.
4.2.3. Basal Spacing in Saline Water
XRD analysis has shown that the basal spacing in brine systems is smaller than that in pure water systems at the same dry density [8,9]. To account for the decrease in basal spacing due to the NaCl concentration of the solution, thermodynamic equilibrium is considered. The relative partial molar Gibbs free energy of interlayer water in Na-montmorillonite when Na-montmorillonite comes into contact with an external aqueous solution of any NaCl concentration and reaches equilibrium is expressed by the following relation [11].
where is the relative partial molar Gibbs free energy of interlayer water in Na-montmorillonite when the Na-montmorillonite in the equilibrium state with pure water reaches the equilibrium state with external water of an arbitrary salinity , is the relative partial molar Gibbs free energy of interlayer water in Na-montmorillonite in the equilibrium state with pure water , and is the relative partial molar Gibbs free energy of water in a solution (external water) of an arbitrary salinity .
The of water in an electrolyte solution can be calculated by the following relations [11,26].
where is the activity of water in the electrolyte solution.
In the case of Na-montmorillonite, the following empirical formula has been proposed for with the water content normalized by montmorillonite content as a parameter [11].
where is the error function.
In this paper, the density change of the buffer material by swelling is not considered. Therefore, in this paper, the correspondence between d and is assumed to exist. Since Equation (52) takes in pure water, the relationship between d and in pure water is used as a reference. The relationship between water content normalized by montmorillonite content and montmorillonite partial density is expressed by the following relation.
Using this relationship, is converted to . The relationship between montmorillonite partial density and the relative partial molar Gibbs free energy of interlayer water in Na-montmorillonite is shown in Table 3.
Table 3.
The relationship between montmorillonite partial density and the relative partial molar Gibbs free energy of interlayer water in Na-montmorillonite.
Based on Table 3, the calculation of the basal spacing d by the relative partial molar Gibbs free energy of interlayer water in Na-montmorillonite in the equilibrium state is conducted as follows.
Only for the calculation of , is fixed at . Figure 10 shows the basal spacing of montmorillonite in saline water. As shown in Figure 10, the higher the salinity becomes, the smaller the basal spacing becomes.
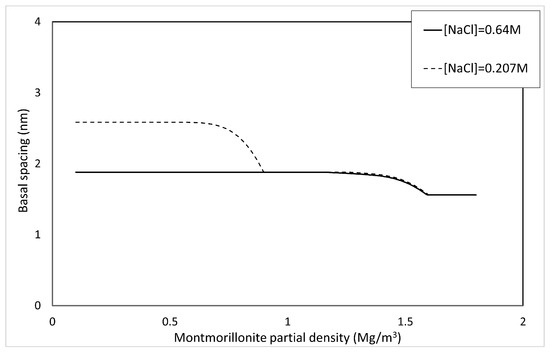
Figure 10.
Calculated results of basal spacing in saline water.
4.2.4. Prediction of Saturated Hydraulic Conductivity
The comparison between the calculated and measured [4,5,34,35] saturated hydraulic conductivities of the buffer material is explained here. Table 1 shows the type of bentonite used, its abbreviation, and the montmorillonite content. Since Kunigel OT9607 is the source ore of Kunigel V1, the montmorillonite content is assumed to be equal to that of Kunigel V1. Figure 11, Figure 12 and Figure 13 show the measured and predicted hydraulic conductivities of the Na-bentonite buffer material in pure water (distilled water/DW), artificial seawater (ASW) (NaCl concentration 0.64 M), and Horonobe groundwater (HoronobeGW) (NaCl concentration 0.207 M), respectively. The hydraulic conductivity is temperature dependent. Therefore, for the comparison of the measured and analyzed values, data are used for the measured values and values at are used for the analyzed values.
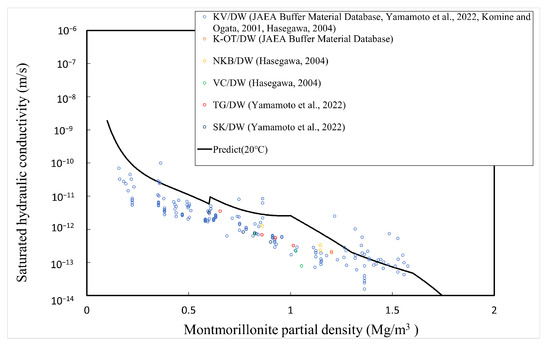
Figure 11.
Calculated and measured saturated hydraulic conductivities for pure water.
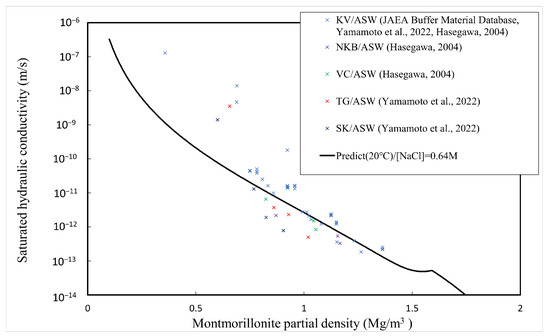
Figure 12.
Calculated and measured saturated hydraulic conductivities for artificial sea water.
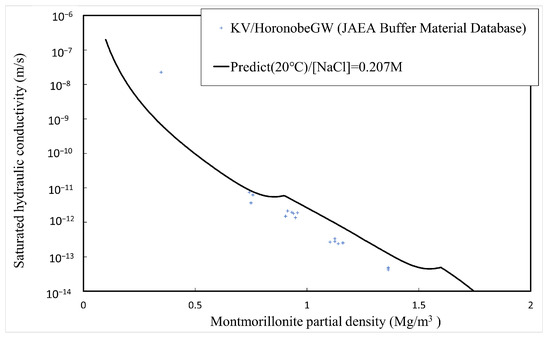
Figure 13.
Calculated and measured saturated hydraulic conductivities for Horonobe groundwater.
Figure 11, Figure 12 and Figure 13 show that the predicted values of hydraulic conductivity are slightly higher than the measured values for pure water and Horonobe groundwater on the whole, while, as shown in Figure 12 and Figure 13, under Horonobe groundwater and artificial seawater conditions, the predicted hydraulic conductivities are slightly smaller than the measured ones in the low-density region. Since there is not a large amount of measured data for hydraulic conductivity in the low-density region under saline water conditions in this comparison, it is necessary to verify the extent of the deviation from the analytical values using more data. However, in all cases, the predicted values are generally consistent with the measured values over the montmorillonite partial density.
5. Comparison with In Situ Test
5.1. Analytical Conditions
The validation of the proposed model is performed by comparison with the results of in situ tests conducted by JAEA at Horonobe, Hokkaido, Japan [17,18]. The data used are for approximately 1200 days from 00:00 on 2015/1/16 (water injection start date). The analytical conditions are summarized in the following Table 4. Under the experimental conditions, a play of a width of 2 cm is provided between the overpack and the buffer material [17]. This play will disappear due to the swelling of the buffer material. In this study, however, since swelling is not considered, the analytical conditions were set assuming no play. The ionic strength of the groundwater was calculated based on the concentration of NaCl.
Table 4.
Analytical conditions adapted to the Horonobe in situ test.
The thermal conductivity of saturated host rock and the specific heat of saturated host rock are calculated using the following empirical equations.
These empirical equations were obtained from the measured data (0–90 °C) at 250 m below the surface in the Horonobe HDB6 borehole [36].
For the dry density of the host rock , the following value was obtained at 350 m below the surface in the HDB 6 borehole [36].
The analysis was performed using the finite difference method with a time step width of 90 s and a spatial step width of 2 cm.
5.2. Results and Discussion
Comparisons between the measured and analyzed values for the degree of saturation and temperature distribution are shown in Figure 14 and Figure 15, respectively. The figures in parentheses in both figures represent the radial distance from the center of the waste body. The degree of saturation of the measured values was converted from the cyclometer measurements [15].
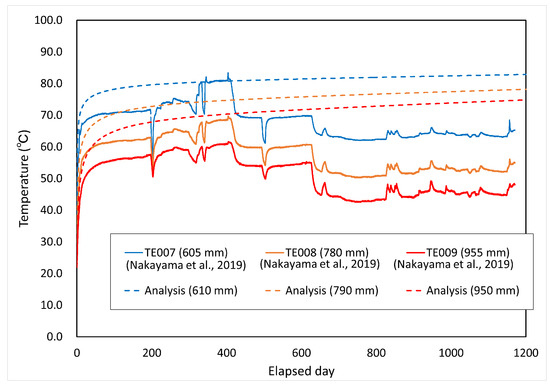
Figure 14.
Comparison between calculated and measured temperatures.
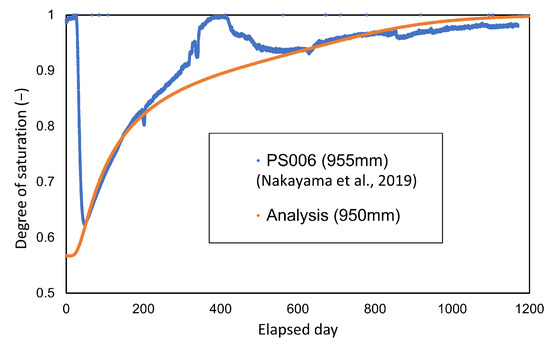
Figure 15.
Comparison between calculated and measured values in the degree of saturation.
Figure 14 shows that the comparison with the measured results of temperature is limited. In the analysis, although the surface temperature of the overpack was set at 90 °C, the measured values rose and significantly fell due to the changes in the temperature setting in the test, such as the effect of power outage. Therefore, this analysis does not reflect the changes in the temperature setting in the in situ test in the analytical conditions. This is assumed to be one of the causes of discrepancy from the measured values. The play between the overpack and the buffer material was not taken into account in the analytical conditions, and it can be assumed that the deviation from the measured values was large for the period up to 200 days because this play prevented heat from being transferred to the buffer material. In addition, the adiabatic condition was adopted as the boundary condition in this paper. Under these conditions, cooling by heat dissipation has not been considered. Therefore, it is necessary to consider the setting of the dissipation term (cooling term).
As shown in Figure 15, comparison with the change in the degree of saturation shows relatively a good agreement with the monitored data.
6. Conclusions
A T-H-C-coupled model for analyzing heat and moisture transfer in buffer materials was developed, focusing on montmorillonite content in bentonite. For the thermal properties, the modeling focused on the degree of saturation and the dry density of bentonite, since the dependence of the thermal properties on montmorillonite content was considered to be small. Hydraulic properties were modeled by separating two phases into gas–liquid and liquid–liquid and focusing on montmorillonite content for water vapor transfer and liquid water transfer, respectively. Matric potential and saturated hydraulic conductivity were modeled focusing on montmorillonite content. To predict the variation of saturated hydraulic conductivity with salinity, an argument based on Gibbs free energy is presented. The comparison between the analytical results from the proposed T-H-C-coupled model and the measured data indicates that this model is generally able to predict moisture transport.
Author Contributions
Conceptualization, K.O. and H.S.; methodology, K.O. and H.S.; software, K.O.; validation, K.O. and H.S.; formal analysis, K.O.; investigation, K.O. and H.S.; resources, K.O. and H.S.; writing—original draft preparation, K.O.; writing—review and editing, K.O. and H.S.; visualization, K.O.; supervision, H.S.; project administration, H.S.; funding acquisition, H.S. All authors have read and agreed to the published version of the manuscript.
Funding
This work was supported by JSPS KAKENHI Grant Number JP20K05383.
Institutional Review Board Statement
Not applicable.
Informed Consent Statement
Not applicable.
Data Availability Statement
The data presented in this study are available on request from the corresponding author due to the internal policy.
Conflicts of Interest
The authors declare no conflicts of interest.
References
- JNC. H12 Report Supporting Report 2 Repository Design and Engineering Technology; JNC TN1400 99-022; Technical Report; Japan Nuclear Cycle Development Institute: Tokai, Japan, 2000.
- Kikuchi, H.; Tanai, K.; Matsumoto, K.; Sato, H.; Ueno, K.; Tetsu, T. Hydraulic Characteristics of Buffer Material-II; The Influence Which Saline Water Exert on Hydraulic Properties of Bentonite Buffer Material; JNC TN8430 2003-002; Technical Report; Japan Nuclear Cycle Development Institute: Tokai, Japan, 2003.
- Kikuchi, H.; Tanai, K. Heat Physical Properties Examination of Buffer Material (III); JNC TN8430 2003-009; Technical Report; Japan Nuclear Cycle Development Institute: Tokai, Japan, 2003.
- Yamamoto, Y.; Goto, T.; Kitagawa, Y.; Watanabe, Y.; Yokoyama, S.; Shimbashi, M. Fundamental Engineering Properties of Compacted Japanese Bentonites and Bentonite-Sand Mixtures; NUMO-TR-21-02; Technical Report; NUMO: Tokyo, Japan, 2022. [Google Scholar]
- JAEA. Buffer Material Database. Available online: https://bufferdb.jaea.go.jp/bmdb/index_e.jsp (accessed on 26 December 2023).
- Takeuchi, S.; Hara, K.; Nakano, M. Water Retention Curve, Water Diffusivity and Water Movement of Compacted Bentonite. Soils Found. 1995, 35, 129–137. [Google Scholar] [CrossRef]
- Villar, M.; Gómez-Espina, R.; Gutiérrez-Nebot, L. Basal Spacings of Smectite in Compacted Bentonite. Appl. Clay Sci. 2012, 65–66, 95–105. [Google Scholar] [CrossRef]
- Suzuki, S.; Fujishima, A.; Ueno, K.; Ichikawa, Y.; Kawamura, K.; Fujii, N.; Shibata, M.; Sato, H.; Kitayama, K. Microstructural Modeling of Compacted Sodium-Bentonite and Application of Unified Molecular Dynamics/Homogenization Analysis for Diffusion Process. J. Clay Sci. Soc. Jpn. 2001, 41, 43–57. [Google Scholar] [CrossRef]
- Goto, T.; Gorai, M.; Kozaki, T.; Sato, S. Effect of Dry Density and Salinity on Cl- Diffusion of Compacted Na-Montmorillonite. In Proceedings of the Clays in Natural and Engineered Barriers for Radioactive Waste Confinement—4 International Meeting Book of Abstracts, Nantes, France, 29 March–1 April 2010; pp. 623–624. [Google Scholar]
- Suzuki, H.; Chijimatsu, M.; Fujita, T.; Nakano, M. Evaluation of Water Movement in Unsaturated Compacted Bentonite. Doboku Gakkai Ronbunshu 2002, 2002, 107–120. [Google Scholar] [CrossRef][Green Version]
- Sato, H. A Thermodynamic Analysis on the Effect of Salinity on Interlayer Space of Na-Montmorillonite. MRS Adv. 2016, 1, 4027–4033. [Google Scholar] [CrossRef]
- Ruan, K.; Fu, X.L. A Modified Kozeny–Carman Equation for Predicting Saturated Hydraulic Conductivity of Compacted Bentonite in Confined Condition. J. Rock Mech. Geotech. Eng. 2022, 14, 984–993. [Google Scholar] [CrossRef]
- Kobayashi, I.; Owada, H.; Ishii, T.; Iizuka, A. Evaluation of Specific Surface Area of Bentonite-Engineered Barriers for Kozeny-Carman Law. Soils Found. 2017, 57, 683–697. [Google Scholar] [CrossRef]
- Suzuki, H.; Nakama, S.; Fujita, T.; Imai, H.; Sazarashi, M. A Long-Term THMC Assessment on the Geochemical Behavior of the Bentonite Buffer. J. Nucl. Fuel Cycle Environ. 2012, 19, 39–50. [Google Scholar] [CrossRef]
- Suzuki, H.; Takayama, Y.; Sato, H.; Watahiki, T.; Sato, D. Assessment of the Infiltration Behaviour of Buffer Material in Seawater-Type Groundwater Environments Using a Coupled THMC Analysis Model (Contract Research); JAEA-Research 2022-013; Technical Report; Japan Atomic Energy Agency: Tokai, Japan, 2023. [CrossRef]
- Suzuki, H.; Takayama, Y. Impact Assessment of Density Change on the Buffer Material on the Coupled Thermal-Hydraulic and Mechanical (THM) Behavior in the Near-Field (Contract Research); JAEA-Research 2020-015; Technical Report; Japan Atomic Energy Agency: Tokai, Japan, 2020. [CrossRef]
- Nakayama, M.; Ono, H.; Nakayama, M.; Kobayashi, M. Collection of Measurement Data from In-situ Experiment for Performance Confirmation of Engineered Barrier System at Horonobe Underground Research Laboratory (until March, 2018); JAEA-Data/Code 2019-003; Technical Report; Japan Atomic Energy Agency: Tokai, Japan, 2019. [CrossRef]
- Nakayama, M. The In-Situ Experiment for Overpack Corrosion at Horonobe Underground Research Laboratory. Production and Setting Simulated Overpack, Buffer Material Blocks and Heater; JAEA-Technology 2018-006; Technical Report; Japan Atomic Energy Agency: Tokai, Japan, 2018. [CrossRef]
- Linstrom, P.J.; Mallard, W.G. NIST Chemistry WebBook, NIST Standard Reference Database Number 69; National Institute of Standards and Technology: Gaithersburg, MD, USA. Available online: https://webbook.nist.gov/chemistry/ (accessed on 25 March 2024).
- Komine, H.; Ogata, N. Evaluation for Swelling Characteristics of Buffer and Backfill Materials for High-Level Nuclear Waste Disposal—Influence of Sand-Bentonite Content and Cation Compositions in Bentonite-; U99013; Technical Report; CRIEPI: Tokyo, Japan, 1999. [Google Scholar]
- Philip, J.R.; De Vries, D.A. Moisture Movement in Porous Materials under Temperature Gradients. Eos Trans. Am. Geophys. Union 1957, 38, 222–232. [Google Scholar] [CrossRef]
- Suzuki, H.; Fujita, T. Unsaturated Hydraulic Property of Buffer Material; JNC TN8430 99-010; Technical Report; Japan Nuclear Cycle Development Institute: Tokai, Japan, 1999.
- Sakai, M.; Toride, N. Reviewing Classical Studies in Soil Physics “Moisture Movement in Porous Materials under Temperature Gradients” By J.R. Philip and D.A. de Vries Transactions, American Geophysical Union, Vol.38, No. 2, 222–232 (1957). J. Jpn. Soc. Soil Phys. 2006, 103, 105–112. [Google Scholar] [CrossRef]
- Teng, J.; Zhang, S.; Leng, W.; Sheng, D. Numerical Investigation on Vapor Transfer in Unsaturated Soil During Freezing. Jpn. Geotech. Soc. Spec. Publ. 2015, 1, 29–34. [Google Scholar] [CrossRef]
- Fujita, T. Study on Sealing Performance of Clay Plug for Geological Isposal of High-Level Radioactive Waste. Ph.D. Thesis, Saitama University, Saitama, Japan, 2008. [Google Scholar]
- Nihon-Kagakukai. Kagaku-Binran Kisohen II, 2nd ed.; Maruzen: Tokyo, Japan, 1975. [Google Scholar]
- Mualem, Y. A New Model for Predicting the Hydraulic Conductivity of Unsaturated Porous Media. Water Resour. Res. 1976, 12, 513–522. [Google Scholar] [CrossRef]
- Al-Shemmeri, T. Engineering Fluid Mechanics; Bookboon: London, UK, 2012. [Google Scholar]
- Sato, H.; Miyamoto, S. A Study on Diffusion and Migration of Lead in Compacted Bentonite; The Effects of Dry Density, Silica Sand Content and Temperature on Diffusion and Migration of Pb-210 in Sodium Bentonite; JNC TN8400 2001-018; Technical Report; Japan Nuclear Cycle Development Institute: Tokai, Japan, 2001.
- Kijima, T.; Sasagawa, T.; Sawaguchi, T.; Yamada, N. A Model for Estimating the Hydraulic Conductivity of Bentonite under Various Density Conditions. Hydrol. Res. 2022, 53, 1256–1270. [Google Scholar] [CrossRef]
- Komine, H. Role of Bentonite-Clay for High-Level Radioactive Wastes Disposal and Trend of Engineering Development. J. Clay Sci. Soc. Jpn. 2002, 41, 182–189. [Google Scholar] [CrossRef]
- Sato, K.; Murota, A. Experimental Study on the Absorbed Water for Micro-Seepage. Proc. Jpn. Soc. Civ. Eng. 1971, 1971, 67–75. [Google Scholar] [CrossRef] [PubMed]
- Suzuki, S. Study on Diffusion Behavior of Nuclide in Buftir Material; JNC TN8400 2002-006; Technical Report; Japan Nuclear Cycle Development Institute: Tokai, Japan, 2002.
- Komine, H.; Ogata, N. Hydraulic Properties of Buffer and Backfill Materials for High-Level Nuclear Waste Disposal; U00041; Technical Report; CRIEPI: Tokyo, Japan, 2001. [Google Scholar]
- Hasegawa, T. Investigation on the Effect of Seawater to Hydraulic Property and Wetting Process of Bentonite; N04005; Technical Report; CRIEPI: Tokyo, Japan, 2004. [Google Scholar]
- Yamamoto, T.; Shimo, M.; Fujiwara, Y.; Hattori, H.; Nago, M.; Tadokoro, T.; Nakagaki, S. HDB-6 Borehole Investigations in the Horonobe Underground Research Program; JNC TJ5400 2005-004; Technical Report; Japan Nuclear Cycle Development Institute: Tokai, Japan, 2004.
Disclaimer/Publisher’s Note: The statements, opinions and data contained in all publications are solely those of the individual author(s) and contributor(s) and not of MDPI and/or the editor(s). MDPI and/or the editor(s) disclaim responsibility for any injury to people or property resulting from any ideas, methods, instructions or products referred to in the content. |
© 2024 by the authors. Licensee MDPI, Basel, Switzerland. This article is an open access article distributed under the terms and conditions of the Creative Commons Attribution (CC BY) license (https://creativecommons.org/licenses/by/4.0/).