Article

Characteristics of Electrical Resistance Alteration during In Situ Leaching of Ion-Adsorption-Type Rare Earth Ore

School of Mines, China University of Mining and Technology, Xuzhou 221116, China
*
Authors to whom correspondence should be addressed.
Minerals 2024, 14(1), 92; https://doi.org/10.3390/min14010092
Submission received: 10 December 2023 / Revised: 28 December 2023 / Accepted: 3 January 2024 / Published: 13 January 2024
(This article belongs to the Section Mineral Processing and Extractive Metallurgy)

Abstract

:
The chemical reaction of ion-adsorption-type rare earth ore during the in situ leaching process is accompanied by ion migration and charge movement, making the leaching process electrochemical in nature. The chemical reaction rate plays an important role in the leaching rate of rare earth elements. In this work, electrochemical impedance spectroscopy (EIS) was used to reveal the characteristics of electrical resistance alterations and leaching rate of rare earth elements during in situ leaching. The equivalent circuit model of the leaching process was established, and two critical parameters of solution resistance Rs and charge transfer resistance Rt were analyzed to reflect the electrochemical characteristics. According to the characteristics of electrical resistance alteration, the leaching process was divided into four stages: wetting, reaction, equilibrium, and top water stage. The resistance parameters Rs and Rt decreased first and then increased during the leaching process. The maximum value of Rs was 1330 Ω∙cm2 at the end of the top water stage, and the minimum value was 125 Ω∙cm2 at the beginning of the equilibrium stage. The maximum value of Rt was 8310 Ω∙cm2 at the beginning of the leaching stage, and the minimum value was 21 Ω∙cm2 at the end of the reaction stage. Rs and Rt were negatively correlated with the pore size and chemical reaction rate during leaching. With an increasing pore size and reaction rate, the resistance parameters decrease. This study provides a new idea for the intelligent monitoring of rare earth ore.

1. Introduction

Rare earth elements (REEs), especially mid and heavy REEs, are essential in high-tech industries, such as renewable energy, national defense, and new materials preparation [1,2,3]. Owing to their special 4f electron layer structure, they can exhibit some unique optical, magnetic, and electrical properties [4,5]. Ion adsorption rare earth ores are rich in medium and heavy rare earth elements [6,7,8,9] and are strategic mineral resources [10,11]. The rare earth content of ionic rare earth ores is generally 0.05–0.2 wt.% REO [12]. It usually presents in four phases: water soluble phase, ion-exchanged phase, mineral phase, and colloidal sediment phase [13,14,15]. The ion-exchanged phase accounts for 60%–90% of the whole-phase rare earth [16,17], and the ion-exchangeable phase rare earth is adsorbed on the surface of clay minerals such as kaolin and mica in the form of hydrated cations or hydroxyl hydrated ions [18,19,20]. New effective methods are required for the extraction of these metal elements, including the inorganic salt leaching method, biological leaching method, mechanical activation-assisted leaching method, and so on [6,21,22].
The surface of the clay mineral is negatively charged and has a fixed surface electrostatic potential, which attracts counterions into the electrolyte solution to form a double electronic layers [23,24]. The ion-adsorption-type rare earth ore is mainly composed of clay minerals, which will attract rare earth ions in the natural environment, forming double electronic layers. The leaching process of ion-adsorbed rare earth is essentially a process of cation adsorption by the lixiviant, desorption of rare earth ions, and redevelopment of the double electronic layers on the clay surface [25]. The thickness of the double electronic layers is related to the valence number of ions in the leach solution, ion concentration, temperature, and pH [19,26]. An inorganic salt solution is used as the lixiviant, and rare earth elements are leached through ion exchange [27,28,29]. Ammonium sulfate is a widely used lixiviant for the ion adsorption of rare earth due to its advantages of high exchangeability of ammonium ions and low cost [18,30,31]. Ammonium ions in the lixiviant are exchanged with rare earth ions, and rare earth ions enter the leaching solution [32,33]. The equation for the ion exchange reaction that occurs during leaching is as follows (where s represents the solid phase; aq represents the liquid phase):
[Al4Si4O10(OH)8]m·nRE3+ (s) + 3nNH4+ (aq) ⇋ [Al4Si4O10(OH)8]m·[NH4+]3n (s) + nRE3+ (aq)
Clay mineral particles have an unbalanced charge on their surfaces and have a range of electrochemical properties [34], such as conductive properties of electrolyte and ion transport properties. The migration of ions and chemical reactions at the liquid–solid interface also trigger electrical phenomena during in situ leaching. Electrochemical impedance spectroscopy has been widely applied by scholars to investigate the mechanical properties of contaminated soil remediation, the corrosion behavior of cement materials, the mechanical properties of concrete materials, the microscopic pore structure of solid waste materials, and the hydration process of cement [35,36,37,38,39]. This method can reflect the chemical reactions and microstructural changes occurring within the substance under test and reveal the interfacial reactions between the conducting phases. Soil is a three-phase medium of solids, liquids, and gases that can be structured as an electrochemical system. Ion adsorption rare earth elements are clay minerals, and the EIS technique is equally applicable. Physical and chemical interactions between the leaching solution and the mineral particles occur during the leaching process of rare earth ore, which can be continuously monitored using EIS technology.
In this study, an electrochemical impedance test of the ammonium sulfate leaching process was carried out by combining previous studies on the EIS theory and its application by Macdonald J R [40], Meilun Shi [41], and Chunan Cao [42], as well as by referring to the studies on the electrochemical impedance change in clay and its influencing factors by Zhao [43], A. Elmelouky [44], and others. Combined with Nyquist and Bode diagrams and equivalent circuit element parameters, the electrochemical characterization of the whole leaching process was monitored. An equivalent circuit model applicable to the leaching process was established to explore the resistance change in the leaching process of rare earth ores, to reveal the charge migration law in the pore solution and at the solid–liquid interface, and to analyze the changing law of the pore structure and the chemical reaction in the leaching process. The electrical resistance variation characteristics of ion-adsorbed rare earth ore during the leaching process can reflect the rare earth leaching process and leaching efficiency, which can provide more ideas for the intelligent mining of rare earth ores, the optimization of leaching process, and improvements in leaching efficiency.

2. Materials and Methods

2.1. Test Materials

The raw materials were from an ionic rare earth mine in Dingnan County, Ganzhou City, Jiangxi Province, China. The water content of the rare earth ore was determined to be 11.2%. The particle size distribution of the raw ore is shown in Table 1.
Inductively Coupled Plasma Optical Emission Spectrometer (ICP-OES) was used to detect the rare earth content of different particle sizes. The rare earth ore sample was screened into different particle size ranges by sieve analysis. The detection of rare earth element content was carried out according to the rare earth industry standard [45]. The results are shown in Table 2.
As shown in Table 1 and Table 2, the proportion of mineral particles with a particle size of less than 1.43 mm is greater than 50%, indicating that the original ore has a finer particle size and a higher degree of weathering. Mineral particles below 0.15 mm in size have the highest rare earth content, accounting for 53.82% of the total rare earth and smaller-size mineral particles contain higher rare earth content.

2.2. Test Methods

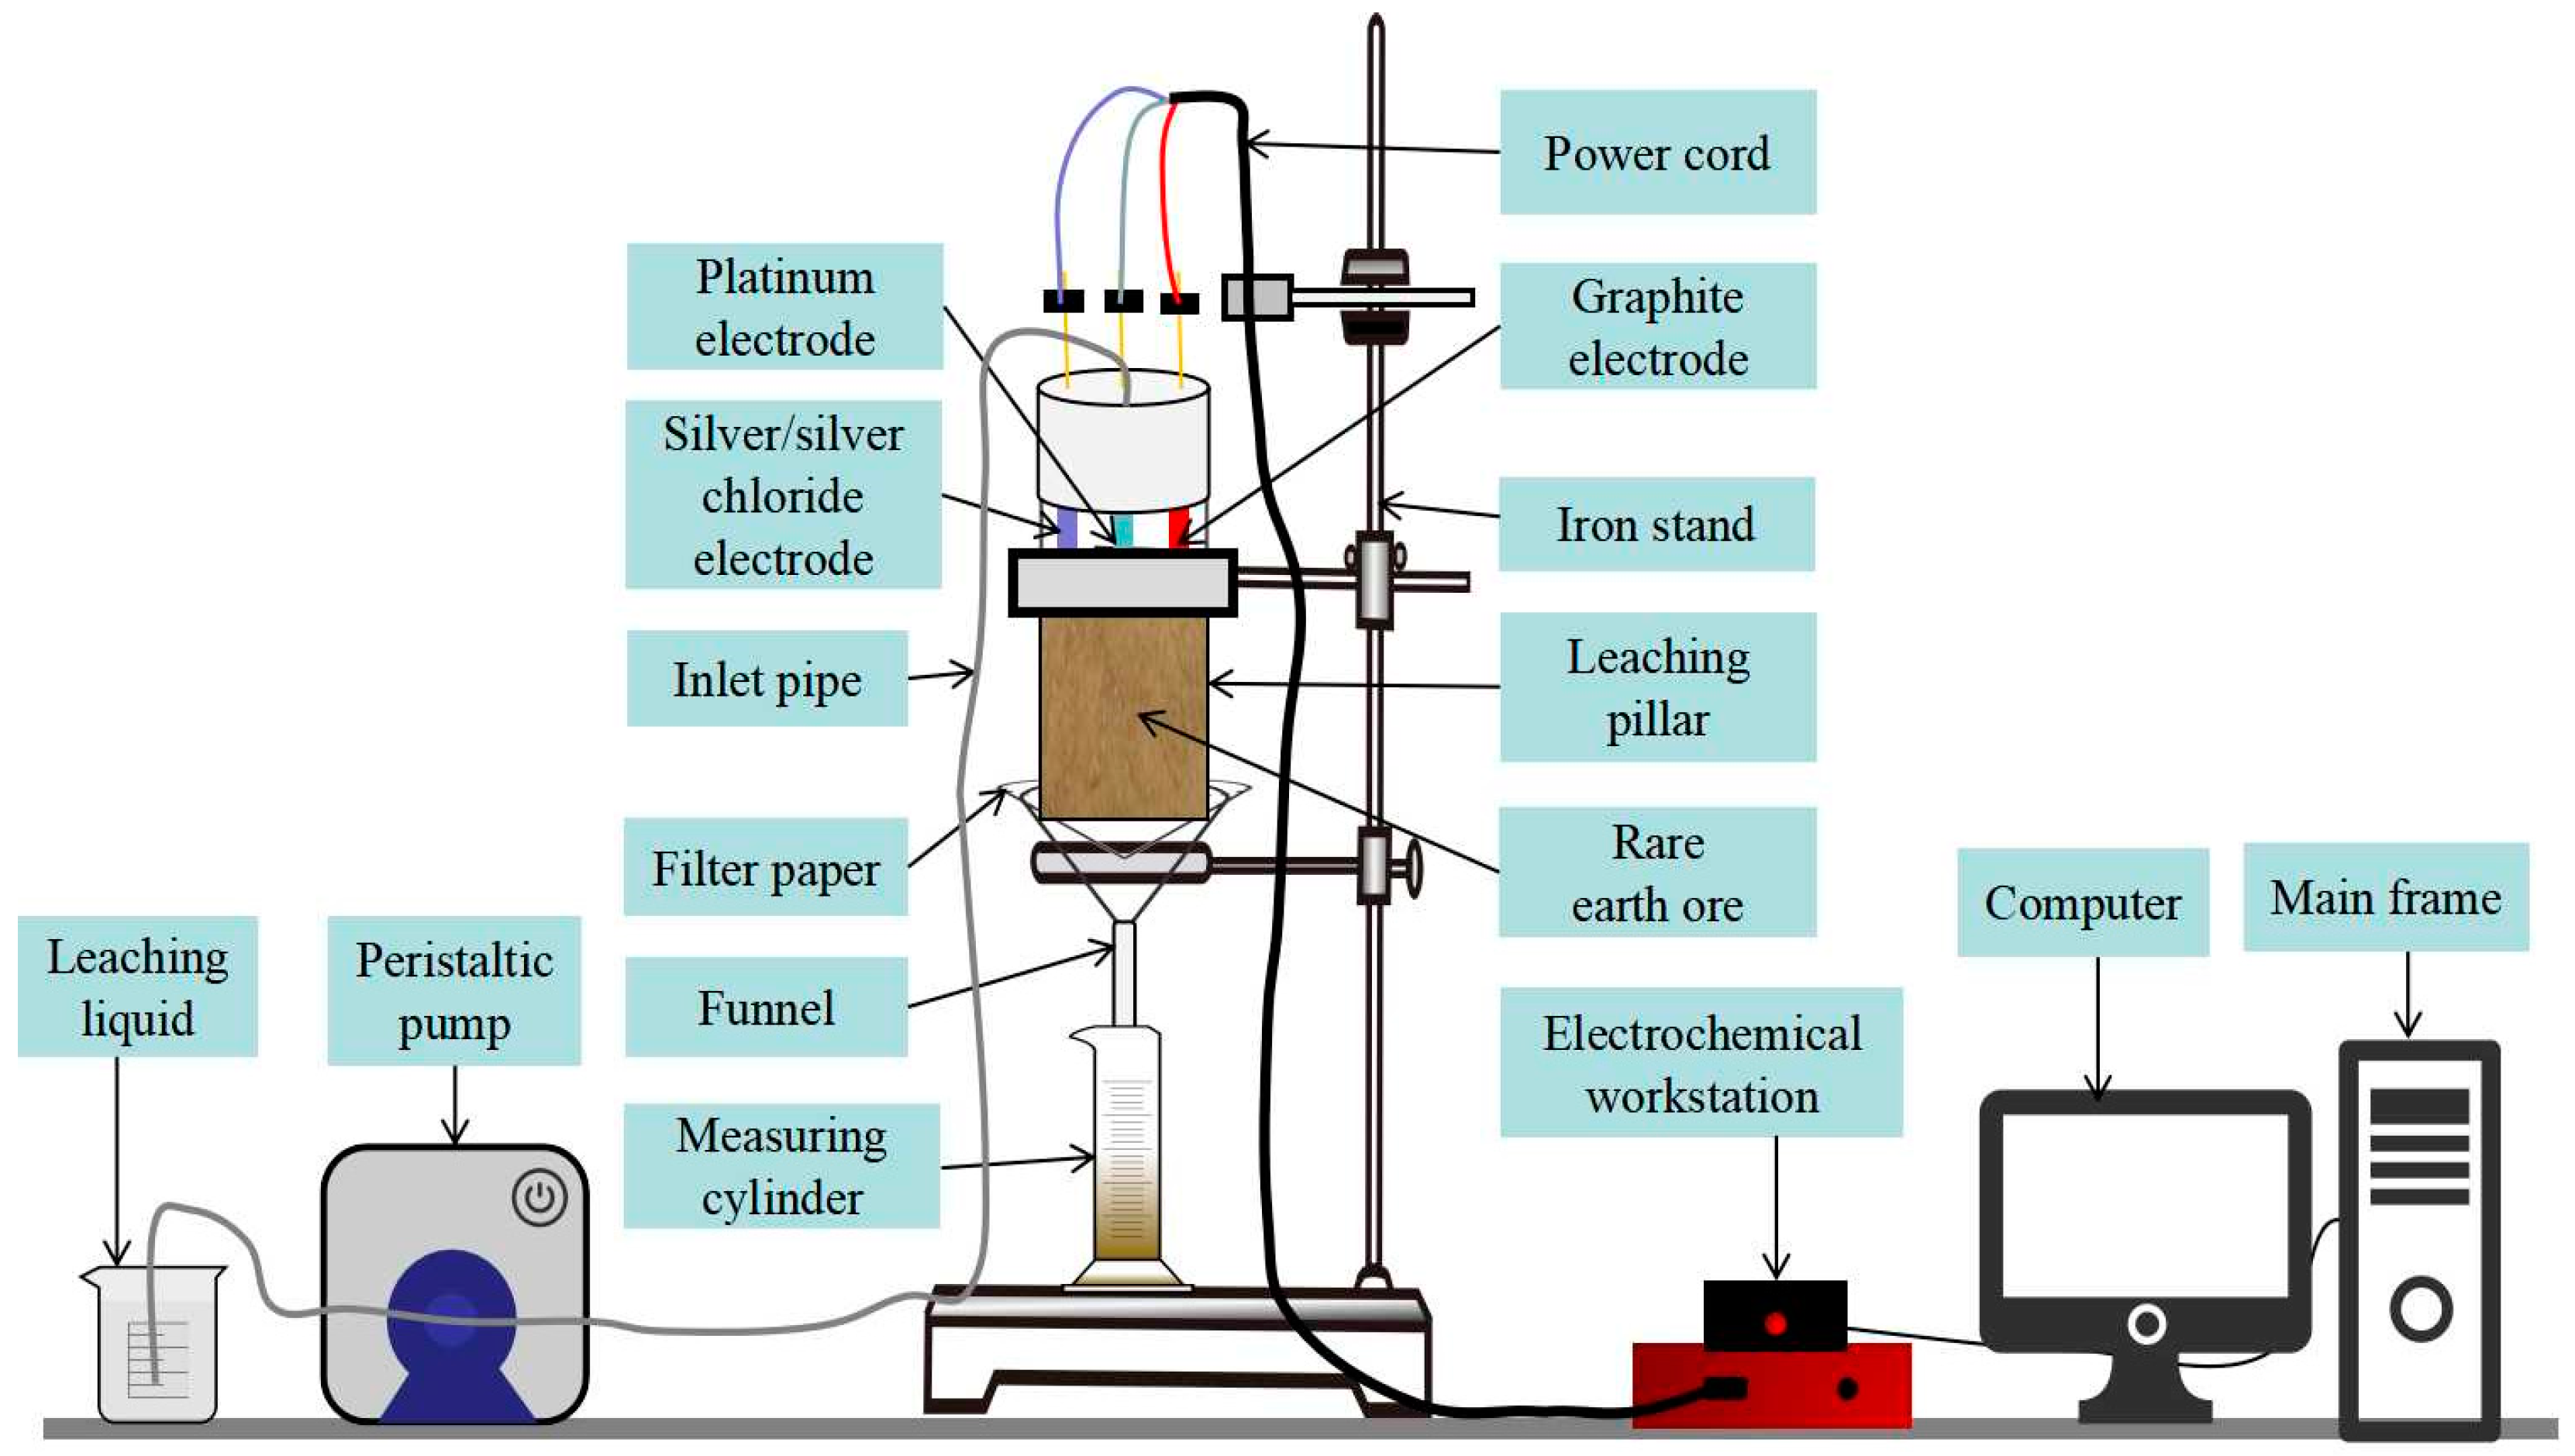
2.2.1. Column Immersion Test

Ionic rare earth in situ leaching simulation tests were conducted using ammonium sulfate solution as lixiviant. Some rare earth ore samples were weighed and dried at 100 °C for 12 h. Then, 200 g of dried rare earth ore samples was weighed, mixed thoroughly, and added to a leaching column of Φ 59 mm × 90 mm. A filter paper was placed above the samples, and a test electrode was fixed into the rare earth ore samples. A funnel and a collecting cylinder were placed below the column, with filter paper inside the funnel. Ammonium sulfate was used as the lixiviant, with a concentration of 0.1 mg/mL, a flow rate of 1.5 mL/min, a solid–liquid ratio of 1:2, pH = 4, and ambient temperature.

2.2.2. Electrochemical Impedance Spectroscopy Tests

Electrochemical impedance spectroscopy is a method of electrochemical measurements in which the sinusoidal potential (or current) of a certain amplitude is used as a perturbation signal, resulting in an approximately linear relationship between the perturbation and the system’s response. EIS testing was performed throughout the column leach test using the admiral squidstat series of electrochemical instrument (Squidstat plus, Admiral Instruments, Tempe, AZ, USA). The leach solution was collected at regular intervals. The parameters of the rare earth leaching process were set as follows: AC sinusoidal signal amplitude of 10 mV, test frequency of 10−2–106 Hz, and three-electrode method, with the working electrode being a graphite electrode, the auxiliary electrode being a platinum electrode, and the reference electrode being an Ag/AgCl electrode. The Nyquist and Bode plots obtained from the test were fitted and analyzed using Zahner Analysis software (version3.1.0, ZAHNER-elektrik1. Zahner-Schiller GmbH & Co.KG, Kronach–Gundelsdorf, Thuringen, Germany) to obtain the electrochemical component parameters of the ionic rare earth during the in situ leaching process. Figure 1 shows the test instrument in this study.

3. Equivalent Circuit Model

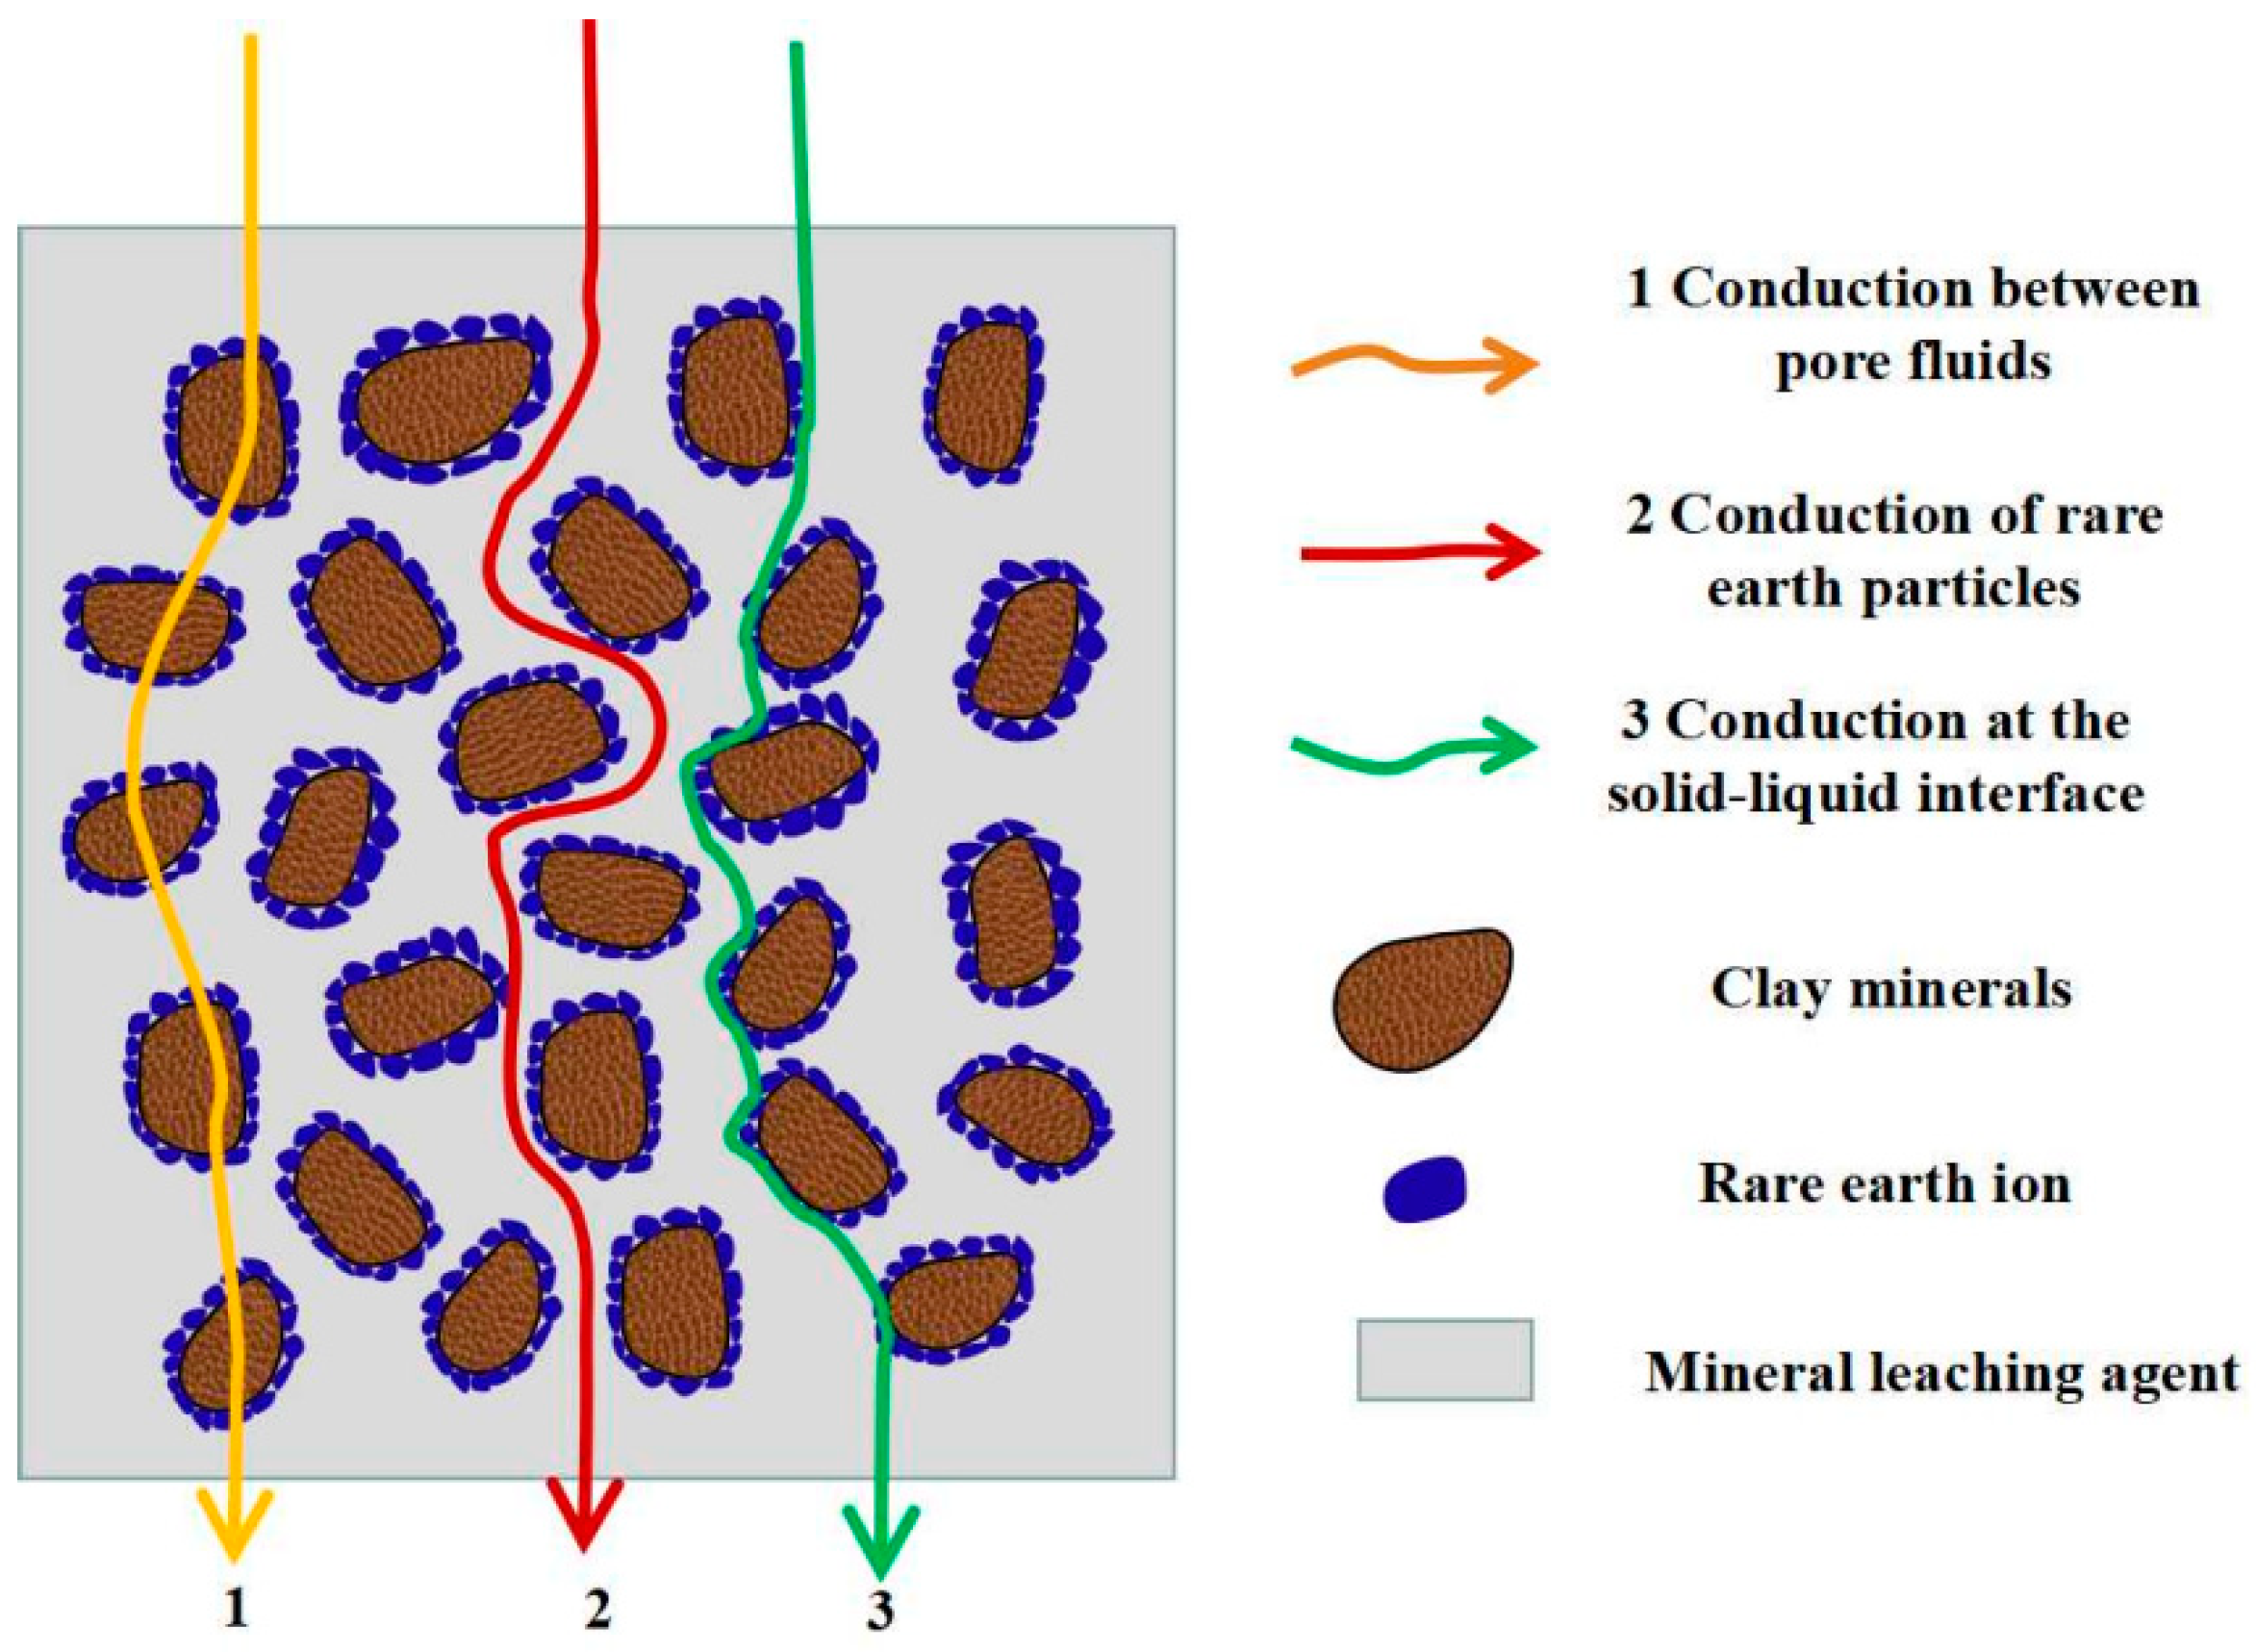
3.1. Analysis of Conductive Pathways

The ionic rare earth in situ leaching process includes three media: solid, liquid, and gas. The internal conductive path of the ore body mainly includes the conduction of the rare earth particles, the conduction between the particle pore liquid, and the conduction between the rare earth particles and the solid–liquid interface of the pore liquid [46,47]. The conductive path is shown in Figure 2.
Among the three conductive paths, the first conduction is rare earth particles. Since they contain a certain amount of water and exist in the natural electrolyte solution for a long time, they are electrically conductive. However, the conductivity of the rare earth particles is minimal and can be ignored due to the limited water content and electrolyte solution concentration. The second type is the pore liquid conductivity in the in situ leaching process, which is mainly induced by the ion exchange reaction. The displacement reaction between pore liquid cations and rare earth cations leads to the migration of ions in pore liquid. The third type of solid–liquid interface conductivity is mainly caused by ion exchange reactions. The second and third conductive effects are interrelated and interdependent, resulting from the ions in the pore liquid and the surface of rare earth particles having always existed in the physical and chemical reactions in the effective reaction stage of in situ leaching. The ions in the pore liquid enter the solid–liquid interface through the ion exchange reaction and eventually migrate to the surface of the rare earth particles.

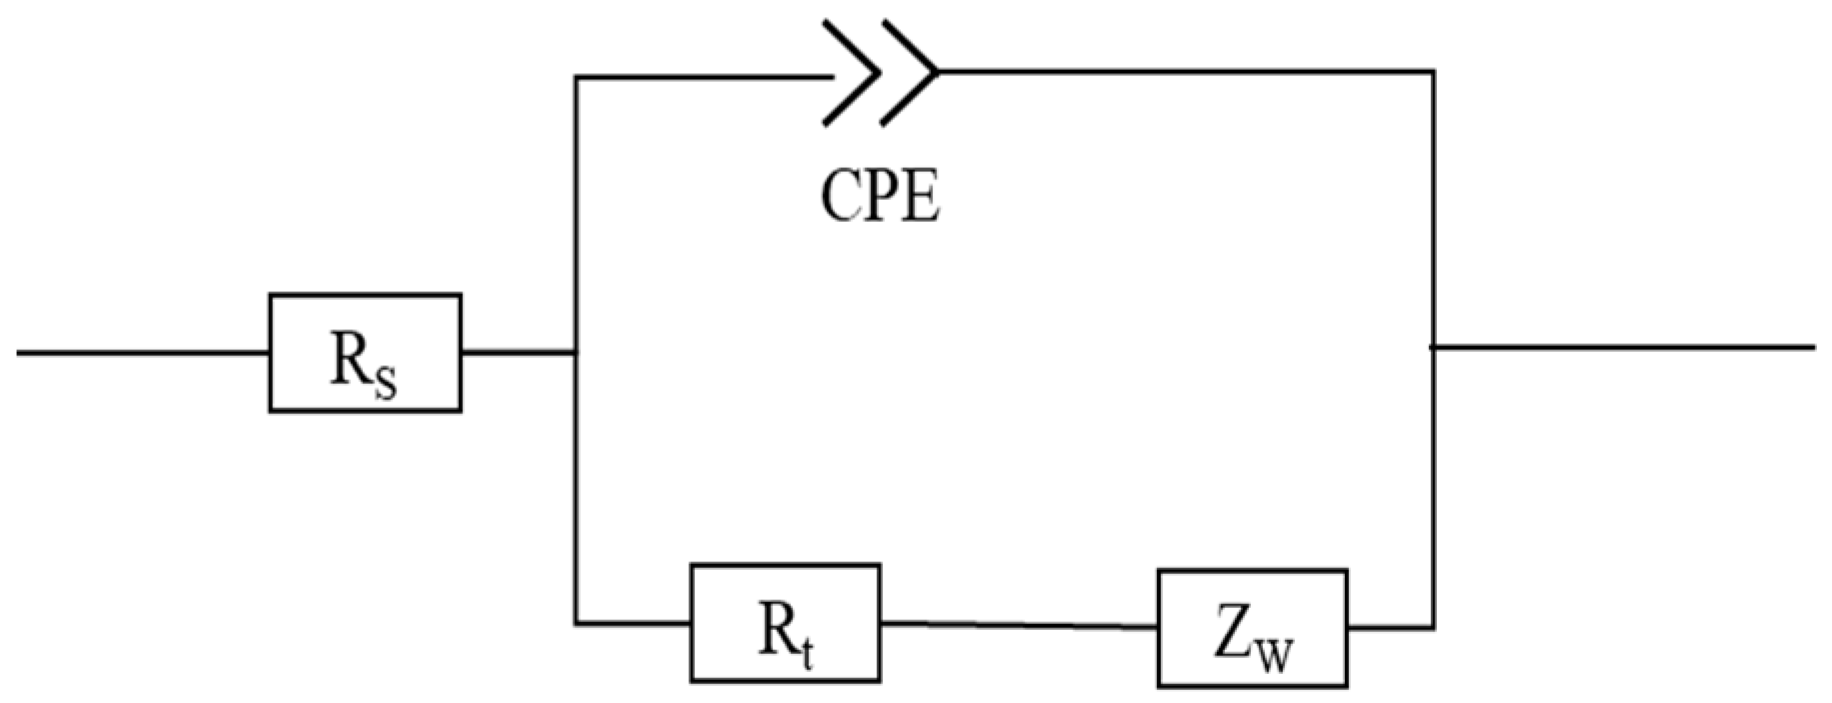
3.2. Equivalent Circuit Model

An equivalent electrical circuit consists of continuously connected elements such as resistance, capacitance, and inductance. The method is called the equivalent circuit method when the frequency response properties of the test material are the same as the electrical circuit described above. The equivalent circuit method can test the AC impedance spectrum because different electrochemical components have different frequency response times under the same current passage conditions. Resistive elements have the fastest response to current compared to other elements, and the capacitor can be considered a wire when the frequency is high. No electrochemical transfer occurs because it takes time for the ions to diffuse from the beginning of their movement. Therefore, the low-frequency region is controlled by the diffusion process.
In electrochemical reactions, there are two simultaneous processes: The first is a non-faraday process involving charging and discharging of the double electronic layers capacitance when electrode potential is changed. The second is a faraday process involving charge transfer and diffusion at a certain electrode potential, which is represented by the series connection of Rt and Zw. These two processes are represented by a parallel circuit, and there is a “dispersion effect” in the equivalent circuit fitting process. Due to the inhomogeneity of the electrode surface, the double electronic layers capacitance is not a constant but a value that changes with frequency, and this phenomenon of capacitance change with frequency is called the dispersion effect. The dispersion effect reflects the instability of the parameters, and the constant phase angle element CPE is used to represent the double electronic layers capacitance to avoid this phenomenon. In the present study, based on the two processes of electrochemical reaction and leaching mechanism of ion adsorption rare earth, the equivalent circuit of circuit elements was established as a quasi-Randles model based on the Randles model [48], as shown in Figure 3.
In Figure 3, Rs is the solution resistance, indicating the conductivity of the pore solution. Rt is the charge transfer resistance, reflecting the ease of charge transfer. Zw is the diffusion impedance, indicating the impedance of the reactants diffusing from the solution to the reaction surface of the electrode. CPE is the constant phase-angle element, which indicates the double electronic layers at the interface between the electrode and the solution, equivalent to a capacitor.
Figure 4 shows a Nyquist diagram of the equivalent circuit model. The high-frequency region shows a circular arc, which is controlled by the dynamics. The low-frequency region shows a slash at an angle of 45° to the real axis, which is controlled by material transfer (diffusion control). The curve intercept to the real axis in the high-frequency region is Rs, the diameter of the semicircle in the high-frequency region is Rt, and the intercept of the slanting line in the low-frequency region on the real axis is σ. The diameter of the impedance arc is deflected downward by an angle φ relative to the real axis, which is called the dispersion angle. The CPE is represented by two parameters, CPE-T and CPE-P, in which CPE-T denotes the charged amount of the double electronic layers and the capacitance of its diffusion layer and CPE-P is a parameter related to the diffusion angle ϕ, where ϕ is expressed as:
ϕ = π(1 − CPE-P)/2
Zw is the diffusion impedance, which can be expressed by the diffusion coefficient:
Zw = σω3−1/2 (1 − j)
where σ is the diffusion coefficient, (Ω·cm2)/s1/2, ω3 is the angular frequency, and j is an imaginary unit.

4. Results and Analysis

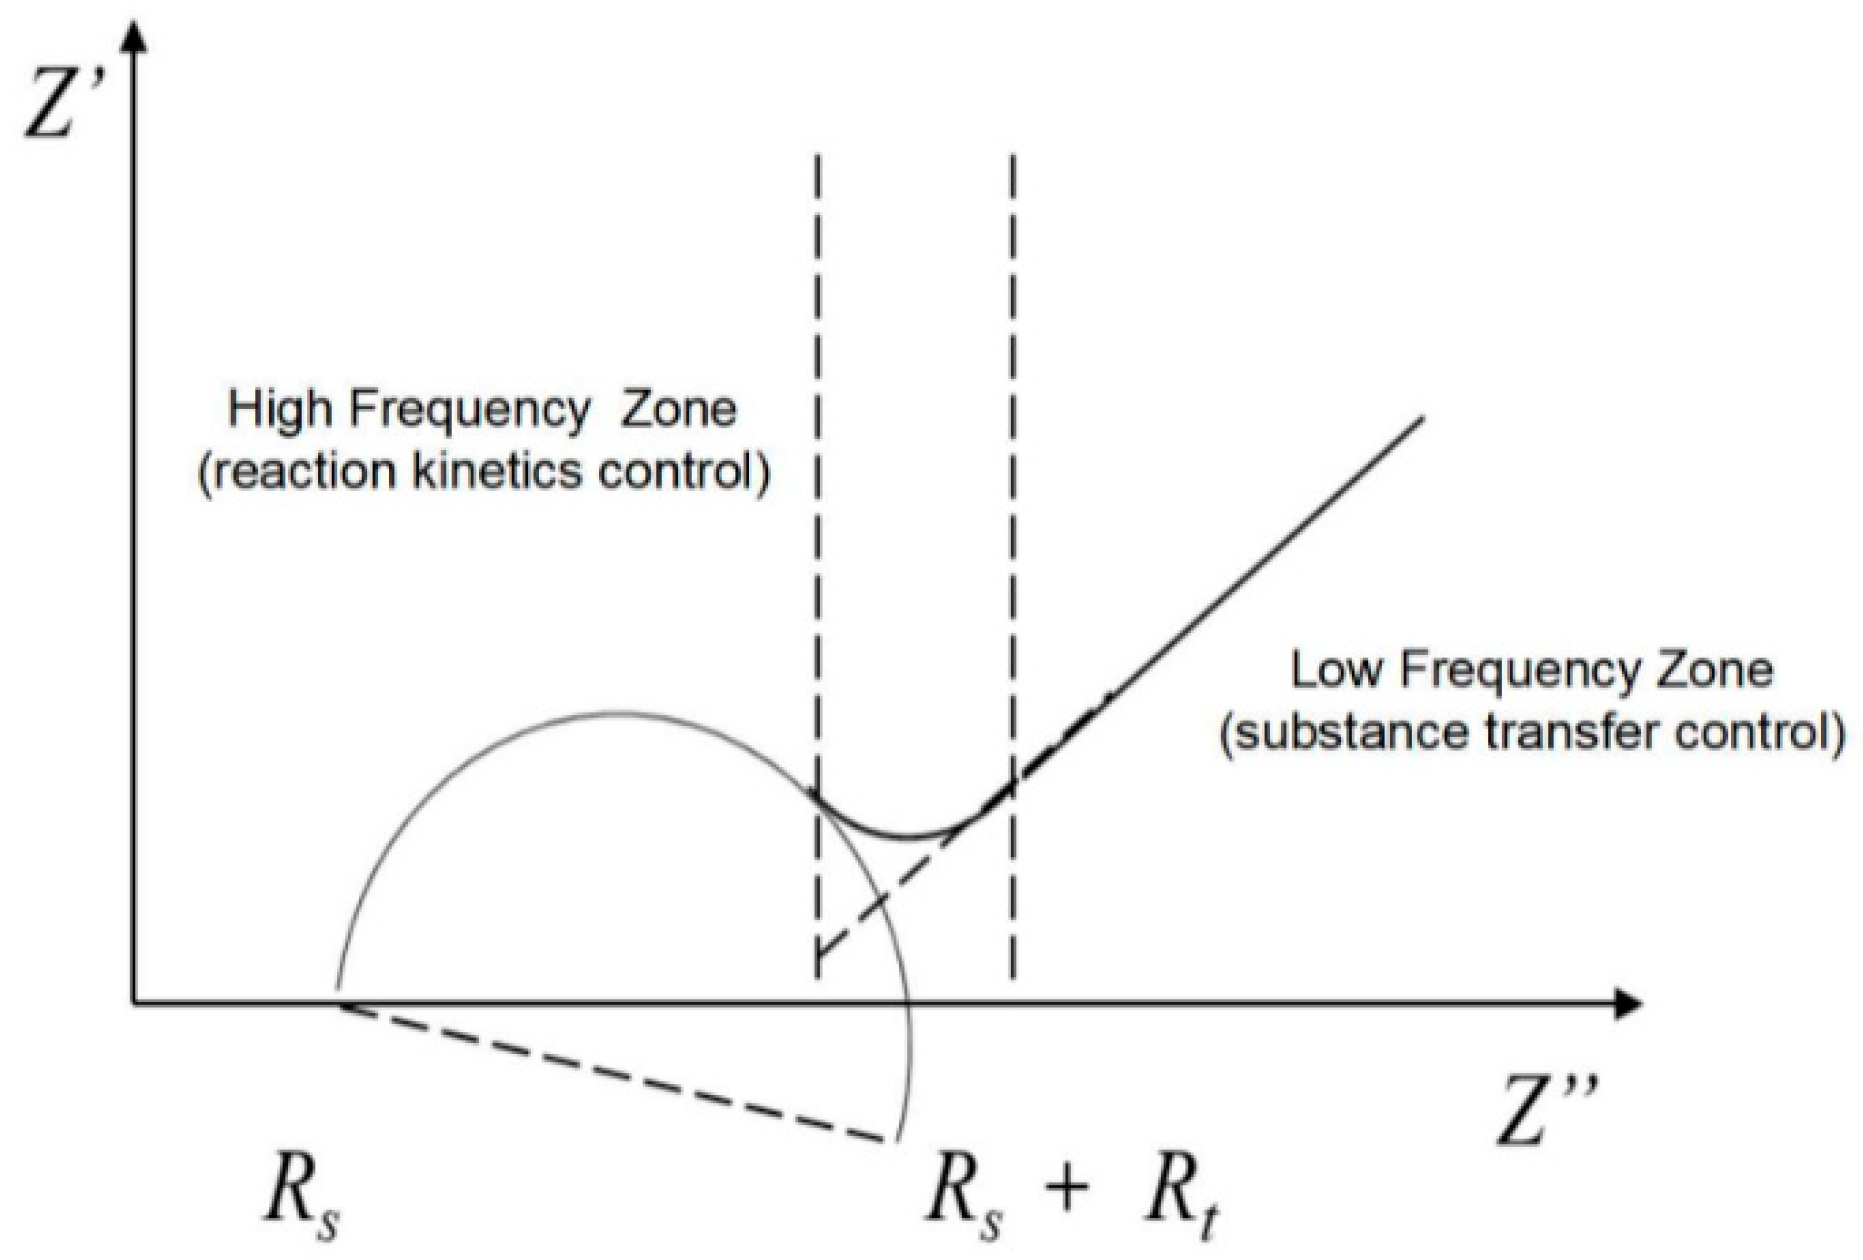
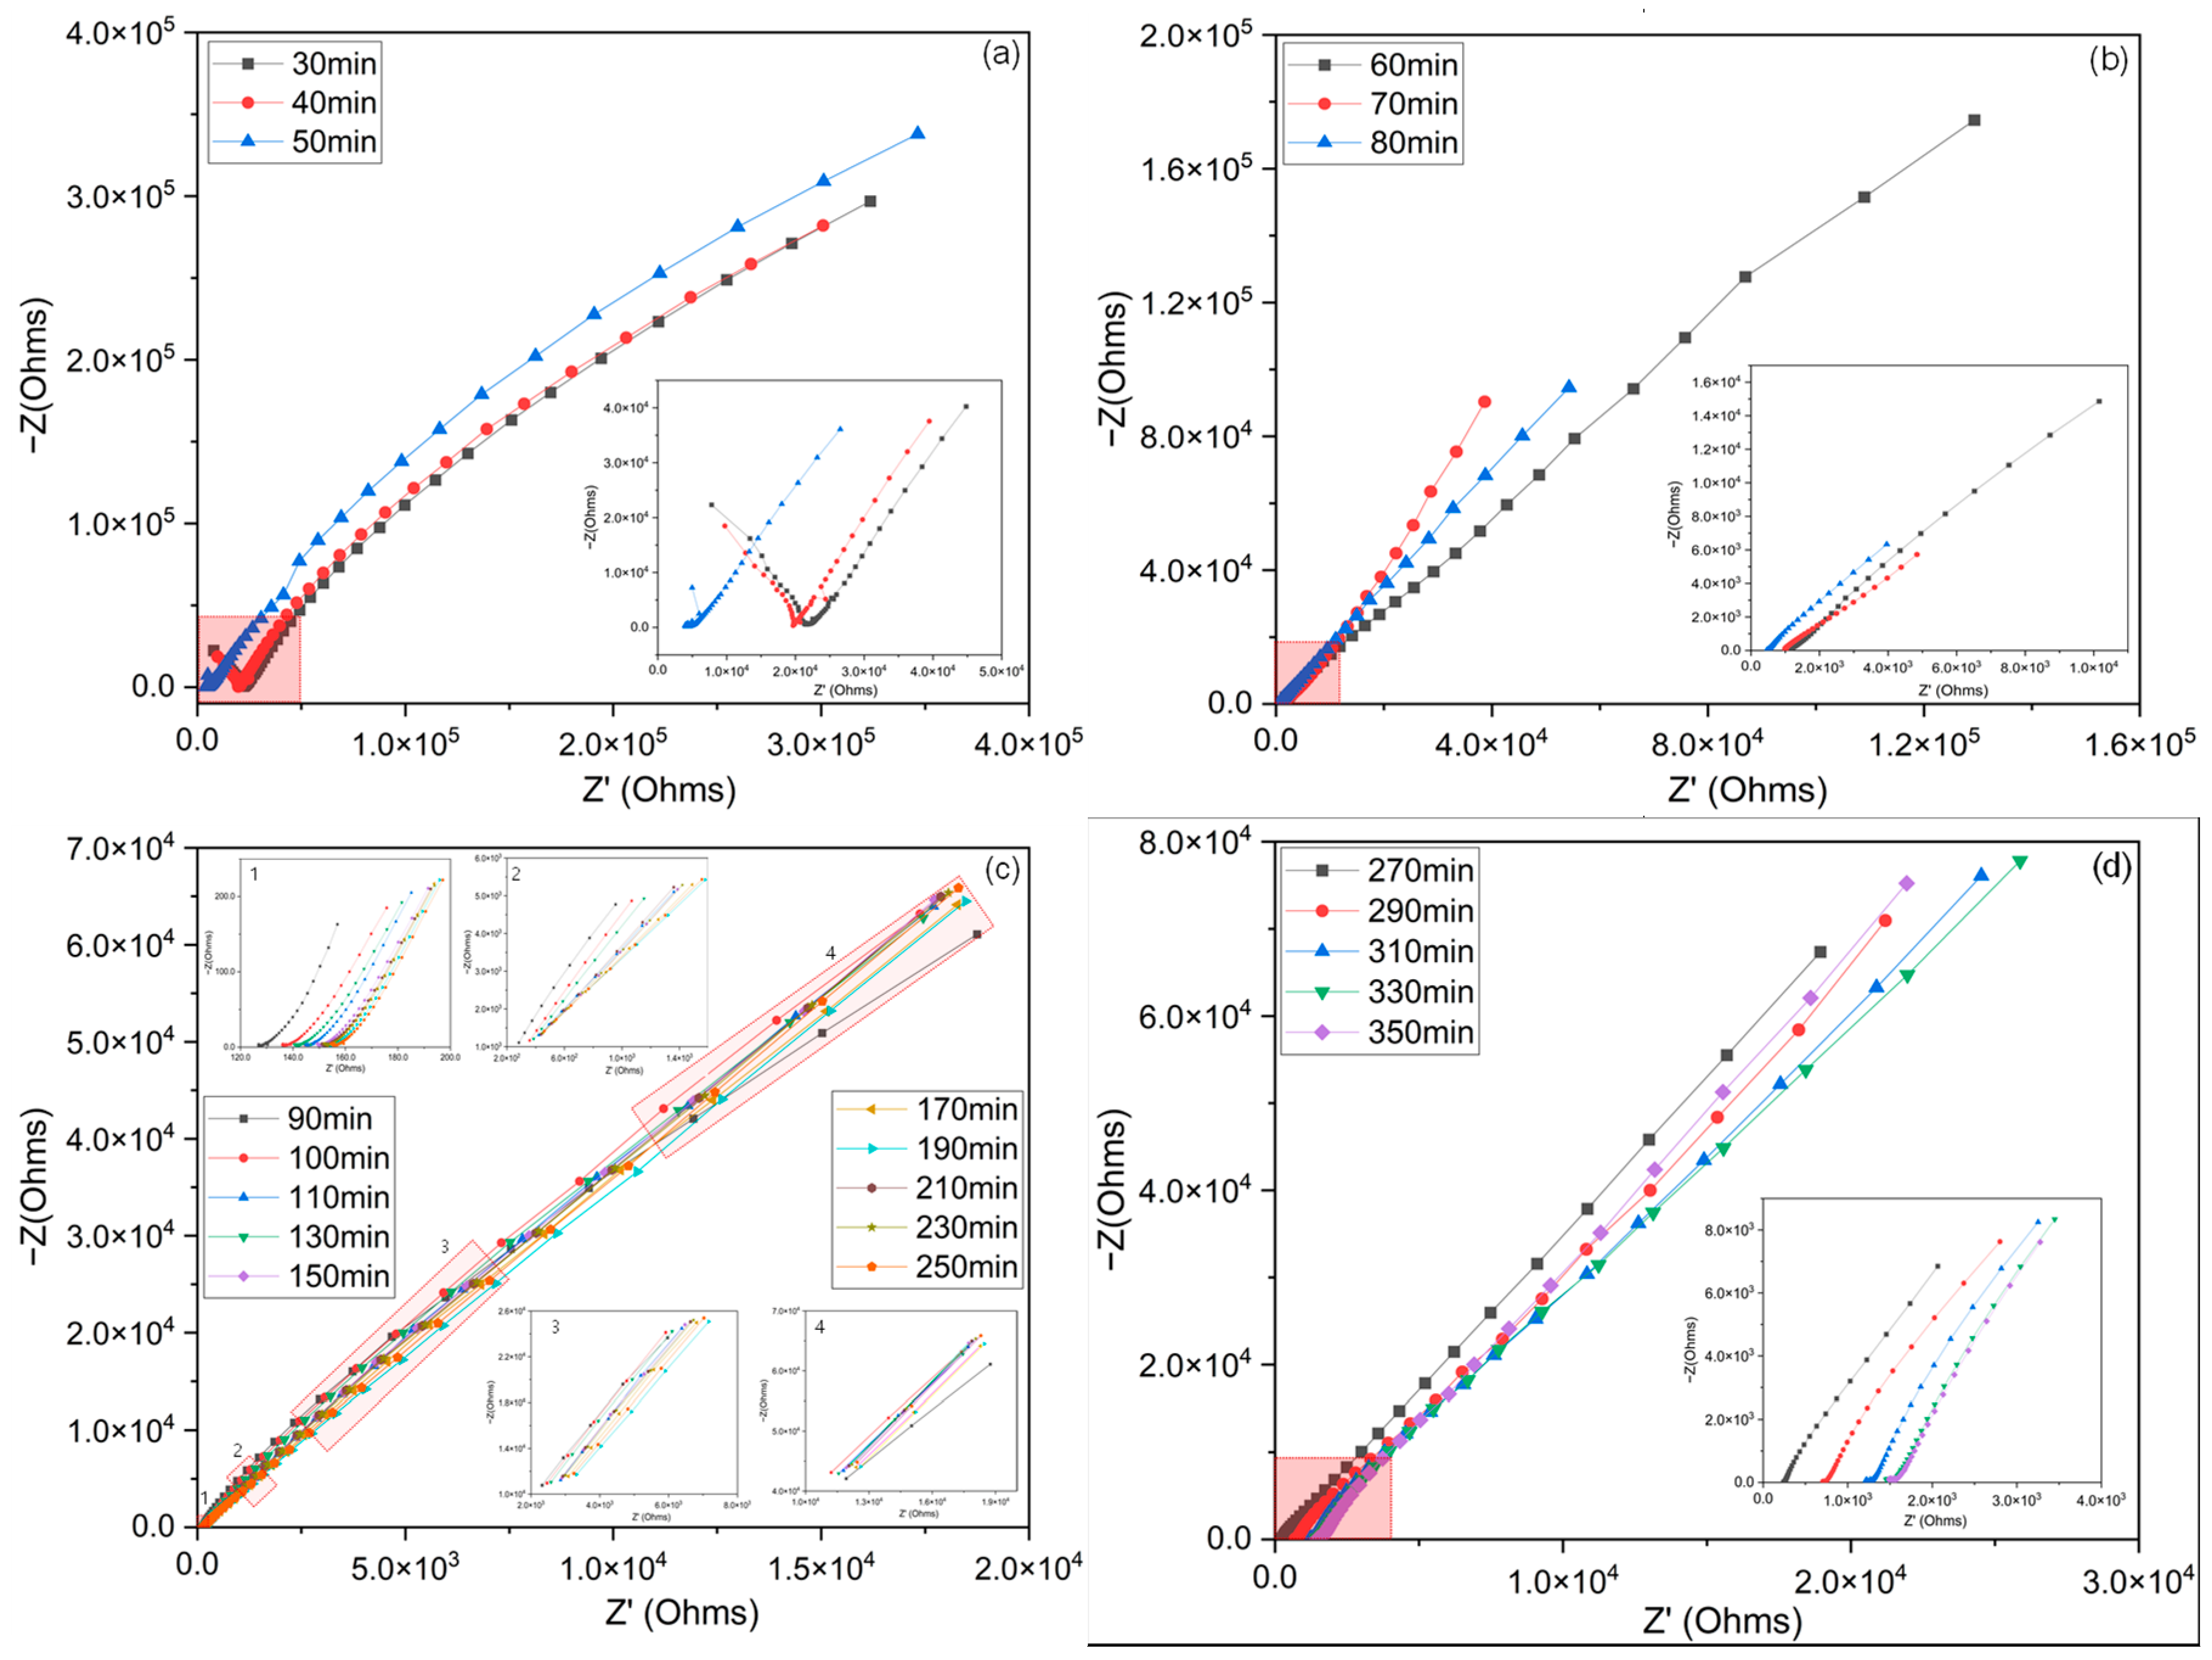
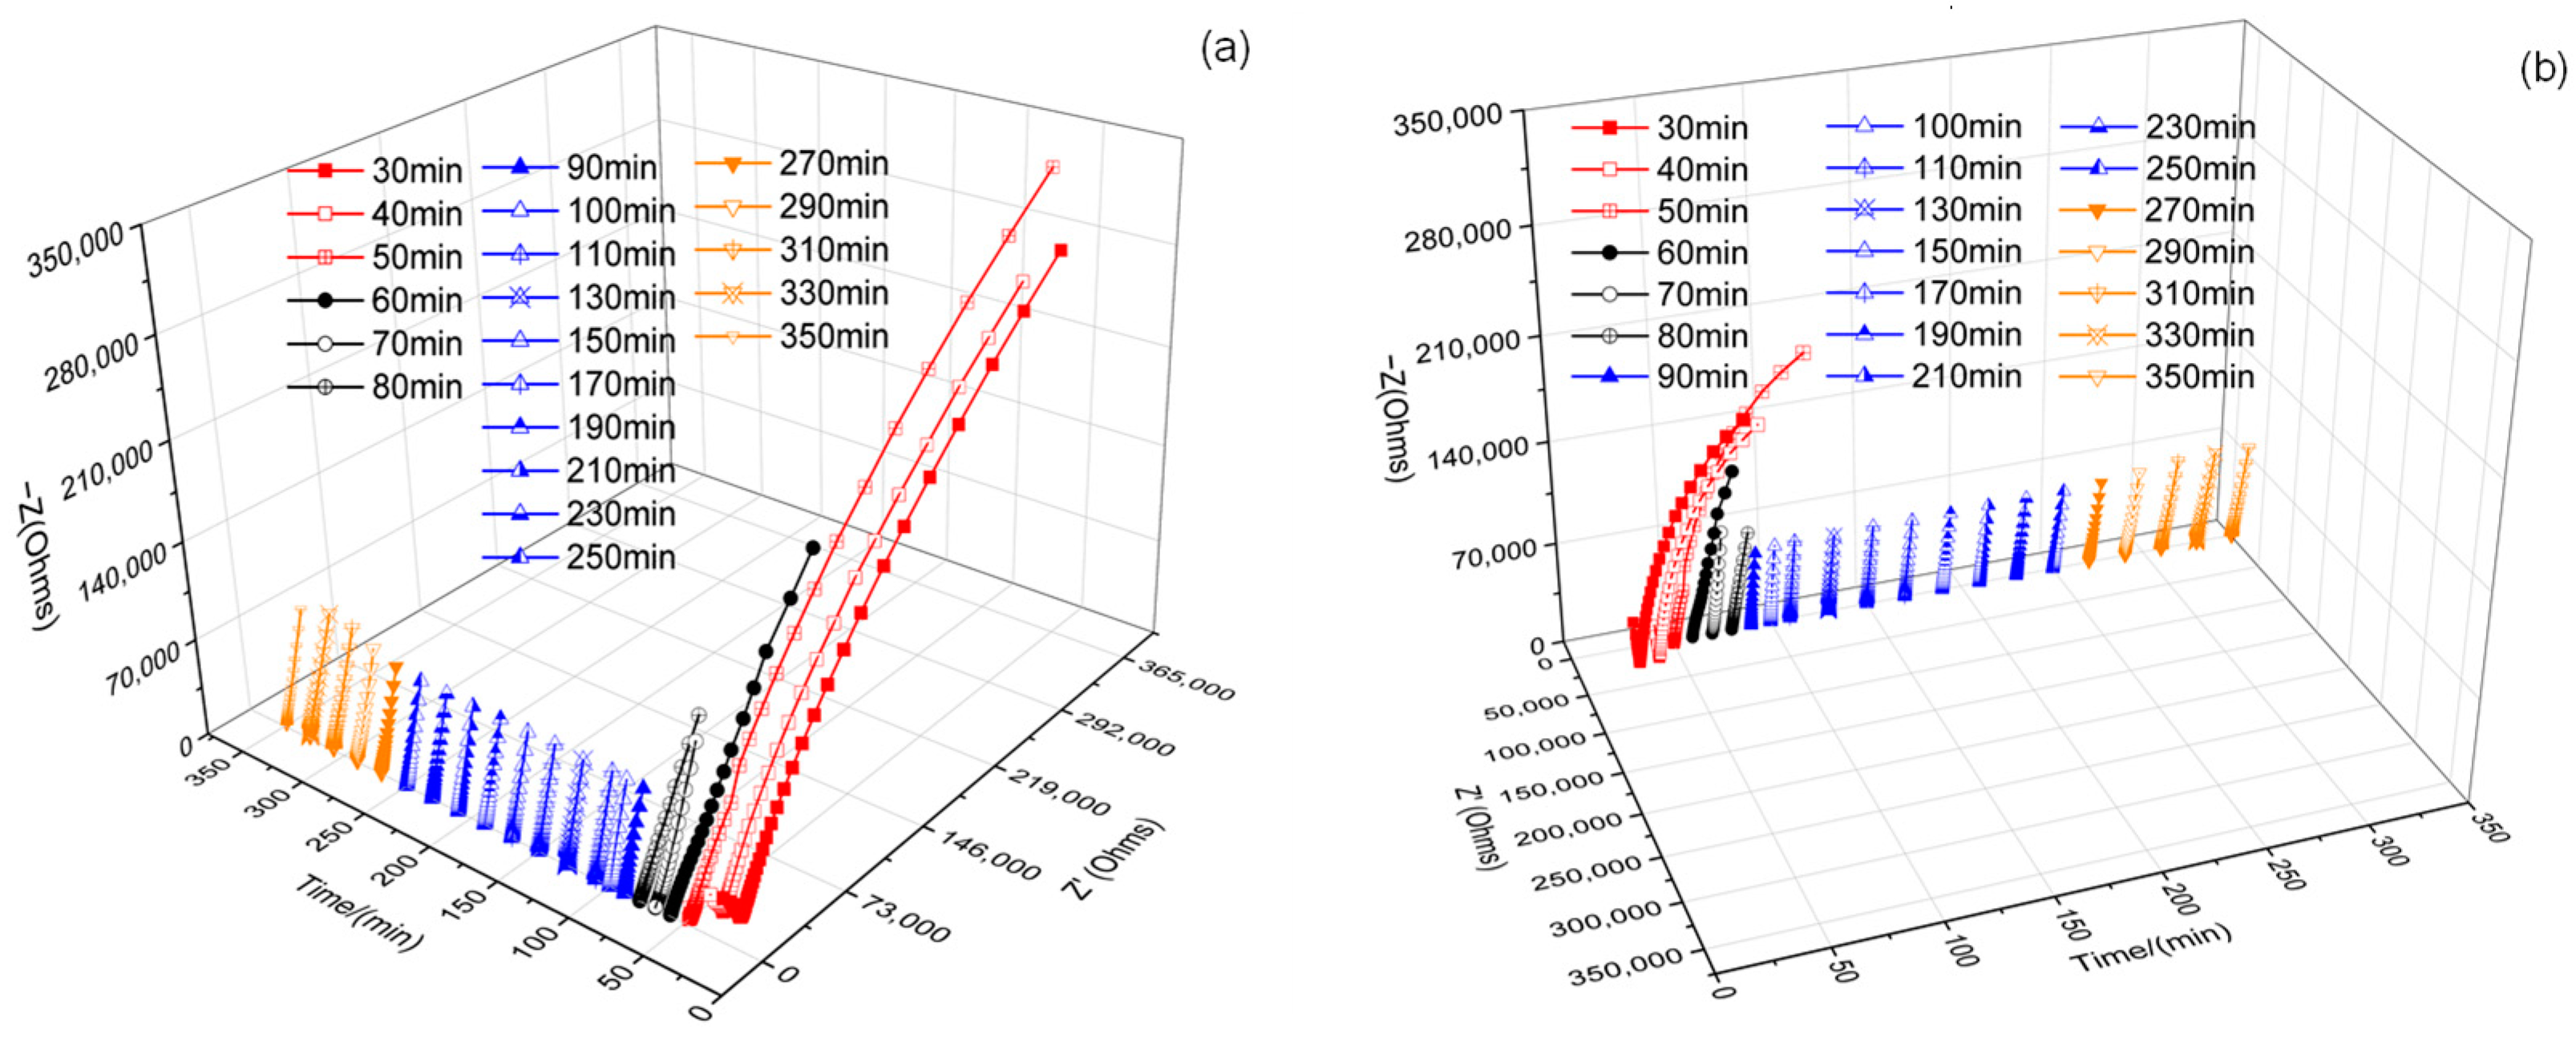
4.1. Nyquist Plot Analysis

Figure 5 shows a three-dimensional diagram of the AC impedance spectrum of the whole leaching process of ion adsorption rare earth using ammonium sulfate leaching. In order to facilitate the study and comparative analysis, the whole leaching process was divided into four stages, including the wetting stage (30–50 min), reaction stage (50–80 min), equilibrium stage (80–250 min), and top water stage (250–350 min). This was according to the reaction time, reaction phenomenon, and impedance value change in the reaction process. Among them, the wetting stage refers to the process from the beginning of the ore body to the leaching fluid outflow. The reaction stage refers to the process from the beginning of the leaching solution to the significant change in impedance. The equilibrium stage refers to the process in which the impedance value is relatively stable. In the top water stage, the leaching solution was finished, and deionized water was added to flush the ore body until the end.
As shown in Figure 6, the Nyquist curve was composed of the capacitance reactance arc in the high-frequency region (greater than 1000 Hz) and the inclined straight line in the low-frequency region (less than 1 Hz), which conformed to the quasi-Randles model. It was found that the capacitive reactance arc and the slope of the line changed significantly in the wetting stage, reaction stage, and top water stage, while it changed very little in the equilibrium stage. The capacitive reactance arc radius and the capacitive reactance arc intercept to the real axis in the wetting and reaction stages decreased with the increases in reaction and reaction time, indicating that the solution and charge transfer resistance in the two stages decreased. In the wetting and equilibrium stage, the slope of the straight line and the straight-line intercept to the real axis decreased, indicating that the diffusion coefficient σ decreased. The diffusion coefficient was proportional to the resistance, and the resistance decreased continuously.
It can be inferred that in the wetting stage and the reaction stage, the ion concentration in the pore liquid kept increasing, and the ion exchange reaction at the solid–liquid interface kept increasing. The diffusion rate of ions in the pore liquid of the orebody became faster and faster, and the ion concentration difference at the solid–liquid interface became larger and larger, which was conducive to the diffusion.
In the equilibrium stage, the impedance amplitude changed very little, and the capacitive reactance arc radius was small. The capacitive reactance arc intercept to the real axis and the intercept of a line to the real axis did not change significantly, indicating that the resistance value changed very little. The ion exchange reaction tended to be stable, and the resistance at the top water stage increased significantly. The capacitive reactance arc radius and the capacitive reactance intercept to the real axis increased with time. The linear intercept to the real axis increased, the diffusion coefficient σ increased, and the resistance increased. The results indicated that the ion concentration decreased, and the ion exchange reaction intensity decreased significantly with the addition of deionized water.
The four stages of the leaching process shown in Figure 6 were compared and analyzed. In general, it seemed that the trends of the Nyquist plots at different time stages were basically the same, but some regular changes occurred in some of the curves. The radius of the arc in the high-frequency zone changed significantly, first decreasing and then increasing with the leaching process, and the minimum value appeared in the equilibrium stage, which indicated that the charge transfer resistance in the equilibrium stage appeared to be the minimum value. The intercept between the curve and the Z′ axis in the low-frequency region decreased and then increased, and a minimum value occurred at the equilibrium stage, indicating that a minimum value of the solution resistance occurred.

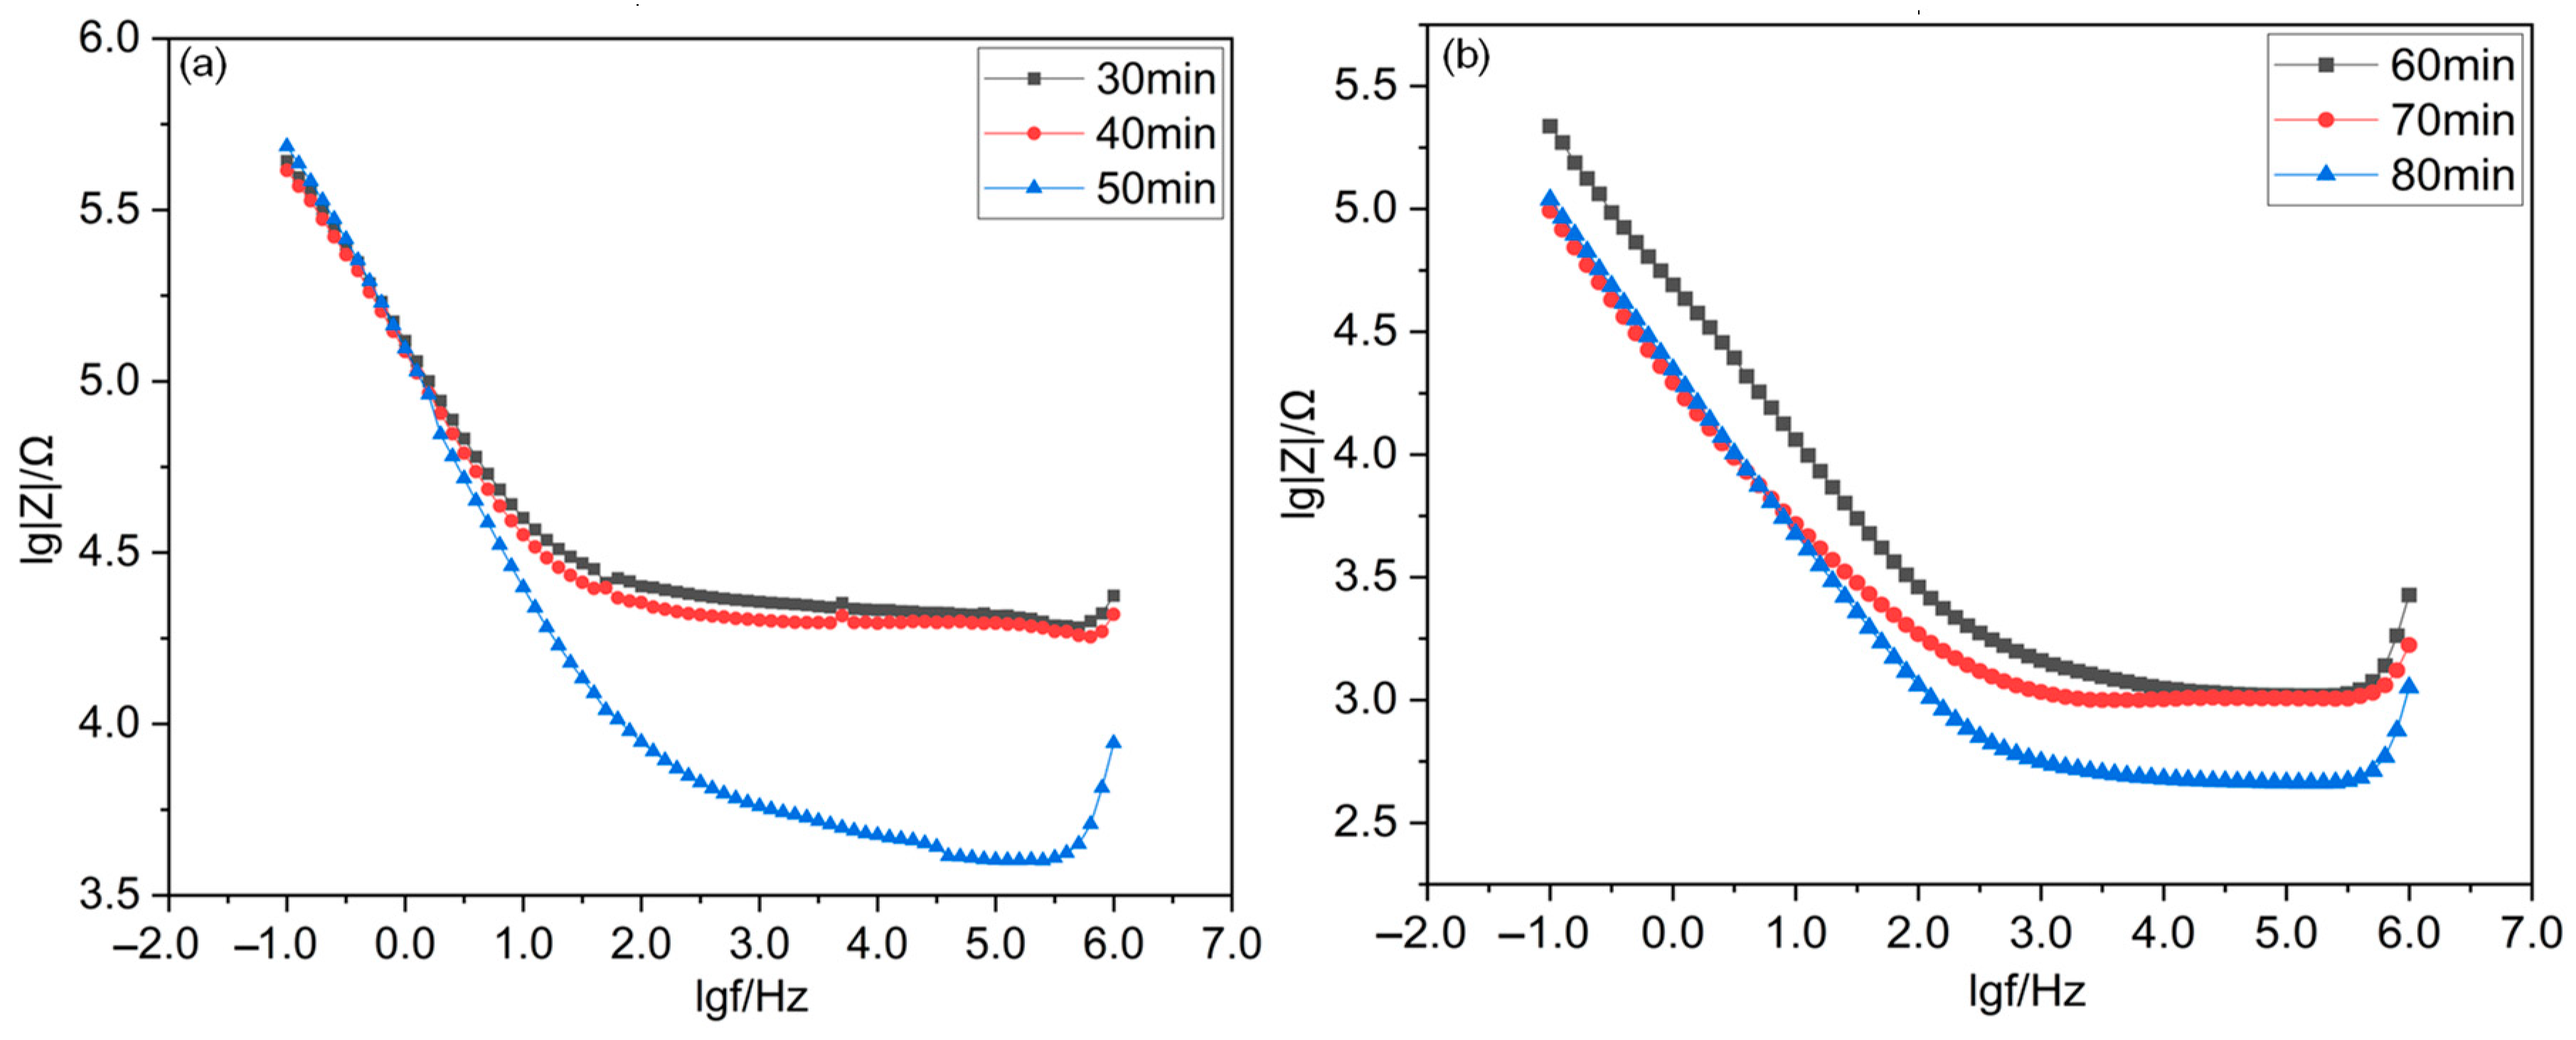
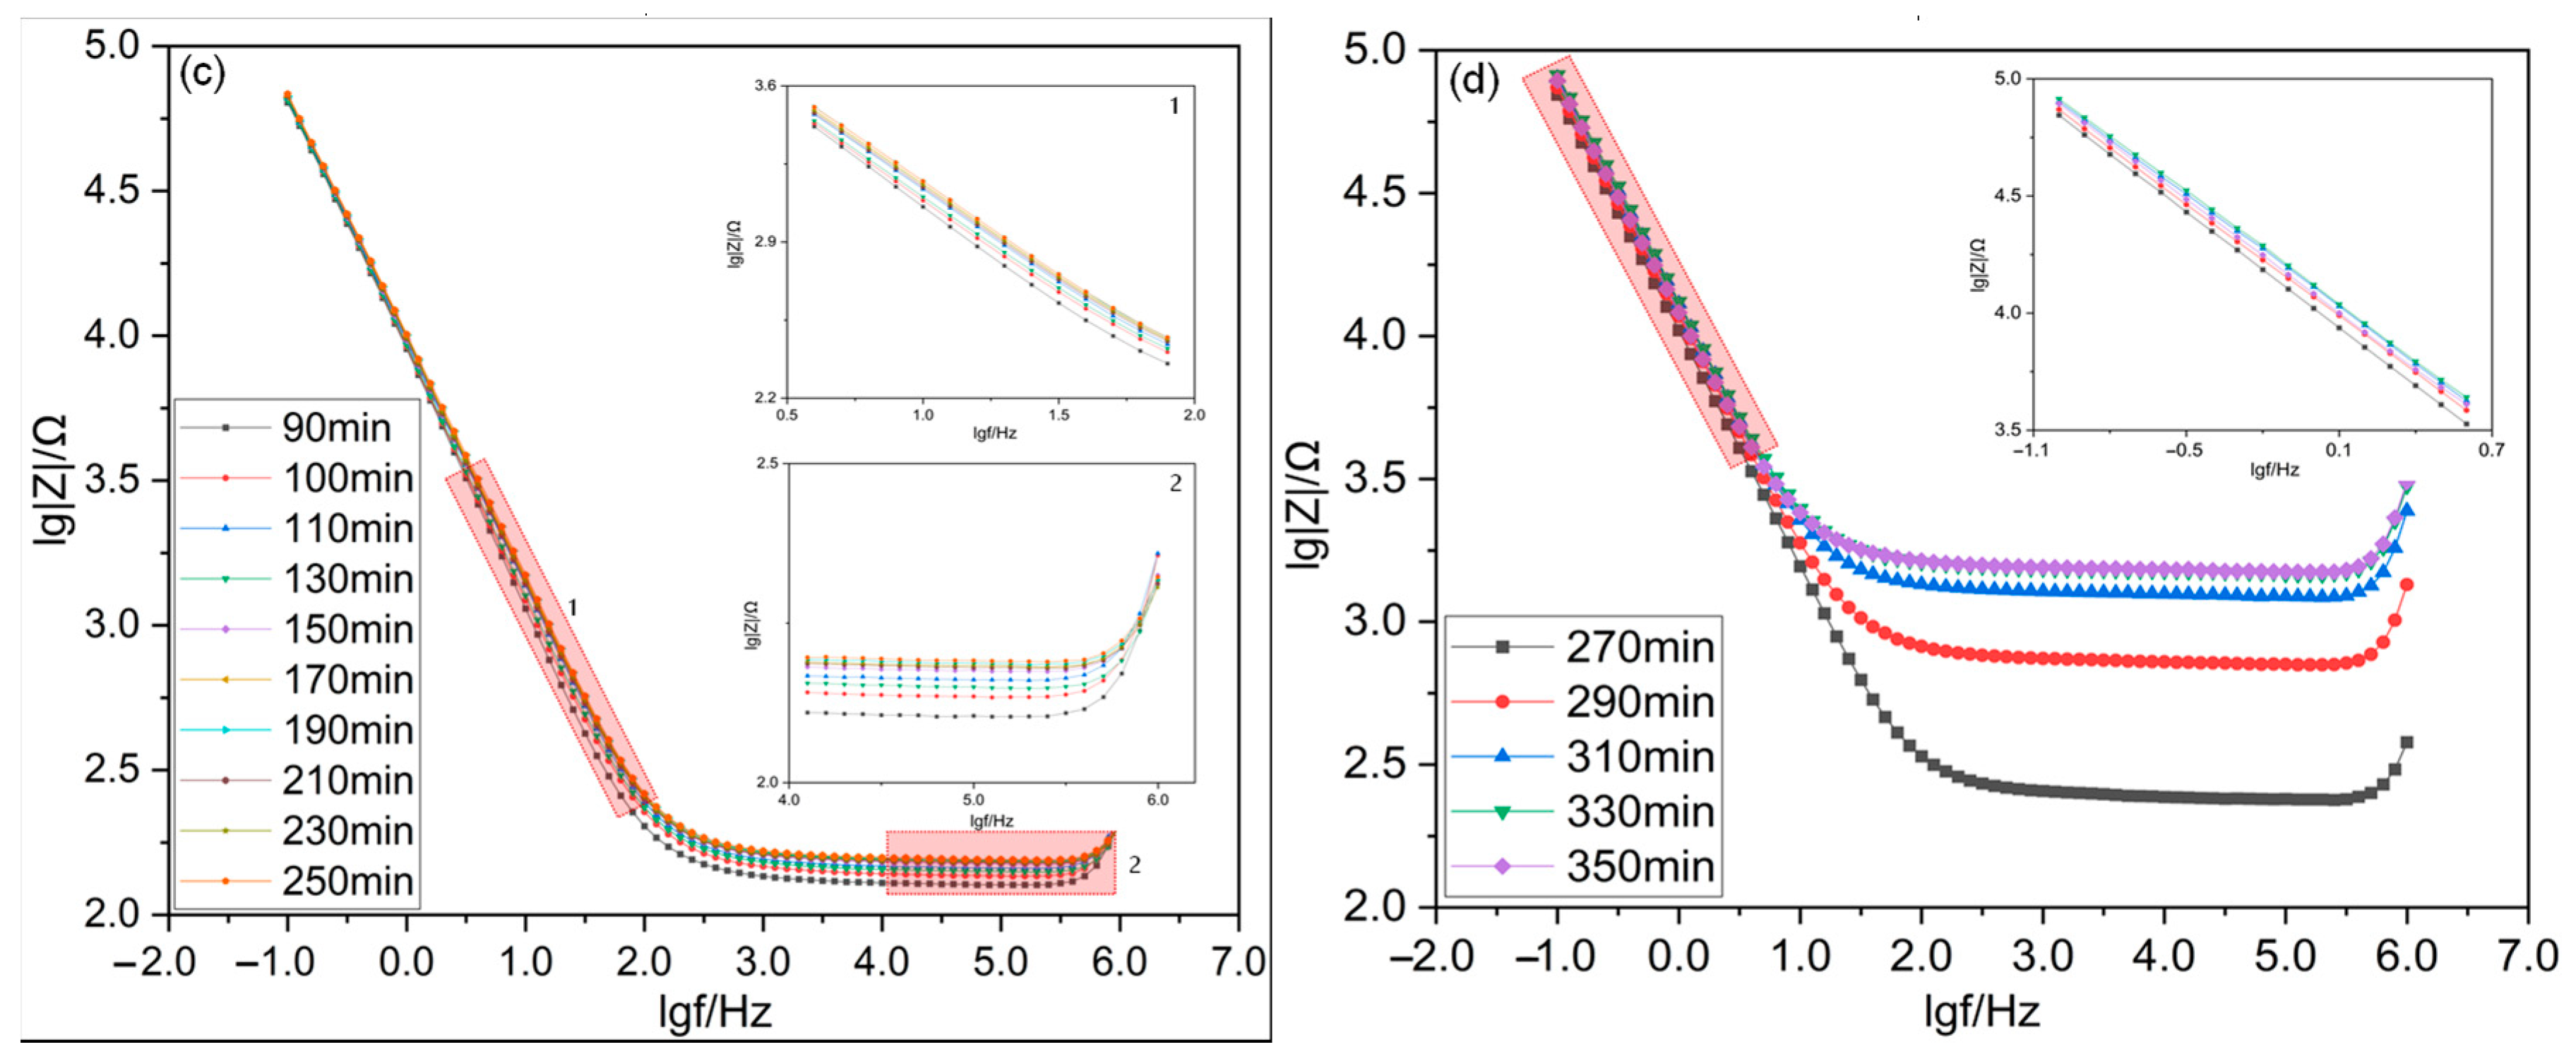
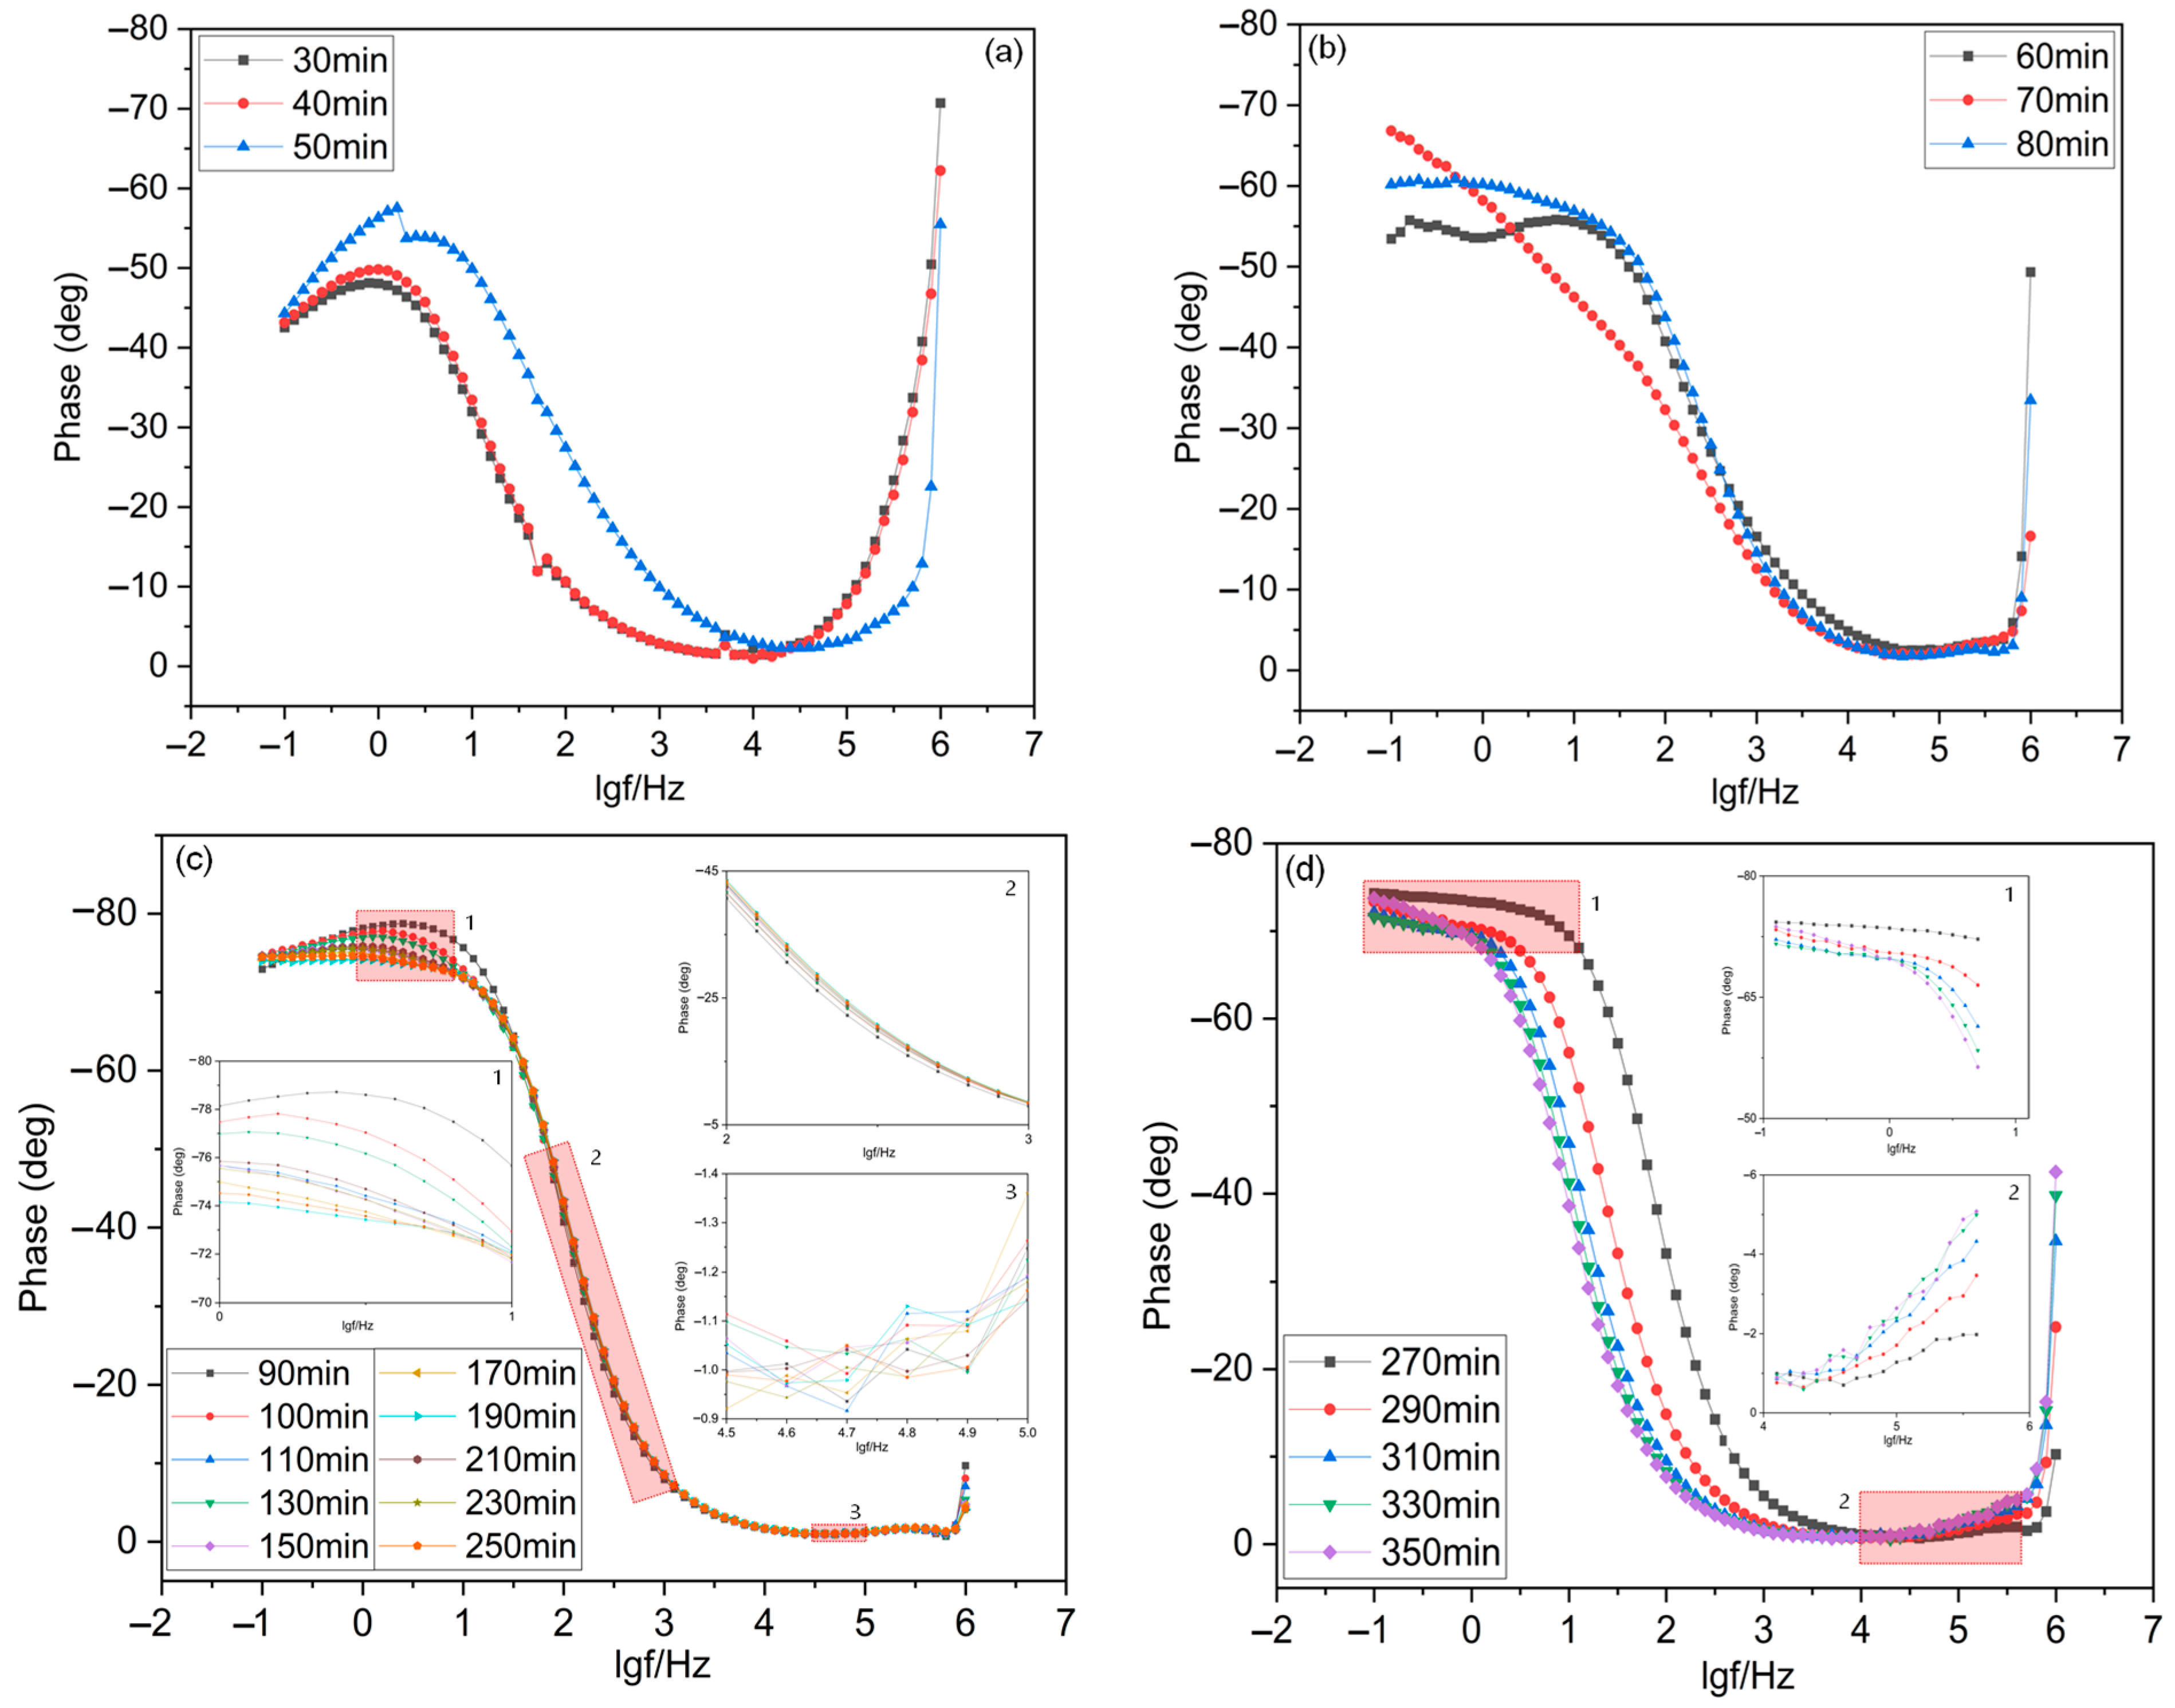
4.2. Bode Plot Analysis

Figure 7 shows the frequency impedance modulus plot for the leaching process of ion adsorption rare earth.
It can be seen from Figure 7 that the impedance modulus values in the four stages of the leaching process consistently decreased with the frequency. In the frequency range of 10−1–102, the curvature of the curve was large, and the impedance modulus decreased linearly. In the frequency range of 102–103 Hz, the curvature of the curve and the impedance modulus decreased slowly. In the frequency range of 103–106 Hz, the change amplitude of the impedance modulus was small and tended to a certain value. During the leaching process, the impedance modulus decreased continuously in the wetting and reaction stages, then dropped to the lowest value and tended to be stable in the equilibrium stage. When deionized water was added, the impedance modulus gradually increased and tended to be stable in the final stage of top water.
As shown in Figure 8, the phase angle of the leaching process varies in an interval of 0–80°. In the wetting stage, the phase angle decreased with frequency. The phase angle decreased rapidly when the frequency was 10–103 Hz, and then decreased slowly when the frequency was less than 10 and more than 103 Hz. In the reaction stage, the phase angle tended to increase first, then decrease and increase again. The phase angle increased rapidly and reached the peak when the frequency was less than 10 Hz, the phase angle decreased rapidly to nearly 0° when the frequency was 10–103 Hz, and the phase angle increased again when the frequency was greater than 10 Hz. In the equilibrium stage, the phase angle peaked at 10−1–10 Hz, decreased rapidly within 10–103 Hz, and remained basically stable within 103–106 Hz. In the top water phase, the phase angle showed an overall decreasing trend, with a slight decrease within 0–10 Hz, followed by a rapid decrease within 10–10 kHz, and remained relatively stable within 10k–1000 kHz. The wetting and equilibrium phases each had a peak, and the peak in each equivalent circuit corresponded to one time constant, indicating that time constants existed in both reaction phases [48].

4.3. Equivalent Circuit Parameter Analysis

The Nyquist and Bode plots were fitted using Zahner Analysis software (version3.1.0, ZAHNER-elektrik1. Zahner-Schiller GmbH & Co.KG, Kronach–Gundelsdorf, Thuringen, Germany), and each equivalent circuit element parameter was fitted to obtain a fitting error of essentially less than 5%, as shown in Table 3.
According to Table 3, the trend diagram of solution resistance and charge transfer resistance during leaching was drawn, as shown in Figure 9.
Rs is the solution resistance, which mainly reflects the conductivity of the pore solution electrolyte of the orebody. The pore solution resistance is significant, and the pore solution cannot easily conduct electricity when the Rs is large, which relates to the pore liquid and size [49,50]. From Table 3 and Figure 9, it can be seen that the solution resistance decreased at first and then increased during the leaching process. The solution resistance was 939 Ω∙cm2 at the wetting stage (30 min), reached a minimum value of 125 Ω∙cm2 at the equilibrium stage (90 min), and reached a maximum value of 1330 Ω∙cm2 at the top water stage (350 min). It could be calculated that the ore sample was unsaturated with an unstable internal structure at the wetting stage. The pores inside the ore sample contained a large amount of gas, and micro and small holes dominated the pore structure. The pore connectivity between clay minerals was poor, and the pore solution had poor electrical conductivity, so the initial resistance value was considerable. From the beginning of the wetting stage to the 90th minute of the equilibrium stage, the addition of ammonium sulfate leach made the orebody transition from an unsaturated state to a saturated state. The gas in the pores was gradually replaced by pore solution, and the pore solution volume, the saturation, and the conductive path 2 in Figure 2 increased. The micro and small pores in the ore body evolved into medium and large pores under the action of seepage, and the pore size of the ore body increased, the seepage effect was enhanced, and the solution connectivity was improved [51,52,53,54,55]. Due to the continuous addition of ammonium sulfate leaching solution, the number of ions in the pore solution increased, and the improvement in pore connectivity led to an increase in the freely moving anion number in the solution, so the conductive capacity of the solution was enhanced.
From the 90th to the 250th minute of the equilibrium stage, the solution resistance fluctuated within 125–154 Ω∙cm2 and showed a steady increase trend. The solution resistance in the equilibrium stage was significantly lower than that in the other three stages, indicating that an effective ion exchange reaction occurred in the equilibrium stage. At the same time, the orebody had reached saturation [56], and the number of ions in the solution was relatively stable. Nevertheless, the pore structure of the ore body changed due to the ion exchange reaction. The macropore number and the porosity decreased [57] and the solution connectivity deteriorated, which resulted in a slight increase in solution resistance with time in this stage. In the top water stage, the solution resistance showed a significant increasing trend due to the addition of deionized water inside the orebody. The ammonium sulfate solution and residual rare earth ions in the pore space were continuously discharged. The conductivity of deionized water was less than that of ammonium sulfate solution, so the resistance increased.
Rt is the charge transfer resistance, reflecting the ability of ions in the diffusion zone to complete charge transfer on the surface of ore body particles and the speed of electrochemical reaction [58], which is mainly determined by the ion concentration gradient and the adsorption characteristics of the orebody particle surface [24,26,27]. In the ion exchange process, the ion exchange reaction occurring on the surface of mineral particles desorbed rare earth ions to the binding liquid layer, resulting in a sharp increase in their concentration in the binding liquid layer. The adsorption of ammonium ions to mineral particles led to a rapid decrease in their concentration in the binding liquid layer, resulting in an apparent concentration gradient between the two layers, which promoted the directional migration of the two ions [59,60]. As shown in Table 3 and Figure 9, Rt generally presented a trend of first decreasing and then increasing, from a maximum value of 8310 Ω∙cm2 in the wetting stage to a minimum value of 21 Ω∙cm2 at the 80th minute of the reaction stage. Rt reached 338 Ω∙cm2 at the end of the top water, and the resistance value in the equilibrium stage was close to the minimum value, with a slight change.
According to the analysis above, it can be seen that at the beginning of the wetting stage, as the leaching solution entered the orebody, it took some time for the solution to penetrate into the orebody and diffused to the surface of the ore body particles to arise.
Ion exchange reaction: Therefore, the initial charge transfer was difficult, and the resistance value had an instantaneous maximum value. In the wetting and reaction stages, the number of ions in the ammonium sulfate solution increased and continuously entered the diffusion double electronic layers region on the surface of the particles with the continuous penetration of the leaching solution, which led to the exchange of RE3+ and NH4+. In this process, the number of charges in the diffusion layer at the solid–liquid interface increased continuously, forming a significant concentration difference and promoting charge transfer. Meanwhile, according to the leaching reaction Equation (1), nRE3+ (aq) resolved from the surface of the mineral particles and then continuously flowed out with the leaching solution, which promoted a positive reaction. The electrical resistance value showed a significant decrease [28] and reached a minimum value at the end of the reaction stage. From the 80th to the 100th minute, the resistance was minor and close to the minimum value, indicating that the ion exchange reaction was dominant in this period. The orebody was interfered with by external factors quickly, but the degree of interference was basically the same, so the resistance value changed very little.
From the 100th minute of the equilibrium stage to the end of the equilibrium stage, the charge translation resistance increased in general and fluctuated up and down irregularly. During this period, the ion exchange reaction continued, but the ion migration in the solution was hindered due to the decrease in porosity. Therefore, the number of ions in the diffusion layer at the solid–liquid interface decreased, the charge migration was inhibited, and the resistance increased. As more and more rare earth ions were replaced, the amount of negative charge carried on the surface of mineral particles increased and the water film become thicker, which led to a stronger retention effect on the fluid, weaker penetration effect, and lower charge transfer ability. However, compared with the other three stages, the effective leaching mainly occurred in the ion exchange reaction, so the resistance was small. In the top water stage, the addition of deionized water led to a decrease in the concentration of ions in the solution, and the continuous occurrence of leaching reaction also reduced the content of rare earth ions in the orebody, resulting in a significant decrease in the number of ions in the diffused double electronic layers. The charge transfer became difficult, and the resistance value increased continuously until the end of the top water.
CPE-T indicates the ability of the double electronic layers to store charge. According to the above analysis of resistance, it can be seen that with the leaching process, the ion exchange reaction had higher efficiency and faster reaction in the equilibrium stage. The capacitance value in this stage was relatively large, the surface properties of clay minerals were relatively active, and the charge storage ability was strong. At the top water stage, since there was basically no exchange reaction between deionized water and rare earth minerals, the exchange reaction occurred because of the reaction between the residual leaching solution in the orebody and rare earth ions, so the ion exchange reaction rate was significantly reduced, the surface charge of clay minerals was continuously stored, and the capacitance was gradually increased.

5. Conclusions

This paper used electrochemical impedance spectroscopy (EIS) to study the electrochemical characterization of ionic rare earth during the in situ leaching process, and an equivalent circuit model was established. Through the calculation of the fitted EIS parameters, the changing law of electrochemical parameters in the leaching process was obtained, and the parameters were analyzed and interpreted. Through this study, it is hoped that a more in-depth understanding of the mechanisms of percolation and mass transfer during rare earth leaching will be gained, which will provide more ideas for the efficient mining of rare earth ores in the future. The main conclusions were drawn as follows:
(1)
Based on the electrochemical characterization of the in situ leaching process of ion adsorption rare earth, an equivalent circuit model was proposed to reflect the electrochemical changes in the leaching process. The main circuit elements of the model included a solution resistor, a charge transfer resistor, a constant phase-angle element, and a diffusion impedance. The solution resistance Rs and charge transfer resistance Rt were mainly analyzed. The solution resistance reflected the number of ions in the ammonium sulfate solution and the change in the pore structure of the orebody during leaching. The charge transfer resistance reflected the ion concentration gradient and chemical reaction at the liquid–solid interface during the leaching process, which were the main factors affecting the leaching and leaching rates.
(2)
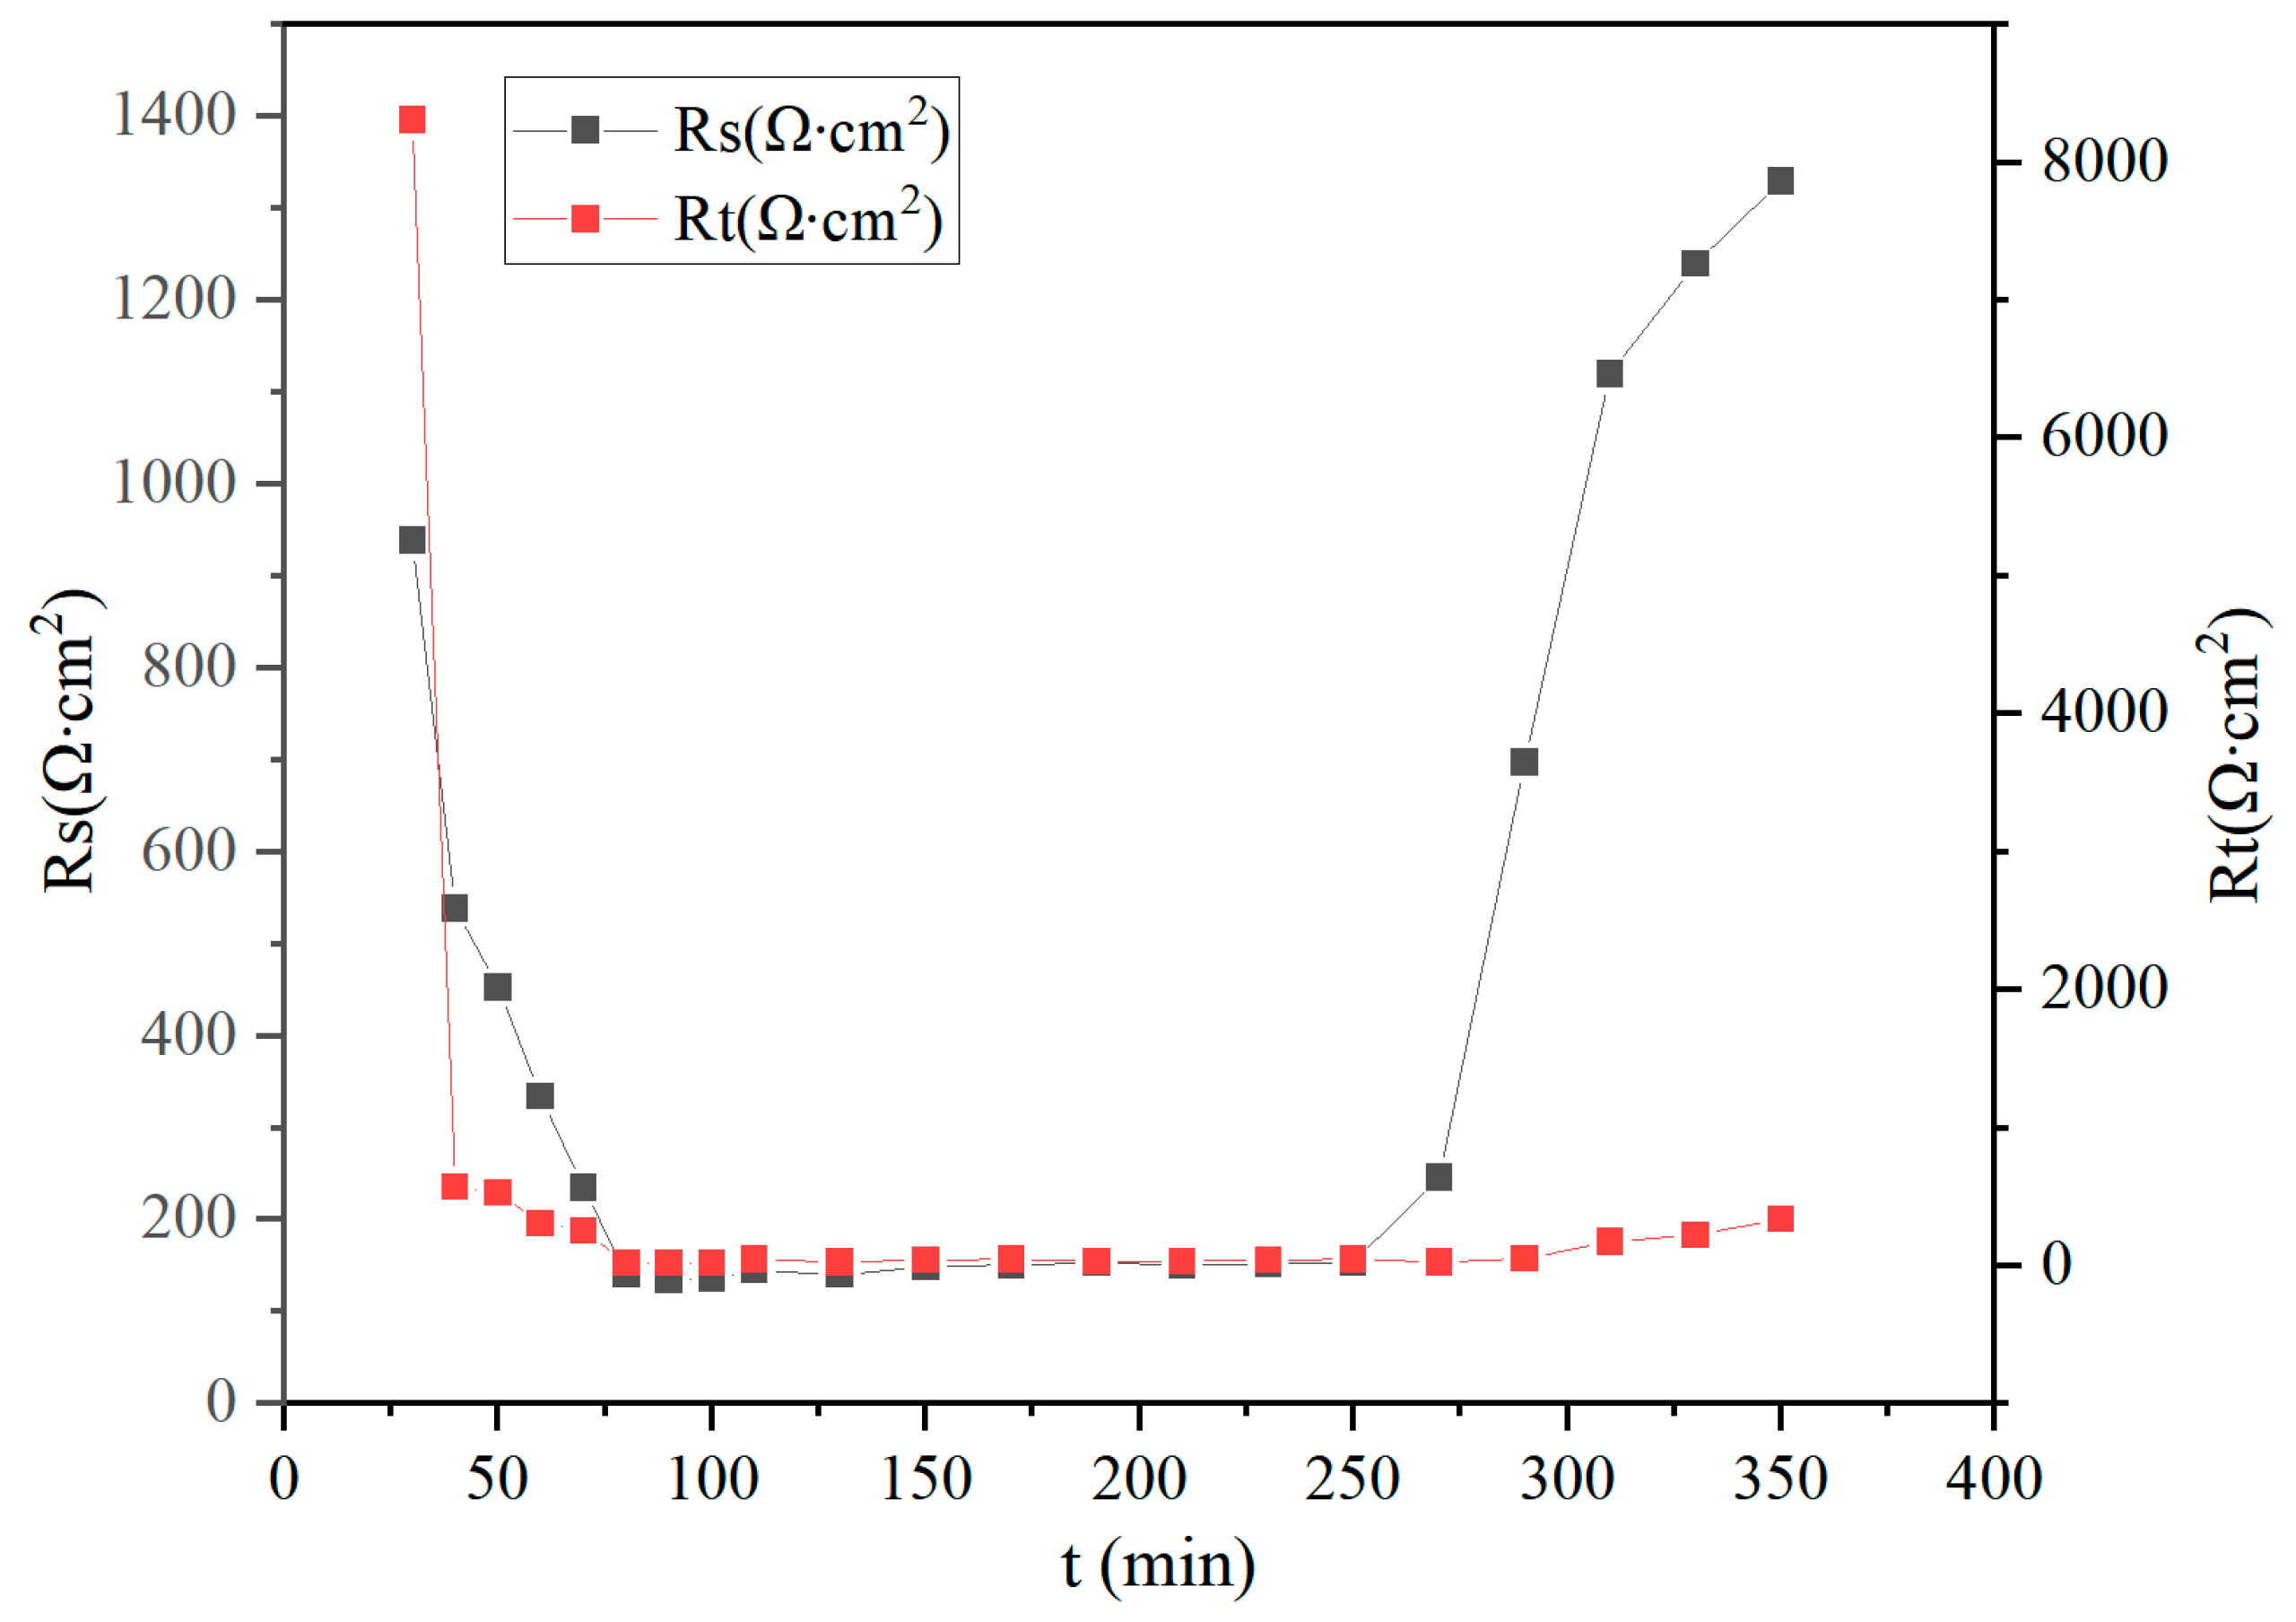
According to the changing law of electrochemical parameters in the leaching process, the leaching process was divided into four stages: wetting stage, reaction stage, equilibrium stage, and top water stage. During the leaching process, the resistance parameter Rs and Rt values tended to decrease first and then increase. The maximum value of Rs was 1330 Ω∙cm2 at the end of the top water stage, and the minimum value was 125 Ω∙cm2 at the beginning of the equilibrium stage. The maximum value of charge transfer resistance was 8310 Ω∙cm2 at the beginning of the leaching stage, and the minimum value was 21 Ω∙cm2 at the end of the reaction stage. Rs and Rt in the equilibrium leaching stage were close to the minimum value and remained relatively stable.
(3)
The values of Rs and Rt were negatively correlated with the size of the pore structure and the chemical reaction rate of ion exchange. The pore structure was large, and the rate of chemical reaction was great when the resistance parameter value was small. At this stage, the pore solution connectivity of the orebody was good, and the solid–liquid interface could easily form a large ion concentration gradient, which was conducive to chemical reactions.

Author Contributions

Conceptualization, X.F.; methodology, X.F. and X.W.; software, X.W.; validation, X.F. and X.W.; formal analysis, X.W.; investigation, X.F. and X.W.; resources, X.F. and X.W.; data curation, X.W.; writing—original draft preparation, X.W.; writing—review and editing, X.F.; visualization, X.W.; supervision, X.F. and X.W.; project administration, X.F.; funding acquisition, X.F. All authors have read and agreed to the published version of the manuscript.

Funding

This research was funded by National Key R&D Program of China (2023YFC2907800), Major Innovation Program of Shandong Province of China (2021CXGC011206), the Graduate Innovation Program of China University of Mining and Technology (grant number 2023WLKXJ015) and the Postgraduate Research & Practice Innovation Program of Jiangsu Province (grant number KYCX23_2774).

Data Availability Statement

Data are contained within the article.

Conflicts of Interest

The authors declare no conflicts of interest.

References

  1. Yang, X.Y.; Xi, G.S.; Yao, N.; Zhou, M.; Gao, X.J.; Chen, M.; Wang, X.X.; Pan, Z.Z.; Wang, Z.M. Spatiotemporal distribution of residual ammonium in a rare-earth mine after in-situ leaching: A modeling study with scarce data. J. Hydrol. 2022, 615, 128669. [Google Scholar] [CrossRef]
  2. Xiao, Y.; Feng, Z.; Hu, G.; Huang, L.; Huang, X.; Chen, Y.; Long, Z. Reduction leaching of rare earth from ion-adsorption type rare earths ore with ferrous sulfate. J. Rare Earths 2016, 34, 917–923. [Google Scholar] [CrossRef]
  3. Huang, X.-W.; Long, Z.-Q.; Wang, L.-S.; Feng, Z.-Y. Technology development for rare earth cleaner hydrometallurgy in China. Rare Met. 2015, 34, 215–222. [Google Scholar] [CrossRef]
  4. Artiushenko, O.; da Silva, R.F.; Zaitsev, V. Recent advances in functional materials for rare earth recovery: A review. Sustain. Mater. Technol. 2023, 37, e00681. [Google Scholar] [CrossRef]
  5. Wang, X.; Tang, Y.; Lee, J.-M.; Fu, G. Recent advances in rare-earth-based materials for electrocatalysis. Chem Catal. 2022, 2, 967–1008. [Google Scholar] [CrossRef]
  6. Yanfei, X.; Zongyu, F.; Xiaowei, H.; Li, H.; Yingying, C.; Liangshi, W.; Zhiqi, L. Recovery of rare earths from weathered crust elution-deposited rare earth ore without ammonia-nitrogen pollution: I. leaching with magnesium sulfate. Hydrometallurgy 2015, 153, 58–65. [Google Scholar] [CrossRef]
  7. Traore, M.; Gong, A.; Wang, Y.; Qiu, L.; Bai, Y.; Zhao, W.; Liu, Y.; Chen, Y.; Liu, Y.; Wu, H.; et al. Research progress of rare earth separation methods and technologies. J. Rare Earths 2023, 41, 182–189. [Google Scholar] [CrossRef]
  8. Jing, H.; Geng, L.; Qiu, S.; Zou, H.; Liang, M.; Deng, D. Research progress of rare earth composite shielding materials. J. Rare Earths 2023, 41, 32–41. [Google Scholar] [CrossRef]
  9. He, Q.; Qiu, J.; Chen, J.; Zan, M.; Xiao, Y. Progress in green and efficient enrichment of rare earth from leaching liquor of ion adsorption type rare earth ores. J. Rare Earths 2022, 40, 353–364. [Google Scholar] [CrossRef]
  10. Shen, L.; Zhou, H.; Shi, Q.; Meng, X.; Zhao, Y.; Qiu, G.; Zhang, X.; Yu, H.; He, X.; He, H.; et al. Comparative chemical and non-contact bioleaching of ion-adsorption type rare earth ore using ammonium sulfate and metabolites of Aspergillus niger and Yarrowia lipolytica to rationalise the role of organic acids for sustainable processing. Hydrometallurgy 2023, 216, 106019. [Google Scholar] [CrossRef]
  11. Lai, F.; Huang, L.; Gao, G.; Yang, R.; Xiao, Y. Recovery of rare earths from ion-absorbed rare earths ore with MgSO4-ascorbic acid compound leaching agent. J. Rare Earths 2018, 36, 521–527. [Google Scholar] [CrossRef]
  12. Deng, Y.; Wan, Y.; Yu, H.; Kang, S.; Deng, Y.; Yang, J. Changes in Microfine Particle Migration of Ionic Rare Earth Ores during Leaching. Sustainability 2023, 15, 3867. [Google Scholar] [CrossRef]
  13. Fuguo, L.; Guohua, G.; Li, H.; Yanfei, X.; Run, Y.; Kaizhong, L. Compound leaching of rare earth from the ion-adsorption type rare earth ore with magnesium sulfate and ascorbic acid. Hydrometallurgy 2018, 179, 25–35. [Google Scholar] [CrossRef]
  14. Ran, X.; Ren, Z.; Gao, H.; Zheng, R.; Jin, J. Kinetics of Rare Earth and Aluminum Leaching from Kaolin. Minerals 2017, 7, 152. [Google Scholar] [CrossRef]
  15. Chi, R.; Tian, J.; Li, Z.; Peng, C.; Wu, Y.; Li, S.; Wang, C.; Zhou, Z. Existing State and Partitioning of Rare Earth on Weathered Ores. J. Rare Earth 2005, 23, 756–759+643. [Google Scholar]
  16. Chen, J.; Qiu, J.; Huang, L.; Chen, X.; Yang, Y.; Xiao, Y. Coordination–reduction leaching process of ion-adsorption type rare earth ore with ascorbic acid. J. Rare Earths 2023, 41, 1225–1233. [Google Scholar] [CrossRef]
  17. Xiao, Y.-F.; Feng, Z.-Y.; Hu, G.-H.; Huang, L.; Huang, X.-W.; Chen, Y.-Y.; Li, M.-L. Leaching and mass transfer characteristics of elements from ion-adsorption type rare earth ore. Rare Met. 2015, 34, 357–365. [Google Scholar] [CrossRef]
  18. Meng, X.; Zhao, H.; Zhao, Y.; Shen, L.; Gu, G.; Qiu, G. Heap leaching of ion adsorption rare earth ores and REEs recovery from leachate with lixiviant regeneration. Sci. Total Environ. 2023, 898, 165417. [Google Scholar] [CrossRef]
  19. Guo, Z.-Q.; Zhou, J.-R.; Zhou, K.-F.; Jin, J.-F.; Wang, X.-J.; Zhao, K. Soil-water characteristics of weathered crust elution-deposited rare earth ores. Trans. Nonferrous Met. Soc. China 2021, 31, 1452–1464. [Google Scholar] [CrossRef]
  20. Wang, L.; Wang, C.; Li, L.; Yang, Y. Readsorption of rare earth elements during leaching process of ion-adsorption-type rare earth ore. Rare Met. 2018, 42, 2113–2120. [Google Scholar] [CrossRef]
  21. Vo, P.H.N.; Danaee, S.; Hai, H.T.N.; Huy, L.N.; Nguyen, T.A.H.; Nguyen, H.T.M.; Kuzhiumparambil, U.; Kim, M.; Nghiem, L.D.; Ralph, P.J. Biomining for sustainable recovery of rare earth elements from mining waste: A comprehensive review. Sci Total Environ. 2024, 908, 168210. [Google Scholar] [CrossRef] [PubMed]
  22. Brigida, V.S.; Golik, V.I.; Klyuev, R.V.; Sabirova, L.B.; Mambetalieva, A.R.; Karlina, Y.I. Efficiency Gains When Using Activated Mill Tailings in Underground Mining. Metallurgist 2023, 67, 398–408. [Google Scholar] [CrossRef]
  23. Xiao, Y.; Gao, G.; Huang, L.; Feng, Z.; Lai, F.; Long, Z. A discussion on the leaching process of the ion-adsorption type rare earth ore with the electrical double layer model. Miner. Eng. 2018, 120, 35–43. [Google Scholar]
  24. Yu, H.H.; Sun, D.A. Effect of NaCl solution on swelling of bentonite with different water contents. New Adv. Geotech. Eng. 2018, 49, 455–459. [Google Scholar]
  25. Alkan, M.; Karadaş, M.; Doğan, M.; Demirbaş, Ö. Zeta potentials of perlite samples in various electrolyte and surfactant media. Colloids Surf. A Physicochem. Eng. Asp. 2005, 259, 155–166. [Google Scholar] [CrossRef]
  26. Wu, Z.; Chen, Y.; Wang, Y.; Xu, Y.; Lin, Z.; Liang, X.; Cheng, H. Review of rare earth element (REE) adsorption on and desorption from clay minerals: Application to formation and mining of ion-adsorption REE deposits. Ore Geol. Rev. 2023, 157, 105446. [Google Scholar] [CrossRef]
  27. Wang, L.; Liao, C.; Yang, Y.; Xu, H.; Xiao, Y.; Yan, C. Effects of organic acids on the leaching process of ion-adsorption type rare earth ore. J. Rare Earths 2017, 35, 1233–1238. [Google Scholar] [CrossRef]
  28. Xiao, Y.F.; Chen, Y.Y.; Feng, Z.Y.; Huang, X.W.; Huang, L.; Long, Z.Q.; Cui, D.L. Leaching characteristics of ion-adsorption type rare earths ore with magnesium sulfate. Trans. Nonferrous Met. Soc. China 2015, 25, 3784–3790. [Google Scholar] [CrossRef]
  29. Feng, J.; Zhou, F.; Chi, R.; Liu, X.; Xu, Y.; Liu, Q. Effect of a novel compound on leaching process of weathered crust elution-deposited rare earth ore. Miner. Eng. 2018, 129, 63–70. [Google Scholar] [CrossRef]
  30. Hu, G.; Feng, Z.; Dong, J.; Meng, X.; Xiao, Y.; Liu, X. Mineral properties and leaching characteristics of volcanic weathered crust elution-deposited rare earth ore. J. Rare Earths 2017, 35, 906–910. [Google Scholar] [CrossRef]
  31. Yin, S.; Pei, J.; Jiang, F.; Li, S.; Peng, J.; Zhang, L.; Ju, S.; Srinivasakannan, C. Ultrasound-assisted leaching of rare earths from the weathered crust elution-deposited ore using magnesium sulfate without ammonia-nitrogen pollution. Ultrason. Sonochem 2018, 41, 156–162. [Google Scholar] [CrossRef] [PubMed]
  32. Shi, Q.; Zhao, Y.; Meng, X.; Shen, L.; Qiu, G.; Zhang, X.; Yu, H.; He, X.; He, H.; Zhao, H. Column leaching of ion adsorption rare earth ore at low ammonium concentration. J. Mater. Res. Technol. 2022, 19, 2135–2145. [Google Scholar] [CrossRef]
  33. Rasoulnia, P.; Barthen, R.; Lakaniemi, A.-M. A critical review of bioleaching of rare earth elements: The mechanisms and effect of process parameters. Crit. Rev. Environ. Sci. Technol. 2020, 51, 378–427. [Google Scholar] [CrossRef]
  34. Xie, F.; Yin, S.; Yuan, C.; Qi, Y.; Liang, J.; Zhu, Z.; Li, G. Study on the Influence Mechanism of Leaching Solution on Pore of Ionic Rare Earth Ore. Chin. Rare Earths 2018, 39, 48–56. [Google Scholar]
  35. Zhang, J.; Zheng, F.; Liu, Z.; Hong, S.; Dong, B.; Xing, F. Nondestructive monitoring on hydration behavior of cement pastes via the electrochemical impedance spectroscopy method. Measurement 2021, 185, 109884. [Google Scholar] [CrossRef]
  36. Liu, Q.; Cheng, S.; Xiao, J.; Sun, C. Study of the relationship between the AC impedance spectrum of varied building solid waste materials and their microporous structure. J/OL. Build. Mater. 2022, 1–11. Available online: https://kns.cnki.net/kcms/detail/31.1764.tu.20220727.1237.030.html (accessed on 28 July 2022).
  37. Bragança, M.O.G.P.; Hasparyk, N.P.; Bronholo, J.L.; Silva, A.S.; Portella, K.F.; Kuperman, S.C. Electrochemical impedance spectroscopy and ultrasound for monitoring expansive reactions and their interactions on cement composites. Constr. Build. Mater. 2021, 305, 124726. [Google Scholar] [CrossRef]
  38. Rao, R.K.; Sasmal, S. Nanoengineered smart cement composite for electrical impedance-based monitoring of corrosion progression in structures. Cem. Concr. Compos. 2022, 126, 104348. [Google Scholar] [CrossRef]
  39. Wen, W.; Jia, L.; Xie, J.; Zhao, W.; Feng, H.; Cao, D.; Sun, F.; Han, P.; Bai, X.; He, B. Electrochemical response and effect evaluation of high belite sulphoaluminate cement combined with red mud-fly ash on solidification of Cu2+-contaminated kaolin. Case Stud. Constr. Mat. 2022, 17, e01497. [Google Scholar] [CrossRef]
  40. Barsoukov, E.; Macdonald, R.J. Impedance Spectroscopy: Theory, Experiment, and Applications; Wiley-Interscience: Hoboken, NJ, USA, 2005. [Google Scholar]
  41. Shi, M. Impedance Spectroscopy of Concrete; China Railway Publishing House: Beijing, China, 2003. [Google Scholar]
  42. Zhang, C. Introduction to Electrochemical Impedance Spectroscopy; Science Press: Beijing, China, 2002. [Google Scholar]
  43. Zhao, S.; Guo, B.; Peng, Y.; Mai, Y. An impedance spectroscopy study on the mitigation of clay slime coatings on chalcocite by electrolytes. Miner. Eng. 2017, 101, 40–46. [Google Scholar] [CrossRef]
  44. Elmelouky, A.; Mortadi, A.; Chahid, E.; Elmoznine, R. Impedance spectroscopy as a tool to monitor the adsorption and removal of nitrate ions from aqueous solution using zinc aluminum chloride anionic clay. Heliyon 2018, 4, e00536. [Google Scholar] [CrossRef] [PubMed]
  45. XB/T 619-2015[S]; Chemical Analysis Methods of Ion Type Rare Earth Ore—Determination of Total Rare Earth Ion Phase. Standards Press of China: Beijing, China, 2016; pp. 1–12.
  46. Han, P.-J.; Zhang, Y.-F.; Chen, F.Y.; Bai, X.-H. Interpretation of electrochemical impedance spectroscopy (EIS) circuit model for soils. J. Cent. South Univ. (Engl. Ed.) 2015, 22, 4318–4328. [Google Scholar] [CrossRef]
  47. Sun, F.; Chen, Z.; Bai, X.; Wang, Y.; Liu, X.; He, B.; Han, P. Theoretical and experimental bases for the equivalent circuit model for interpretation of silty soil at different temperatures. Heliyon 2023, 9, e12652. [Google Scholar] [CrossRef] [PubMed]
  48. Cheng, J. Experimental Study on the Electrochemical Characterization of Kaolin and Montmorillonite. Ph.D. Thesis, Taiyuan University of Technology, Taiyuan, China, 2022. [Google Scholar]
  49. Niu, S.; Luo, J.; Chen, M.; Chen, Z.; Wang, X.; Bai, X.; Li, J. Experimental study of cement-based materials under sulfate attack environment using Electrochemical Impedance Spectroscopy. Int. J. Electrochem. Sci. 2023, 18, 100133. [Google Scholar] [CrossRef]
  50. Niu, S.; Wang, X.; Xing, J.; Li, J.; Xie, R.; Bai, X.; Han, P. Experimental Study of the Electrochemical Impedance Characteristics and Mechanical Properties of High Belite Sulfoaluminate Cement. Int. J. Electrochem. Sci. 2022, 17, 221287. [Google Scholar] [CrossRef]
  51. Wang, H.; Wang, X.; Wang, Y.; Wang, D.; Hu, K.; Zhong, W.; Guo, Z. Influence of ammonium sulfate leaching agent on engineering properties of weathered crust elution-deposited rare earth ore. Acta Geotech. 2023. [Google Scholar] [CrossRef]
  52. Wang, X.; Zhuo, Y.; Zhao, K.; Zhong, W. Experimental measurements of the permeability characteristics of rare earth ore under the hydro-chemical coupling effect. RSC Adv. 2018, 8, 11652–11660. [Google Scholar] [CrossRef]
  53. Gao, Z.; Rao, Y.; Shi, L.; Xiang, R.; Yang, Z. Effect of Magnesium Sulfate Solution on Pore Structure of Ionic Rare Earth Ore during Leaching Process. Minerals 2023, 13, 294. [Google Scholar] [CrossRef]
  54. Zhou, L.; Wang, X.; Huang, C.; Wang, H.; Ye, H.; Hu, K.; Zhong, W. Development of pore structure characteristics of a weathered crust elution-deposited rare earth ore during leaching with different valence cations. Hydrometallurgy 2021, 201, 105579. [Google Scholar] [CrossRef]
  55. Zhang, X.; Gao, Z.; Rao, Y.; Shi, L.; Xu, W. Evolutionary Law of Pore Structure of Ion-Adsorbed Rare Earth Ore Leaching Process. Minerals 2023, 13, 322. [Google Scholar] [CrossRef]
  56. Shi, L.; Rao, Y.-Z.; Wang, D.; Zhang, M.-D.; Huang, T.; Gao, Y. A Capillary Model for Predicting Saturated Hydraulic Conductivity of Ion-Adsorption Rare Earth Ore Based on Improved Kozeny–Carman Equation. Geofluids 2022, 2022, 2947220. [Google Scholar] [CrossRef]
  57. Luo, X.; Zhang, Y.; Zhou, H.; He, K.; Zhang, B.; Zhang, D.; Xiao, W. Pore structure characterization and seepage analysis of ionic rare earth orebodies based on computed tomography images. Int. J. Min. Sci. Technol. 2022, 32, 411–421. [Google Scholar] [CrossRef]
  58. Xie, R.; Xie, Y.; Li, B.; Han, P.; He, B.; Dou, B.; Bai, X. Electrochemical Impedance Spectroscopy of Sandy Soil Containing Cl, SO42− and HCO3. Int. J. Electrochem. Sci. 2021, 16, 211211. [Google Scholar] [CrossRef]
  59. Long, P.; Wang, G.; Zhang, C.; Yang, Y.; Cao, X.; Shi, Z. Kinetics model for leaching of ion-adsorption type rare earth ores. J. Rare Earths 2020, 38, 1354–1360. [Google Scholar] [CrossRef]
  60. Wang, X.; Zhuo, Y.; Deng, S.; Li, Y.; Zhong, W.; Zhao, K. Experimental Research on the Impact of Ion Exchange and Infiltration on the Microstructure of Rare Earth Orebody. Adv. Mater. Sci. Eng. 2017, 2017, 4762858. [Google Scholar] [CrossRef]
Figure 1. Diagram of column immersion and EIS test instrument.
Minerals 14 00092 g001
Figure 2. Conductive paths during in situ leaching of ionic rare earth.
Minerals 14 00092 g002
Figure 3. Quasi-Randles model equivalent circuit.
Minerals 14 00092 g003
Figure 4. Nyquist plot for the quasi-Randles model.
Minerals 14 00092 g004
Figure 5. Three-dimensional diagram of the AC impedance spectrum of the leaching process. (a,b) represent different perspectives.
Minerals 14 00092 g005
Figure 6. Nyquist diagram of ionic rare earth ore leaching process. (a) wetting stage (30–50 min); (b) reaction stage (50–80 min); (c) equilibrium stage (80–250 min); (d) top water stage (250–350 min).
Minerals 14 00092 g006
Figure 7. Diagram of impedance modulus of ionic rare earth ore leaching process. (a) wetting stage; (b) reaction stage; (c) equilibrium stage; (d) top water stage.
Minerals 14 00092 g007aMinerals 14 00092 g007b
Figure 8. Phase angle change diagram of ionic rare earth ore during the leaching process. (a) wetting stage; (b) reaction stage; (c) equilibrium stage; (d) top water stage.
Minerals 14 00092 g008
Figure 9. Trend diagram of solution resistance and charge transfer resistance during the leaching process.
Minerals 14 00092 g009
Table 1. Particle size distribution of raw ore (w/%).
Particle Size/mm<0.10.1~0.50.5~0.90.9~1.431.43~4>4
percentage/%14.616.213.215.719.221.1
Table 2. Distribution of rare earth content in different grain sizes.
Particle Size/mm−0.150.15–0.250.25–0.450.45–0.90.9–1.431.43–4+4
Rare Earth Content Distribution/%53.8215.6311.1610.763.702.832.11
Table 3. Equivalent circuit parameters of the leaching process.
Time (min)Rs (Ω∙cm2)Rt (Ω∙cm2)CPE-T (μF)Total Error (%)
3093983100.6253.77
40538571.90.4532.31
504535280.2774.89
603343100.1682.25
702352560.1692.45
80140210.1992.62
9012523.97.963.85
10013622.75.432.5
110145473.541.76
13014025.64.912.1
15014943.13.321.52
17015145.53.461.87
19015332.63.942.01
21015130.93.91.62
23015243.83.411.71
250154473.471.95
27024625.73.32.55
29069751.65.322.58
31011201745.462.43
33012402235.362.07
35013303385.531.86
Disclaimer/Publisher’s Note: The statements, opinions and data contained in all publications are solely those of the individual author(s) and contributor(s) and not of MDPI and/or the editor(s). MDPI and/or the editor(s) disclaim responsibility for any injury to people or property resulting from any ideas, methods, instructions or products referred to in the content.

