Abstract
Piton de la Fournaise is an active shield volcano located in the eastern area of the Réunion Island (Indian Ocean) whose activity is characterized by effusive and explosive episodes with the emission of scarcely differentiated magmas with mostly tholeiitic affinity. The presently active edifice has grown within the Enclos Fouqué caldera, a polylobate plain bounded on its western side by the 80–200 m high Bellecombe vertical cliffs. This escarpment exposes a vertical sequence of 12 lava flows cut by a dike with an age > 5.5 kyrs. In this work, the Bellecombe products were investigated by X-ray fluorescence, Inductively Coupled Plasma Mass Spectroscopy, a Scanning Electron Microscope and X-ray computed microtomography in order to characterize the evolution over time of the magmatic system feeding the eruptive activity prior to the Enclos Fouqué caldera collapse. The results indicate that lava flows share a geochemical affinity with the two main series documented at Piton de la Fournaise, namely, Steady State Basalts (SSB) at the bottom and top of the sequence and Abnormal basalt Group (AbG) with different degrees of differentiation in the central part. The emission of these two different products in both a restricted area and timespan testifies to the dynamic activity of the plumbing system, capable of shifting rapidly from central to eccentric activity in the recent past.
1. Introduction
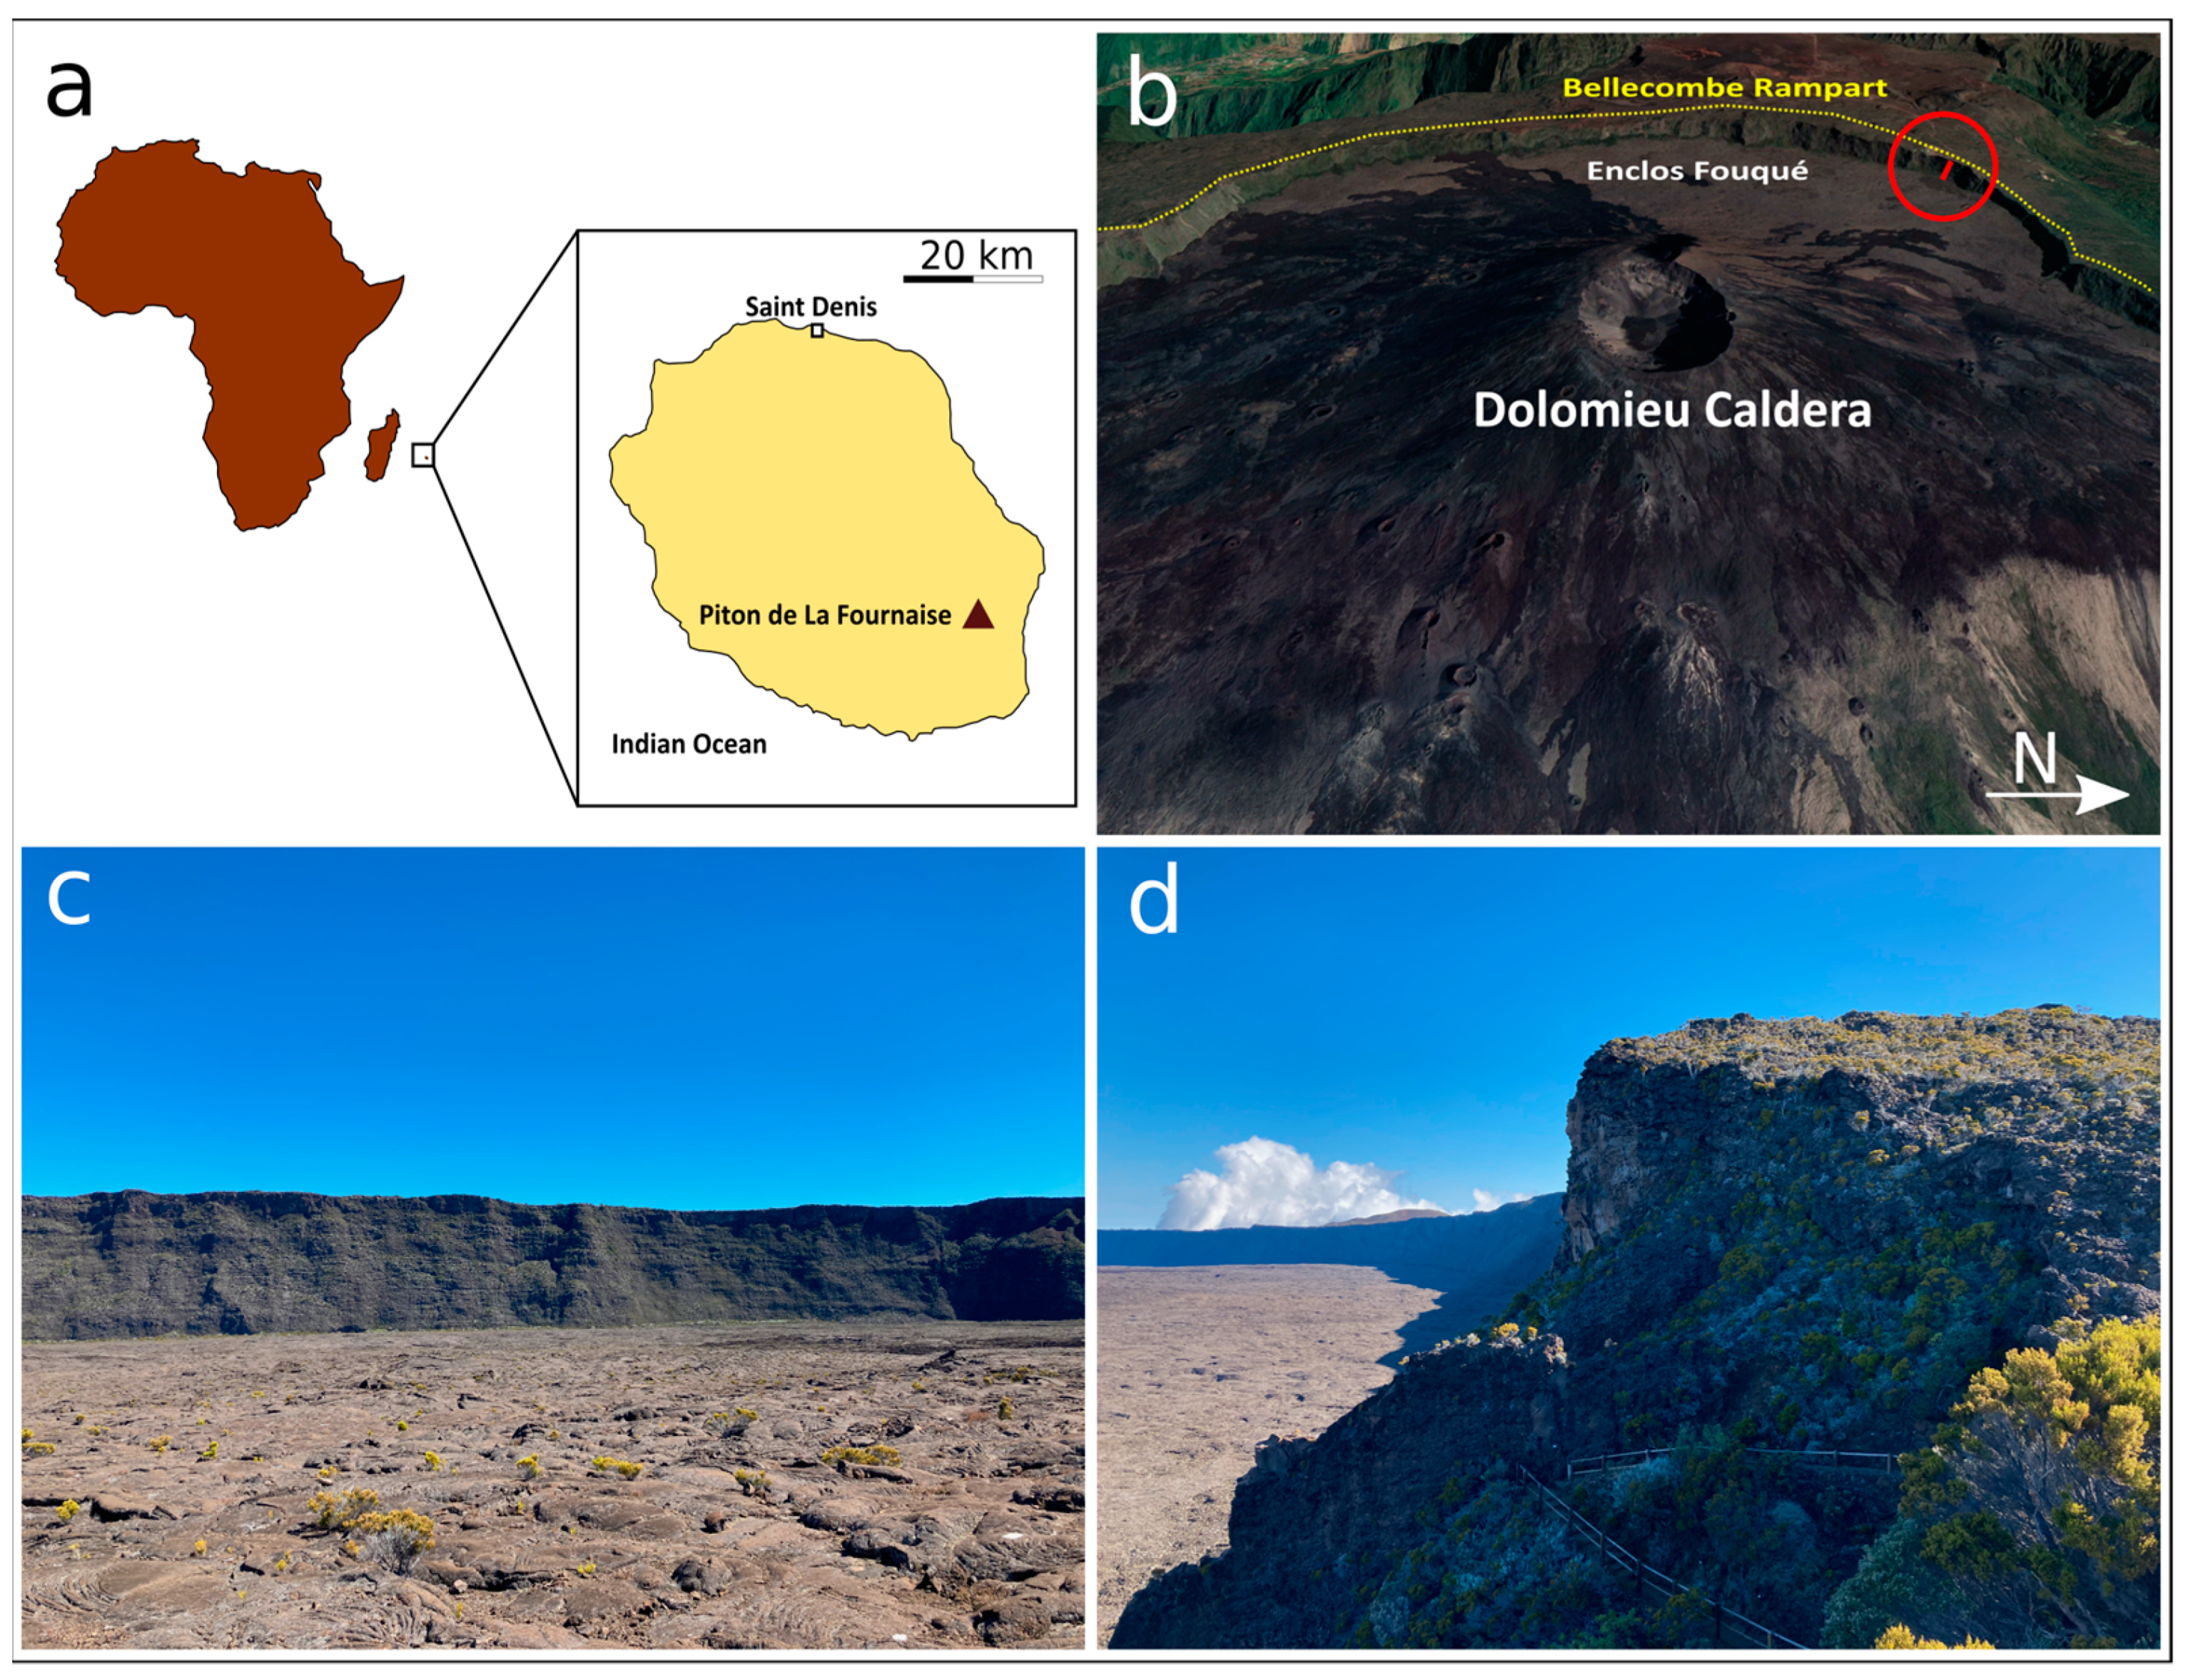
The reconstruction of short/medium-term variations in the geochemical and textural characters of magmas feeding the plumbing system of a volcano is a key factor in understanding their geodynamic significance and eruptive behavior, especially in terms of forecasting and hazard assessment. This task is made easier when investigating the most recent phases of volcanic evolution, since the erupted products (lavas and pyroclasts) are commonly widespread on the flanks of the edifice and thus easily sampled and investigated. Instead, the geochemical and petrological study of more ancient products is more complicated since they are usually buried by the most recent products. This poses a problem when it comes to selecting an adequate number of different outcrops where it is possible to reconstruct stratigraphic relationships with sufficient accuracy. Nevertheless, some typical structures present in volcanic terrains such as calderas, landslides, fault displacements and erosive cuts often expose thick sequences of products that provide precious information on the ancient phases of the volcano’s evolution [1]. This is the case of the Piton de la Fournaise volcanic complex (La Réunion Island, France), whose presently active edifice has grown within the young Enclos Fouqué caldera (Figure 1), a polylobate horseshoe-shaped plain (~13 × 9 km) bounded by 80–200 m high vertical cliffs. The cliffs expose very rare dikes and piles of dominantly a’a type lava flows emitted prior to the Enclos Fouqué caldera collapse, which occurred in several phases, the oldest being dated at 4.5 kyrs [2,3].
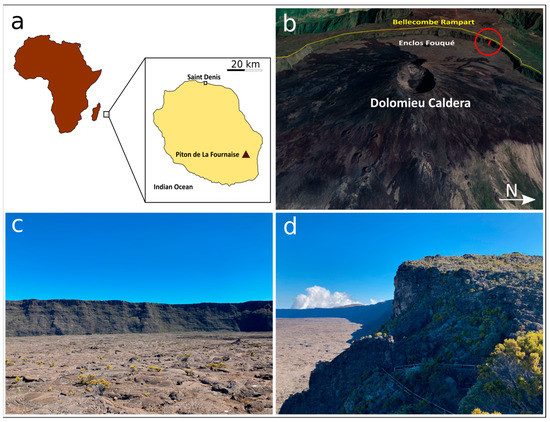
Figure 1.
(a) Location of La Réunion Island and Piton de la Fournaise (21°14′33.0″ S, 55°42′32.0″ E); (b) Satellite view of the western sector of Piton de la Fournaise, including the Enclos Fouqué plain, the Rempart de Bellecombe and the sampling location (segment in the red circle); (c) view of the Rempart de Bellecombe from the Enclos Fouqué plain; (d) upper part of the sampled section along the Pas de Bellecombe.
In this paper, we report the results of geochemical, 2D and 3D petrographic investigations of the whole lava sequence forming the Rempart de Bellecombe cliff on the NW border of the Enclos Fouqué caldera (Figure 1). The sample set is represented by a set of 12 lava flow units outcropping sub-horizontally along an ~80 m high cliff plus 1 dike cutting the entire stratigraphic sequence. The results are then compared with previous data acquired by Albarède and co-authors [4] along the vertical cliffs of the older calderas cutting the western flank of the Piton de la Fournaise shield volcano.
1.1. Evolution of the Volcanic Activity
The Piton de la Fournaise volcano is located on La Réunion island (France), in the western Indian Ocean. The island is the summit of a 7 km high, 200 km wide volcanic edifice [5] constructed on the ocean floor located at 4 km below sea level. It is constituted by three volcanic systems: Piton des Neiges (PdN), Piton de la Fournaise (PdF), and Les Alizés. The volcanic activity of the island is related to a ‘hot spot’ that is supposedly responsible for the large basaltic province of the Deccan Traps in eastern India, formed about 65 Ma [6,7,8].
Piton des Neiges is the largest subaerial volcano, whose oldest products have been dated at ca 2.1 Ma [9,10]. Studies based on the average production rate of magmas indicate that the submarine edifice growth began at approximately 5 Ma [10,11].
The earliest activity of PdN has been recently re-estimated at about 27 kyrs [12]. Les Alizés is located on the south-eastern part of La Réunion and is considered a proto-Fournaise [5], since it is represented by poorly exposed and largely submarine remnants of a large volcanic edifice upon which the Piton de la Fournaise shield volcano sits [10,13]. Piton de la Fournaise is one of the most active basaltic volcanoes on Earth and is an ideal example of a shield volcano characterized by alternating phases of growth and partial collapse [6]. The lava piles forming the flanks of Piton de la Fournaise are exposed by deep valleys where the oldest lava flows have been dated at approximately 530 kyrs [14,15]. These belong to the plagioclase-rich Pintades lava unit [15,16], which can be observed at the base of all the lava sequences in the valleys located on the western flanks of the volcano. Geochronological [14] and geological studies [17] indicate that the construction of the volcanic edifice occurred in at least five phases [18,19]. The first (0.53–0.29 Ma) led to the formation of the ‘ancient shield’ whose center of activity was located within the Plaine des Sables area [6]. Deposits derived from debris flows interbedded with lava flows suggest that the edifice was subject to erosional processes. A major collapse event is indicated by the Rivière des Remparts caldera (250 Ma, [6]). The second phase is marked by a second caldera collapse at ca. 150 kyrs, named the Morne Langevin event [14]. This caldera was entirely filled ca. 80 kyrs ago by a >200 m thick lava pile, partially exposed by a third caldera collapse event at 60–40 kyrs, forming the Plaine des Sables cliffs. Following the Morne Langevin collapse event, the center of activity migrated to its current location [10]. Lavas emitted after the Morne Langevin event mark the transition from the ‘ancient shield’ to the ‘recent shield’. The ancient shield is characterised by two periods distinguishable thanks to the petrographic characteristics of the products, whereby the older (>400 kyrs) Pintades lavas are more porphyritic with plagioclase megacrysts, while the younger overlying ‘olivine lavas’ contain more abundant olivine [4]. The recent shield lacks plagioclase-rich lavas [6]. The youngest caldera collapse event corresponds to that which formed the Enclos Fouqué polylobate caldera, the earliest phase of which has been dated at ca. 4.5 kyrs [20]. Caldera collapse events have been systematically associated with large explosive eruptions whose pyroclastic deposits are widespread along its borders and on the volcano’s flanks [2,20].
The caldera displays a horseshoe shape and is bound by sub-vertical cliffs with heights of 80–200 m named Bois Blanc, Bellecombe and Tremblet, located to the north, west and south, respectively. The cone of Piton de la Fournaise is located in the center of the caldera, and at its top is the youngest and smallest (1 km wide) Dolomieu caldera, formed in 2007. The origin of the Enclos Fouqué caldera is still the subject of debate: it has been interpreted as the result of either a single and large landslide episode [3,21,22,23,24,25] or coalescent calderic collapses occurring after the emplacement of the Pas de Bellecombe lava flow, dated 5472 ± 130 yrs [2,10,16,26,27].
1.2. Petrological Characteristics
The basaltic magmas that erupted at La Réunion island derive form the partial melting (ca 10%) of a source located in the upper mantle [28] associated with limited compositional heterogeneities, as revealed by temporal variations in the isotopic composition of Nd [29]. The increase in the 143Nd/144Nd in the last 530 kyrs indicates that the contribution of an enriched component decreased in the plume [29,30]. As they ascended towards the surface, the magmas underwent crustal contamination with the earliest products of volcanic activity, as evidenced by the variability in 87Sr/86Sr ratios and the incompatible elements of the magmas erupted in the history of the island together with historical lavas [31,32]. The two main volcanoes at La Réunion island show a strong petrochemical affinity, with lavas at Piton de la Fournaise mainly being transitional basalts [33] that have been divided into four groups according to their specific geochemical signature [4,34,35,36,37], outlined by [38] as:
- The ‘Steady-State Basalts’ (SSB), representing the main type of basalts emitted by PdF. These products usually display a homogeneous composition (5–8 wt.% MgO; 0.5–1 wt.% K2O; 10–12 wt.% CaO) and a typically aphyric or poorly porphyritic texture, with phenocrysts represented mostly by olivine (>20% in rock volume) and minor clinopyroxene, ±plagioclase as phenocrysts [4]. SSBs are mostly emitted in the summit area of the volcano [38,39];
- Olivine-rich basalts, containing up to 60 wt.% of olivine and with a high and variable MgO content (8–28 wt.%), usually erupted on the flanks of the volcano during eruptions with high emission rates or in the final phases of the eruptions that started with the emission of SSB basalts [38,40,41]. The mm- to cm-sized olivine phenocrysts of these products have been interpreted as antecrysts derived from crystalline mush within dikes [42] or detached from cumulitic bodies or magma reservoirs located at a shallow depth [4,43,44,45];
- Differentiated Alkaline Lavas (DAL) represent a relatively rare group, mostly outcropping at the base of the PdF shield edifice. They are more evolved and alkali-rich (1 < MgO < 5 wt.%; 1 < K2O < 4 wt.%) than the recent products and contain abundant feldspar indicative of shallow magmatic activity which mostly occurred in the early stages of the volcano’s history [4,46,47,48]. The notable abundance of plagioclase in these products has been interpreted as cumulitic in origin, resulting from the dismantling of anorthositic mush in the shallower portions of magma chambers formed during a decrease in magmatic flux and potentially attributable to the older Le Alizés volcano [49].
- The “Abnormal Basalt Group” (AbG) represents a fourth group of lavas, mostly outcropping on the volcano flanks and rare inside the Enclos Fouqué caldera [4,8]. These magmas are relatively depleted in CaO and SiO2 and enriched in FeO, TiO2 and K2O with respect to SSBs. The AbG lavas have alkaline affinity (7.5–10 wt.% MgO; 0.9–1.2 wt.% K2O; 8.5–10 wt.% CaO) and often transport ultramafic enclaves to the surface, these having been ripped from a depth near the mantle–crustal underplating layer [8]. Geophysical and geochemical data associated with their surface emission indicate that these magmas rose from areas at a greater depth than the other products emitted at PdF [44,50,51], having experienced differentiation at the mantle-crust underplating layer (10–15 km b.s.l.), where they are subject to CO2 flushing, magma mixing, crystal recycling/assimilation and contamination with partial melts from metasomatized cumulates [52]. Previous studies [53] have shown that the NW rift zone situated on the volcano’s flank represents a young and active corridor of SSB magmas surrounded by large-volume AbG-type eruptions.
2. Materials and Methods
2.1. Sampling
Sampling of the entire lava sequence forming the Bellecombe cliff was carried out by collecting one sample from the dense core of each lava unit along the vertical section, from its base on the floor of the Enclos Fouqué caldera (2240 m a.s.l.) to the top of the Rempart (2314 m a.s.l.) (Figure 1). A total number of 12 lava samples were collected. This sequence is of particular interest since it allows us to fill a gap in our knowledge regarding the products emitted between the older lavas of the Rivière des Remparts and Langevin cliffs, older than 150 kyrs, and the more recent products (<5.5 kyrs) emitted by Piton de la Fournaise. The choice of investigating this particular sector of the caldera wall was taken because: (i) the site corresponds to the intersection of the NW rift zone with the Enclos Fouqué caldera wall, (ii) the site displays a rare and thick (>2 m) dike crossing the entire sequence in an NW direction, a quite rare occurrence along the caldera walls that show very few intrusive structures, and (iii) the lava at the top of the caldera has been dated at 5.5 kyrs by Bachèlery [16].
2.2. Geochemical Analysis
Major element analysis was performed at the technical platform “Rayons X”-Université de Paris with an X-ray fluorimeter Epsilon 3xl (Malvern-Panalytical) equipped with an Ag X-ray tube operating under He atmosphere, with four conditions during 120 s: 5 kV–60 µA without a filter for the analysis of Na, Mg, Al and Si; 10 kV–30 µA with a 7 µm titanium filter for the analysis of P; 12 kV–25 µA with a 50 µm aluminum filter for the analysis of Ca, K and Ti; 20 kV–15 µA with a 200 µm aluminum filter for 120 s for the analysis of Mn and Fe. All samples were melted into “beads” prepared by mixing 0.1136 g of the sample, 1.2312 g of the fluxing agent (LiBO2/Li2B4O7) and 0.0187 g of the non-wetting agent (LiBr) in a platinum crucible in order to avoid matrix and grain size effects. The mixture was heated to 1050 °C for 25 min in a fusion instrument (LeNeo fluxer, Claisse). Calibration curves were obtained from identical beads of 14 geological reference materials (ACE, ANG, BCR-2, BEN, BHVO-2, BIR-1, BXN, DTN, FKN, GSN, MAN, Mica-Fe, Osh BO, UBN and BR24). The curves are perfectly linear over the entire concentration range. Analytical uncertainties (±1 s) are <5% for TiO2, MnO and FeO, 5% for MgO, SiO2 and CaO, 10% for Al2O3, P2O5 and K2O and 20% for Na2O. All reported data are the mean values of three duplicate analyses.
Trace elements were determined by ICP-MS analysis. The powdered samples underwent solid sample digestion carried out in cleaned 50 mL SCP Science Teflon tubes on an Analab hotplate fitted with a Teflon rack. Around 50 mg of rock powder and 200 µL of a 12.5 ppm indium internal standard was added to each tube. Digestion was then performed using 4 mL of a 1:1 mixture of bi-distilled HNO3 (69%) and HF (50%) acids. Complete digestion was achieved after heating the rock–acid mix in closed vessels at 120 °C for 24 h. After that, 3 mL of bi-distilled HNO3 was added to each tube, which were then heated for another 24 h at 120 °C. Once cooled, the volume of the solutions was completed to 50 mL using ultrapure water. The solutions were then sonicated for 4–6 h and left still for at least 24 h. Prior to ICP-MS analysis, 0.5 mL of this solution was sampled and diluted to 5 mL in 15 mL falcon tubes. The final dilution factor (from solid to solution) of the analyzed solutions was approximately 10k. Elemental concentrations were assessed using an Agilent 7900 quadrupole ICP-MS. Elements with masses between that of sodium (23) and arsenic (75), as well as silver (107), cadmium (111) and gadolinium (157), were measured using a collision-reaction cell with helium gas (5 mL/min) to remove polyatomic interferences. All other elements were measured without collision gas. The indium internal standard was measured to correct for dilution, matrix effects and instrument drift. A BE-N certified reference material, digested along with the other samples, was measured every six to nine samples to correct for the potential signal drift unaccounted for by the internal standard. The BE-N standard was then used to convert sample counts to concentrations. Uncertainties were calculated using error propagation equations and considering the combination of the standard deviation on replicated consecutive signal acquisitions (n = 3), the internal-standard ratio and blank subtraction. The non-linear term (internal-standard ratio) was linearized using a first-order Taylor series expansion to simplify error propagation. Additional BE-N, BHVO-2 and BCR-2 CRMs were measured to assess the quality of the whole procedure.
2.3. Textural Analysis and Mineral Chemistry
A general overview of the 13 thin sections was performed by an optical microscope. The porphyritic index (PI—total phenocrysts area%) and 2D bubble content were measured with a manual point counter mounted on the optical microscope on the same specimens. Mineral chemistry and textural investigations on high-contrast back-scattered electron (BSE) images were carried out on polished thin sections by means of a Tescan Vega-LMU scanning electron microscope (SEM) equipped with an EDAX (Energy Dispersive X-ray) Neptune XM4-60 microanalyzer. The detector operates through an energy dispersive system characterized by an ultra-thin Be window associated with an EDAX WDS LEXS (Low-Energy wavelength dispersive X-ray Spectrometer) calibrated for the light elements. In order to obtain high-resolution (BSE—Back-scattered electron) images, the operating conditions were set to a voltage of 20 kV and a beam current of 8 nA, while to analyze chemical element abundances, the beam current was set to 0.2 nA. Chemical analysis on crystals was performed on the core and rims of phenocrysts (>500 μm), microphenocrysts (200–500 μm) and groundmass (<200 μm).
2.4. X-ray Computed Microtomography and 3D Image Analysis
The study of the vesicle phase of selected samples was performed by the analysis of 3D images acquired by X-ray computed microtomography. Acquisitions were performed at the Tomolab laboratory of the Elettra synchrotron facility in Trieste (Italy). The imaging setup consisted of: (1) an X-ray source (Hamamatsu L12161-07), (2) a positioning system with micrometer precision steps and (3) a liquid-cooled sCMOS detector (a Ximea equipped with the Gpixel GSENSE6060 squared sensor with 37 MPixels, each one with a lateral size of 10 µm) coupled with a 150 µm thick CsI scintillating screen. The X-ray source operated at a voltage of 85 kV, a current of 118 µA and a focal spot size of 7 µm. The low-energy component of the emitted spectrum was filtered by means of 0.2 mm of Cu to harden the beam and avoid beam-hardening effects. The source-to-sample distance was set to 118 mm, while the source-to-detector distance was set to 324 mm. A 2 × 2 on-chip pixel binning mode was set such that, considering the optical magnification, the equivalent pixel size of acquired images corresponded to 7.3 µm, while the imaged field-of-view was nearly 22.4 mm × 22.4 mm. A set of 1800 equally spaced projections were acquired over an angular range of 360° with an exposure time of 4 s/projection. Acquired projections were processed with conventional flat-fielding and ring artifact removal correction. Image reconstruction was performed with a standard Feldkamp, Davis and Kress (FDK) algorithm [54] for cone-beam geometry and additionally corrected for beam-hardening effects.
Image analysis was performed by selecting a representative volume of interest of each sample from the original 3D images and extracting the vesicle phase using the manual thresholding approach of Fijii software [55]. The quantification of the bubble amount and morphology was then performed using the PyPore3D software library [56]. The 3D visualization of the images was obtained by the commercial software VGStudio MAX 2.0 (Volume Graphics).
3. Results
3.1. Geochemistry of the Bellecombe Lava Sequence
Most of the investigated samples have a basaltic composition characterized by tholeiitic affinity (with the exception of the BC4 and BC5 lavas that show moderate alkalinity (Table 1 and Figure 2), a narrow range of SiO2 content (47.31–49.98 wt.%) and a variable content of alkali (2.53 < Na2O + K2O < 4.58 wt.%), with an Alkalinity Index (AI = (K2O + Na2O − 0.37 × (SiO2 − 39))) ranging between −1.09 and 0.55).

Table 1.
Results of major and trace element analysis determined by XRF.
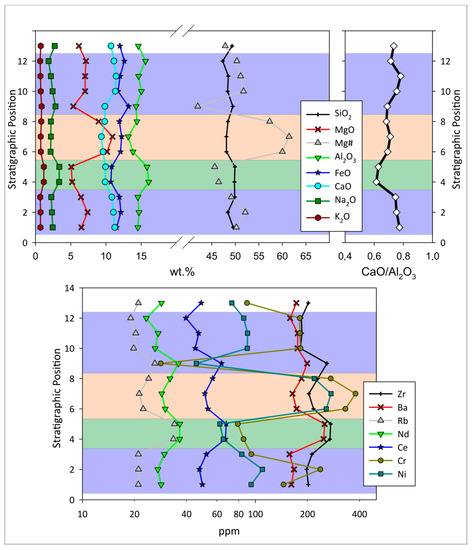
Figure 2.
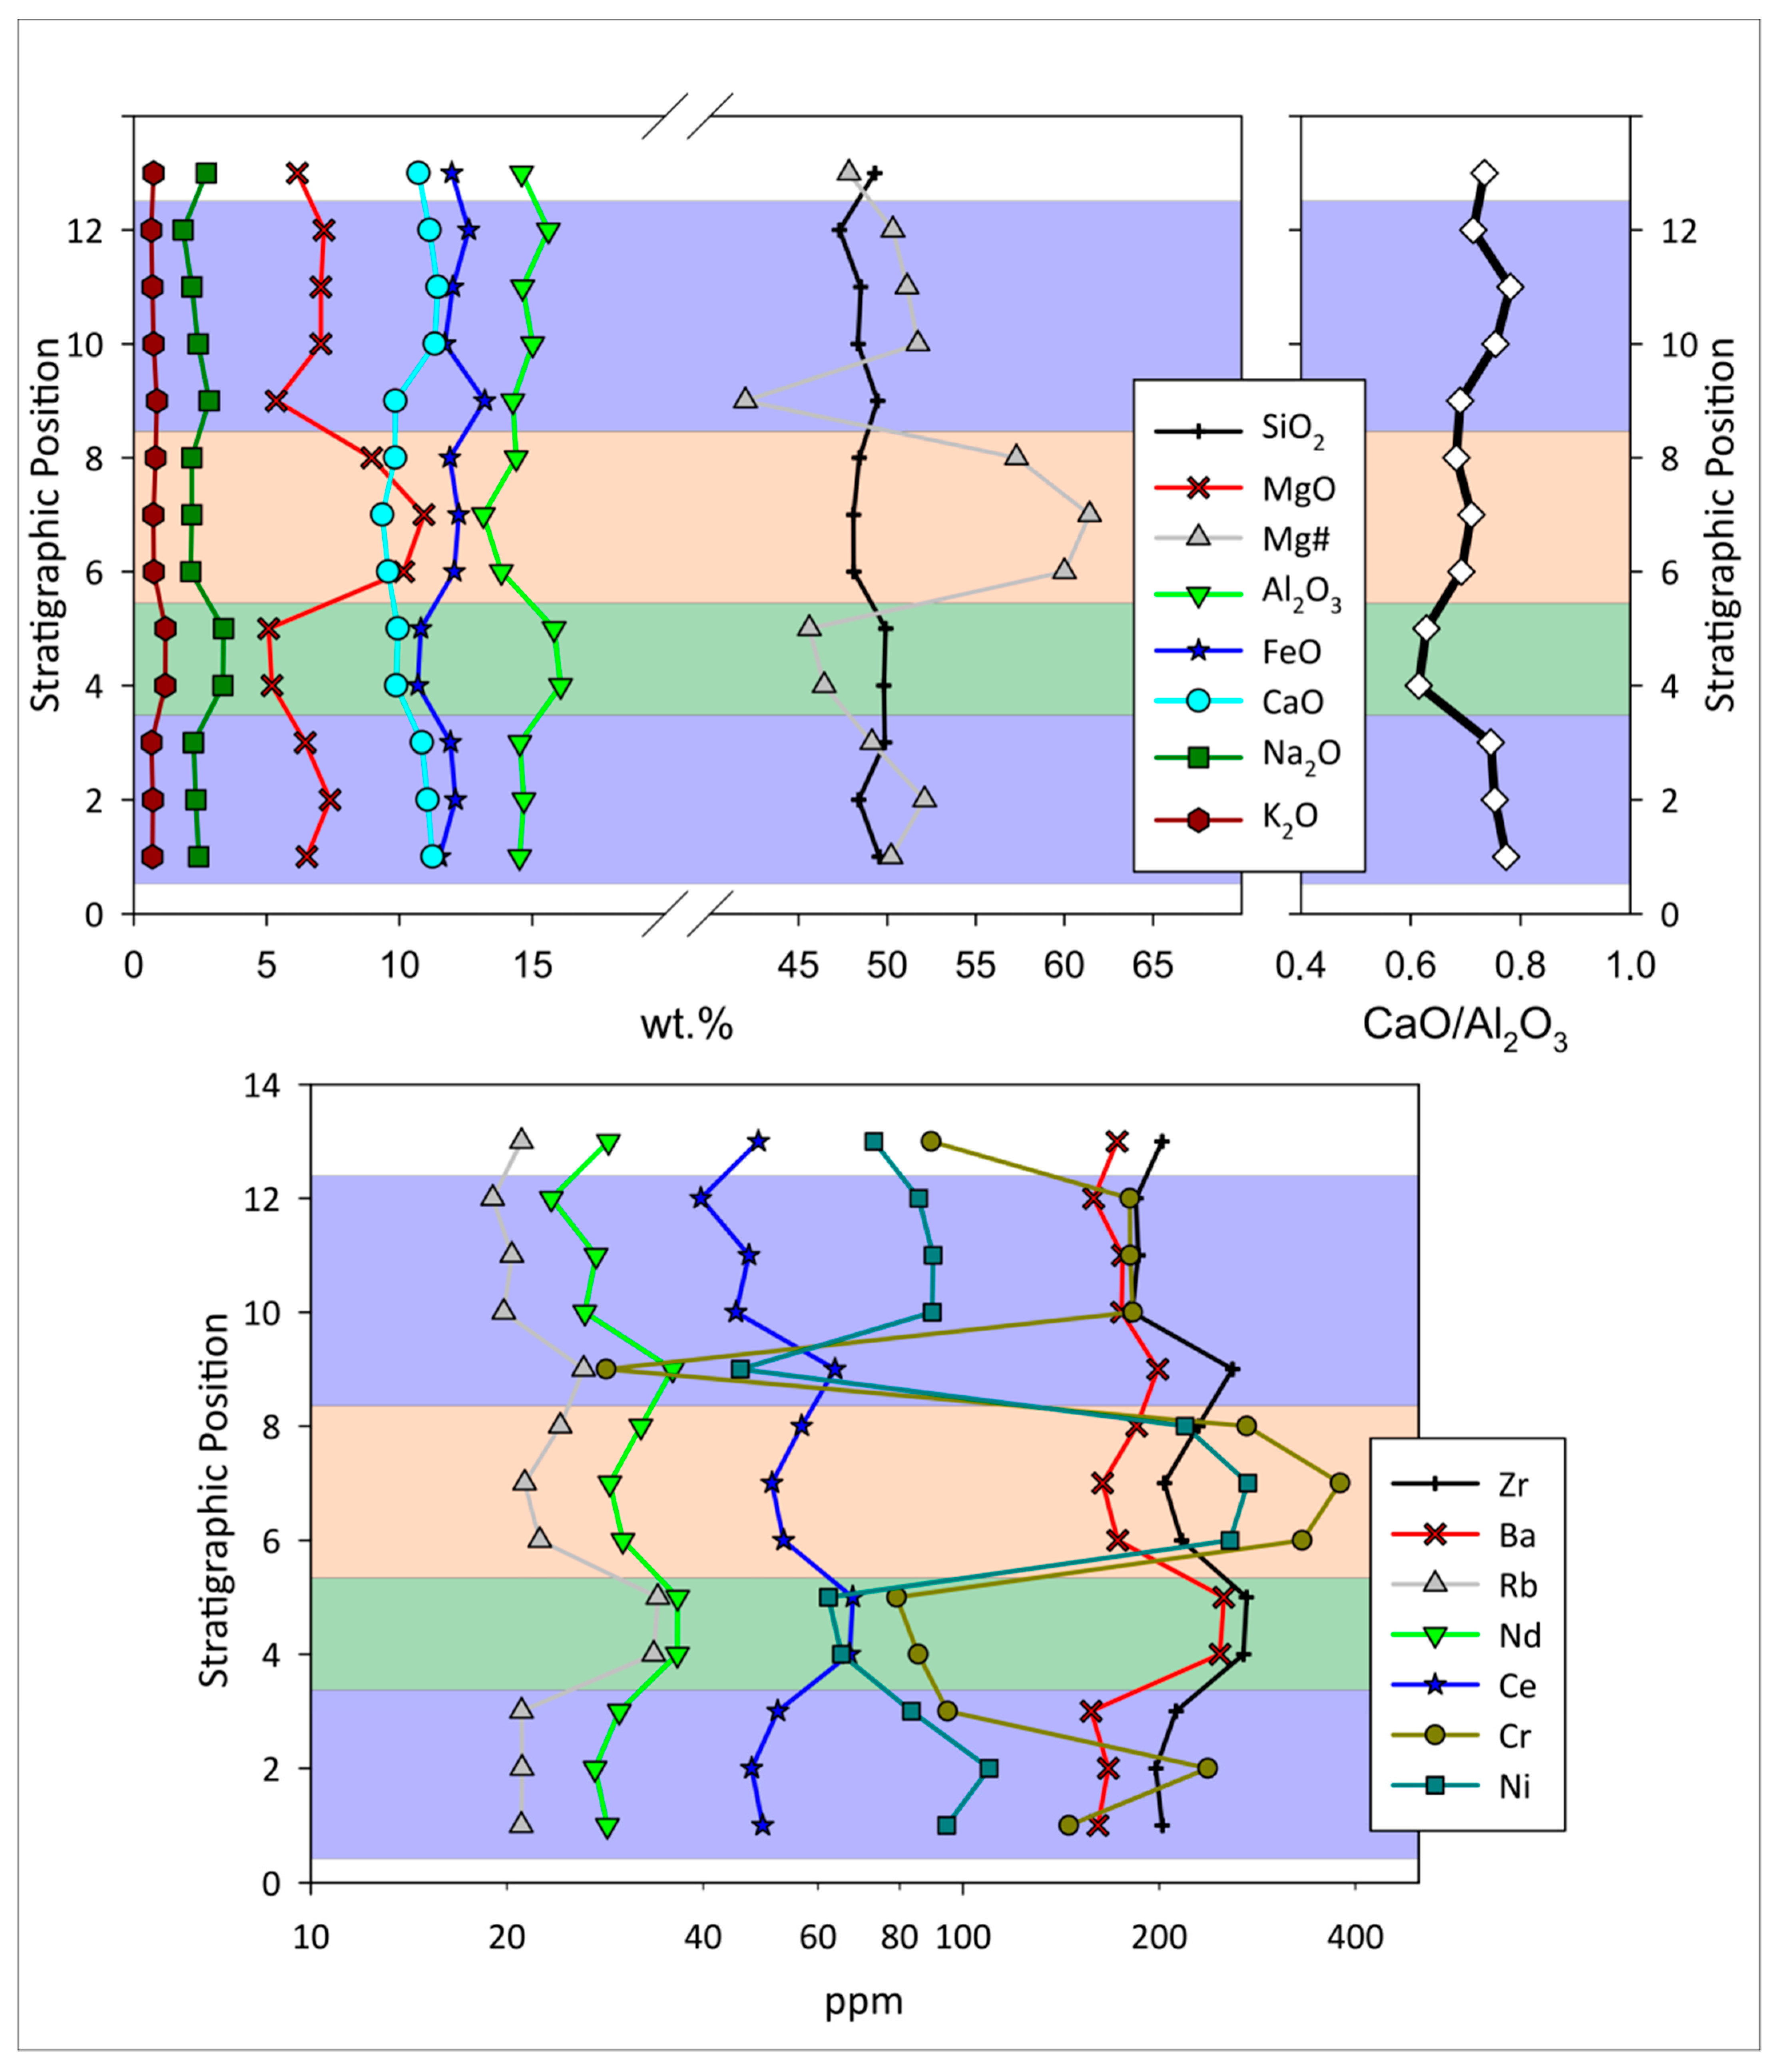
Variations of the major and element trace composition of the lava flows outcropping along the vertical section of the Rempart de Bellecombe; Stratigraphic position 1 corresponds to the BC1 sample, at 2240 m a.s.l.; position 12 corresponds to the top of the sequence, sample BC12 at 2314 m a.s.l.; Position 13 is the BCD dyke.
On the basis of whole-rock and trace element compositions and considering the classification of [4] the products of Piton de la Fournaise, the investigated lavas have been divided into three groups, namely, Steady State Basalts (SSB = BC1-3 and BC9-12 + BCD), the Abnormal Basalt Group (AbG = BC6-9) and Differentiated AbG lavas (DAL = BC4-5).
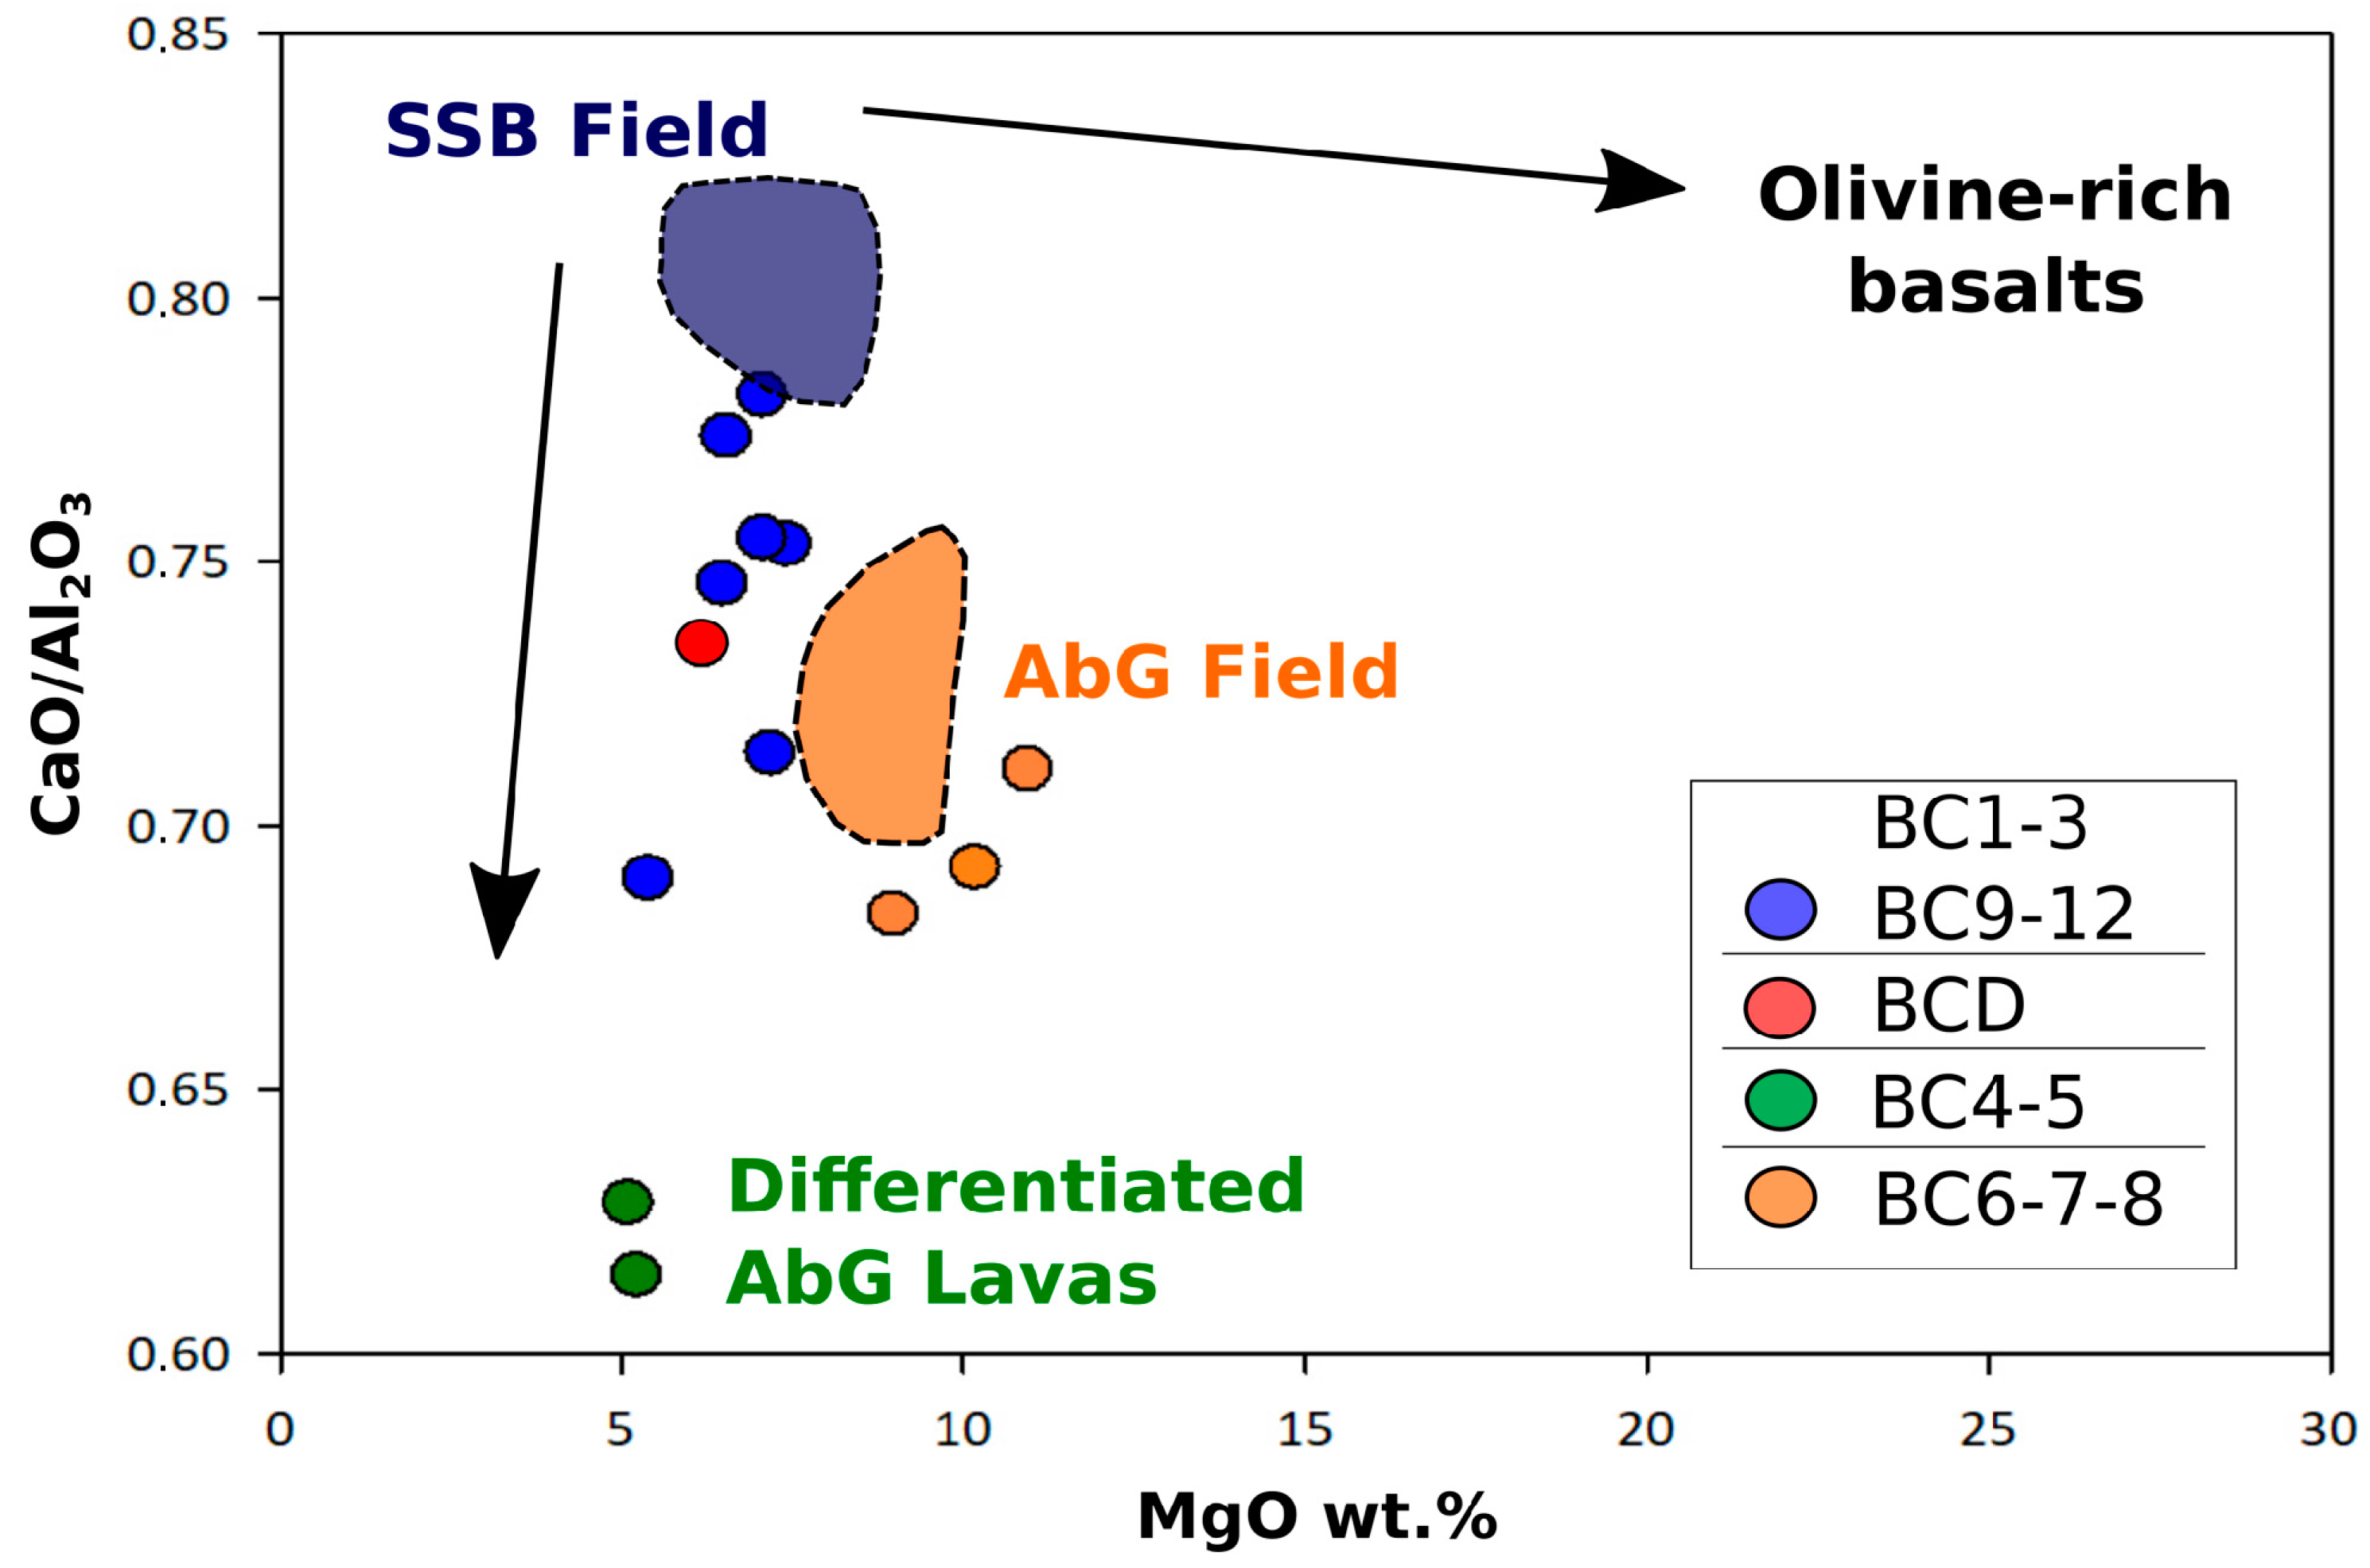
The lavas at the bottom (BC1-3) and at the top of the sequence (BC9-12) and the dyke (BCD) cross-cutting the entire sequence display a range of compositions that fit a SSB fractionation trend [4]. This is characterized by a decrease in CaO/Al2O3 and MgO toward the most evolved products (Figure 3), attributed to the fractionation of clinopyroxene and minor plagioclase.
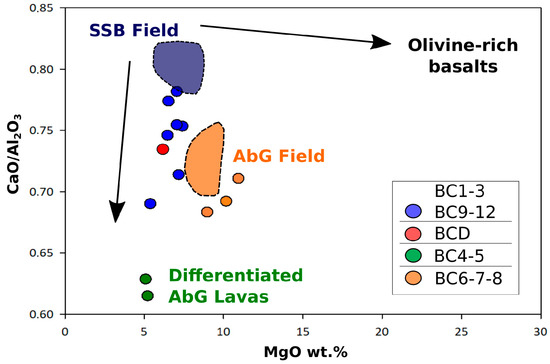
Figure 3.
MgO vs. CaO/Al2O3 diagram showing the composition of the Bellecombe lavas and the Steady-State Basalts and Abnormal basalt Group fields reported in [4,38].
The central part of the sequence displays lavas with AbG and differentiated AbG features. In particular, samples BC4 and BC5, located in the mid-lower part of the Bellecombe sequence (Figure 2), show the lowest amount of MgO (5.08–5.21 wt.%), the lowest CaO/Al2O3 ratios (0.61–0.63) and a parallel increase in the alkali content, with higher K2O (up to 1.19 wt.%), Na2O (up to 3.8 wt.%) and AI (0.54–0.55) compared to the rest of the investigated samples (average values: K2O = 0.74 wt.%, Na2O = 2.33 wt.%, AI = 0.5). They can be considered as the products of a differentiation trend undertaken by the AbG magmas, which are represented by the following BC6–BC8 products. These lavas have the highest Mg content (MgO = 8.96–10.93 wt.%, Mg# 57.29–61.42, calculated as MgO/[MgO + FeO] mol.%, considering an Fe2O3/FeO ratio of 0.15) of the sequence (Table 1, Figure 2 and Figure 3), which overlaps with the typical AbG composition [4,8,52].
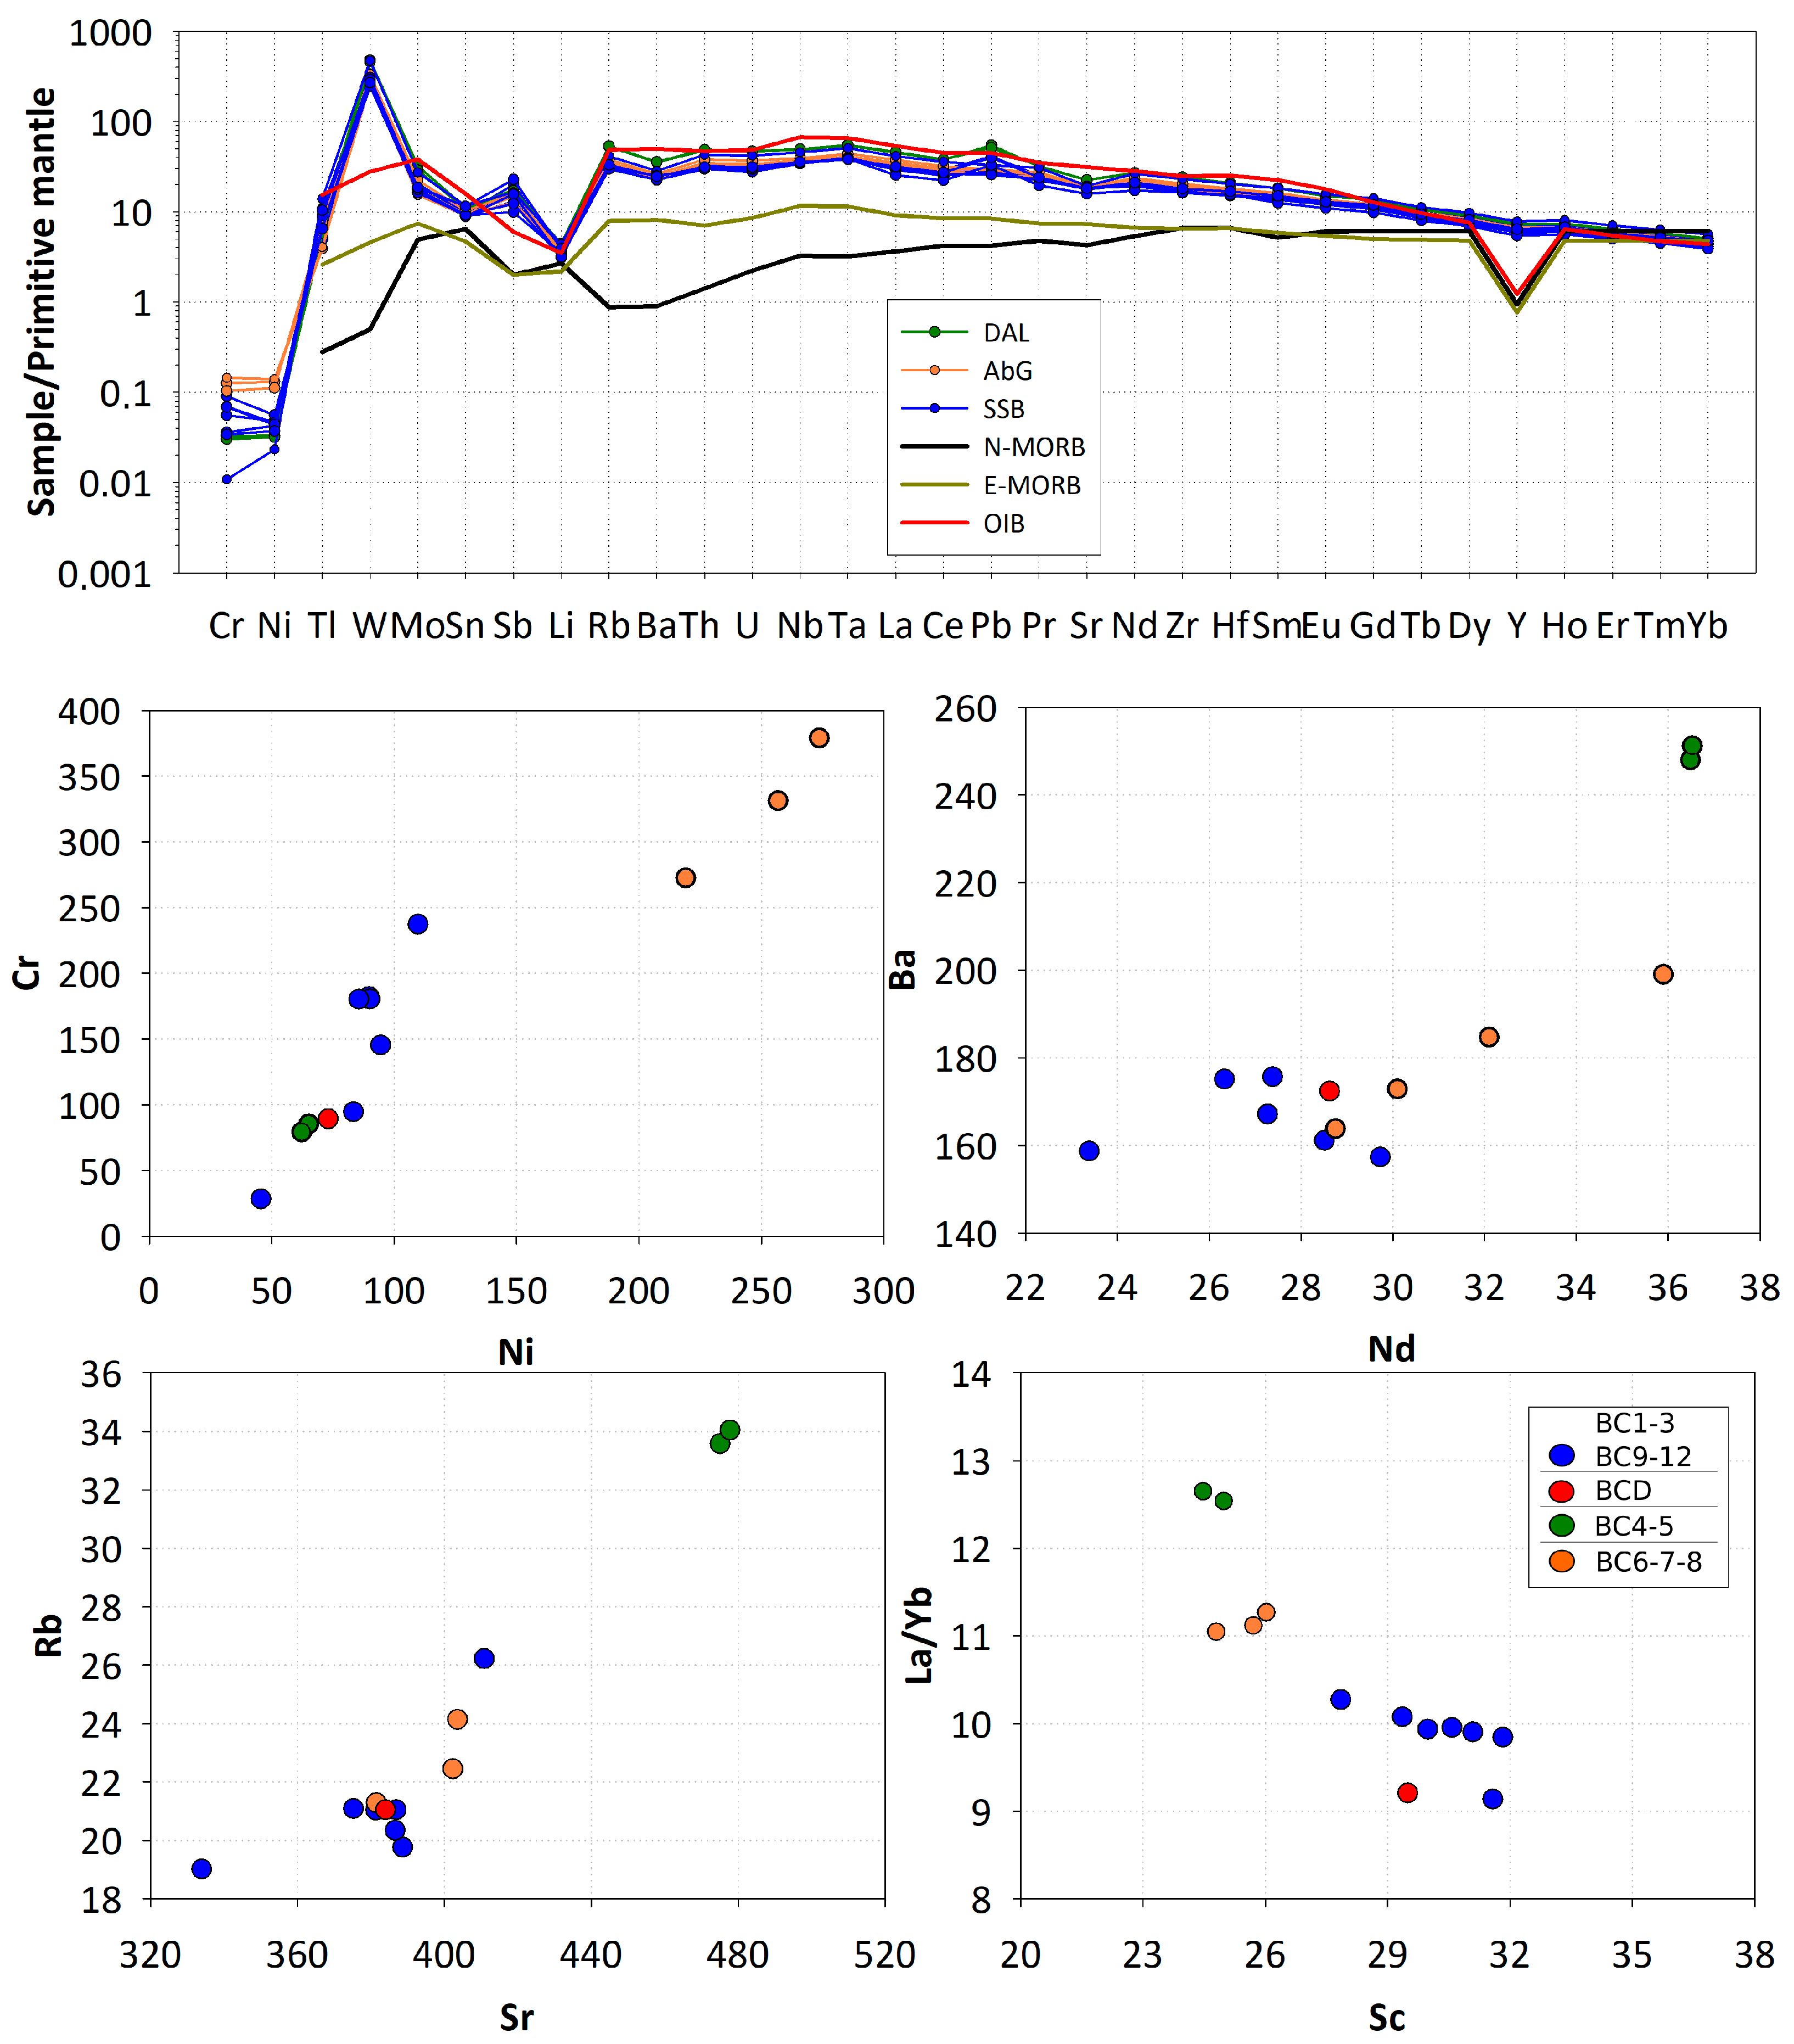
The spider diagram of trace elements amounts normalized to the primitive mantle [57] does not reveal any substantial difference among the samples, all showing considerable enrichment in incompatible elements (Rb, Ba, Sr, Zr) and depletion in Tl and Sb (Figure 4). Harker diagrams of selected trace elements display positive correlations for both compatible and incompatible elements (Figure 4). Regarding the bottom-to-top trend of the stratigraphic sequence, that of trace elements mirrors that of major elements, with Zr, Ba, Rb, Nd and Ce having their peak values in the most evolved lavas (BC4 and BC5) and Cr and Ni being enriched in the most primitive terms (BC6, BC7 and BC8), as expected (Figure 2). The La/Yb vs. Sc diagram (Figure 4) displays a clustering of the samples into three groups, with a progressive increase in La/Yb ratios and a decrease in Sc content from the SSB-like samples to the AbG and DAL samples. Low Sc contents have been attributed to the early fractionation of clinopyroxene at the mantle level [4,8], while the variability in La/Yb positively correlates with the Sr isotopic signature [30,45] and indicates some minor heterogeneity in the mantle sources.
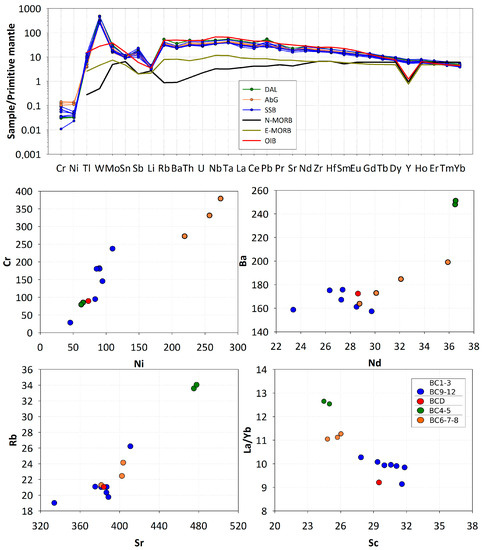
Figure 4.
Spider diagram of trace elements amounts normalized to the primitive mantle [57] and Harker diagrams of selected trace elements in ppm.
3.2. Petrography and Mineral Chemistry
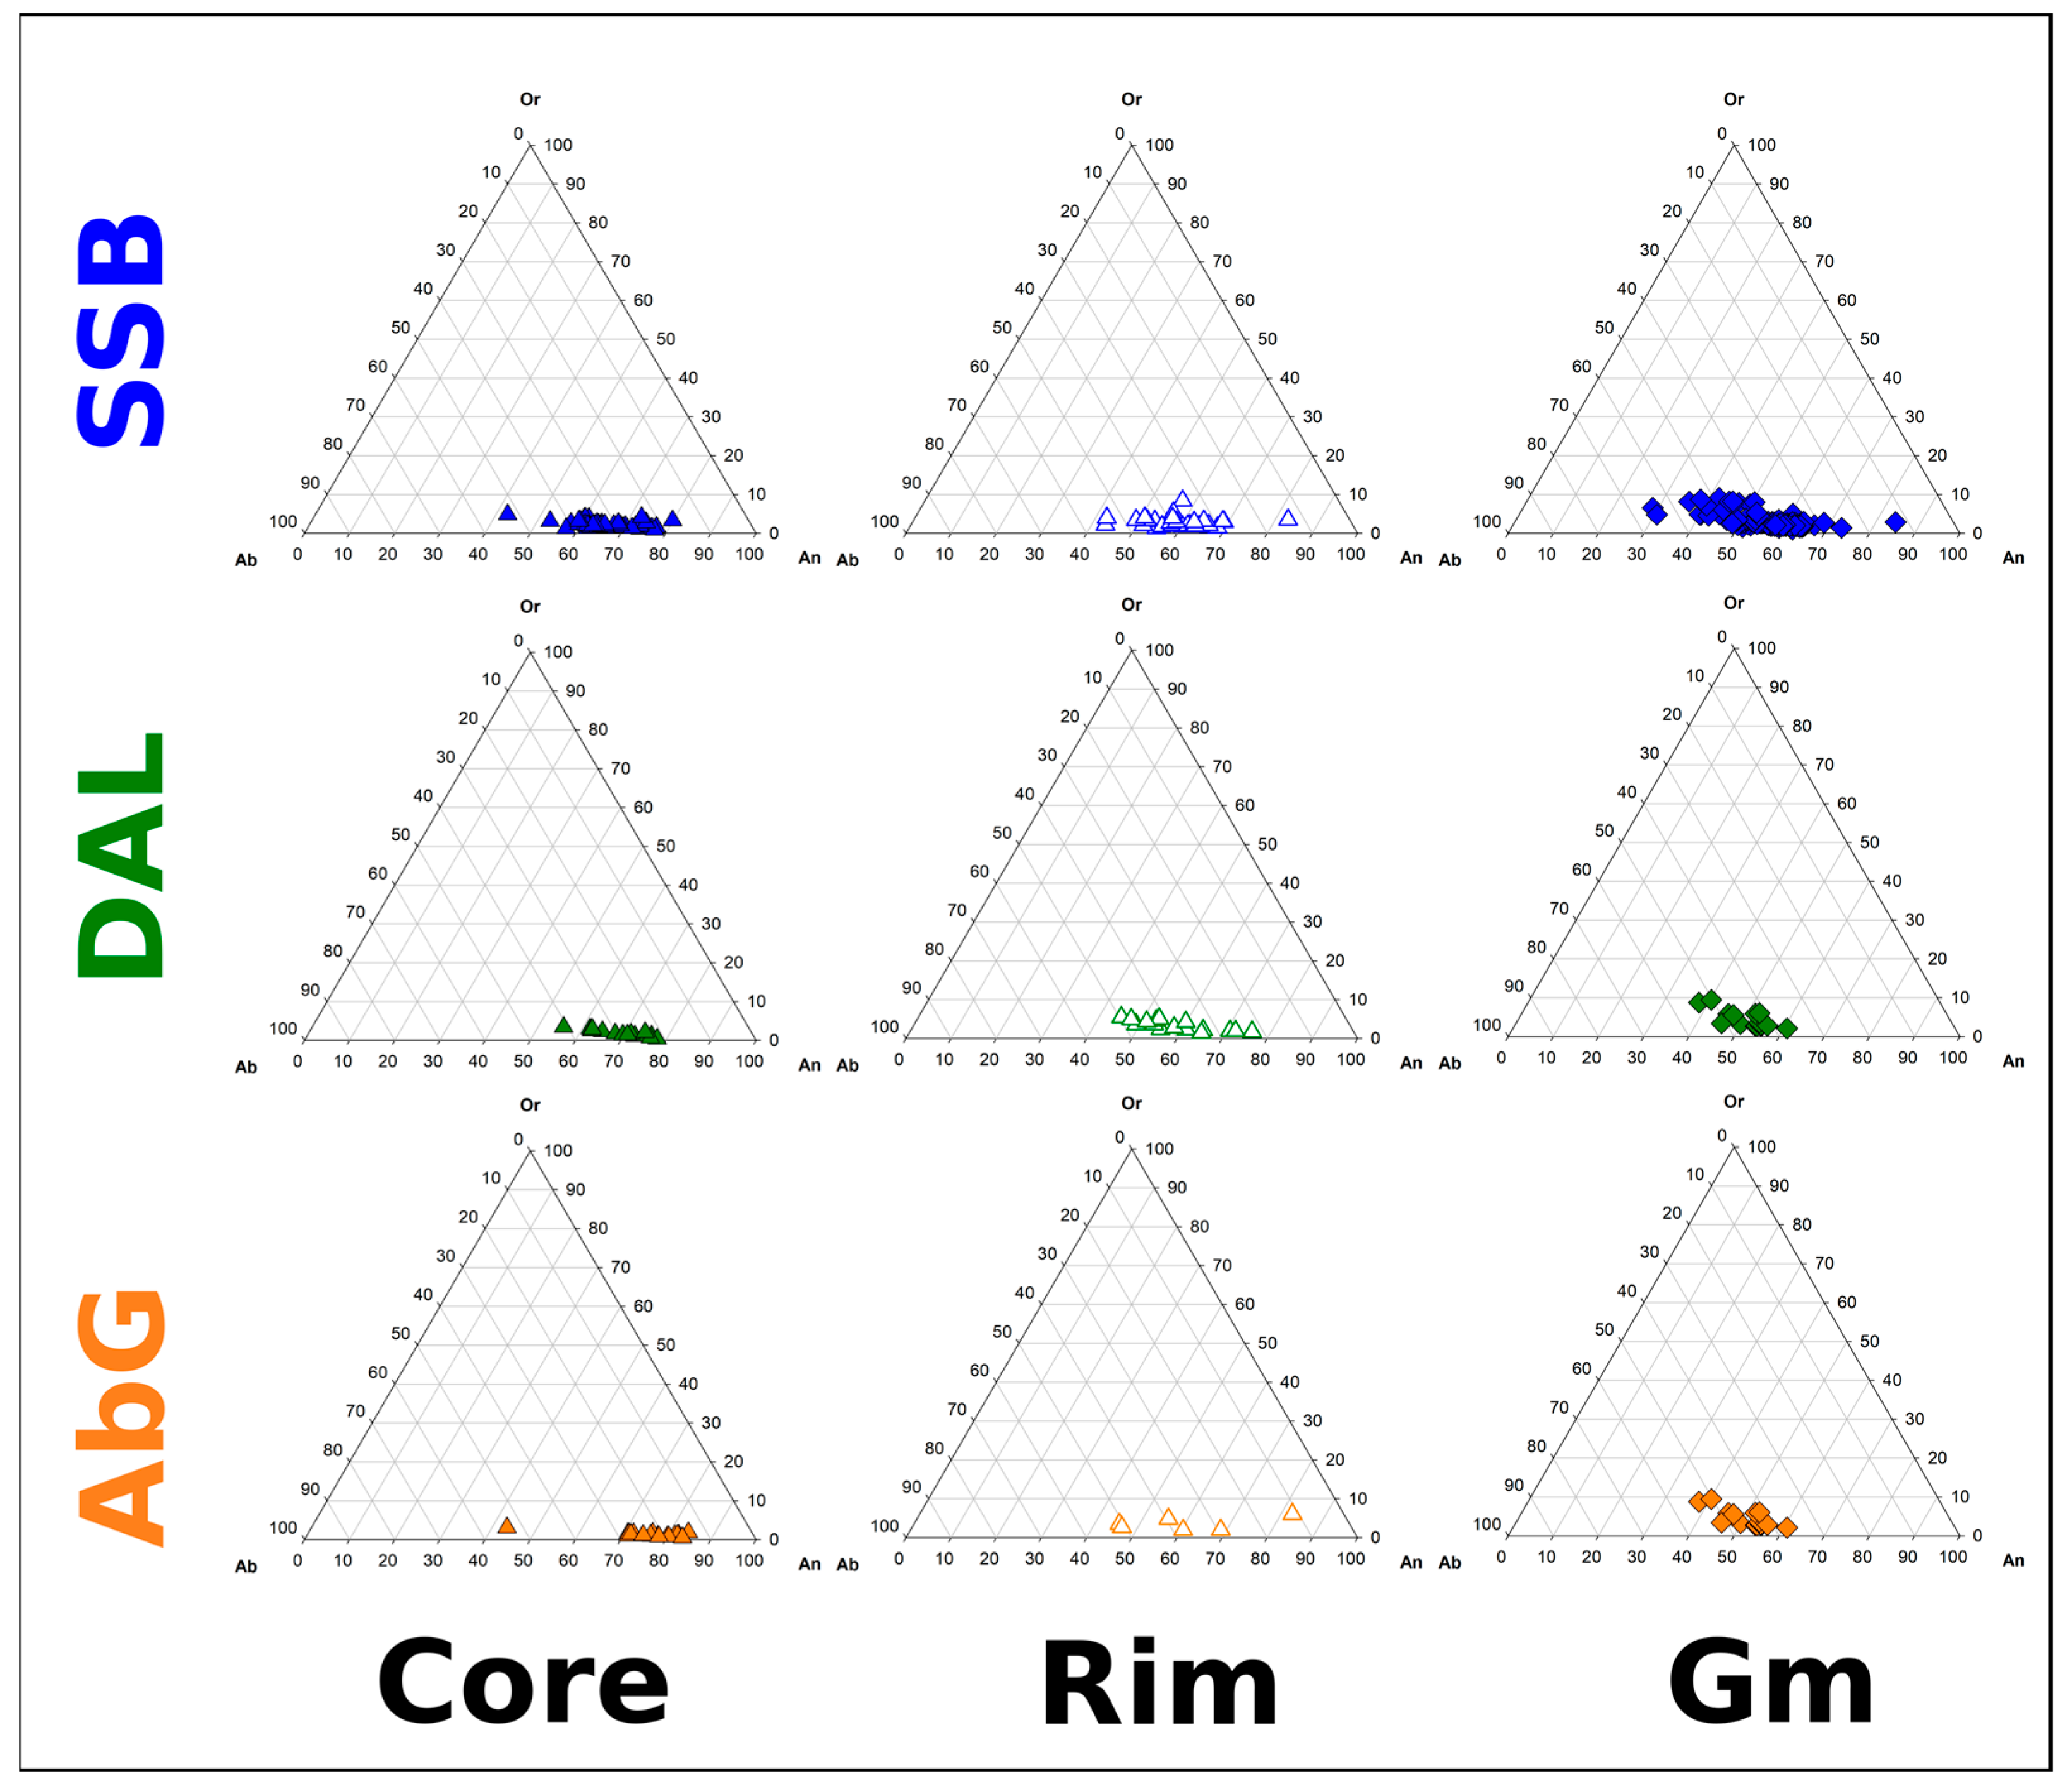
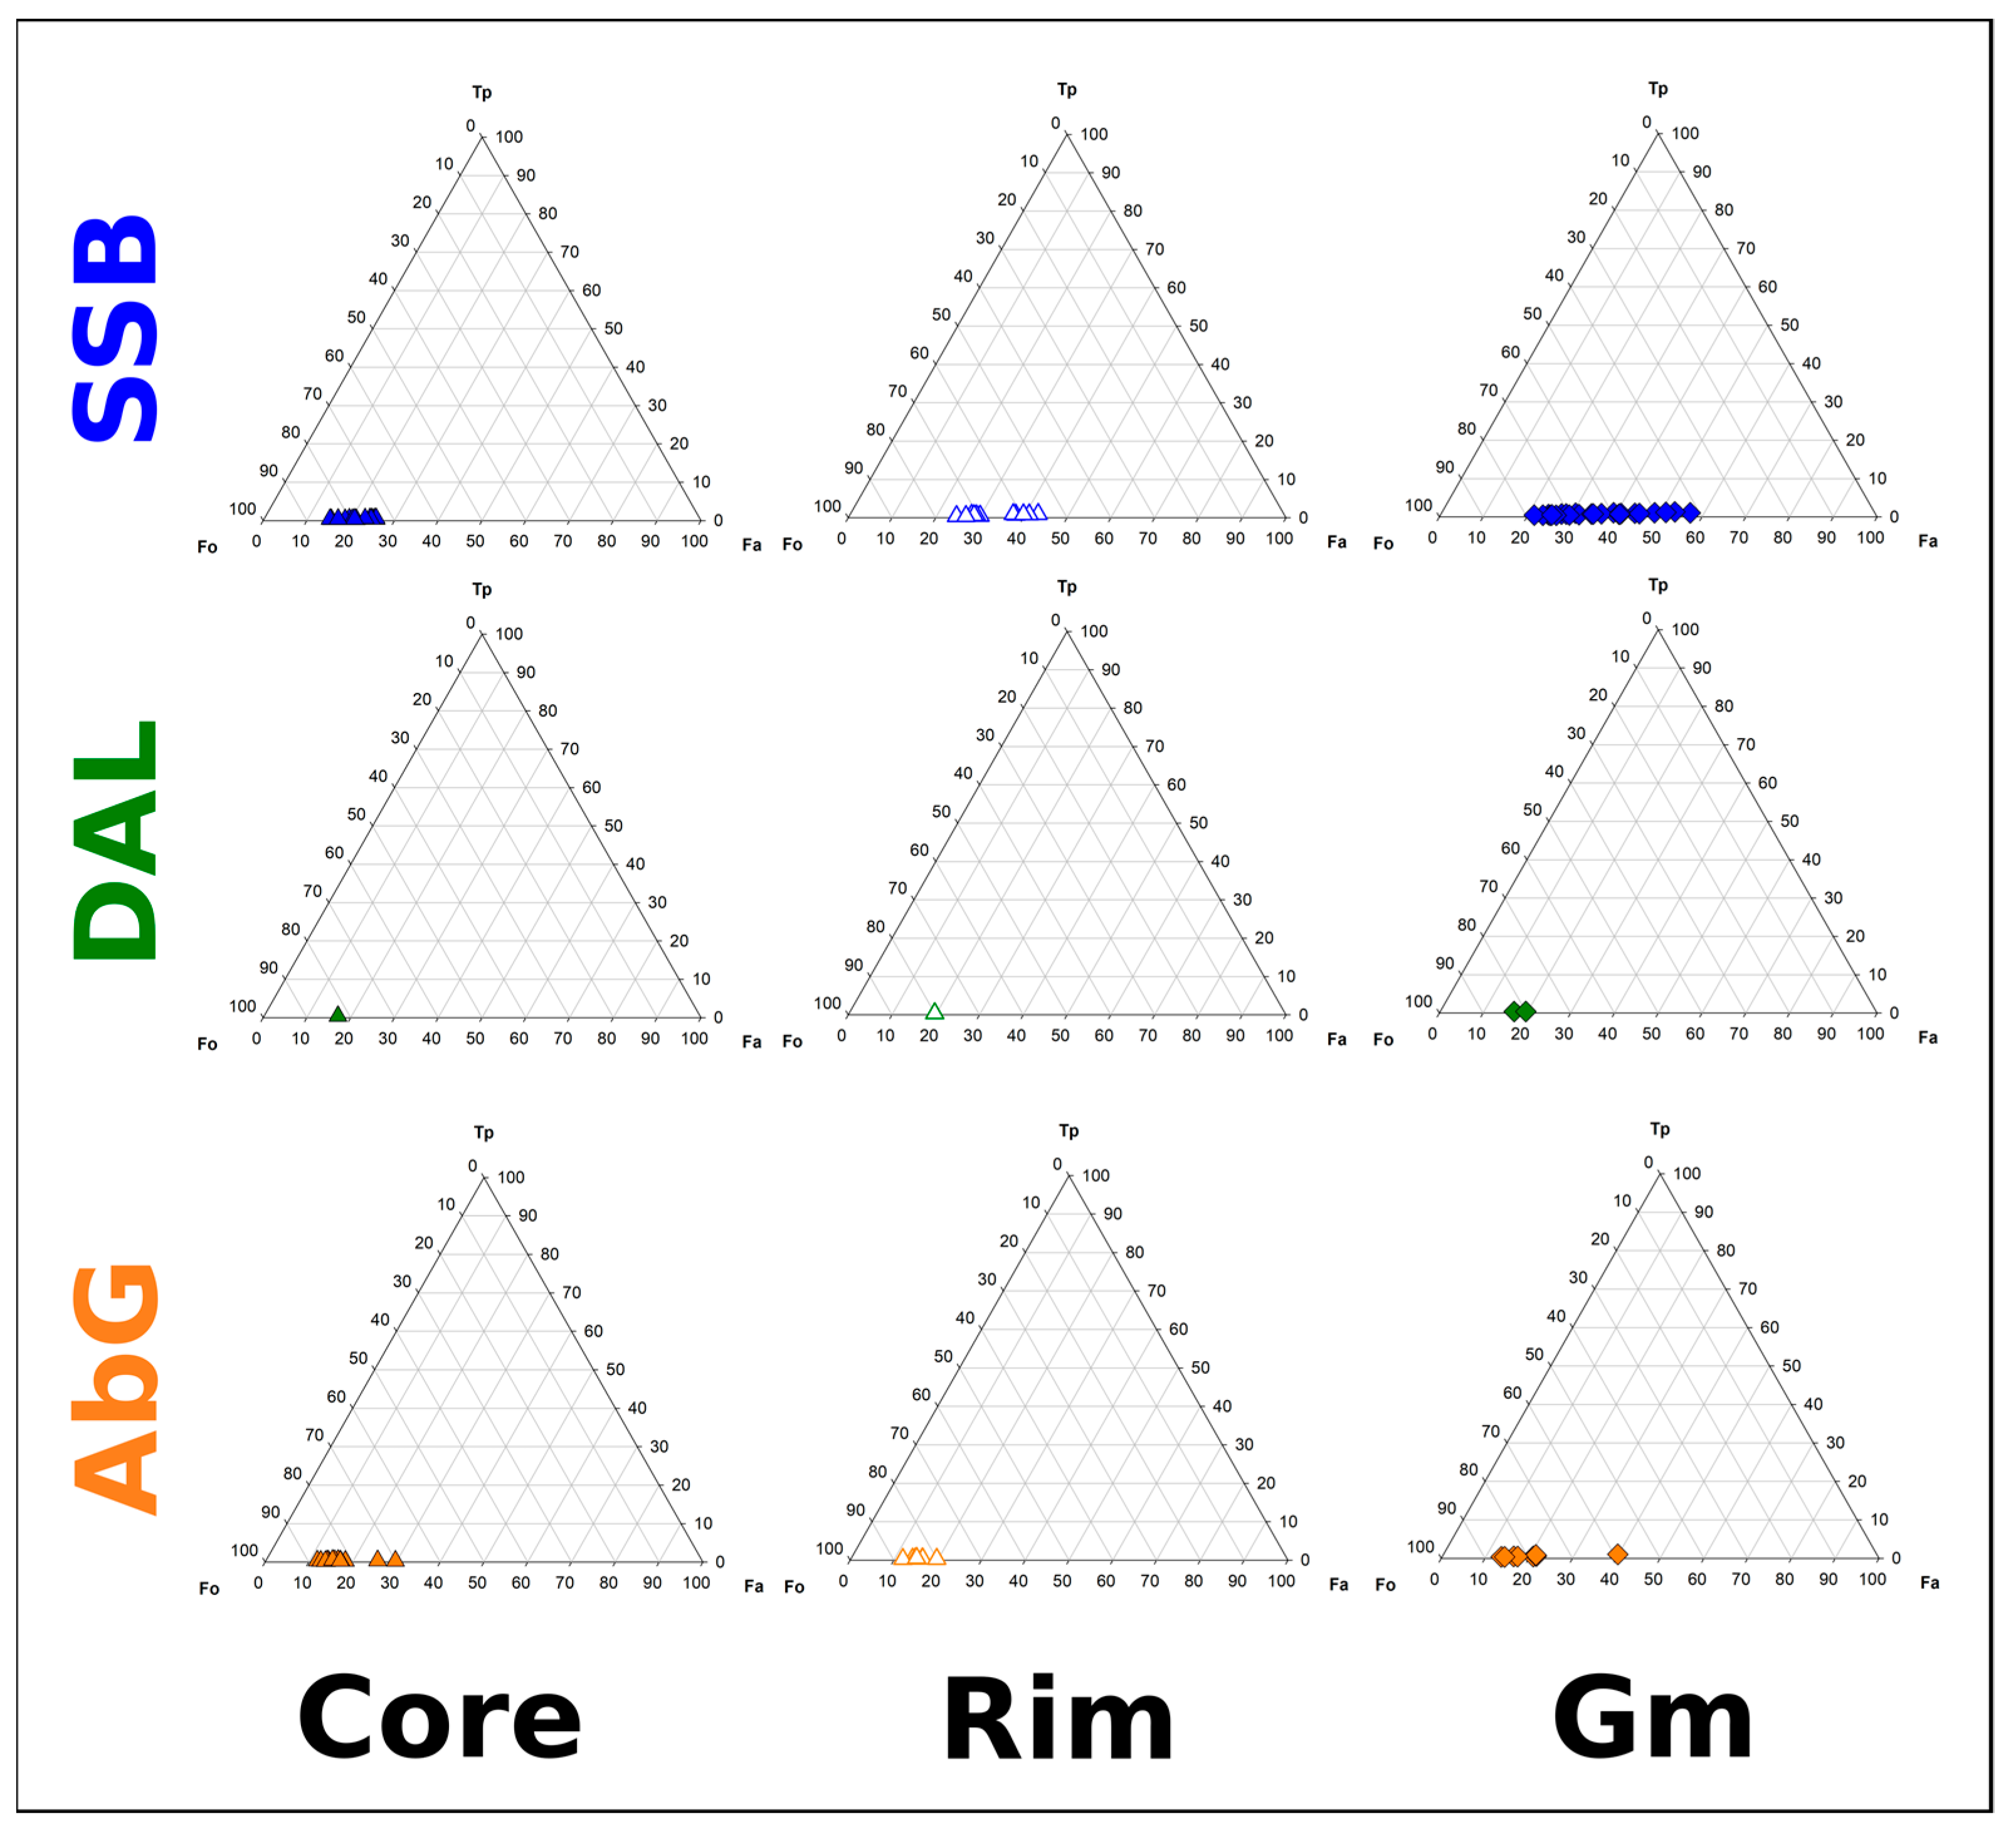
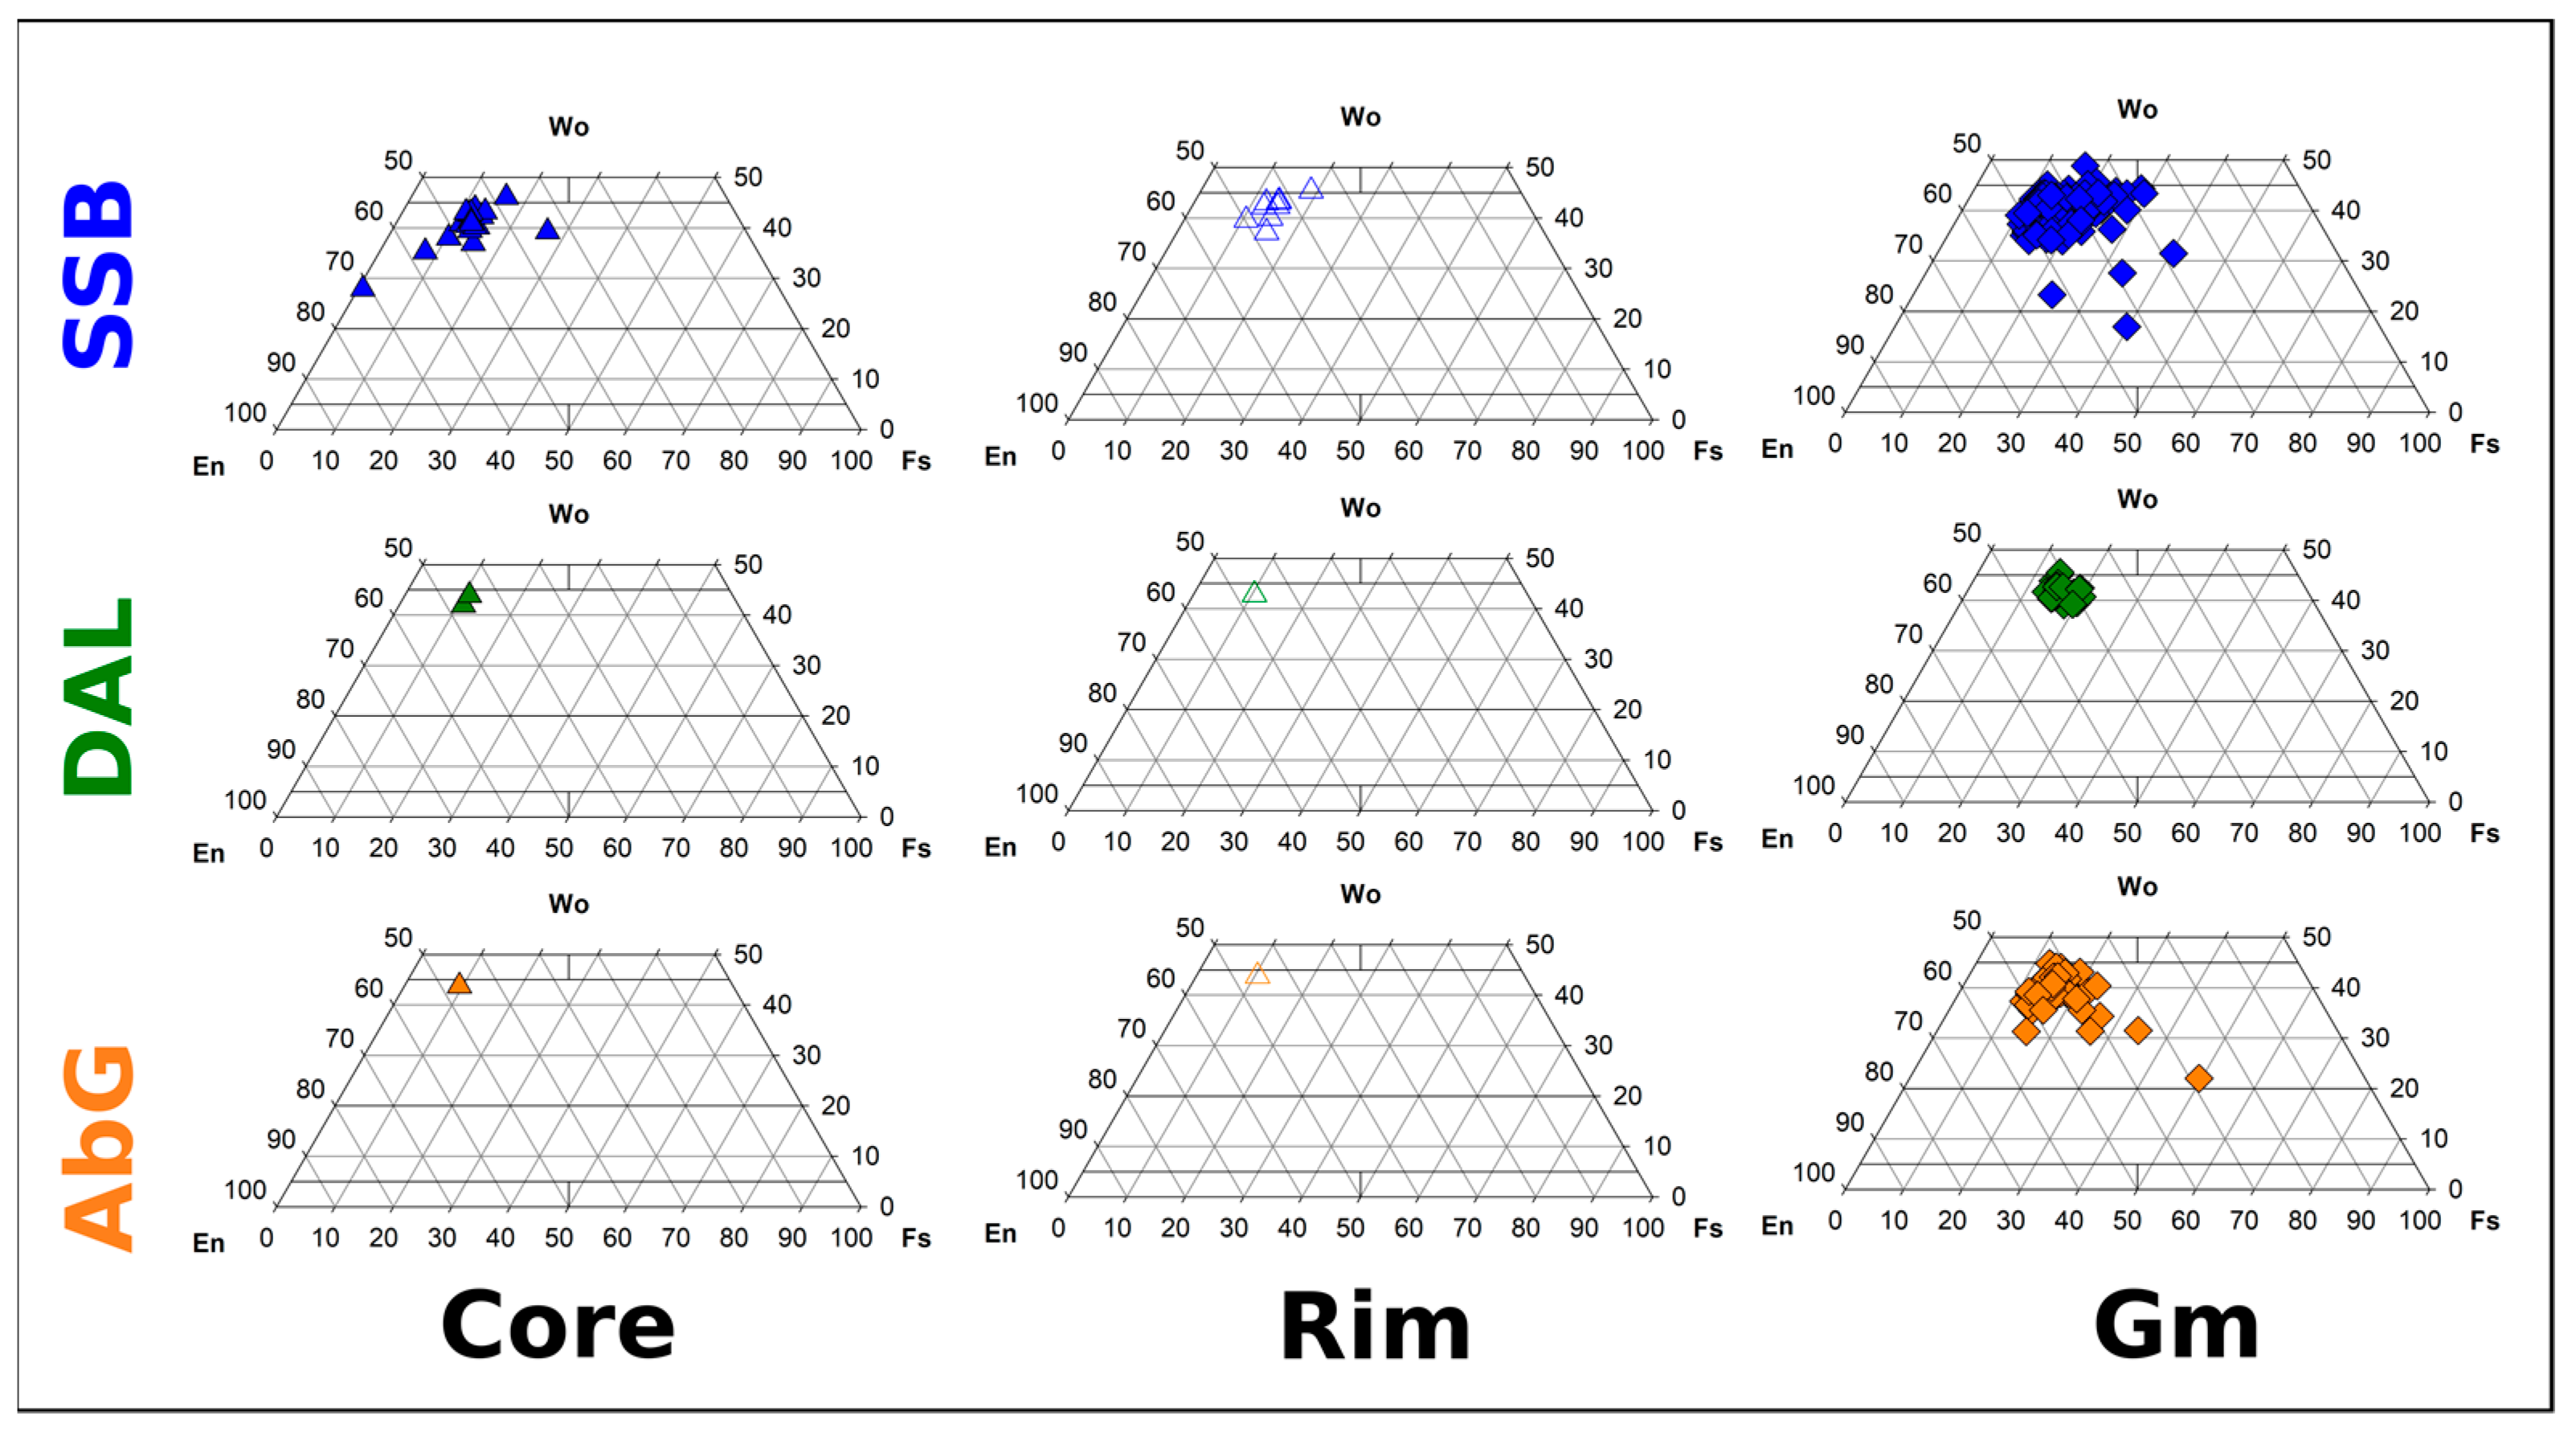
All thirteen samples demonstrate a relatively homogenous assemblage of minerals, consisting of phenocrysts (>500 µm), microphenocrysts (200–500 µm) and microlites (<200 µm) of plagioclase, clinopyroxene (mainly diopside or augite) and olivine, together with ubiquitous Fe-Ti oxide groundmass microlites with titanomagnetite composition (Figure 5). The samples primarily differ in terms of the relative amounts between different mineral phases, crystal sizes and crystal shapes. Texturally, the 13 analyzed samples are characterized by varying degrees of porphyricity (porphyritic index PI up to 32%) and pilotassitic groundmass, with the exception of the SSB samples BC1, BC2, BC3 and BCD, which are instead almost aphyric (Table 2). In Figure 6, Figure 7 and Figure 8, the compositions of plagioclase, olivine and clinopyroxene phenocrysts (core and rim) and groundmass are reported. The results of the SEM analysis of the mineral chemistry are reported in the Supplementary Material Table S1.
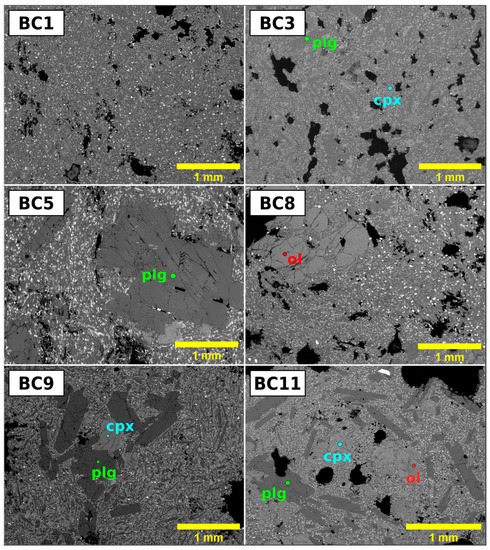
Figure 5.
Electron back-scattered images of thin sections from the investigated lavas showing the major textural features of the aphiric (BS1 and BS3) and porphyritic (BC5-8-9-11) samples. Plg = plagioclase, Cpx = clinopyroxene, Ol = olivine.

Table 2.
Results of 2D petrographic analysis of phenocrysts and vesicles abundance (area%).
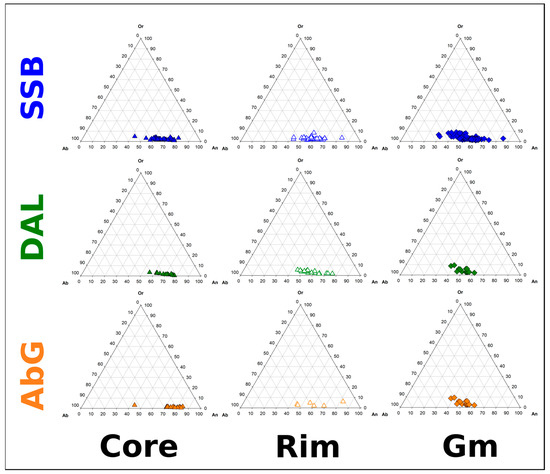
Figure 6.
Crystal composition of plagioclase phenocrysts core (full triangles) and rim (empty triangles) and groundmass microlites (diamonds) reported in the Ab-An-Or ternary diagram.
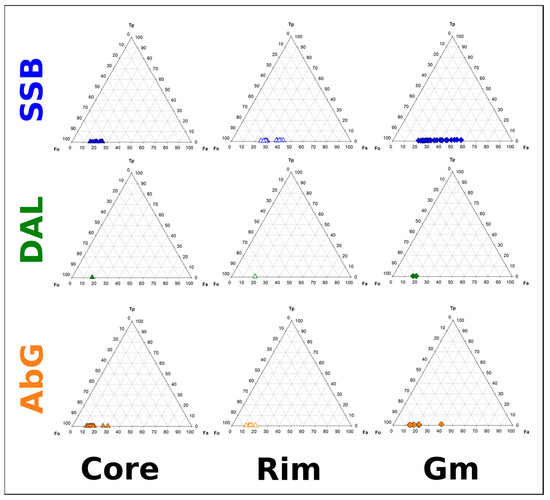
Figure 7.
Crystal composition of olivine phenocrysts core (full triangles) and rim (empty triangles) and groundmass microlites (diamonds) reported in the Fo-Fa-Tp ternary diagram.
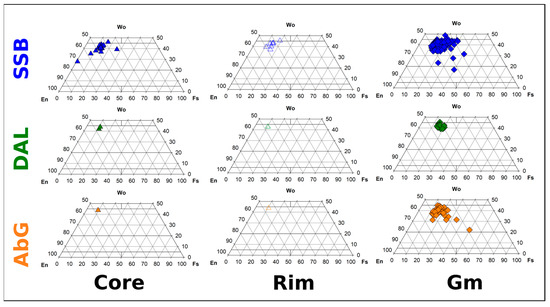
Figure 8.
Crystal composition of pyroxene phenocrysts core (full triangles) and rim (empty triangles) and groundmass microlites (diamonds) reported in the En-Fs-Wo ternary diagram.
A general description of the petrography and mineral chemistry of the three groups (SSB, DAL and AbG) is given as follows.
3.2.1. SSB Lavas
To this group, the lavas outcropping at the bottom (BC1-3) and at the top of the sequence (BC9-12) belong, along with the dike (BCD) intruding the entire sequence. All samples display an assemblage of plagioclase, clinopyroxene, olivine and oxides with a highly variable porphyritic index. PIs vary from 0.31 to 32% (Table 2) with a marked difference between the SSB lavas at the bottom of the sequence (PI < 1.3%) and those at the top (in particular, BC11~32% and BC12~20%), although no difference in terms of geochemistry between these two subgroups of the SSB lavas was noted (see Table 1 and Figure 2). In the thin section, all samples display variable amounts of bubbles from 3.21 to 28.96 area%.
Plagioclase is always present as phenocrysts or microphenocrysts with high variability, from <0.1 area% in BC2 at the bottom to 17.15 area% in BC11 at the top of the sequence (Figure 5). Phenocrysts and microphenocrysts have subhedral to euhedral shapes, reach a size of 1 mm and mostly display normal zoning with Ca-rich cores (An79-54) and Na-rich rims (An68-39). Groundmass microlites are always anhedral, with a lower average An content but a wider range of compositions (An73-20). Olivine crystals are less present than plagioclase, with <0.5 area% in the samples at the bottom of the sequence, whereas they increase towards the top, reaching a maximum value of 12.83 area% in BC11 lava. Where present, weakly zoned (core: Fo84-74, rim: Fo75-56) phenocrysts with euhedral habitus reach a millimetric size. Smaller subhedral individuals (100–300 μm) are sometimes aggregated in gromerules, whereas microlites in groundmass (Fo78-41) are ubiquitous and show either subhedral to anhedral or dendritic habits. Clinopyroxene is the least abundant phase, with rare phenocrysts and microphenocrysts generally < 0.6 area% with the exception of BC11 lavas displaying an amount of 2.04 area%. The larger crystals can reach up to 700 μm in size and display a variable composition (cores: Di62-27, rim: Di59-45). Phenocrysts and microphenocrysts exhibit subhedral habits, whereas groundmass microlites (Di62-27) are always anhedral or dendritic. Furthermore, all samples feature titanomagnetite oxides with sizes less than 50 μm and with dendritic habits developing into branches generally ~10–50 μm wide and ~200 μm long.
Despite having a chemical composition similar to the SSB-like samples, the BCD dike differs from the lavas in terms of texture, being largely aphanitic and quite vesiculated (bubbles 28.96 area%). This section presents anhedral plagioclase (An64-58) that, in a few individuals, may reach dimensions of ~300–400 μm. Clinopyroxene and olivine are largely anhedral and only present as a groundmass phase (both approximately 10–100 μm), along with plagioclase. Olivine is generally moderately forsteritic (Fo78-74), although some strongly fayalitic examples were observed (e.g., Fo48). Oxides assume a dendritic and skeletal habit (~5–50 μm) throughout the section.
3.2.2. DAL: Differentiated AbG Lavas
Lavas belonging to this group (BC4-5) display the same mineral assemblage of SSB- and AbG-like samples. They show an increase in the porphyritic index (6.32–5.24%) and an overall increase in the phenocryst size with respect to the SSB-like products at the bottom of the Bellecombe sequence, a trend that continues in all sections until BCD. At the same time, they display the lowest amount in vesicles (<0.5%).
Plagioclase is the most abundant phase (up to 4.93%). Phenocrysts up to 2 mm in size are often found in glomerules, displaying euhedral to subhedral habits, either normally or reverse-zoned (cores: An77-55, rim: An75-44) with rare unzoned crystals (An76). They are also present as anhedral microlites in the groundmass with more Na-rich compositions (An60-20). Olivine phenocrysts are present in scarce amounts (<0.8 area%) but with moderate sizes, sometimes up to 1 mm. The few large phenocrysts analyzed are weakly zoned (core Fo83, rim Fo80), contain numerous oxide inclusions and may show signs of reabsorption along otherwise well-defined crystal faces. Groundass microcrysts are more fayalitic (Fo55-50) and show subhedral to anhedral habits. Titanomagnetites oxides are also present in this group in all sections. However, they appear in scarce amounts as groundmass microlites, often exhibiting dendritic habits.
3.2.3. AbG Lavas
This group comprises the BC6 to BC8 lava flows outcropping in the middle of the Bellecombe sequence. The mineral assemblage of the samples resembles that of the other lavas, with an increase in PI (9.67–20.72%) with respect to the SSB samples at the bottom of the sequence. AbG lavas also display an increase in vesicularity with values in thin sections between 20.24 and 32.7%.
Plagioclase in these samples is scarce (<3.8 area%) as phenocrysts and is observed more often as microphenocrysts with sizes of 0.5 mm. The largest individuals reach millimetric dimensions and display a subhedral habit and normal zoning (cores: An84-43, rims: An68-31), whereas groundmass microlites exhibit a wider compositional range (An75-17) and anhedral habit. Olivine appears as a phenocryst phase in significant amounts, especially in BC7 (15.05%) and BC8 (7.58%). In these sections, phenocrysts reach considerable sizes (~5 mm in BC7) and display subhedral to anhedral habits and both weak normal and reverse zoning patterns (core: Fo88-47, rim: Fo88-80). The largest crystals often present a ‘dusty texture’ and iron-enriched coronae (Fo47-50) along crystal edges and within fractures. Groundmass microlites are present in all three samples, with a composition similar to that of the microphenocrysts (Fo86-78). The clinopyroxene content increases, appearing as phenocrysts and microphenocrysts (up to 4.27 area%), with respect to the rest of the Bellecombe lavas. Phenocrysts reach 1 mm in size in BC6, are generally subhedral and display a diopsidic composition (core: Di63, rim: Di59), while microlites (Di55-19) are anhedral in all sections. As in the other samples of the Bellecombe sequence, titanomagnetites only appear as microcrysts, often with a dendritic habit, and are only a few µm in size.
3.3. Vesicle Distribution
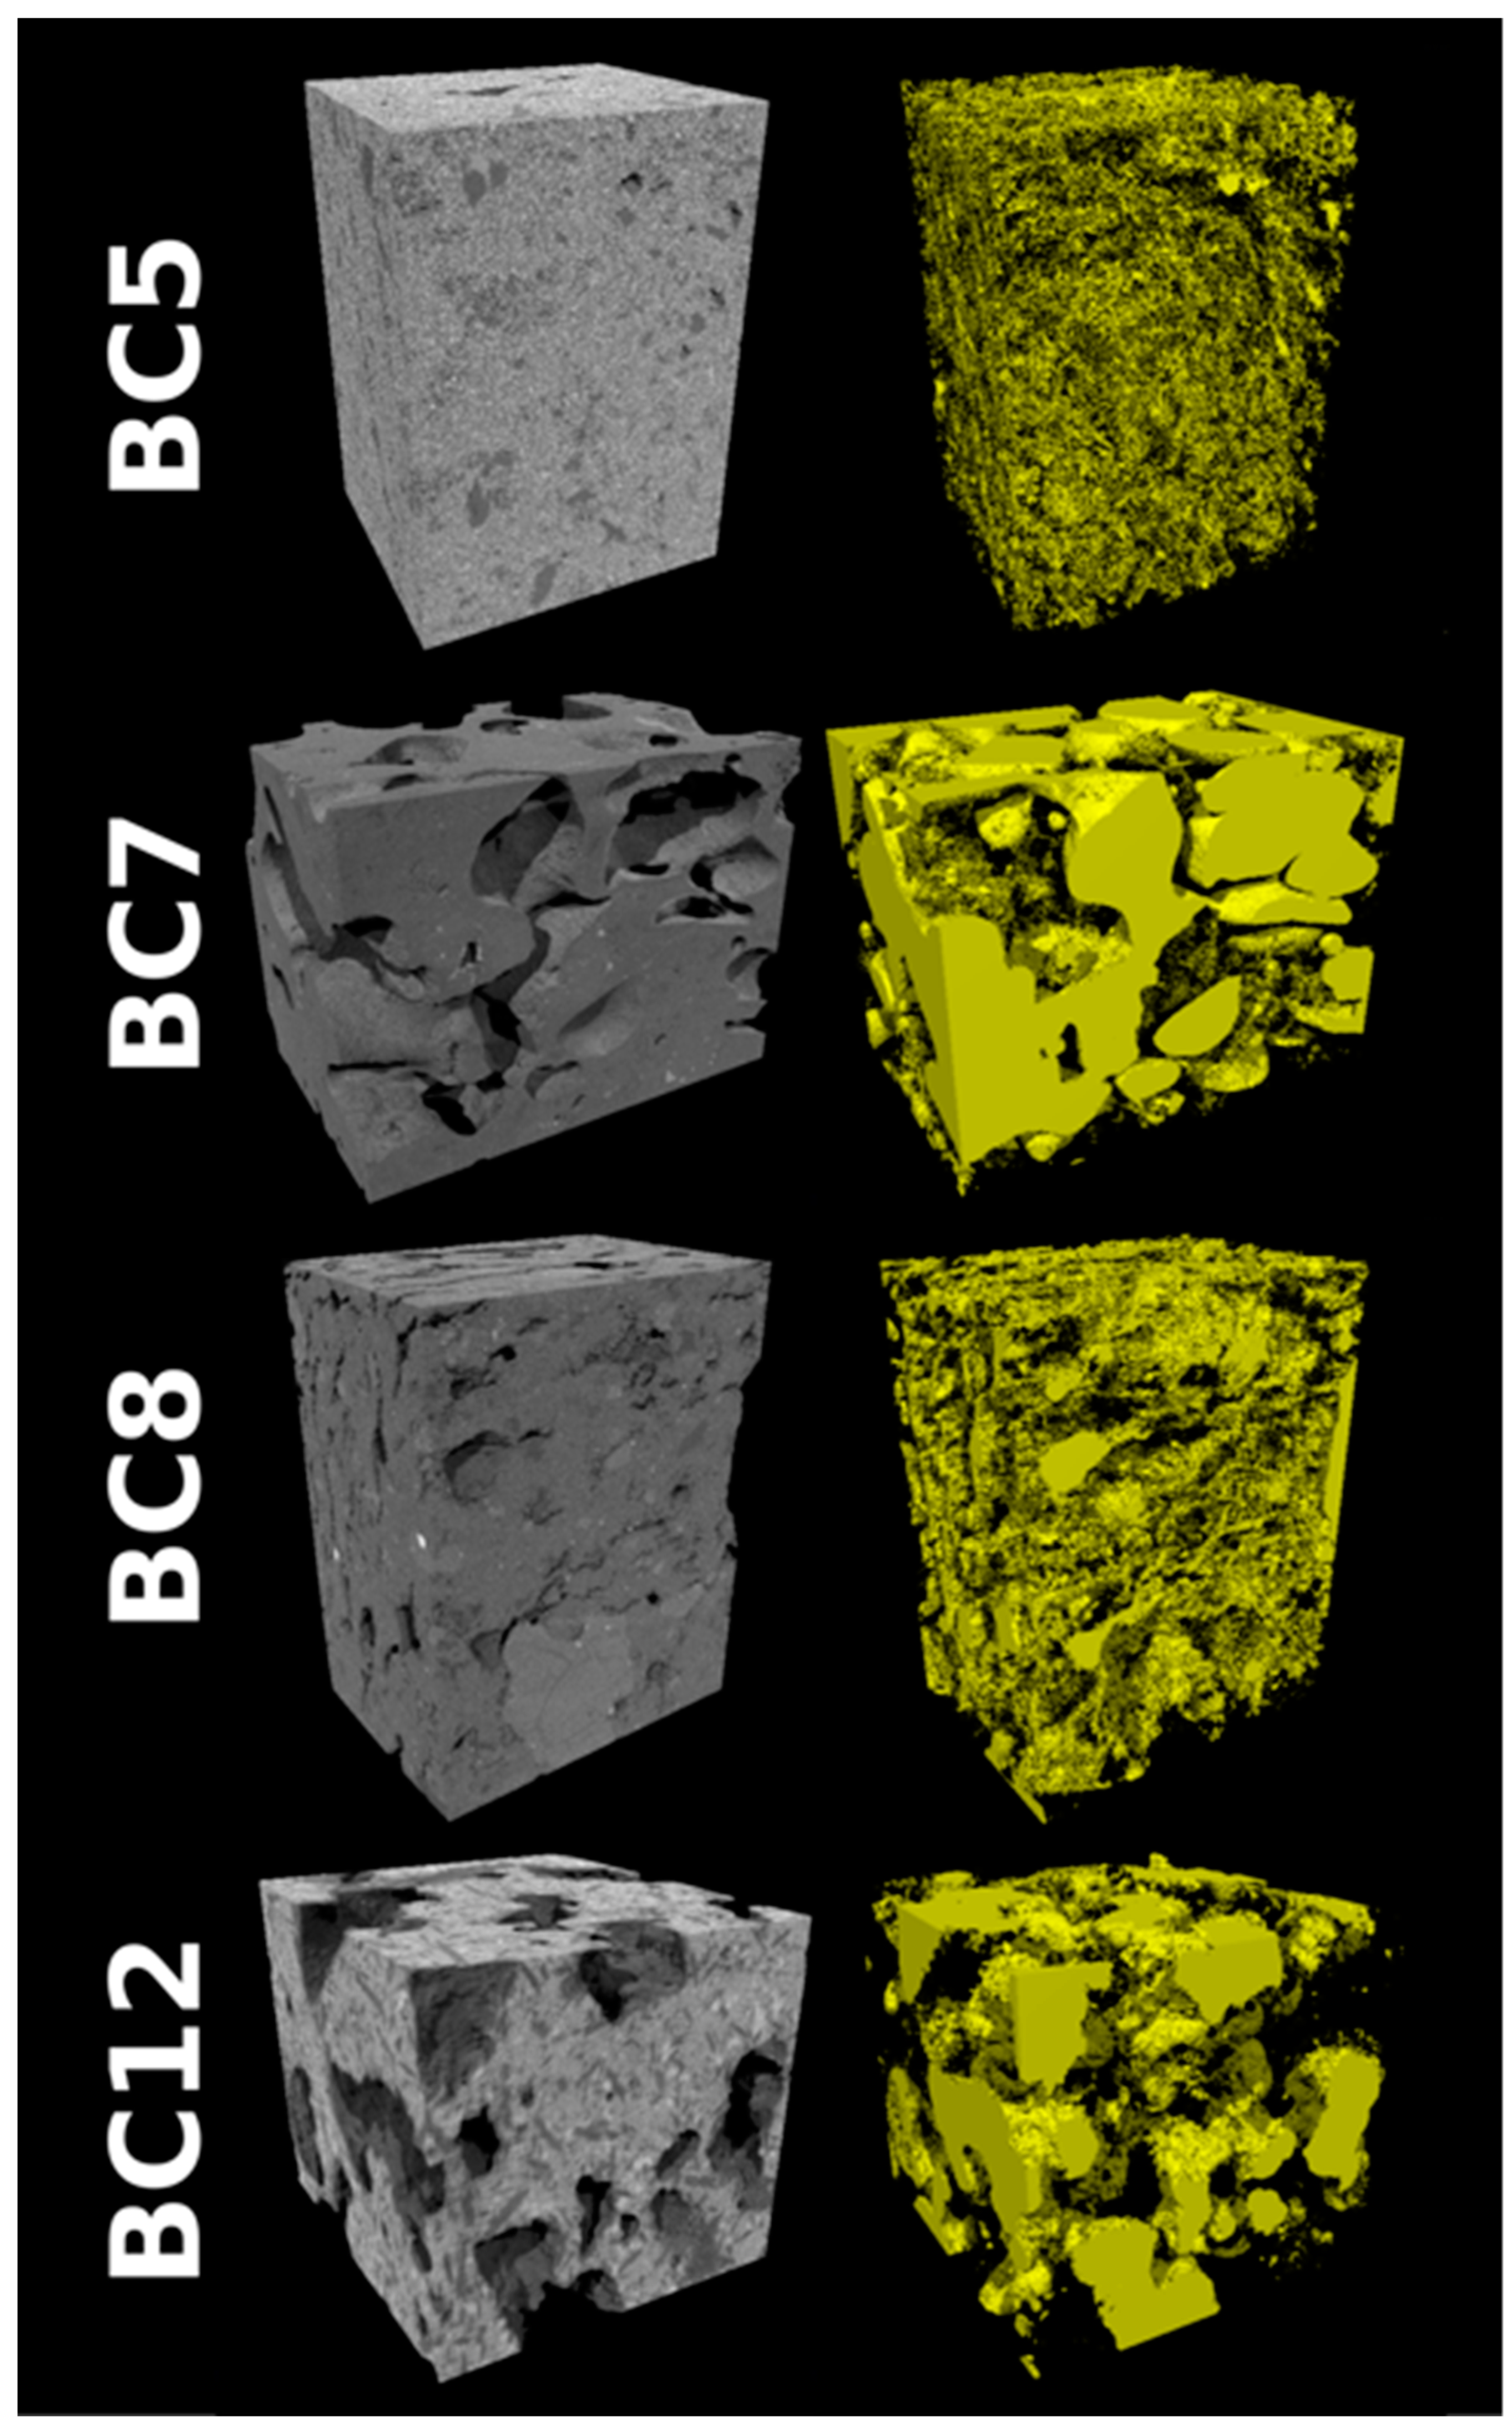
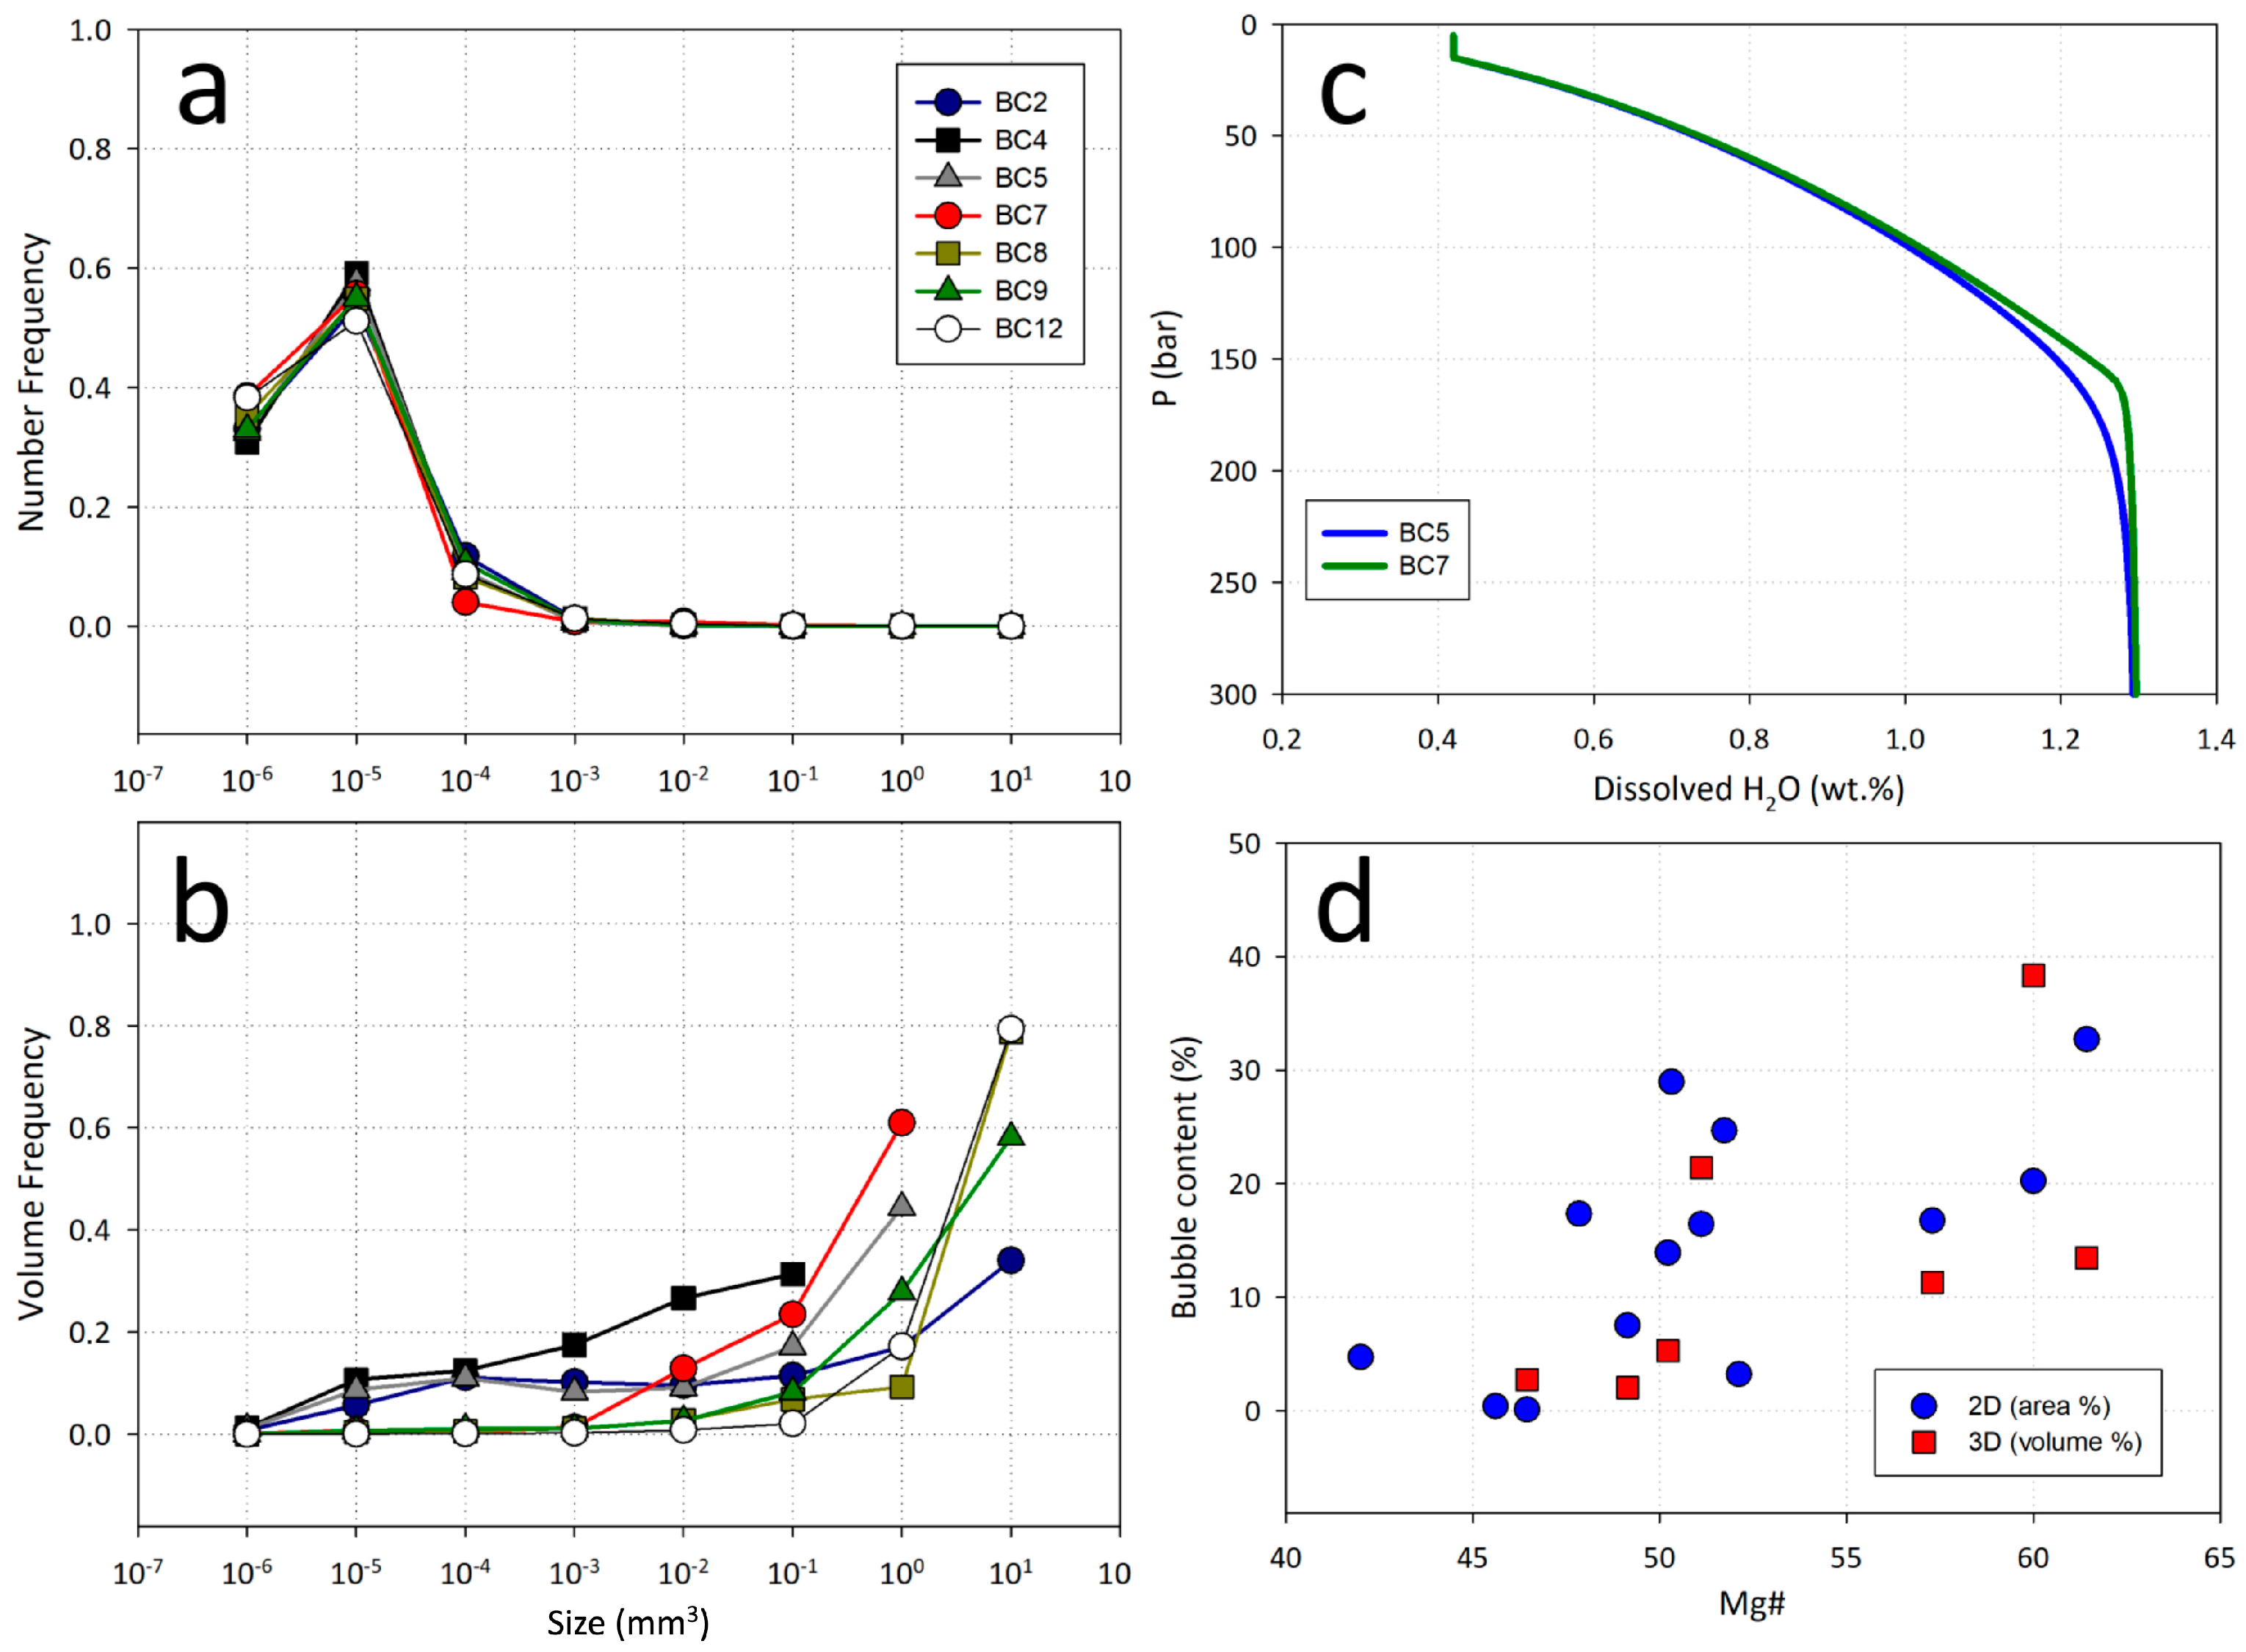
A detailed study of the vesicularity of selected samples was performed on the 3D images collected by X-ray computed microtomography (Figure 9—volume renderings). This approach allowed for a quantitative evaluation of the bubble abundance and morphology in three dimensions. Vesicles are present in all the analyzed samples in amounts from 2.04 to 38.34 vol.%, a common range for effusive products of Piton de la Fournaise [58], and with a number density (number of vesicles per unit volume) from 21 to 179 #/mm3 (Table 3) that matches that of recent lavas emitted at the volcano [59,60]. The results of the 3D analysis of bubble amounts are in agreement with those obtained by thin section analysis (cfr. Table 2 and Table 3 and Figure 10), although they do not perfectly match due to the different methods used (see [61]). The lowest vesicularity is shown by BC4 and BC5 evolved AbG lavas, whereas the products in the central and upper part of the section are marked by a notable increase in the bubble amount (BC7 = 38.34 vol.%), mirrored by a decrease in their number density (Table 3). This is due to the different degree of coalescence, also shown by the average bubble volume (<0.0003 mm3 for BC2-4-5 and >0.0025 mm3 for the rest of the samples). All the samples show a quite high degree of sphericity (>0.80), which is typical of low-deformed bubbles which grow in melts characterized by low viscosity [62]. Finally, the size distribution of the bubbles calculated as the Number and Volume Frequency (Figure 10a,b, respectively) indicates that, although most of the vesicles are between 10−6 and 10−4 mm3 in size in all samples (Figure 10a), the majority of the total vesicularity (Figure 10b) of the lavas in the middle and the upper areas of the sequence (BC8-12) is represented by vesicles > 1 mm3. Such size distributions match those of vesicles in the aphyric transitional basaltic lavas emitted during the 2014 and 2015 activity [59,60].
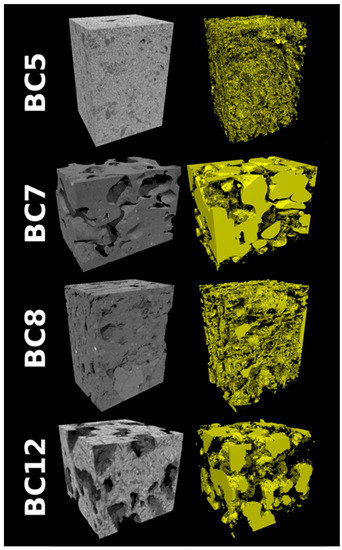
Figure 9.
Results of the X-ray μCT experiments on selected samples. In greyscale, the reconstructed axial slices show the overall appearance of the samples; in yellow, the corresponding 3D renderings of the segmented vesicle phase are shown.

Table 3.
Results of the 3D analysis of the vesicle phase of selected samples.
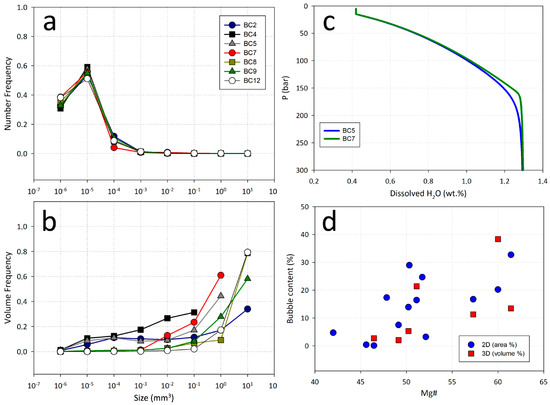
Figure 10.
Bubble distribution and degassing path: (a) Vesicle number frequency showing that all the samples have a similar number density distribution peaking at 10−5 mm3; (b) Vesicle volume frequency, indicating that BC4 and BC5 display smaller bubbles compared to the other lavas (see [1]) (please note that each point in (a) and (b) represents a size range of one order of magnitude, e.g., 10−6 mm3 accounts for all bubbles in the range 10−6–10−5 mm3, 10−5 mm3 accounts for all bubbles in the range 10−5–10−4 mm3 and so on); (c) Degassing simulation with Solex Software [63] of melts with BC5 (Tliq = 1250 °C) and BC7 (Tliq = 1323 °C) compositions. Initial volatile content H2O = 1.3, CO2 = 200 ppm, S = 1600 ppm [44,45,64]. Liquidus temperatures were calculated by Melts code [65]; (d) Vesicle content by 2D and 3D analysis vs. Mg#.
4. Discussion
The geochemical and petrographic results show that the lava flows outcropping along the Bellecombe section are characterized by a distinct geochemical and petrological variability. Most importantly, the investigated samples display a number of variations that allow for the identification of different phases in plumbing system evolution during the emplacement of the stratigraphic sequence currently outcropping along the caldera wall. The compositional oscillation of the sequence, with BC4 and BC5 characterized by a higher degree of alkalinity, and BC6, BC7 and BC8 instead showing more primitive characteristics, indicates that different paths of the magma ascent were used by the Bellecombe magmas prior to their surface emission. According to Villemant and co-authors [66], the variation shown by the SSB and AbG series of Piton de la Fournaise is mostly due to different degrees of differentiation (with crystallization from 10 to 35%) of a common parental basaltic melt. It is possible to hypothesize that the lavas exposed along the Rempart de Bellecombe follow a similar tendency, whereby the different magmas feeding the eruptions derived from a common mantle source undergo different processes during the ascent toward the surface. This is underlined by slight geochemical heterogeneities, especially in trace elements, most likely due to little variation in the partial melting rate of the source and to the deep crystallization of clinopyroxene in AbG and olivine in SSB.
The samples constituting the bottom of the exposed sequence (BC1-2-3) display a major element content (especially MgO, K2O and CaO) comparable to the Steady-State Basalts (SSB), which represent the dominant products emitted in the last ~400 kyrs (Figure 2). Ni and Cr contents (83–109 ppm and 94–237 ppm, respectively) are in agreement with those reported by Albarède and co-authors [4]. The homogeneity among these lavas has been linked to continuous interactions and chemical re-equilibration between the mushes generated by previous magmatic activity and the input of new magmas into the system from the mantle source [66].
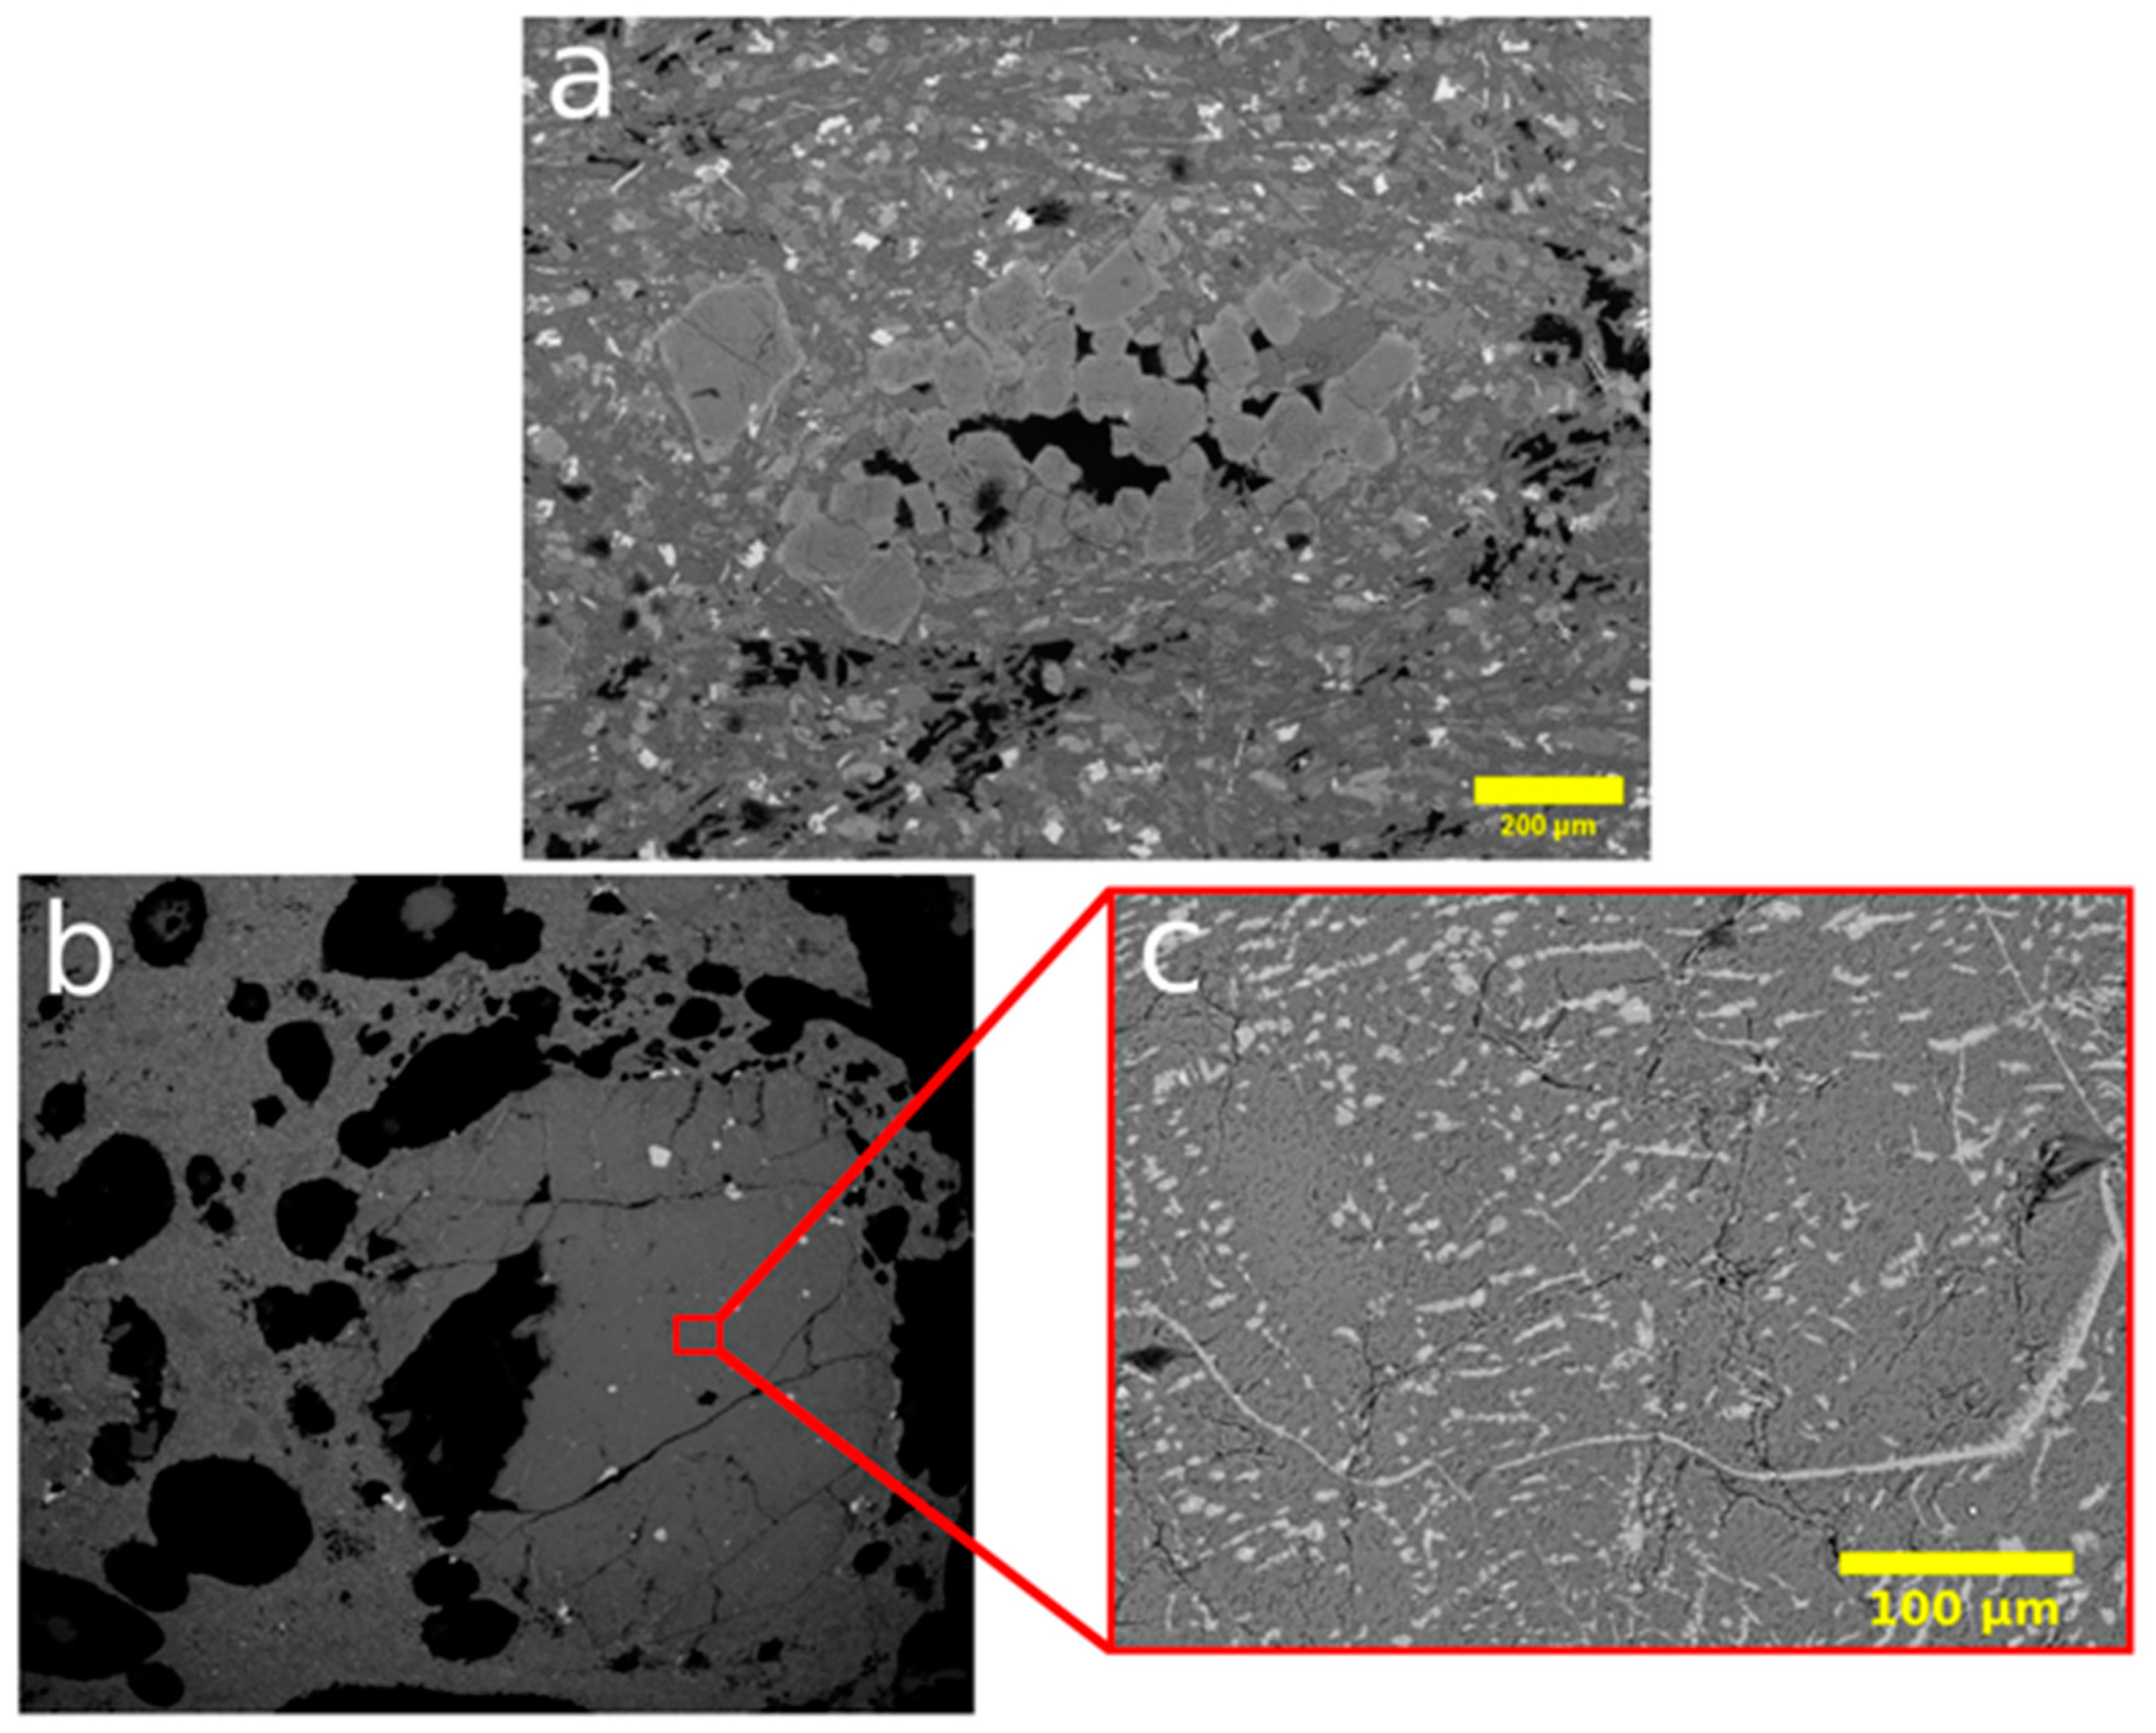
The interaction between different rising melts can be noticed in sample BC2 (Figure 11), where small (<200 µm) olivine crystals with normal zonation form aggregates with sizes up to 1 mm. They thus formed as single crystals and then aggregated due to intergrowth processes, most probably in intratelluric conditions [67,68]. The injection of the new melt into the system and subsequent re-equilibration are also evidenced by the presence of reverse zoning in clinopyroxene microphenocrysts, together with normal-zoned crystals in BC3. The lack of compositional uniformity among these crystals could be evidence of magma mixing. Moreover, intergrowths of plagioclase and clinopyroxene indicate dynamic conditions within the feeding system that can destabilize crystals when they undergo convection in a shallow magma chamber, thermally zoned in a colder (<1140 °C) external and hotter (1140–1230 °C) internal zone where clinopyroxene is not stable [69]. Because of the shallow zone of storage of the SSB [70], interaction with cumulate material could be considered minimal. This is evidenced in sample BC2 by the growth of fayalitic rims Fo59-74 surrounding the forsteritic cores (Fo76-85) of the olivine, which also show compositions similar to the groundmass (Fo41-76) in equilibrium with the melt (Figure 2). The slight textural variation in terms of the porphyritic index among BC1-2-3 lavas would imply that the shallow part of the plumbing system is subject to different convective processes and thus a heterogeneous zonation that would lead to the eruption of lavas with similar geochemical characters but distinct textural features.
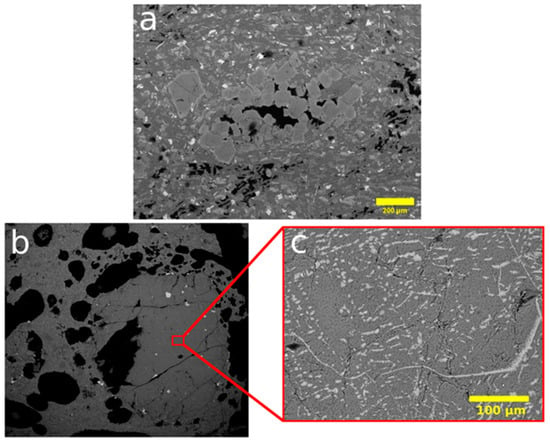
Figure 11.
Detailed textural features of olivine in BC2 groundmass (a) where they form small aggregates and in BC7 where large crystals (b) are characterized by a ‘dusty texture’ and fractures filled with fayalitic material (c).
The BC4 and BC5 lavas (DAL) show a marked change in terms of geochemistry; they are the most differentiated products of the sequence and have an AbG signature. The composition of these samples is shifted toward the more differentiated alkaline lavas according to the classification summarized by Famin and co-workers [38] because of their high K2O amount (up to 1.20 wt.%) and their lower MgO and CaO/Al2O3 ratios compared to the other lavas of the investigated sequence. These products also show lower MgO, Cr and Ni and a higher amount of Ba, Rb, Zr, Ce, Th and Sr (Figure 2). The alkali enrichment, along with a decrease in the MgO content and CaO/Al2O3 ratios, has been linked to clinopyroxene crystallization in water poor melts ponding at various levels between the mantle and the mantle-crust underplating layer (4 kbar) [8,52]. Unlike the SSBs, these magmas could therefore indicate a relatively short interval in which eruptions were driven by evolved volatile-poor AbG melts, as also suggested by the low number of vesicles observed in these samples.
The occurrence of BC6-7-8 lavas may indicate a rapid change in the feeding system dynamics of the volcano since their composition markedly deviates from the preceding BC4-5 lavas. These samples show a strong enrichment in MgO, Cr and Ni and are characterized by large phenocrysts of olivine (up to 2 mm, see Figure 5—textures) with euhedral to subhedral habits. In particular, BC6 and BC7 are shifted to the composition of the parental AbG magmas [8,52] feeding the recent eccentric eruptions at Piton de la Fournaise (MgO ~9–11 wt.%, K2O ~0.5–0.8 wt.% and CaO ~10–12 wt.%). The high values of Ni and Cr suggest a lower degree of fractionation of olivine and spinel with respect to SSBs. Interestingly, these samples show some affinities with the AbG products (Figure 3), having low CaO/Al2O3 ratios and showing a depletion in Sc (Table 1). The AbGs are usually associated with eruptions occurring on the distal flanks of the edifice, and their genesis has been linked to the direct ascent of deep magmas bypassing the central plumbing system with already fractionated clinopyroxene at mantle-underplating depths, followed by the fractionation of plagioclase and clinopyroxene during the ascent [4,8,15,38,44,52]. It is therefore likely that BC6 and BC7 derive from a new input of magma with a primitive composition erupted by eccentric vents and possibly bypassing the central SSB system. The textures of olivine crystals, with fayalitic coronae that penetrate crystal fractures, resemble those described by Famin and co-workers [38] and suggest the disaggregation of crystallized mush by the pressurization induced by the entry of new magma [45] that caused their migration to shallow depths. This is evidenced by the presence of fractures in the large olivine phenocrysts of BC7, filled with fayalitic material and distinguished by dusty textures (Figure 11). Such characteristics attest to the deformation of these xenocrysts and their disequilibrium with the melt during episodes of ‘cumulitic cannibalism’, which had an influence on the geochemical properties of the magma [4]. At the same time, the lack of large clinopyroxene crystals may be related to either fractionation or a change in PH2O in low-pressure zones within a shallow reservoir, which would have instead favored the crystallization of plagioclase [71].
The top of the sequence (from BC9 to BC12) exposes lavas with SSB-like geochemical characteristics (Table 1 and Figure 2) that show a slightly more pronounced degree of differentiation with respect to the products at the bottom of the sequence, as well as a higher crystal content. The presence of reverse zoning in the clinopyroxenes of BC9 and in the plagioclase of BC10 indicates dynamic conditions in the feeding system, with magma migration from the colder to the hotter zone of the magma chamber and mixing processes following the injection of new melts. These lavas also display a marked increase in PI (up to 32.01% in BC11 due to the presence of a large quantity of plagioclase), most likely related to a prolonged differentiation phase at shallow depths. The relatively high amount of plagioclase could be related to lava emission following long periods of volcanic quiescence, sometimes lasting years [59].
Finally, the dike intruding the entire stratigraphic section shows the same geochemical pattern of SSBs lava flows, with an aphyric texture typical for rapidly intruded basaltic dikes that undergo rapid crystallization without ponding in an intermediate reservoir [61].
Although a detailed study on the volatile content of the investigated lava falls out of the general description of the Bellecombe lavas provided in this study, investigations carried out on vesicularity provide interesting hints on the general characteristics of the magmas that fed the system. The number, volume and morphology of vesicles still trapped in the lavas during the eruptive process reflect the processes that magmas and related lavas underwent in the shallow part of the feeding system and during subaerial flow [62,72]. When comparing the number of vesicles in relation to the lava composition, it is evident that less evolved products are characterized, on average, by higher degrees of vesicularity (measured as area% 2D and vol.% 3D). This trend can be interpreted as the result of slightly different times for magma ascent and ponding within the reservoirs of the feeding system. In fact, lavas at Piton de la Fournaise have a relatively low volatile budget (H2O + CO2 + S + Cl < 1.2 wt.%), as indicated by the analysis of melt inclusions (MIs) in olivine crystals of recent products [44,45,64,70]. In particular, the H2O content of MIs is usually <1.2 wt.%, and this small amount of water can exsolve from basaltic melts with the composition of the Bellecombe lavas only in the shallower part of the feeding system, at p < 180 bar (Figure 10c). The high number of bubbles in the less evolved products and their overall large volume (Figure 10b) indicate the rapid transfer of these magmas from a deep feeding system to one at shallower depths and their following emission with only a brief ponding period that did not permit efficient degassing, thus keeping the coalescing vesicles trapped in the melt. On the contrary, the lower number of bubbles in the more evolved lavas indicate that a longer ponding time exerted a role in the final number of bubbles [1]. The scarcity of bubbles in these lavas is indicative of more efficient degassing in an open conduit system that depleted the magmas of the vesicle phase before the eruption. Rapid degassing at shallow levels in a low viscosity melt is also evidenced by the 3D morphology of the vesicles: all the bubbles display high values of sphericity (~0.8, Table 3), indicating that the original (spherical) shape of the bubbles was modified a little during the ascent, eruption and surface flow of the magmas [62]. Therefore, it is possible to imagine, for the entire Bellecombe sequence, that the whole process of magma ascent, degassing and eruption occurred in a limited timeframe.
5. Conclusions
In this work, we performed a geochemical and petrographic (2D and 3D) characterization of the lavas exposed along the ~80 m thick Bellecombe cliff sequence emplaced >5.5 kyrs, currently outcropping on the NW wall of the Enclos Fouqué caldera. The sequence comprises 12 superimposed lava flows showing geochemical affinity with the two main series documented at PdF: SSB basalts with tholeiitic affinity (bottom and top of the sequence, together with a large dike that cuts the entire sequence) and the AbG group with alkaline affinity, forming the central part of the sequence. The chronological phases for the emplacement of the Bellecombe sequence can be summarized as follows:
- −
- Initial emission of SSB-like products, which today outcrop at the bottom of the sequence;
- −
- A short-lived eruptive period characterized by largely degassed Differentiated Alkaline Lavas;
- −
- Emission of more primitive, volatile-rich and porphyritic lavas of the Abnormal Basalt Group;
- −
- Final emission of SSB-like products, where the younger lavas show an increased degree of differentiation and porphyritic index. This was followed by the final intrusion of an aphyric dike.
The absence of oceanite-like rocks should be noted. Eruptions of these volcanic products have been documented along the caldera cliffs for ages younger than 5-3 kyrs [73], outcropping south of the Rempart de Bellecombe cliff [74] and potentially linked to the formation of calderas at PdF [45].
The occurrence of SSB + DAL + AbG in a relatively short timespan, as inferred by the small number of lava flows constituting the volcanic sequence, indicates a rapid change in the activity location: the SSB magmas are in fact mostly related to summit-area activity, whereas AbG magmas are usually emitted on the distal flanks of the volcano, and DAL magmas correspond to very rare shallow magmatic activity. In light of this, the Rempart de Bellecombe sequence represents proof of the dynamic nature of the plumbing system, capable in the recent past of shifting rapidly from central to eccentric activity.
Supplementary Materials
The following supporting information can be downloaded at: https://www.mdpi.com/article/10.3390/min13060751/s1, Table S1: crystal compositions.
Author Contributions
Conceptualization, G.L., A.B. and C.F.; methodology, G.L. and S.D.; software, S.D.; validation, G.L. and A.D.M.; formal analysis, G.L. and A.B.; investigation, G.L., A.B., P.B. and S.D.; data curation, G.L., A.B. and S.P.; writing—original draft preparation, G.L., A.B. and A.D.M.; writing—review and editing, G.L., S.P. and A.D.M.; visualization, G.L. and S.P.; supervision, A.D.M. and C.F.; funding acquisition, C.F. All authors have read and agreed to the published version of the manuscript.
Funding
S.D. was funded by the Italian Ministry of University and Research: “AIM: Attraction and International Mobility”—PON R&I 2014–2020 Regione Calabria, and by the Italian Ministry of University and Research: “Progetto STAR 2”—grant number: PIR01_00008.
Data Availability Statement
Data supporting reported results can be found in the Supplementary Material Table S1.
Conflicts of Interest
The authors declare no conflict of interest.
References
- Lanzafame, G.; Casetta, F.; Giacomoni, P.P.; Donato, S.; Mancini, L.; Coltorti, M.; Ntaflos, T.; Ferlito, C. The Skaros effusive sequence at Santorini (Greece): Petrological and geochemical constraints on an interplinian cycle. Lithos 2020, 362–363, 105504. [Google Scholar] [CrossRef]
- Ort, M.H.; Di Muro, A.; Michon, L.; Bachèlery, P. Explosive eruptions from the interaction of magmatic and hydrothermal systems during flank extension: The Bellecombe Tephra of Piton de La Fournaise (La Réunion Island). Bull. Volcanol. 2016, 78, 5. [Google Scholar] [CrossRef]
- Michon, L.; Lénat, J.-F.; Bachèlery, P. Geology and morphostructure of Piton de la Fournaise. In Active Volcanoes of the Southwest Indian Ocean; Active volcanoes of the world; Springer: Berlin/Heidelberg, Germany, 2016; Volume 4, pp. 45–59. [Google Scholar] [CrossRef]
- Albarède, F.; Luais, B.; Fitton, G.; Semet, M.; Kaminski, E.; Upton, B.G.J.; Bachèlery, P.; Cheminée, J.-L. The Geochemical Regimes of Piton de la Fournaise Volcano (Réunion) During the Last 530,000 Years. J. Petrol. 1997, 38, 171–201. [Google Scholar] [CrossRef]
- Le Friant, A.; Lebas, E.; Clement, V.; Bachèlery, P. A new model for the evolution of La Réunion volcanic complex from complete marine geophysical surveys. Geophys. Res. Lett. 2011, 38, L09312. [Google Scholar] [CrossRef]
- Bachèlery, P.; Lénat, J.-F. Le Piton de la Fournaise. Mémoires Société Géologique Fr. 1993, 163, 221–229. [Google Scholar]
- Courtillot, V.; Feraud, G.; Maluski, H.; Vandamme, D.; Moreau, M.G.; Besse, J. Deccan flood basalts and the Cretaceous/Tertiary Boundary. Nature 1988, 333, 843–846. [Google Scholar] [CrossRef]
- Boudoire, G.; Brugier, Y.-A.; Di Muro, A.; Wörner, G.; Arienzo, I.; Metrich, N.; Zanon, V.; Braukmüller, N.; Kronz, A.; Le Moigne, Y.; et al. Eruptive Activity on the Western Flank of Piton de la Fournaise (La Réunion Islands, Indian Ocean): Insights on Magma Transfer, Storage and Evolution at an Oceanic Volcanic Island. J. Petrol. 2019, 60, 1717–1752. [Google Scholar] [CrossRef]
- MacDougall, I. The geochronology and evolution of the young island of Réunion, Indian Ocean. Geochim. Cosmochim. Acta 1971, 35, 261–270. [Google Scholar] [CrossRef]
- Michon, L.; Saint-Ange, F. Morphology of Piton de la Fournaise basaltic shield volcano (La Réunion Island): Characterization and implication in the volcano evolution. J. Geophys. Res. 2008, 113, B03203. [Google Scholar] [CrossRef]
- Gillot, P.-Y.; Lefèvre, J.-C.; Nativel, P.E. Model for the structural evolution of the volcanoes of Réunion island. Earth Planet. Sci. Lett. 1994, 122, 291–302. [Google Scholar] [CrossRef]
- Famin, V.; Paquez, C.; Danišík, M.; Gardiner, N.J.; Michon, L.; Kirkland, C.L.; Berthod, C.; Friedrichs, B.; Schmitt, A.K.; Monie, P. Multitechnique geochronology of intrusive and explosive activity on Piton des Neiges volcano, Réunion Island. Geochem. Geophys. Geosyst. 2020, 23, e2021GC010214. [Google Scholar] [CrossRef]
- Deniel, C.; Kieffer, G.; Lecointre, J. New 230Th-238U and 14C age determinations from Piton des Neiges volcano, Réunion–A revised chronology for the Differentiated Series. J. Volcanol. Geotherm. Res. 1992, 51, 253–267. [Google Scholar] [CrossRef]
- Gillot, P.-Y.; Nativel, P. Eruptive history of the Piton-de-la-Fournaise volcano, Réunion-Island, Indian-Ocean. J. Volcanol. Geotherm. Res. 1989, 36, 53–65. [Google Scholar] [CrossRef]
- Lénat, J.F.; Bachèlery, P.; Merle, O. Anatomy of Piton de la Fournaise Volcano (La Réunion, Indian Ocean). Bull. Volcanol. 2012, 74, 1945–1961. [Google Scholar] [CrossRef]
- Bachèlery, P. Le Piton de la Fournaise (Ile de la Réunion). Etude Volcanologique, Structurale et Pétrologique. Piton de la Fournaise, Réunion; Volcanologic, Structural and Petrological Study. Ph.D. Thesis, University of Clermont-Ferrand, Clermont-Ferrand, France, 1981; 255p. [Google Scholar]
- Mairine, P.; Bachèlery, P. Un grand épisode érosionnel dans l’histoire ancienne du Piton de la Fournaise (Ile de la Réunion). Major erosional period in the history of Piton de la Fournaise, Réunion Island. C. R. De L’académie Des Sci. Ser. II Sci. De La Terre Des Planètes 1997, 325, 243–249. [Google Scholar] [CrossRef]
- Lénat, J.F. A brief history of the observation of the central area of piton de la Fournaise. In Active Volcanoes of the Southwest Indian Ocean: Piton de la Fournaise and Karthala; Springer: Berlin/Heidelberg, Germany, 2015; pp. 3–21. [Google Scholar] [CrossRef]
- Michon, L.; Ferrazzini, V.; Di Muro, A.; Villeneuve, N.; Famin, V. Rift zones and magma plumbing system of Piton de la Fournaise volcano: How do they differ from Hawaii and Etna? J. Volcanol. Geotherm. Res. 2015, 303, 112–129. [Google Scholar] [CrossRef]
- Abchir, M.A.; Semet, M.S.; Boudon, G.; Ildefonse, P.; Bachèlery, P.; Clocchiatti, R. Huge hydrothermal explosive activity on Piton de la Fournaise, Réunion Island: The Bellecombe ash member, 2700 BC. In Volcanic Risk–The European Laboratory Volcanoes, Publ. EUR 18161; Casal, R., Fytikas, M., Sigvaldasson, G., Vougioukalakis, G., Eds.; European Commission: Brussels, Belgium, 1998; pp. 447–455. [Google Scholar]
- Duffield, W.A.; Stieltjes, L.; Varet, J. Huge landslide blocks in the growth of Piton de la Fournaise, La Réunion, and Kilauea Volcano, Hawaii. J. Volcanol. Geotherm. Res. 1982, 12, 147–160. [Google Scholar] [CrossRef]
- Lénat, J.-F.; Bachèlery, P.; Bonneville, A.; Hirn, A. The beginning of the 1985-1987 eruptive cycle at Piton de la Fournaise (la Réunion): New insights in the magmatic and volcano-tectonic systems. J. Volcanol. Geotherm. Res. 1989, 36, 209–232. [Google Scholar] [CrossRef]
- Labazuy, P. Recurrent landslides events on the submarine flank of Piton de la Fournaise volcano (Réunion Island). In Volcano Instability on the Earth and Other Planets; McGuire, W., Jones, A.P., Neuberg, J., Eds.; Geological Society: London, UK, 1996; pp. 293–305. [Google Scholar] [CrossRef]
- Oehler, J.-F.; Labazuy, P.; Lénat, J.-F. Recurrence of major flank landslides during the last 2-Ma-history of Réunion Island. Bull. Volcanol. 2004, 66, 585–598. [Google Scholar] [CrossRef]
- Oehler, J.F.; Lénat, J.F.; Labazuy, P. Growth and collapse of the Reunion Island volcanoes. Bull. Volcanol. 2007, 70, 717–742. [Google Scholar] [CrossRef]
- Merle, O.; Lénat, J. Hybrid collapse mechanism at Piton de la Fournaise volcano, Réunion Island, Indian Ocean. J. Geophys. Res. 2003, 108, 2166. [Google Scholar] [CrossRef]
- Morandi, A.; Di Muro, A.; Principe, C.; Michon, L.; Leroi, G.; Norelli, F.; Bachèlery, P. Pre-historic (<5 kiloyear) explosive activity at Piton de la Fournaise volcano. In Active Volcanoes of the Southwest Indian Ocean: Piton de la Fournaise and Karthala; Springer: Berlin/Heidelberg, Germany, 2016; pp. 107–138. [Google Scholar] [CrossRef]
- Fisk, M.R.; Upton, B.G.J.; Ford, C.E.; White, W.M. Geochemical and experimental study of the genesis of magmas of Réunion island, Indian Ocean. J. Geophys. Res. Solid Earth 1988, 93, 4933–4950. [Google Scholar] [CrossRef]
- Luais, B. Temporal changes in Nd isotopic composition of Piton de la Fournaise magmatism (Réunion Island, Indian Ocean). Geochem. Geophys. Geosyst. 2004, 5, 1–26. [Google Scholar] [CrossRef]
- Vlastélic, I.; Di Muro, A.; Bachèlery, P.; Gurioli, L.; Auclair, D.; Gannoun, A. Control of source fertility on the eruptive activity of Piton de la Fournaise volcano, La Réunion. Sci. Rep. 2018, 8, 14478. [Google Scholar] [CrossRef] [PubMed]
- Bosch, D.; Blichert-Toft, J.; Moynier, F.; Nelson, B.K.; Telouk, P.; Gillot, P.Y.; Albarède, F. Pb, Hf and Nd isotope compositions of the two Réunion volcanoes (Indian Ocean): A tale of two small-scale mantle blobs. Earth Planet. Sci. Lett. 2008, 265, 748–768. [Google Scholar] [CrossRef]
- Pietruszka, A.J.; Hauri, E.H.; Blichert-Toft, J. Crustal contamination of mantle-derived magmas within Piton de la Fournaise volcano, Réunion island. J. Petrol. 2009, 50, 661–684. [Google Scholar] [CrossRef][Green Version]
- Lacroix, A. Le Volcan Actif de l’île de la Réunion et ses Produits; Gauthier-Villars: Paris, France, 1936; 297p. [Google Scholar]
- Upton BG, J.; Wadsworth, W.J. The basalts of Réunion island, Indian Ocean. Bull. Volcanol. 1966, 29, 7–23. [Google Scholar] [CrossRef]
- Upton, B.G.J.; Wadsworth, W.J. Peridotitic and gabbroic rocks associated with the shield-forming lavas of Réunion. Contrib. Mineral. Petrol. 1972, 35, 139–158. [Google Scholar] [CrossRef]
- Ludden, J.N. Magmatic evolution of the basaltic shield volcanoes of Réunion Island. J. Volcanol. Geotherm. Res. 1978, 4, 171–198. [Google Scholar] [CrossRef]
- Albarède, F.; Tamagnan, V. Modelling the recent geochemical evolution of the Piton de la Fournaise volcano, Réunion Island, 1931–1986. J. Petrol. 1988, 29, 997–1030. [Google Scholar] [CrossRef]
- Famin, V.; Welsch, B.; Okumura, S.; Bachèlery, P.; Nakashima, S. Three differentiation stages of a single magma at Piton de la Fournaise (Réunion hotspot). Geochem. Geophys. Geosyst. 2009, 10, Q01007. [Google Scholar] [CrossRef]
- Peltier, A.; Famin, V.; Bachèlery, P.; Cayol, V.; Fukushima, Y.; Staudacher, T. Cyclic magma storages and transfers at Piton de la Fournaise volcano (La Réunion hotspot) inferred from deformation and geochemical data. Earth Planet. Sci. Lett. 2008, 270, 180–188. [Google Scholar] [CrossRef]
- Kornprobst, J.; Boivin, P.; Bachèlery, P. L’alimentation des éruptions récentes du Piton de la Fournaise (Ile de la Réunion, Océan Indien): Degré d’évolution et niveau de segregation des laves émises. C. R. L’Académie Sci. 1979, 288D, 1691–1694. [Google Scholar]
- Boivin, P.; Bachèlery, P. Petrology of 1977 to 1998 eruptions of Piton de la Fournaise, La Réunion Island. J. Volcanol. Geotherm. Res. 2009, 184, 109–125. [Google Scholar] [CrossRef]
- Albarède, F. High-resolution geochemical stratigraphy of Mauna Kea flows from the Hawaii Scientific Drilling Project core. J. Geophys. Res. 1996, 101, 11841–11853. [Google Scholar] [CrossRef]
- Clocchiatti, R.; Havette, A.; Nativel, P. Relations pétrogénétiques entre les basaltes transitionnels et les océanites du Piton de la Fournaise (île de la Réunion, océan Indien) à partir de la composition chimique des intrusions vitreuses des olivines et des spinelles. Bull. Minéralogie 1979, 102, 511–525. [Google Scholar] [CrossRef]
- Bureau, H.; Pineau, F.; Métrich, N.; Semet, M.P.; Javoy, M. A melt and fluid inclusion study of the gas phase at Piton de la Fournaise volcano (Réunion Island). Chem. Geol. 1998, 147, 115–130. [Google Scholar] [CrossRef]
- Di Muro, A.; Métrich, N.; Vergani, D.; Rosi, M.; Armienti, P.; Fougeroux, T.; Deloule, E.; Arienzo, I.; Civetta, L. The shallow plumbing system of Piton de la Fournaise volcano (La Réunion Island, Indian Ocean) revealed by the major 2007 caldera-forming eruption. J. Petrol. 2014, 55, 1287–1315. [Google Scholar] [CrossRef]
- Macdonald, G.A.; Katsura, T. Chemical composition of Hawaiian lavas. J. Petrol. 1964, 5, 82–133. [Google Scholar] [CrossRef]
- Frey, F.A.; Clague, D.A. Geochemistry of diverse basalt types from Loihi Seamount, Hawaii: Petrogenetic implications. Earth Planet. Sci. Lett. 1983, 66, 337–355. [Google Scholar] [CrossRef]
- Garcia, M.O.; Foss DJ, P.; West, H.B.; Mahoney, J.J. Geochemical and isotopic evolution of Loihi volcano, Hawaii. J. Petrol. 1995, 36, 1647–1674. [Google Scholar] [CrossRef]
- Valer, M.; Schiano, P.; Bachèlery, P. Geochemical characteristics of the La Réunion mantle plume source inferred from olivine-hosted melt inclusions from the adventive cones of Piton de la Fournaise volcano (La Réunion Island). Contrib. Miner. Pet. 2017, 172, 74. [Google Scholar] [CrossRef]
- Bureau, H.; Metrich, N.; Semet, M.P.; Staudacher, T. Fluid-magma decoupling in a hotspot volcano. Geophys. Res. Lett. 1999, 26, 3501. [Google Scholar] [CrossRef]
- Battaglia, J.; Aki, K.; Staudacher, T. Location of tremor sources and estimation of lava output using tremor source amplitude on the Piton de la Fournaise volcano: 2. Estimation of lava output. J. Volcanol. Geotherm. Res. 2005, 147, 291–308. [Google Scholar] [CrossRef]
- Boudoire, G.; Di Muro, A.; Michon, L.; Metrich, N. Footprints and conditions of multistep alkali enrichment in basaltic melts at Piton de la Fournaise (La Réunion Island, Indian Ocean). Bull. Volcanol. 2021, 83, 84. [Google Scholar] [CrossRef]
- Boudoire, G.; Di Muro, A.; Liuzzo, M.; Ferrazzini, V.; Peltier, A.; Gurrieri, S.; Boissier, P. New perspectives on volcano monitoring in a tropical environment: Continuous measurements of soil CO2 flux at Piton de la Fournaise (La Réunion Island, France). Geophys. Res. Lett. 2017, 44, 8244–8253. [Google Scholar] [CrossRef]
- Feldkamp, L.A.; Davis, L.C.; Kress, J.W. Practical Cone-Beam Algorithm. J. Opt. Soc. Am. A 1984, 1, 612–619. [Google Scholar] [CrossRef]
- Schindelin, J.; Arganda-Carreras, I.; Frise, E.; Kaynig, V.; Longair, M.; Pietzsch, T.; Preibisch, S.; Rueden, C.; Saalfeld, S.; Schmid, B.; et al. Fiji: An open-source platform for biological-image analysis. Nat. Methods 2012, 9, 676–682. [Google Scholar] [CrossRef]
- Aboulhassan, A.; Brun, F.; Kourousias, G.; Lanzafame, G.; Voltolini, M.; Contillo, A.; Mancini, L. PyPore3D: An Open Source Software Tool for Imaging Data Processing and Analysis of Porous and Multiphase Media. J. Imaging 2022, 8, 187. [Google Scholar] [CrossRef]
- Sun, S.; McDonough, W.F. Chemical and isotopic systematics of oceanic basalts: Implications for mantle composition and processes. In Geological Society; Special Publications: London, UK, 1989; Volume 42, pp. 313–345. [Google Scholar] [CrossRef]
- Di Muro, A.; Schwarzlmueller, F.; Kueppers, U.; Heap, M.; Dingwell, D. Petrophysical characterisation of volcanic ejecta to constrain subsurface lithological heterogeneities: Implications for edifice stability at basaltic volcanoes. Volcanica 2021, 4, 41–66. [Google Scholar] [CrossRef]
- Gurioli, L.; Di Muro, A.; Vlastélic, I.; Moune, S.; Thivet, S.; Valer, M.; Villeneuve, N.; Boudoire, G.; Peltier, A.; Bachèlery, P.; et al. Integrating field, textural, and geochemical monitoring to track eruption triggers and dynamics: A case study from Piton de la Fournaise. Solid Earth 2018, 9, 431–455. [Google Scholar] [CrossRef]
- Thivet, S.; Gurioli, L.; Di Muro, A. Basaltic dyke eruptions at Piton de La Fournaise: Characterization of the eruptive products with implications for reservoir conditions, conduit processes and eruptive dynamics. Contrib. Mineral. Petrol. 2020, 175, 1–24. [Google Scholar] [CrossRef]
- Lanzafame, G.; Iezzi, G.; Mollo, S.; Ferlito, C.; Mancini, L.; Lezzi, F. Solidification and Turbulence (Non-laminar) during Magma Ascent: Insights from 2D and 3D Analyses of Bubbles and Minerals in an Etnean Dyke. J. Petrol. 2017, 58, 1511–1533. [Google Scholar] [CrossRef]
- Lanzafame, G.; Giacomoni, P.P.; Casetta, F.; Mancini, L.; Iezzi, G.; Coltorti, M.; Ferlito, C. Degassing, crystallization and rheology of hawaiitic lava flows: The case of the 1669 A.D. eruption of Mount Etna (Italy). J. Petrol. 2023, 63, egac115. [Google Scholar] [CrossRef]
- Witham, F.; Blundy, J.; Kohn, S.C.; Lesne, P.; Dixon, J.; Churakov, S.V.; Botcharnikov, R. SolEx: A model for mixed COHSCl-volatile solubilityes and exsolved gas compositions in basalt. Comput. Geosci. 2012, 45, 87–97. [Google Scholar] [CrossRef]
- Vigouroux, N.; Williams-Jones, A.E.; Wallace, P.; Staudacher, T. The November 2002 eruption of Piton de la Fournaise, Re¤union: Tracking the pre-eruptive thermal evolution of magma using melt inclusions. Bull. Volcanol. 2009, 71, 1077–1089. [Google Scholar] [CrossRef]
- Ghiorso, M.S.; Sack, R.O. Chemical mass-transfer in magmatic processes. A revised and internally consistent thermodynamic model for the interpolation and extrapolation of liquidus–solid equilibria in magmatic systems at elevated temperatures and pressures. Contrib. Mineral. Petrol. 1995, 119, 197–212. [Google Scholar] [CrossRef]
- Villemant, B.; Salaün, A.; Staudacher, T. Evidence for a homogenous primary magma at Piton de la Fournaise (La Réunion): A geochemical study of matrix glass, melt inclusions and Pélé’s hairs of the 1998-2008 eruptive activity. J. Volcanol. Geotherm. Res. 2009, 184, 79–92. [Google Scholar] [CrossRef]
- Hunter, R.H. Textural equilibrium in layered igneous rocks. In Origins of Igneous Layering; Parsons, I., Ed.; D. Reidel: Dordrecht, The Netherlands, 1987; pp. 473–503. [Google Scholar] [CrossRef]
- Welsch, B.; Faure, F.; Famin, V.; Baronnet, A.; Bachèlery, P. Dendritic crystallization: A single process for all textures of olivine in basalts? J. Petrol. 2013, 54, 539–574. [Google Scholar] [CrossRef]
- Welsch, B.; Faure, F.; Bachèlery, P.; Famin, V. Microcrysts Record Transient Convection at Piton de la Fournaise Volcano (La Réunion Hotspot). J. Petrol. 2009, 50, 2287–2305. [Google Scholar] [CrossRef]
- Di Muro, A.; Métrich, N.; Allard, P.; Aiuppa, A.; Burton, M.; Galle, B.; Staudacher, T. Magma degassing at Piton de la Fournaise volcano. In Active Volcanoes of the Southwest Indian Ocean: Piton de la Fournaise and Karthala; Springer: Berlin/Heidelberg, Germany, 2016; pp. 203–222. [Google Scholar] [CrossRef]
- Presnall, D. Effect of pressure on the fractional crystallization of basaltic magma. In Mantle Petrology: Field Observations and High Pressure Experimentation: A Tribute t Francis R. (Joe) Boyd; The Geochemical Society, Special Publication: London, UK, 1979; p. 6. [Google Scholar]
- Liedl, A.; Buono, G.; Lanzafame, G.; Dabagov, S.B.; Della Ventura, G.; Hampai, D.; Mancini, L.; Marcelli, A.; Pappalardo, L. A 3D imaging textural characterization of pyroclastic products from the 1538 AD Monte Nuovo eruption (Campi Flegrei, Italy). Lithos 2019, 340, 316–331. [Google Scholar] [CrossRef]
- Staudacher, T.; Allègre, C.J. Ages of the second caldera of Piton de la Fournaise volcano (Réunion) determined by cosmic ray produced 3He and 21Ne. Earth Planet. Sci. Lett. 1993, 119, 395–404. [Google Scholar] [CrossRef]
- Principe, C.; Morandi, A.; Di Muro, A.; Michon, L. Volcanological map of the Plaine des Sables, Piton de la Fournaise. In Active Volcanoes of the Southwest Indian Ocean: Piton de la Fournaise and Karthala; Springer: Berlin/Heidelberg, Germany, 2016; pp. 327–330. [Google Scholar] [CrossRef]
Disclaimer/Publisher’s Note: The statements, opinions and data contained in all publications are solely those of the individual author(s) and contributor(s) and not of MDPI and/or the editor(s). MDPI and/or the editor(s) disclaim responsibility for any injury to people or property resulting from any ideas, methods, instructions or products referred to in the content. |
© 2023 by the authors. Licensee MDPI, Basel, Switzerland. This article is an open access article distributed under the terms and conditions of the Creative Commons Attribution (CC BY) license (https://creativecommons.org/licenses/by/4.0/).

