Article

Structural Features of K2O-SiO2 Melts: Modeling and High-Temperature Experiments

by
Olga N. Koroleva
1,*,
Mikhail V. Shtenberg
2 and
Armenak A. Osipov
2
1
Vernadsky Institute of Geochemistry and Analytical Chemistry, Russian Academy of Science, Moscow 119991, Russia
2
South Urals Federal Research Center of Mineralogy and Geoecology of the Urals Branch of the Russian Academy of Sciences (SU FRC MG UB RAS), Miass 456317, Russia
*
Author to whom correspondence should be addressed.
Minerals 2023, 13(1), 94; https://doi.org/10.3390/min13010094
Submission received: 24 November 2022 / Revised: 2 January 2023 / Accepted: 5 January 2023 / Published: 7 January 2023

Abstract

:
Despite numerous investigations, the thermodynamic properties of potassium silicates remain apparently contradictory. In situ experiments are complicated by the unstable behavior of a K2O–SiO2 melt in the region of compositions with a high potassium oxide content. In this paper, we study the structure of melts by the method of physicochemical modeling, taking into account the results of high-temperature Raman spectroscopy. To do this, the Raman spectra were curve-fitted, taking into account the second coordination sphere of silicon atoms. From the interpretation of the spectra of K2O–SiO2 glasses and melts having a K2O content of up to 55 mol.%, quantitative characteristics of the system were obtained. Since available information on the thermodynamic properties of potassium silicates is known to be contradictory, coordinated thermodynamic characteristics of potassium silicates, some of which were evaluated, were used as input data for modeling. Structural modeling of glasses and melts of the K2O–SiO2 system was carried out across a range of compositions up to 60 mol.% potassium oxide. The database of structural units of melts of the potassium silicate system, updated according to experimental data, will find practical application in chemistry, geochemistry and engineering fields.

1. Introduction

The physicochemical properties of potassium silicates, which form a component of many minerals, are important for geochemistry, petrology and mineralogy. Both in terms of theoretical calculations and experimental approaches, it is the structure of the crystalline phases K2O–SiO2 forming in melts that is of supreme interest. Diffraction [1,2,3] and spectroscopic [3,4,5,6,7] techniques have been widely used to describe the structural features that control the properties of alkali silicate glasses, as well as more complex compositions [8,9,10,11]. However, fundamental questions concerning the structure of the silicate anionic network in alkali silicate glasses and liquids remain unanswered. Whereas the potassium-silicate system offers a wide glass formation area, the high-alkali region is characterized by the crystallization, water sensitivity and alkali volatility. In situ experiments of the K2O–SiO2 melts are complicated by unstable behavior already observed in the region of compositions from 40 mol.% of potassium oxide. Arising from these difficulties, there is continuing disagreement about the interpretation of experimental data and its implications for the structure of glasses [12,13,14,15,16].
In this paper, we attempted to study the structure of glasses and melts by two methods: physicochemical modeling and Raman spectroscopy. Although various approaches can be taken to study the structural description of silicate systems, a polymer theory is more convenient for the present purposes. Commonly, the degree of polymerization is quantified via the abundance of the different Qn species, where Q represents a SiO4 tetrahedron and n is the number of bridging O atoms. The composite anions comprising such variably polymerized structural units, connected via bridging bonds in a melt or a disordered network in a glass, form the basis of silicate crystal chemistry. According to this system description, it is necessary to determine which structural units occur in melts and in what concentrations depending on composition and temperature. The abundance of these Qn species is controlled by the following disproportionation reactions:
2Qn = Qn+1 + Qn−1 (n = 3, 2, 1),
2Q0 = 2Q1 + O2−,
where O2− is a free oxygen ion not included in a tetrahedron.
The result of simulation and Raman spectroscopy can be presented in the form of a Qn distribution to allow the correction of models based on experimental data. Potassium silicate glasses and melts have been the least studied compared with lithium and sodium silicate systems. This is especially true for high-temperature experimental data, which have only been published, to date, for compositions up to 38 mol.% K2O [5,17,18]. In this regard, the expansion of the research area of the structure of this system up to 55 mol.% K2O is an absolute novelty.

2. Methods

2.1. Modeling Method

The universal “Selektor-C” software (ver. 1, Institute of geochemistry SB RAS, Irkkutsk, Russia) complex was used for analyzing data from physicochemical processes occurring in the potassium silicate melts. The decision to use this software was made due to its versatility, as demonstrated by a number of pieces of work in the field of geochemistry, chemistry, metallurgy, materials science, etc. [19,20]. The results of applying this approach to the study of the structure of binary alkali silicate [21], germanate [22] and borate [23] glass-forming systems are published in our previous papers. The approach for modeling the structure of melts assumes the existence of a database of structural units. Earlier modeling has been carried out across a wide range of compositions for lithium and sodium silicate glasses and melts based on the available quantitative information about their structure [4,24].
The formalism of physicochemical modeling is comprehensively described in the work by [21]. Briefly, it is worth recalling that the equilibrium of a system is calculated through the global minimum. Independent components represent the smallest number of stoichiometric components from which it is possible to obtain compositions of all components and phases of the system by their linear combination with positive coefficients. In the case of silicate systems, these are silicon-oxygen structural units. Individual substances are called dependent components of the system, whose number is minimal but necessary for describing the system in equilibrium. Using the quasicrystalline approximation, based on the assumption that the melts comprise ideal associated solutions, the thermodynamic characteristics of crystalline silicates can be used to describe the structure of the melts in terms of the distribution of Qn units. This approach allows the thermodynamic values of the melt components to be described in the absence of assumptions about the size and shape of silicate anions. In order to determine the thermodynamic characteristics of structural units, thermodynamic data on stoichiometric silicates were used as initial parameters; here, quartz, di-, meta-, pyro- and orthosilicates corresponded to the characteristics of the structural units of the silicate systems Q4, Q3, Q2, Q1 and Q0, respectively. In accordance with the phase diagram of silicates, the stoichiometric compounds considered in the model have the following forms: SiO2, 0.5K2Si2O5, K2SiO3, 0.5K6Si2O7 and K4SiO4. When simulating the structure of silicate melts in the “Selector-C” software package, we took into account the influence of the chemical composition (SiO2/K2O ratio) and temperature on the component composition of the melt. Here, the chemical composition varied from pure silica to orthosilicate (60 mol.% K2O) while the temperature range was set from 20 to 1300 °C. According to our approach, the “melt” phase included all the components in the liquid state that characterize the K2O-SiO2 system, namely SiO2, KSiO2.5, K2SiO3, K3SiO3.5, K4SiO4 and K2O.
A necessary part of the modeling process is the stage of model adjustment based on experimental data, which is provided in the software package. However, there are contradictions in the available information on the thermodynamic properties of potassium silicates [25,26,27,28]. As input data for modeling, we used the consistent thermodynamic characteristics of potassium silicates, some of which have been evaluated [29]. Thus, the correction of physicochemical models is the second stage of the modeling process. It involves a determination of the free energy of the formation of the components of the melt system from its composition. The results of in situ Raman spectroscopy can be used as experimental data to obtain a quantitative distribution of structural units in the glass-forming system. The correction of the physicochemical model is a necessary stage of modelling not only for obtaining adequate results but also for the creation of a base for further research. By taking into account the results of high-temperature Raman spectroscopy for the correction of physicochemical models, we obtained a database of thermodynamic properties of structural units of oxide melts. The approach applied here uses limitations on components of the glasses and melts model from their analytical composition obtained from spectroscopy. For this purpose, the results of experimental investigations of the potassium silicate glasses and melts structure at temperatures from 20 to 1115 °C were used.
Thus, the novel method applied for studying the structure of glass-forming systems presented in this work was based on physicochemical modeling of the structure of glasses and melts and introduction of corrections based on the results of high-temperature Raman experiments. The updated databases of the thermodynamic characteristics of structural units of melts and glasses updated as a result of this work will form a useful resource for studying these systems across an extended range of compositions and temperatures.

2.2. Raman Spectroscopy Data

Correction of the physicochemical model is a required step of modeling-based approaches not only to obtain adequate results but also to form a database for further research. The approach for calculating the structure of potassium silicate glasses and melts implies the introduction of restrictions from their analytical composition obtained from in situ Raman spectroscopy. For the registration of a Raman spectrum of a melt, a crucible with the glass sample was placed in a platinum compact oven equipped with a temperature controller providing for the stability of the set temperature with an accuracy of ±1 °C. The non-polarized Raman spectra were registered by a powerful LTI-701 Nd laser (λ = 532 nm, <P> = 1 W) with a pulse frequency of 8.7 kHz and duration based on acoustic optical shutter of 2 µs. This was used together with a synchronized photon counter, which opened only during a laser pulse. An uncooled FEU-79 photomultiplier was used to detect the Raman signal [30]. In order to compare the spectra obtained at various temperatures, we adjusted them for the thermal population of vibration levels [31]. To attain a detailed description of the melt structure, the Raman spectra were represented as a superposition of Gaussians in accordance with a technique previously developed for binary alkali silicate glasses. The background was removed using a second-order polynomial fit in the 400–650 and 700–1000 cm−1 spectral region with its further extrapolation to the lower wave numbers and subtraction from the spectrum.
As shown earlier [4,24,32], the correct interpretation of the Raman spectra of silicate and germanate systems can be achieved if the second coordination sphere of silicon atoms (germanium) is taken into account. Therefore, when deconvoluting the Raman spectra into a superposition of lines, the presence of Qnm structural units was taken into account, where ‘n’ indicates the type of the central tetrahedron and ‘m’ indicates the type of the nearest tetrahedron connected by a bridge connection [24]. Interpretation of the Raman spectra of glasses and melts of the K2O–SiO2 system only became possible due to the introduction of several types of structural units with 2 and 3 non-bridging oxygen atoms. This approach has proven itself in the curve fitting of the high-frequency region of the spectra of binary and three-component silicate and germanate systems.

3. Results and Discussion

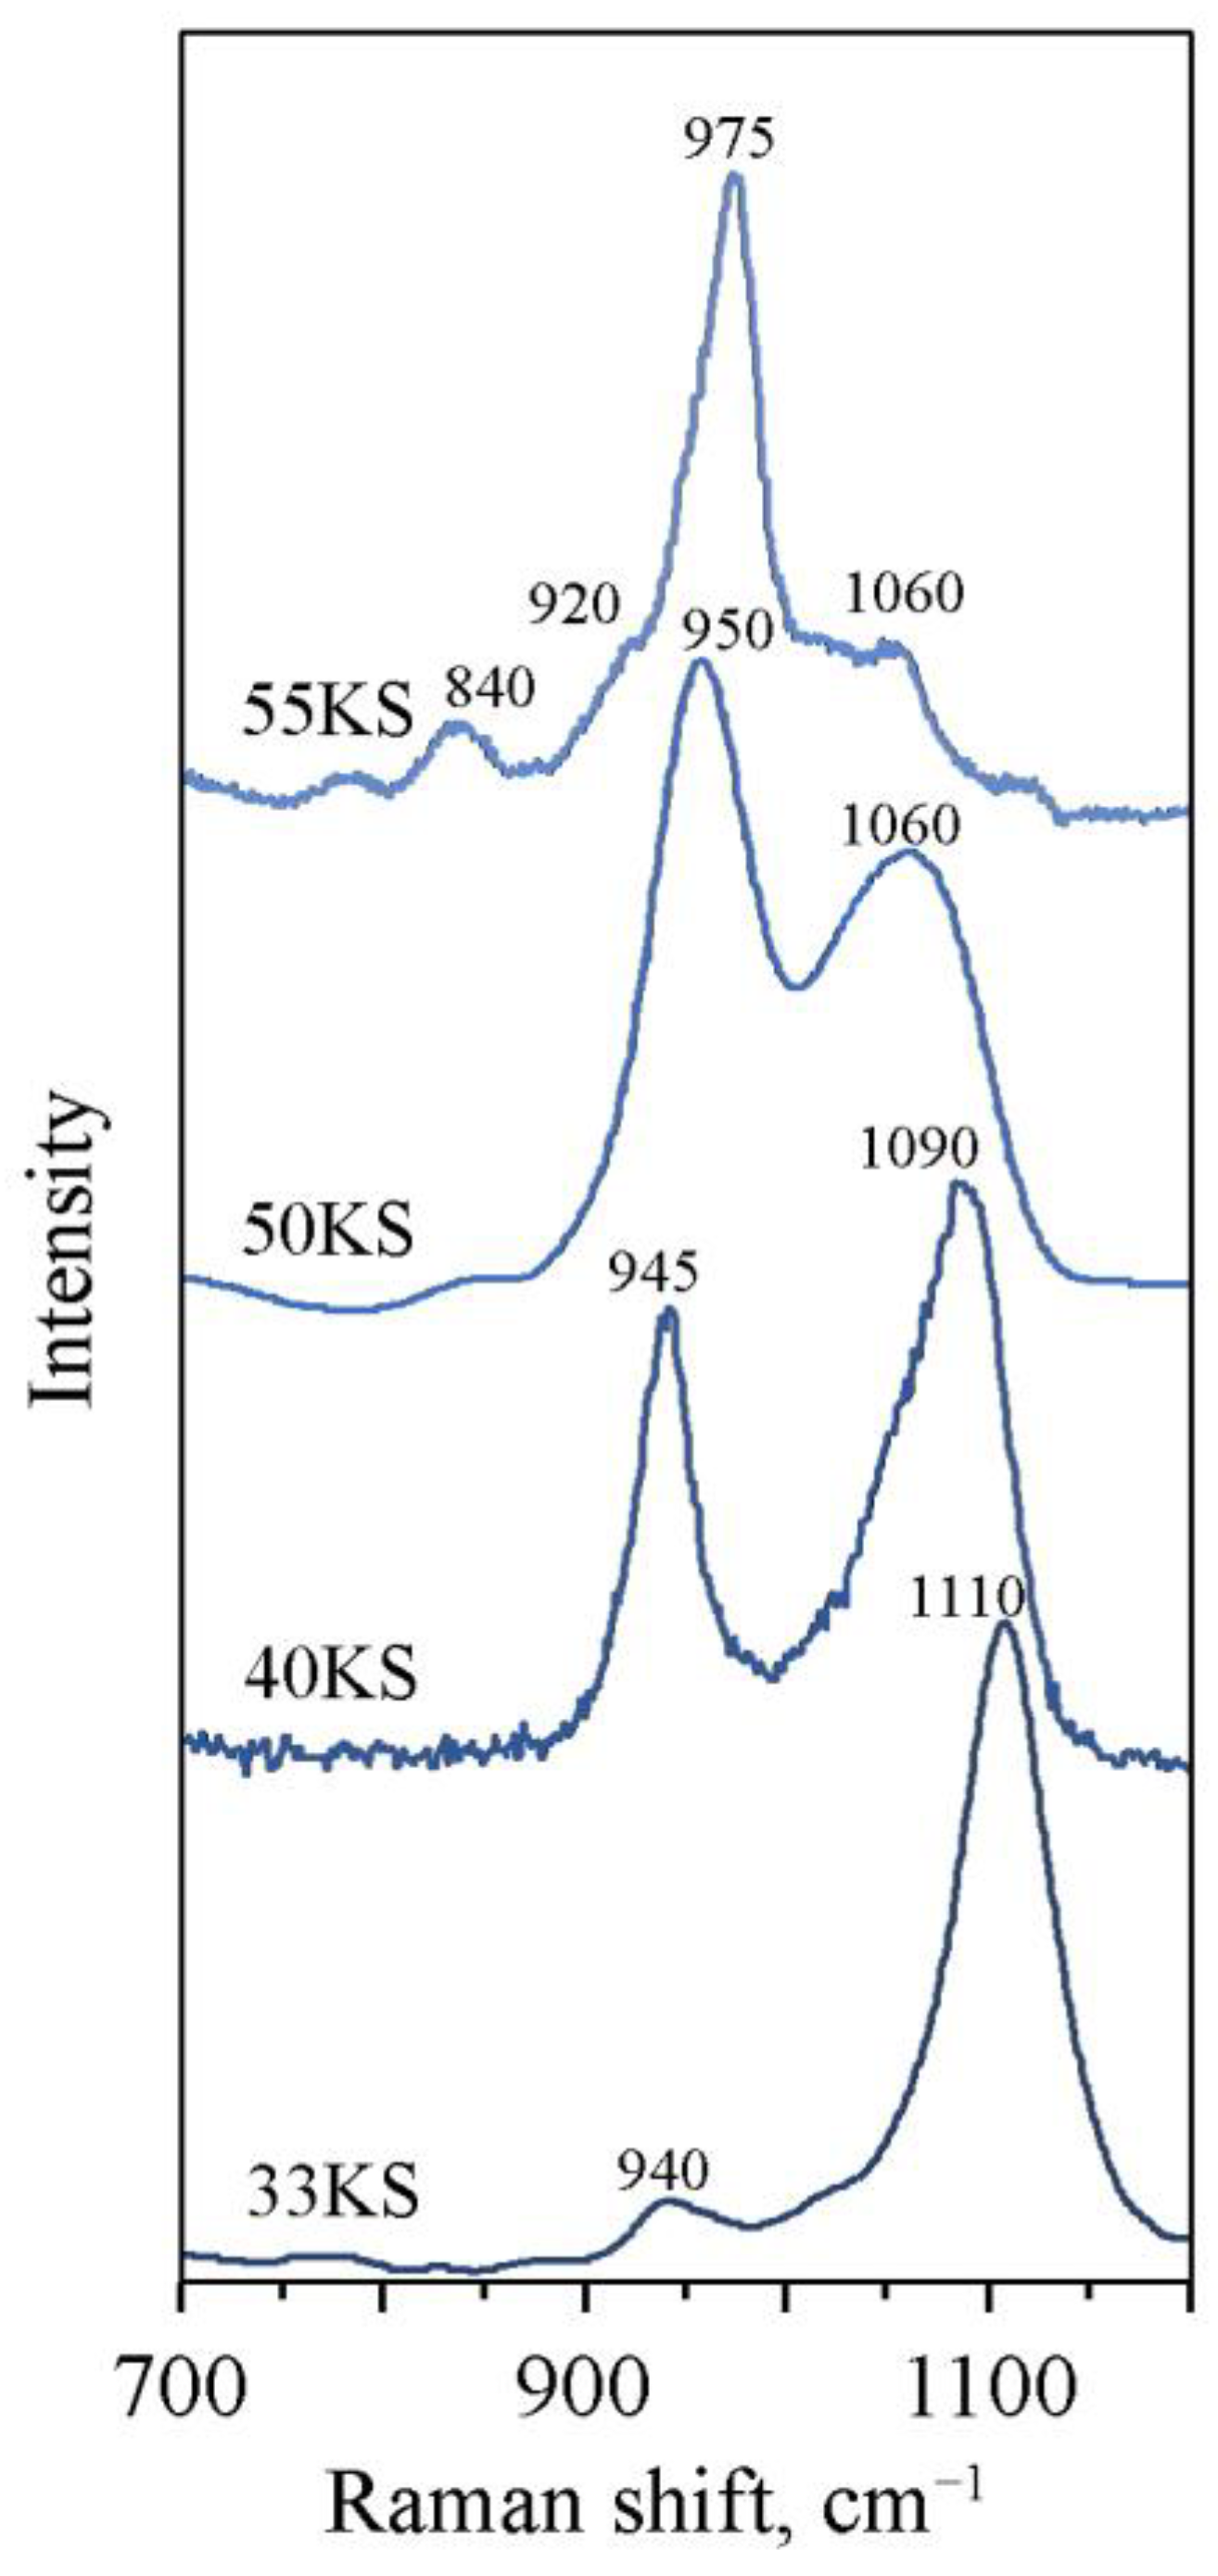
3.1. Raman Spectroscopy of K2O-SiO2 Melts and Glasses

Figure 1 depicts the Raman spectra of glasses xK2O-(1 − x)SiO2 with x = 33, 40, 50, 55 (further 33KS, 40KS, 50KS, 55KS). Regular changes are observed in the Raman spectra with an increase in the proportion of potassium in the composition of the system, namely, a decrease in the high-frequency band at about 1100 cm−1 and the appearance of a band of about 945 cm−1, which can be attributed to vibrations in the structural units Q3 and Q2, respectively. The two shoulders appearing in addition to these two bands would be impossible to interpret without introducing other types of the same structural units. Thus, the interpretation of similar Raman spectra of the sodium silicate system was carried out using the introduced parameter Qnm [24].
Detailed discussions of this issue by researchers studying the structure of potassium silicate glasses by NMR spectroscopy have concluded that the standard approach of the symmetric contribution of each type of Qn unit to the NMR spectrum does not apply in the case of potassium disilicate [13]. The results of the X-ray diffraction (XRD) and 29Si NMR spectroscopy of crystalline potassium silicate shows that only Q3 types are present in the crystal. However, here the Q3 signals are not distributed symmetrically with respect to the chemical shift, but bimodally. As it happened, although only one type of Q was fitted, a better description of the spectrum would have been obtained using two Gaussian peaks. In any case, whether choosing one or another type of interpretation for bands on the spectrum, it is necessary to control the composition by the number of non-bridging oxygen atoms NBO/Si [12,33]. Various approaches have been applied to interpret the NMR spectrum of potassium metasilicate and glass of the same composition [34]. Here, whereas the potassium metasilicate spectrum displays four peaks, the sodium metasilicate spectrum includes only three peaks. In an attempt to obtain a fit where NBO/Si = 2.0, one type of Q1, two types of Q2 and one type of Q3 species were assigned to the peaks, even though there was no expectation of the presence of two different Q2 species in potassium silicate glasses.
The temperature dependence of the melt structure can be determined based on changes in the Raman spectra of glasses and melts of the potassium silicate system (Figure 2). The melts of 55KS compositions have not been studied by Raman spectroscopy due to alkali volatility. In our early work [18,33], the deconvolution of the spectra of 33KS and 40KS glasses was given without taking into account several types of the same species of silicon-oxygen tetrahedrons; for this reason, the interpretation turned out to be incomplete. Figure 3 shows the curve fitting models of high-frequency spectral regions for each composition used in this work for determining Qn distributions in glasses and melts of the potassium silicate system. Since the shape of the 33KS spectrum is similar to 33NS [24], it can be described by the same set of lines—Q2, Q3 and Q32. The spectrum of 40KS glass is similar to the 40NS spectrum but is characterized by a noticeable shoulder in the region of 1060 cm−1, which we consider to be a characteristic of vibrations of Q32 units. With this form of the spectrum, it is necessary to introduce another band, which may be the result of vibrations of the bonds of the Q23 units. Although both bands are observed in the spectra of glasses up to the composition of 55KS, it is the band in the region of 1060 cm−1 in the 50KS glass that is the distinguishing feature of potassium glass from lithium and sodium glasses. Interestingly, the shape of this spectrum is similar to the Raman spectrum of the 40NS glass from [24].
In general, our results agree with the results of the NMR spectroscopy of glasses, where it was assumed that a significant amount of the second type of Q2 units is determined in the glass of potassium metasilicate composition and that two types of Q3 units are present in the structure of potassium silicate glass of disilicate composition [13,34]. The metasilicate glass is characterized by an increased content of structural units Q3, and metasilicate glass is characterized by Q2. Therefore, it is to be expected that two types of Q3 units will be implemented in disilicate compositions, whereas several types of Q2 structural units can be expected in compositions close to 50 mol.% of alkali. In order to fully comply with the calculated data from NMR spectroscopy, it would be necessary to attribute a band of about 1060 cm−1 to vibrations of structural units Q2; however, this is not possible. Rather, these differences are likely to be related to the absorption of water and the incorporation of H2O in highly alkaline silicate systems due to dissolving in the form of OH groups and the formation of so-called “molecular” water [33]. The break-up of oxygen bridges by the formation of OH groups is known to lead to large structural modifications at water contents ≤ 3 wt% H2O, as indicated by the density data, as well as by Raman and NMR spectroscopy [35,36]. In the future, this issue should be solved by applying, for example, the method of IR spectroscopy, which makes it possible to separate vibrations of bound and free water [35,36].
On the basis of the resulting deconvolution of Raman spectra of potassium silicate glasses and melts, it can be concluded that the size of the modifier cation, which can be described as Qn distribution, has a significant effect on the system structure. The calibration coefficients from peak signals to concentrations of structural units in glasses were calculated. These are equal to 5.8, 1.8 and 1 for units of Q1, Q2 and Q3, respectively. The further procedure is similar to that used earlier for alkali silicate systems [4,24]. The high-frequency region of the Raman spectra of 33KS and 50KS glass and melts was curve fitted by a number of lines using the PeakFit v. 4.11 software package (Systat, CA, USA). The results for compositions of 33KS and 50KS are presented in Table 1 and Table 2, respectively.
The calculated concentrations of structural units allow us to calculate the equilibrium constant of the reaction between them in the system. For glasses and melts of 33KS and 50KS compositions, the equilibrium is described by Equation (1) at n = 3 and 2, respectively. Table 1 shows that the equilibrium constant k3, calculated from the distribution of Qn species, increases with temperature. The equilibrium shifts to the right side, causing the formation of additional tetrahedra Q2 and Q4. Increasing temperature from 20 to 1115 °C leads to a decrease in Q3 content from 84 to 50 mol.% by increasing the concentration of Q2 and Q4 from 8 to 25 mol.% (Figure 4). At the same time, the k3 value increases from 0.01 to 0.23 with temperature, while Q3 remains the main structural unit in the 33KS melt.
The calculated concentrations of Qn species in 50KS glasses and melts are shown in Table 2. Here, it can be seen that the number of Q2 species decreases from 66 ± 3.3 to 49 ± 2.9 mol.% with heating of the sample up to 1044 °C. Structural units interacting by Reaction (1) at n = 2 are mainly represented by Q2 units included in the chains. The increased numbers of Q3 and Q1 species indicate a significant shift of Reaction (1) to the right for all temperature points.
Thus, taking into account the second coordination sphere of silicon atoms (Table 3), the interpretation of the Raman spectra of potassium silicate glasses and melts was used to determine the quantitative characteristics of the structure of the K2O-SiO2 systems. Information about the Raman bands positions can serve as a basis for the interpretation of experimental data on spectroscopy of silicon-containing oxide systems, one of the components of which is potassium oxide. The thus-obtained Qn distribution is suitable for correcting the physicochemical model of the potassium silicate melt.

3.2. Physicochemical Modeling of K2O-SiO2 Melts and Glasses

The physicochemical modeling of the K2O-SiO2 melt was carried out using an approach previously used for silicate melts [21]. In this paper, the area of compositions for which the distribution of structural units was calculated was significantly expanded. The model was corrected using the results of high-temperature Raman spectroscopy of 33KS and 50KS melts. Figure 4 shows the distribution of structural units calculated by the minimization method in the K2O-SiO2 melt at 20 and at 1300 °C in comparison with experimental data. The model updated with experimental data was used to correct the database and obtain adequate solutions for melts of the control compositions 33KS (Figure 5a) and 50KS (Figure 5b). The simulation results describe an increased content of Q3 structural units in the potassium silicate system, which can be found in all glasses and melts of the system up to the composition of potassium pyrosilicate. This is consistent with the results of Raman spectroscopy, where tetrahedra with one non-bridging oxygen atom can be detected in all the studied compositions.
The thermodynamic characteristics of the structural units obtained after adjusting the model, as well as the equilibrium constants of Reaction (1) at n = 3, are presented in Table 4. The table shows that the equilibrium constant decreases with a decreasing temperature, which is accompanied by a shift in the equilibrium of Reaction (1) to the left. The equilibrium constant of Reaction (1) at n = 2 could not be calculated due to the absence of corrected thermodynamic characteristics of the structural unit Q1. This would be possible in the case of recording the Raman spectrum of 60KS melt and obtaining information about the structure of a highly alkaline melt.
Figure 4 also shows the distribution of structural units at 1300 °C. The rising amount of Q3 and the disappearance of Q4 and Q2 units with the cooling of the melt corresponds to the ordered increase in the structure and possible crystallization of potassium disilicate. The Figure 4 shows how adjusting the model with the maximum possible number of control points influences the result. To make corrections of the model of the potassium silicate system, only experimental data of 33KS and 50KS melts were taken into account. In this regard, the results of calculations of the system structure in the region with a significant content of Q1 units can be evaluated only at a qualitative level. The thermodynamic characteristics of this type of tetrahedra have not been corrected due to the lack of experimental data for melts of potassium pyrosilicate composition despite their content in the system playing an important role in the structure of the melt compositions starting from 33 mol.% K2O.
The distribution of structural units depending on composition and temperature can be considered as having been correctly determined as a result of modeling. However, the temperature dependence of the distribution of the structural units in the potassium metasilicate melt is not so pronounced. This leads to important limitations concerning the model’s application: it does not work correctly outside the temperature range taken into account during the model correction procedure with limited experimental data. As a starting point for modeling melts, it is most convenient to focus on the glass transition temperature, Tg. A similar conclusion is formulated about the composition range: the model will only work correctly in the area of melts of those compositions whose thermodynamic characteristics of the constituent components have been corrected.
Figure 6a compares the results of physicochemical modeling with the temperature dependences of lnk3 based on the results of Raman spectroscopy and NMR [34], as well as those calculated from NIST database [37]. The equilibrium constants calculated from the results of the Raman spectroscopy and NMR spectroscopy of 33KS glass are in good agreement. The value of the change in the enthalpy of Reaction (1) in the 33KS melt was determined from the angle of inclination of the lnk3 (1000/T) curves at temperatures up to Tg. According to the results of physicochemical modeling and Raman spectroscopy of the 33KS melt used in this work, the values are ΔH1 = 121 ± 24 and 89 ± 18 kJ/mol, correspondingly. The values are slightly higher than the value of the enthalpy change in this reaction calculated from the NIST database (53 ± 11 kJ/mol). In addition, it differs from the values of 58 kJ/mol [6] and 33.1 ± 7.3 kJ/mol [5]. This may be explained by a different approach to spectrum deconvolution [5,34]. In this work, the band between about 1010–1040 cm−1 characterizing the vibrations of the Q32 units was taken into account [4,21,24].
Figure 6b shows the dependence of the logarithm of the equilibrium constant of Reaction (1) at n = 2 on 1000/T, calculated from the results of Raman spectroscopy of 50KS. Based on the angle of inclination of the lnk2 (1000/T), the experimental change in the enthalpy of the reaction was determined to be equal to ΔH2 = 38.3 ± 7.6 kJ/mol. The value obtained from the results of physicochemical modeling equal to ΔH2 = 29.1 ± 5.8 kJ/mol is within the margin of error. Differences in the thermal effects of reactions between structural units in melts of compositions 33KS and 50KS correlate with the data obtained for the sodium silicate system [21]. The value of the change in the enthalpy of the reaction decreases with an increase in n. In addition, the value of ΔH2 varies from −18.7 ± 4 (estimate) → 8.5 ± 2 (experiment) → 38.3 ± 7.6 (experiment) in the series Li → Na → K for the reaction in the melt of the metasilicate composition. A similar relationship was determined for the reaction between structural units in the melts of the disilicate composition: −18 ± 4 → 20.2 ± 4 → 89 ± 18. The change in the enthalpy of reactions similar to Reaction (1) between structural units is certain to increase with the growth of the ionic potential of the modifier cation.
In addition, it was noted that in alkali silicate glasses there is a decrease in the equilibrium constant of Reaction (1) at n = 3 k3 with an increase in the radius in the series from lithium to cesium [33]. The latter fact indicates a shift in the equilibrium of this reaction to the left with an increase in the ionic potential of the cation, which leads to an increased content of Q2-type structural units in lithium glass. In the case of Reaction (1) at n = 2, a slightly different situation is observed. Here, with an increase in the radius in the range from lithium to potassium, there is a change in the equilibrium constant k2 from 0.04 to 0.07. Conversely, in the melt at 1120 °C, the value of the constant changes from 0.02 → 0.14 → 0.32. That is to say, with an increase in the ionic potential of the cation, there is a shift in the equilibrium of Reaction (1) at n = 2 to the right, which leads, in particular, to a reduced content of Q2-type structural units in potassium glass, as compared with sodium and potassium glasses. The obtained results demonstrate the correctness of the chosen approach, on which basis the structure of the melt is predicted along with the features of its glass transition to evaluate the quantitative characteristics of the composition and properties of the system.
It should be noted that the presented physicochemical modeling results are based on thermodynamic data obtained during the correction of the model, which was, in turn, based on experimental data. The Raman spectra were interpreted under the assumption of more than one subtype of each type of Qn unit in glasses and melts. The obtained results may be useful in interpreting other experimental data of similar oxide systems.

4. Conclusions

As a result of studying the structure of glasses and melts of the K2O-SiO2 system by Raman spectroscopy and physicochemical modeling, we were able to significantly expand the region of study up to compositions of 60 mol.% potassium oxide. By correcting the physicochemical model on the basis of available experimental data, an updated database of structural units of potassium silicate melts was obtained. The limits of purely experimental approaches can be overcome by combining theoretical and experimental approaches to the study of the melt structure. The formed models of the potassium silicate system can be used to predict the structure of the melt depending on temperature and composition. The obtained thermodynamic characteristics of Qn units can be used for both studying the behavior of the system in the studied compositions depending on temperature and interpolating data within the studied composition region. The proposed approach to the interpretation of the Raman spectra of K2O-SiO2 melts thus forms a reliably substantiated theoretical basis for further studies of potassium-containing melts and quantitative analysis of structural changes occurring in them.
Although the advantage of the proposed method of accounting for several subtypes of structural units of the same type in alkali silicate glasses and melts is demonstrated by the structural interpretation, additional direct studies are necessary to clarify the structure of highly alkaline melts. At the same time, it is extremely important to ensure control over moisture absorption, which unambiguously affects the structure of potassium silicate systems due to the formation of “molecular” water in glasses and melts. The obtained data will be used both in the study of the spectral characteristics of new compounds and in the study of magma-forming melts in experimental geochemistry.

Author Contributions

Conceptualization and writing—original draft preparation, O.N.K.; methodology and visualization, M.V.S.; investigation, O.N.K. and A.A.O.; writing—review and editing, M.V.S. and A.A.O. All authors have read and agreed to the published version of the manuscript.

Funding

The analytical part of the research was supported by Ministry of Science and Higher Education of the Russian Federation in the framework of the State Task No. 122040800014-4 (No. 075-0880-22). The participation of M.V.S. was supported by the grant of the Russian Science Foundation No. 22-17-20005 (https://rscf.ru/project/22-17-20005/accessed on 6 January 2023). The data analysis was performed by O.N.K. within the Project of the State Assignment (Vernadsky Institute of Geochemistry and Analytical Chemistry of Russian Academy of Sciences, Moscow, Russian Federation).

Data Availability Statement

Data is contained within the article.

Acknowledgments

We would like to thank the anonymous reviewers for providing useful comments, which improved the quality of the manuscript.

Conflicts of Interest

The authors declare no conflict of interest.

References

  1. Morard, G.; Hernandez, J.-A.; Guarguaglini, M.; Bolis, R.; Benuzzi-Mounaix, A.; Vinci, T.; Fiquet, G.; Baron, M.A.; Shim, S.H.; Ko, B.; et al. In situ X-ray diffraction of silicate liquids and glasses under dynamic and static compression to megabar pressures. Proc. Natl. Acad. Sci. USA 2020, 117, 11981–11986. [Google Scholar] [CrossRef] [PubMed]
  2. Taniguchi, T.; Okuno, M.; Matsumoto, T. X-ray diffraction and EXAFS studies of silicate glasses containing Mg, Ca and Ba atoms. J. Non-Cryst. Solids 1997, 211, 56–63. [Google Scholar] [CrossRef]
  3. Richet, P.; Mysen, B.O.; Andrault, D. Melting and premelting of silicates: Raman spectroscopy and X-ray diffraction of Li2SiO3 and Na2SiO3. Phys. Chem. Miner. 1996, 23, 157–172. [Google Scholar] [CrossRef]
  4. Koroleva, O.N. The structure of lithium silicate melts revealed by high-temperature Raman spectroscopy. Spectrosc. Lett. 2017, 50, 257–264. [Google Scholar] [CrossRef]
  5. Malfait, W.J.; Zakaznova-Herzog, V.P.; Halter, W.E. Quantitative Raman spectroscopy: High-temperature speciation of potassium silicate melts. J. Non-Cryst. Solids 2007, 353, 4029–4042. [Google Scholar] [CrossRef]
  6. Maehara, T.; Yano, T.; Shibata, S.; Yamane, M. Structure and phase transformation of alkali silicate melts analysed by Raman spectroscopy. Philos. Mag. 2004, 84, 3085–3099. [Google Scholar] [CrossRef]
  7. Mysen, B.O.; Frantz, J.D. Silicate melts at magmatic temperatures: In-situ structure determination to 1651 °C and effect of temperature and bulk composition on the mixing behavior of structural units. Contrib. Mineral. Petrol. 1994, 117, 1–14. [Google Scholar] [CrossRef]
  8. Korobatova, N.M.; Koroleva, O.N. Structural variations of germanosilicate glasses with change in modifier cation type or Ge/Si ratio. Spectrochim. Acta A Mol. Biomol. Spectrosc. 2020, 237, 118361. [Google Scholar] [CrossRef] [PubMed]
  9. Grund Bäck, L.; Ali, S.; Karlsson, S.; Möncke, D.; Kamitsos, E.I.; Jonson, B. Mixed alkali/alkaline earth-silicate glasses: Physical properties and structure by vibrational spectroscopy. Int. J. Appl. Glass Sci. 2019, 10, 349–362. [Google Scholar] [CrossRef]
  10. Bykov, V.N.; Ivanova, T.N.; Koroleva, O.N. Raman spectroscopy of borosilicate and germanate-silicate glasses and melts. Russ. Metall. Met. 2011, 2011, 719–722. [Google Scholar] [CrossRef]
  11. Karlsson, C.; Zanghellini, E.; Swenson, J.; Roling, B.; Bowron, D.T.; Börjesson, L. Structure of mixed alkali/alkaline-earth silicate glasses from neutron diffraction and vibrational spectroscopy. Phys. Rev. B 2005, 72, 064206. [Google Scholar] [CrossRef]
  12. Stebbins, J.F. Anionic speciation in sodium and potassium silicate glasses near the metasilicate ([Na,K]2SiO3) composition: 29Si, 17O, and 23Na MAS NMR. J. Non-Cryst. Solids X 2020, 6, 100049. [Google Scholar] [CrossRef]
  13. Sawyer, R.; Nesbitt, H.W.; Bancroft, G.M.; Thibault, Y.; Secco, R.A. Spectroscopic studies of oxygen speciation in potassium silicate glasses and melts. Can. J. Chem. 2014, 93, 60–73. [Google Scholar] [CrossRef] [Green Version]
  14. Davis, M.C.; Kaseman, D.C.; Parvani, S.M.; Sanders, K.J.; Grandinetti, P.J.; Massiot, D.; Florian, P. Q(n) species distribution in K2O·2SiO2 glass by 29Si magic angle flipping NMR. J. Phys. Chem. A 2010, 114, 5503–5508. [Google Scholar] [CrossRef] [PubMed] [Green Version]
  15. de Jong, B.H.W.S.; Super, H.T.J.; Spek, A.L.; Veldman, N.; Nachtegaal, G.; Fischer, J.C. Mixed alkali systems: Structure and 29Si MAS NMR of Li2Si2O5 and K2Si2O5. Acta Crystallogr. B 1998, 54, 568–577. [Google Scholar] [CrossRef] [Green Version]
  16. McMillan, P.F.; Wolf, G.H.; Poe, B.T. Vibrational spectroscopy of silicate liquids and glasses. Chem. Geol. 1992, 96, 351–366. [Google Scholar] [CrossRef]
  17. Bykov, V.N.; Koroleva, O.N. Thermodynamic simulation of the behavior of network-modifying cations in multicomponent silicate melts. Geochem. Int. 2010, 48, 1128–1130. [Google Scholar] [CrossRef]
  18. Bykov, V.N.; Koroleva, O.N.; Osipov, A.A. Structure of melts K2O-SiO2 system by Raman spectroscopy and thermodynamic modeling. Rasplavy 2008, 3, 50–59. (In Russian) [Google Scholar]
  19. Bychinskii, V.A.; Tupitsyn, A.A.; Koroleva, O.N.; Chudnenko, K.V.; Fomichev, S.V.; Krenev, V.A. Specifics of representation of thermodynamic functions in the method of thermodynamic potential minimization. Russ. J. Inorg. Chem. 2013, 58, 824–829. [Google Scholar] [CrossRef]
  20. Bychinskii, V.A.; Tupitsyn, A.A.; Chudnenko, K.V.; Mukhetdinova, A.V.; Fomichev, S.V.; Krenev, V.A. Extrapolation of thermodynamic functions in calculation of phase equilibria by the Gibbs energy minimization method. Russ. J. Inorg. Chem. 2013, 58, 1197–1202. [Google Scholar] [CrossRef]
  21. Koroleva, O.N.; Bychinsky, V.A.; Tupitcyn, A.A. Thermodynamic modelling of M2O-SiO2 (M–Li, Na, K) melts as applying to mixed alkali systems. J. Non-Cryst. Solids 2021, 571, 121065. [Google Scholar] [CrossRef]
  22. Koroleva, O.N.; Shtenberg, M.V.; Bychinskii, V.A. Melts and glasses of the K2O-GeO2 system: Physicochemical modelling with correction based on the results of Raman spectroscopy. J. Non-Cryst. Solids 2022, 594, 121795. [Google Scholar] [CrossRef]
  23. Koroleva, O.N.; Shtenberg, M.V. The structure of glasses M2O-B2O3 (M–Li, Na, K): Estimation of thermodynamic characteristics of alkaline borates and physicochemical modeling. J. Non-Cryst. Solids 2023, 601, 122053. [Google Scholar] [CrossRef]
  24. Koroleva, O.N.; Anfilogov, V.N.; Shatskiy, A.; Litasov, K.D. Structure of Na2O-SiO2 melts as a function of composition: In situ Raman spectroscopic study. J. Non-Cryst. Solids 2013, 375, 62–68. [Google Scholar] [CrossRef]
  25. Kozhina, E.L. Thermodynamic properties of melts in the potassium silicate melts. Soviet J. Glass Phys. Chem. 1991, 17, 358–362. [Google Scholar]
  26. Chastel, R.; Bergman, C.; Rogez, J.; Mathieu, J.C. Excess thermodynamic functions in ternary Na2O-K2O-SiO2 melts by Knudsen cell mass spectrometry. Chem. Geol. 1987, 62, 19–29. [Google Scholar] [CrossRef]
  27. Steiler, J.M. Thermochemical Data for the Steel Industry; Report EUR 7820; Commission of the European Community: Luxemburg, 1982. (In French) [Google Scholar]
  28. Plante, E.R. Vapor pressure measurements of potassium over K2O-SiO2 solutions by a Knudsen effusion mass spectrometric method. In Proceedings of the 10th Materials Research Symposium “Characterization of High Tempature Vapors and Gases”, Gaithersburg, MD, USA, 18–22 September 1978; pp. 265–281. [Google Scholar]
  29. Koroleva, O.N.; Shtenberg, M.V.; Bychinsky, V.A.; Tupitsyn, A.A.; Chudnenko, K.V. Methods for calculating and matching thermodynamic properties of silicate and borate compounds. Bull. South Ural. State Univ. Chem. 2017, 17, 39–48. [Google Scholar] [CrossRef] [Green Version]
  30. Osipov, A.A. High-temperature Raman spectroscopy. Pure Appl. Chem. 2019, 91, 1749–1756. [Google Scholar] [CrossRef]
  31. Mysen, B.O.; Finger, L.W.; Virgo, D.; Seifert, A. Curve-fitting of Raman spectra of silicate glasses. Am. Mineral. 1982, 67, 686–695. [Google Scholar]
  32. Koroleva, O.N.; Osipov, A.A. In situ Raman spectroscopy of K2O-GeO2 melts. J. Non-Cryst. Solids 2020, 531, 119850. [Google Scholar] [CrossRef]
  33. Anfilogov, V.N.; Bykov, V.N.; Osipov, A.A. Silicate Melts; Nauka: Moscow, Russia, 2005; p. 357. (In Russian) [Google Scholar]
  34. Maekawa, H.; Maekawa, T.; Kawamura, K.; Yokokawa, T. The structural groups of alkali silicate glasses determined from 29Si MAS-NMR. J. Non-Cryst. Solids 1991, 127, 53–64. [Google Scholar] [CrossRef]
  35. Stuke, A.; Behrens, H.; Schmidt, B.C.; Dupree, R. H2O speciation in float glass and soda lime silica glass. Chem. Geol. 2006, 229, 64–77. [Google Scholar] [CrossRef]
  36. Bauer, U.; Behrens, H.; Reinsch, S.; Morin, E.I.; Stebbins, J.F. Structural investigation of hydrous sodium borosilicate glasses. J. Non-Cryst. Solids 2017, 465, 39–48. [Google Scholar] [CrossRef]
  37. Bale, C.W.; Bélisle, E.; Chartrand, P.; Decterov, S.A.; Eriksson, G.; Gheribi, A.E.; Hack, K.; Jung, I.H.; Kang, Y.B.; Melançon, J.; et al. FactSage thermochemical software and databases, 2010–2016. Calphad 2016, 54, 35–53. [Google Scholar] [CrossRef]
Figure 1. Raman spectra of the K2O-SiO2 glasses with 30, 40, 50 and 55 mol.% K2O.
Minerals 13 00094 g001
Figure 2. Raman scattering spectra of glasses and melts of the compositions: 33KS (a), 40KS (b) and 50KS (c), depending on temperature [18,33].
Minerals 13 00094 g002
Figure 3. Decomposition and interpretation of Raman spectra of K2O-SiO2 glasses (a) and melts (b).
Minerals 13 00094 g003
Figure 4. Result of calculated Qn distribution in K2O-SiO2 system at 20 and 1300 °C in comparison with the results of Raman spectroscopy after correction. Points are experimental data. Lines are the results of modeling.
Minerals 13 00094 g004
Figure 5. Results of modeling 33KS (a) and 50KS (b) melt structure depending on temperature. Points are experimental data from Raman spectroscopy; lines are simulation results.
Minerals 13 00094 g005
Figure 6. Temperature dependence of the equilibrium constant of Reaction (1) in the 33KS (a) and 50KS (b) melts according to the modeling results (red line), NIST data (green line) and experimental data: Raman (blue markers) and NMR (red marker) [21].
Minerals 13 00094 g006
Table 1. Vibration frequencies, concentrations of structural units and equilibrium constants of Reaction (1) at n = 3 in glasses and melts of the potassium silicate sample with 33 mole per cent of potassium oxide at various temperatures (1-NMR data [34]).
T, °CVibration Frequencies, cm–1Concentrations of Structural Units Qn, %k3
Q2Q32Q3Q4Q3Q2
20946103611088/7 184/86 18/7 10.01
336936103111021080100.01
4349311045110198290.01
925925101710911570150.05
1015924101610891962190.09
1040920101310872060200.15
1115921100510772256220.23
Table 2. Vibration frequencies, concentrations of structural units and equilibrium constants of Reaction (1) at n = 2 in glasses and melts of the potassium silicate sample with 50 mole per cent of potassium oxide at various temperatures.
T, °CVibration Frequencies, cm–1Concentrations of Structural Units Qn, %k2
Q12Q21Q2Q23Q32Q1Q2Q3
20846904956102410711766170.07
478846896947101410701963190.09
59583488894099410612354230.18
68482888093699810642454220.18
79882888093599310582453230.19
91982087193598810432452240.22
100681186993498410282850220.25
104481086893098410302849230.27
Table 3. Interpretation of characteristic bands in the Raman spectra of melts and glasses of system compositions K2O-SiO2.
Vibration Frequencies, cm−1Qn SpeciesInterpretation of Characteristic Bands
810–842Q12Tetrahedron with one bridging atom of oxygen, connected to Q2
868–946Q1Tetrahedron with one bridging atom of oxygen, connected to Q1, which is the part of the dimer
930–952Q2Tetrahedron with two bridging atoms of oxygen, connected to the same Q2
984–993Q23Tetrahedron with two bridging atoms of oxygen, connected to Q3
1030–1062Q32Tetrahedron with three bridging atoms of oxygen, connected to Q2
Table 4. Calculated Gibbs free energy values of the formation of Qn structural units of the K2O-SiO2 melt and equilibrium constants of Reaction (1) at n = 3 as a function of temperature.
T, °CΔfG, kJ/mol.
Q2Q3Q4k3
527–1369.95–1113.28–758.772.66 × 10–6
627–1360.27–1097.14–741.810.0001
727–1349.66–1081.40–724.950.0015
827–1328.89–1061.36–708.170.0114
927–1300.25–1038.25–691.460.0456
1027–1270.62–1014.95–674.820.1219
1127–1240.89–991.36–658.240.2762
1227–1211.40–967.31–641.720.6019
Disclaimer/Publisher’s Note: The statements, opinions and data contained in all publications are solely those of the individual author(s) and contributor(s) and not of MDPI and/or the editor(s). MDPI and/or the editor(s) disclaim responsibility for any injury to people or property resulting from any ideas, methods, instructions or products referred to in the content.

