Article

Porosity Distribution Law of Overlying Strata in the Goaf of the Adjacent Working Face: From the Perspective of Section Coal Pillar Types

1
College of Safety Science and Engineering, Xi’an University of Science and Technology, Xi’an 710054, China
2
Institute of Safety and Emergency Management, Xi’an University of Science and Technology, Xi’an 710054, China
*
Author to whom correspondence should be addressed.
Minerals 2022, 12(6), 782; https://doi.org/10.3390/min12060782
Submission received: 24 May 2022 / Revised: 10 June 2022 / Accepted: 17 June 2022 / Published: 20 June 2022

Abstract

:
The porosity distribution law of overlying strata in the goaf has an important guiding role in distinguishing hidden disaster-causing factors in the goaf, such as the gas enrichment area and spontaneous combustion area. Existing research is concentrated on the overlying strata in the goaf of a single working face (GSWF), and the porosity distribution law of overlying strata in the goaf of an adjacent working face (GAWF) must be different from that in the GSWF. By selecting Longshan Coal Mine as an engineering background and applying theoretical analysis, numerical simulation and formula-fitting methods, the porosity distribution law of overlying strata in the GAWF was obtained for different section coal pillar types. The results demonstrate that (1) according to the supporting effect of different sections of coal pillar widths on overlying strata, the GAWF can be divided into three types: goaf of an adjacent working face with small-section coal pillar width type (GFST), goaf of an adjacent working face with moderate-section coal pillar width type (GFMT), and goaf of an adjacent working face with large-section coal pillar width type (GFLT). (2) In the goaf of a working face, the offset distance from the maximum porosity value area of each overlying rock stratum to the middle of the rock stratum is positively correlated with the distance between the overlying strata and the coal seam floor. In the area affected by the section coal pillar (ASCP), the porosity of each overlying rock stratum increases with an increase in the section coal pillar width, but is still smaller than its own initial porosity, and its increase rate continuously decreases. (3) From the coal seam floor upward, the porosity spatial form distribution of overlying strata in the GFST and GFMT is described as follows: partial “dustpan” shape–unilateral “concave-convex peak” combined shape. The porosity spatial form distribution of overlying strata in the GFLT is described as follows: “dustpan” shape–“concave-convex peak” combined shape-“Λ” shape.

1. Introduction

In the process of coal mining, the overlying strata of the coal seam break, collapse, bend and subside due to the loss of coal support. After mining, the overlying strata of the goaf eventually form a stable bearing structure with holes and cracks [1]. This structure provides a large amount of storage space for oxygen and gas, which easily causes coal fire disasters, gas explosions and other accidents [2,3,4,5,6,7]. The pore and fissure structure of overlying strata can also serve as a water inrush channel to induce coal mine water inrush accidents [8,9,10]. Therefore, the study of the porosity distribution law of overlying strata in a goaf can provide theoretical and technical guidance for the identification of hidden disaster-causing factors and the reuse of gas and water resources in coal mines [11,12].
A large number of scholars have conducted in-depth research on the porosity distribution law of overlying strata in the goaf of a single working face (GSWF). Liang et al. [13] segmented the porosity in the strike direction and approximately considered that the porosity value changed as a sinusoidal function along the dip direction. Next, the piecewise function of porosity in the GSWF was deduced. Wang et al. [14] used PFC software to build a three-dimensional (3D) single working face model and then calculated the porosity value distribution of overlying strata. Jia et al. [15] constructed a new seismic attenuation model that can estimate the porosity of a goaf based on seismic attenuation and velocity changes. Zhu et al. [16] employed Universal Distinct Element Code (UDEC) software to excavate the dip model of a single working face and calculated the porosity value in the dip direction of the caving zone by extracting the rock strata height value. Wang et al. [17,18] deduced the 3D pore field distribution model of overlying strata in the GSWF and suggested that the caving zone is distributed in a “shovel” shape and that the fracture zone changes in the form of “double hump” shape proportional coupling. According to the “O shape” circle theory, Li et al. [19] proposed a calculation expression that describes the broken rock-bulking coefficient in the GSWF. Through the conversion of the relationship between the broken rock-bulking coefficient and porosity, the calculation expression of porosity in the GSWF can be obtained. However, relatively few studies address the porosity distribution law of overlying strata in the goaf of an adjacent working face (GAWF). Most scholars focus on the stability of mining roadways in the GAWF [20,21,22], reasonable setting of the section coal pillar width, stability of the section coal pillar and other aspects [23,24,25,26,27,28].
An analysis of the above research results reveals that research on the porosity of overlying strata in the goaf is focused on the GSWF and does not include an in-depth analysis of the porosity value and spatial form distribution law. When affected by the width of the section coal pillar, in the adjacent working face, the mining activities of the latter mining working face may have a disturbance influence on the stable bearing structure formed by the overlying strata in the goaf of the former mining working face. The overlying strata in the goaf of the former mining working face are unstable and deform again, and the strata structure is freshly stacked and arranged. This finding explains the difference in the porosity distribution law of overlying strata between the GAWF and the GSWF. The porosity distribution law of overlying strata in the GSWF obtained from the existing research does not consider the impact of the mining activities of the latter mining working face on itself and the porosity of overlying strata in the goaf of the former mining working face. Thus, from the perspective of different sections of coal pillar types, the study of the porosity distribution law of overlying strata in the GAWF is more in line with the actual situation of coal mine production and has more guiding significance for coal mine safety production (such as predicting the coal spontaneous combustion area in the goaf) and resource reuse (such as gas resource extraction and utilization).
Therefore, selecting Longshan Coal Mine as the engineering background, this paper used 3-Dimension Distinct Element Code (3DEC) software to conduct excavation numerical simulations of adjacent working faces using different-section coal pillar widths. By extracting the subsidence data of overlying strata in the GAWF, the 3D porosity values of overlying strata were calculated. We expect to analyze the porosity value and spatial form distribution law of overlying strata in the GAWF.

2. Engineering Geological Background and 3DEC Model Construction

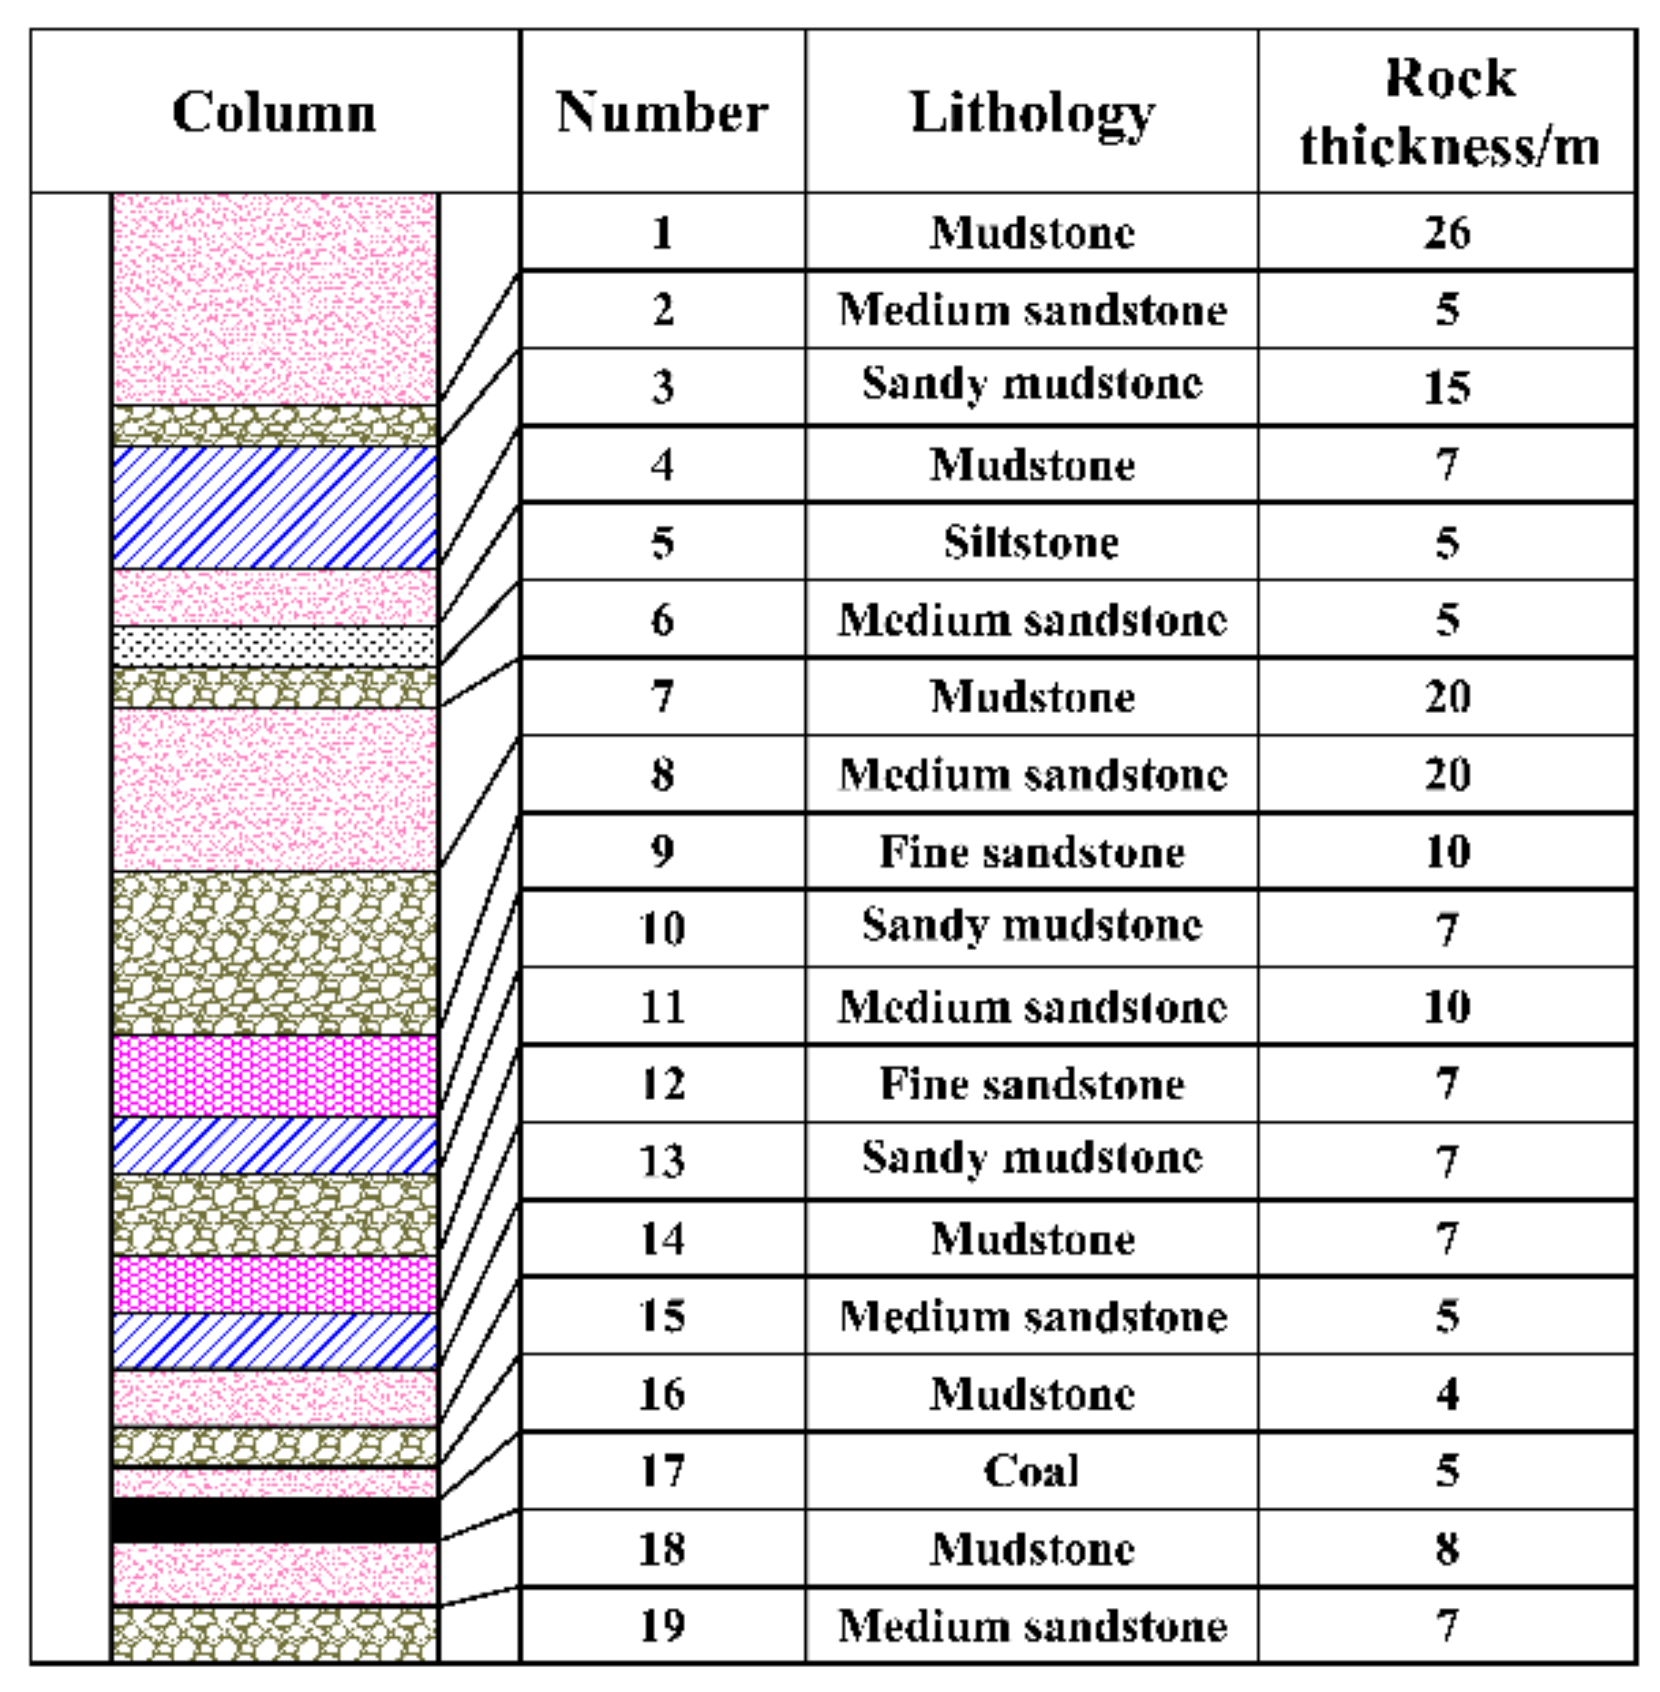
2.1. Overview of Production Geological Conditions in the Longshan Coal Mine

The Longshan Coal Mine is located 25 km west of Anyang city, Henan Province. The mining area is 2650 m wide and 3680 m long. The main mining is the 2−1 coal seam, with an average thickness of 5 m and a dip angle of 6°. The research objects of the adjacent working face were the 11061 and 11081 working faces in the 11th district, as shown in Figure 1. For the convenience of calculation and analysis, the strike length and dip length of the two working faces were set as 350 m and 100 m, and the working face was considered to belong to the horizontal coal seam.

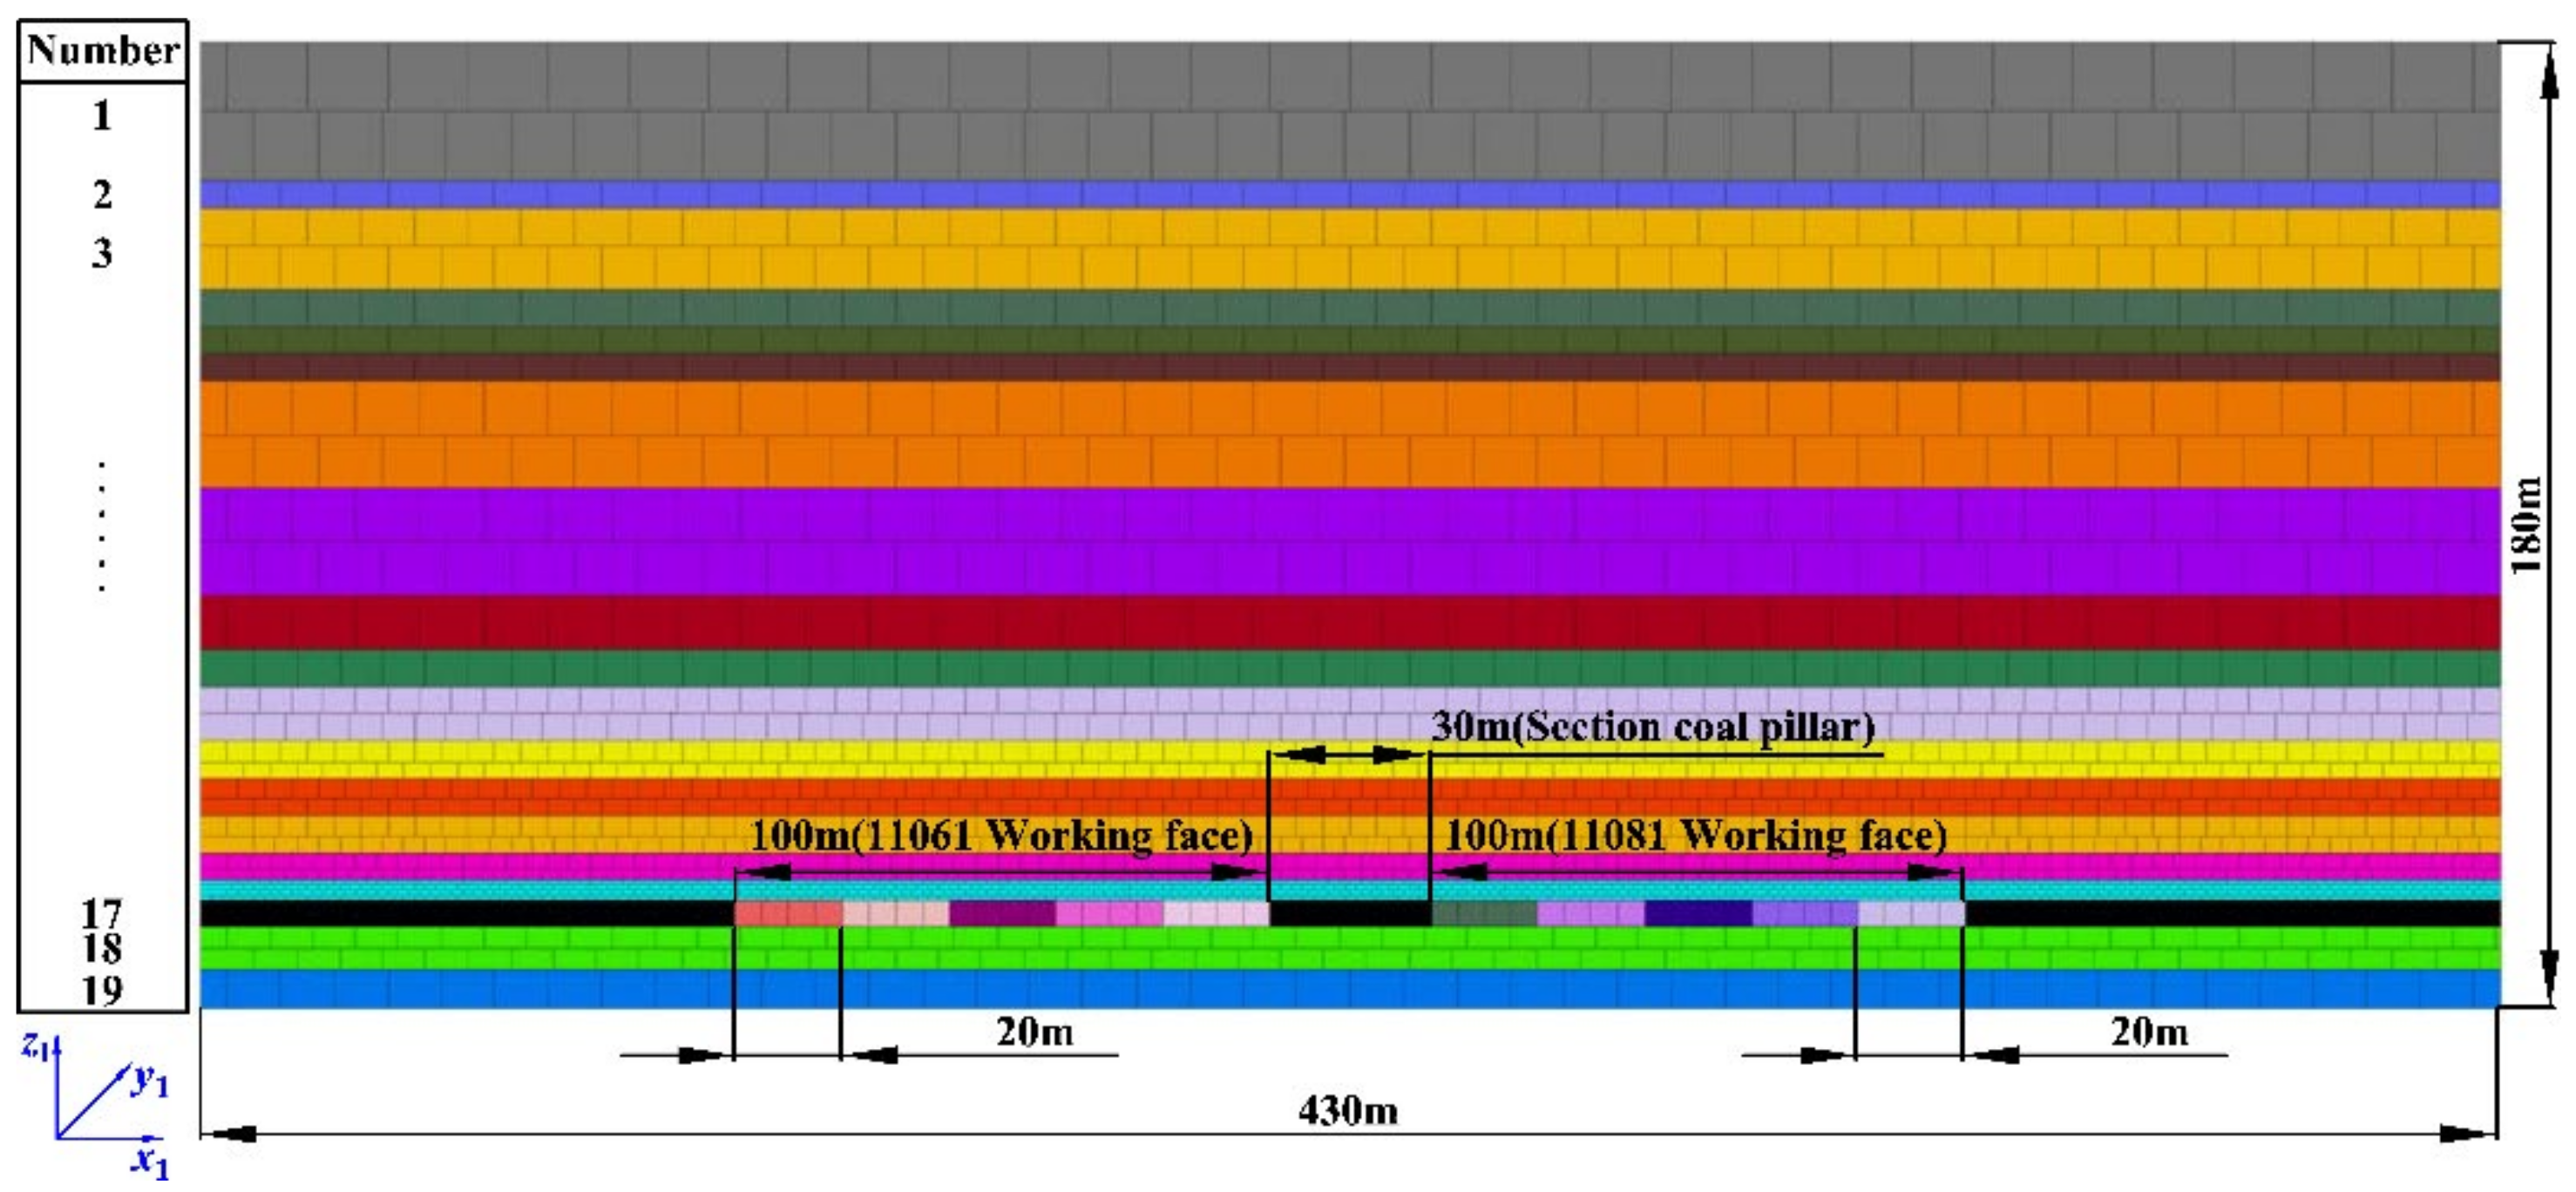
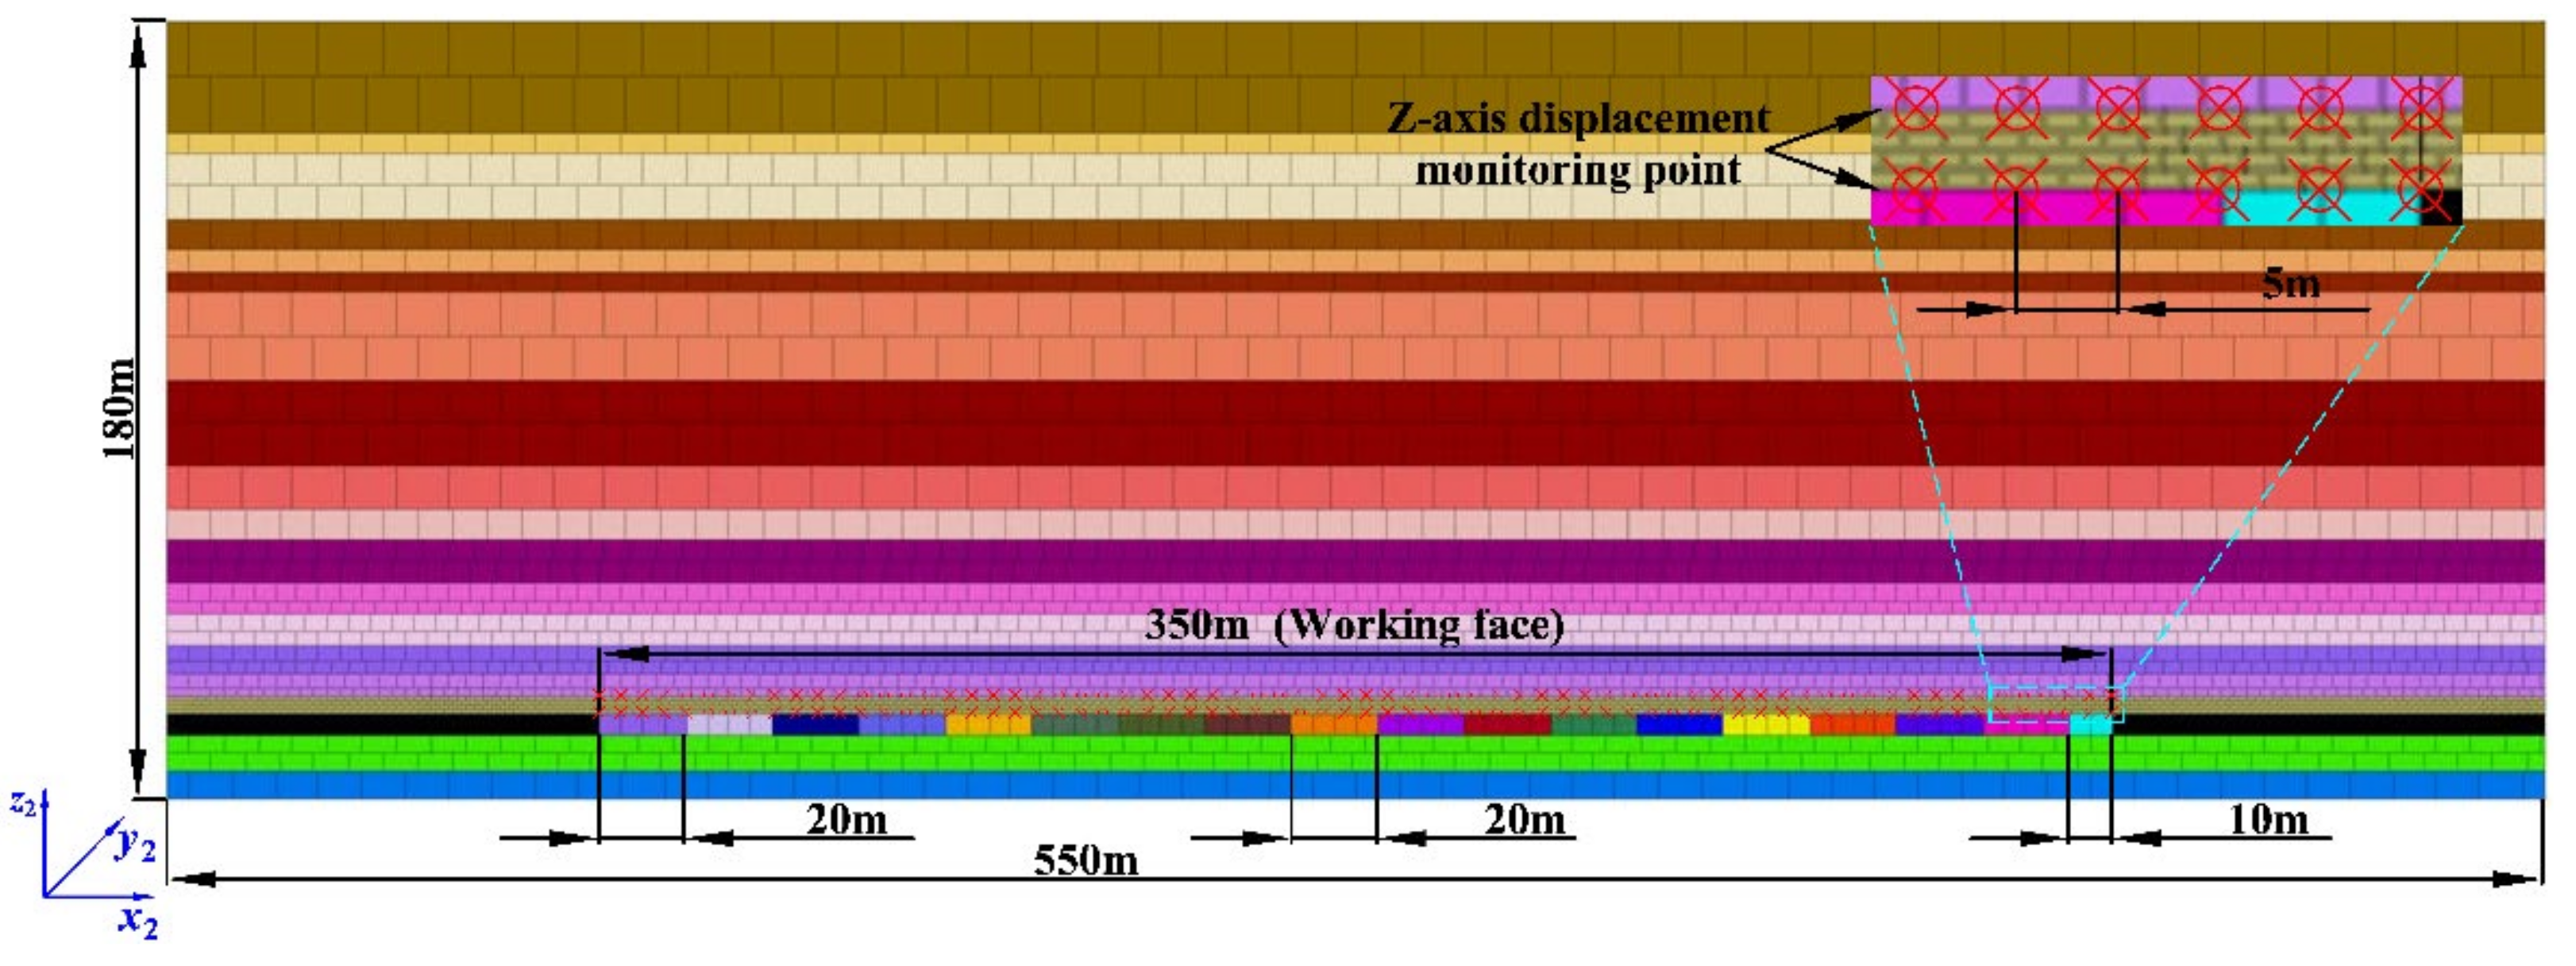
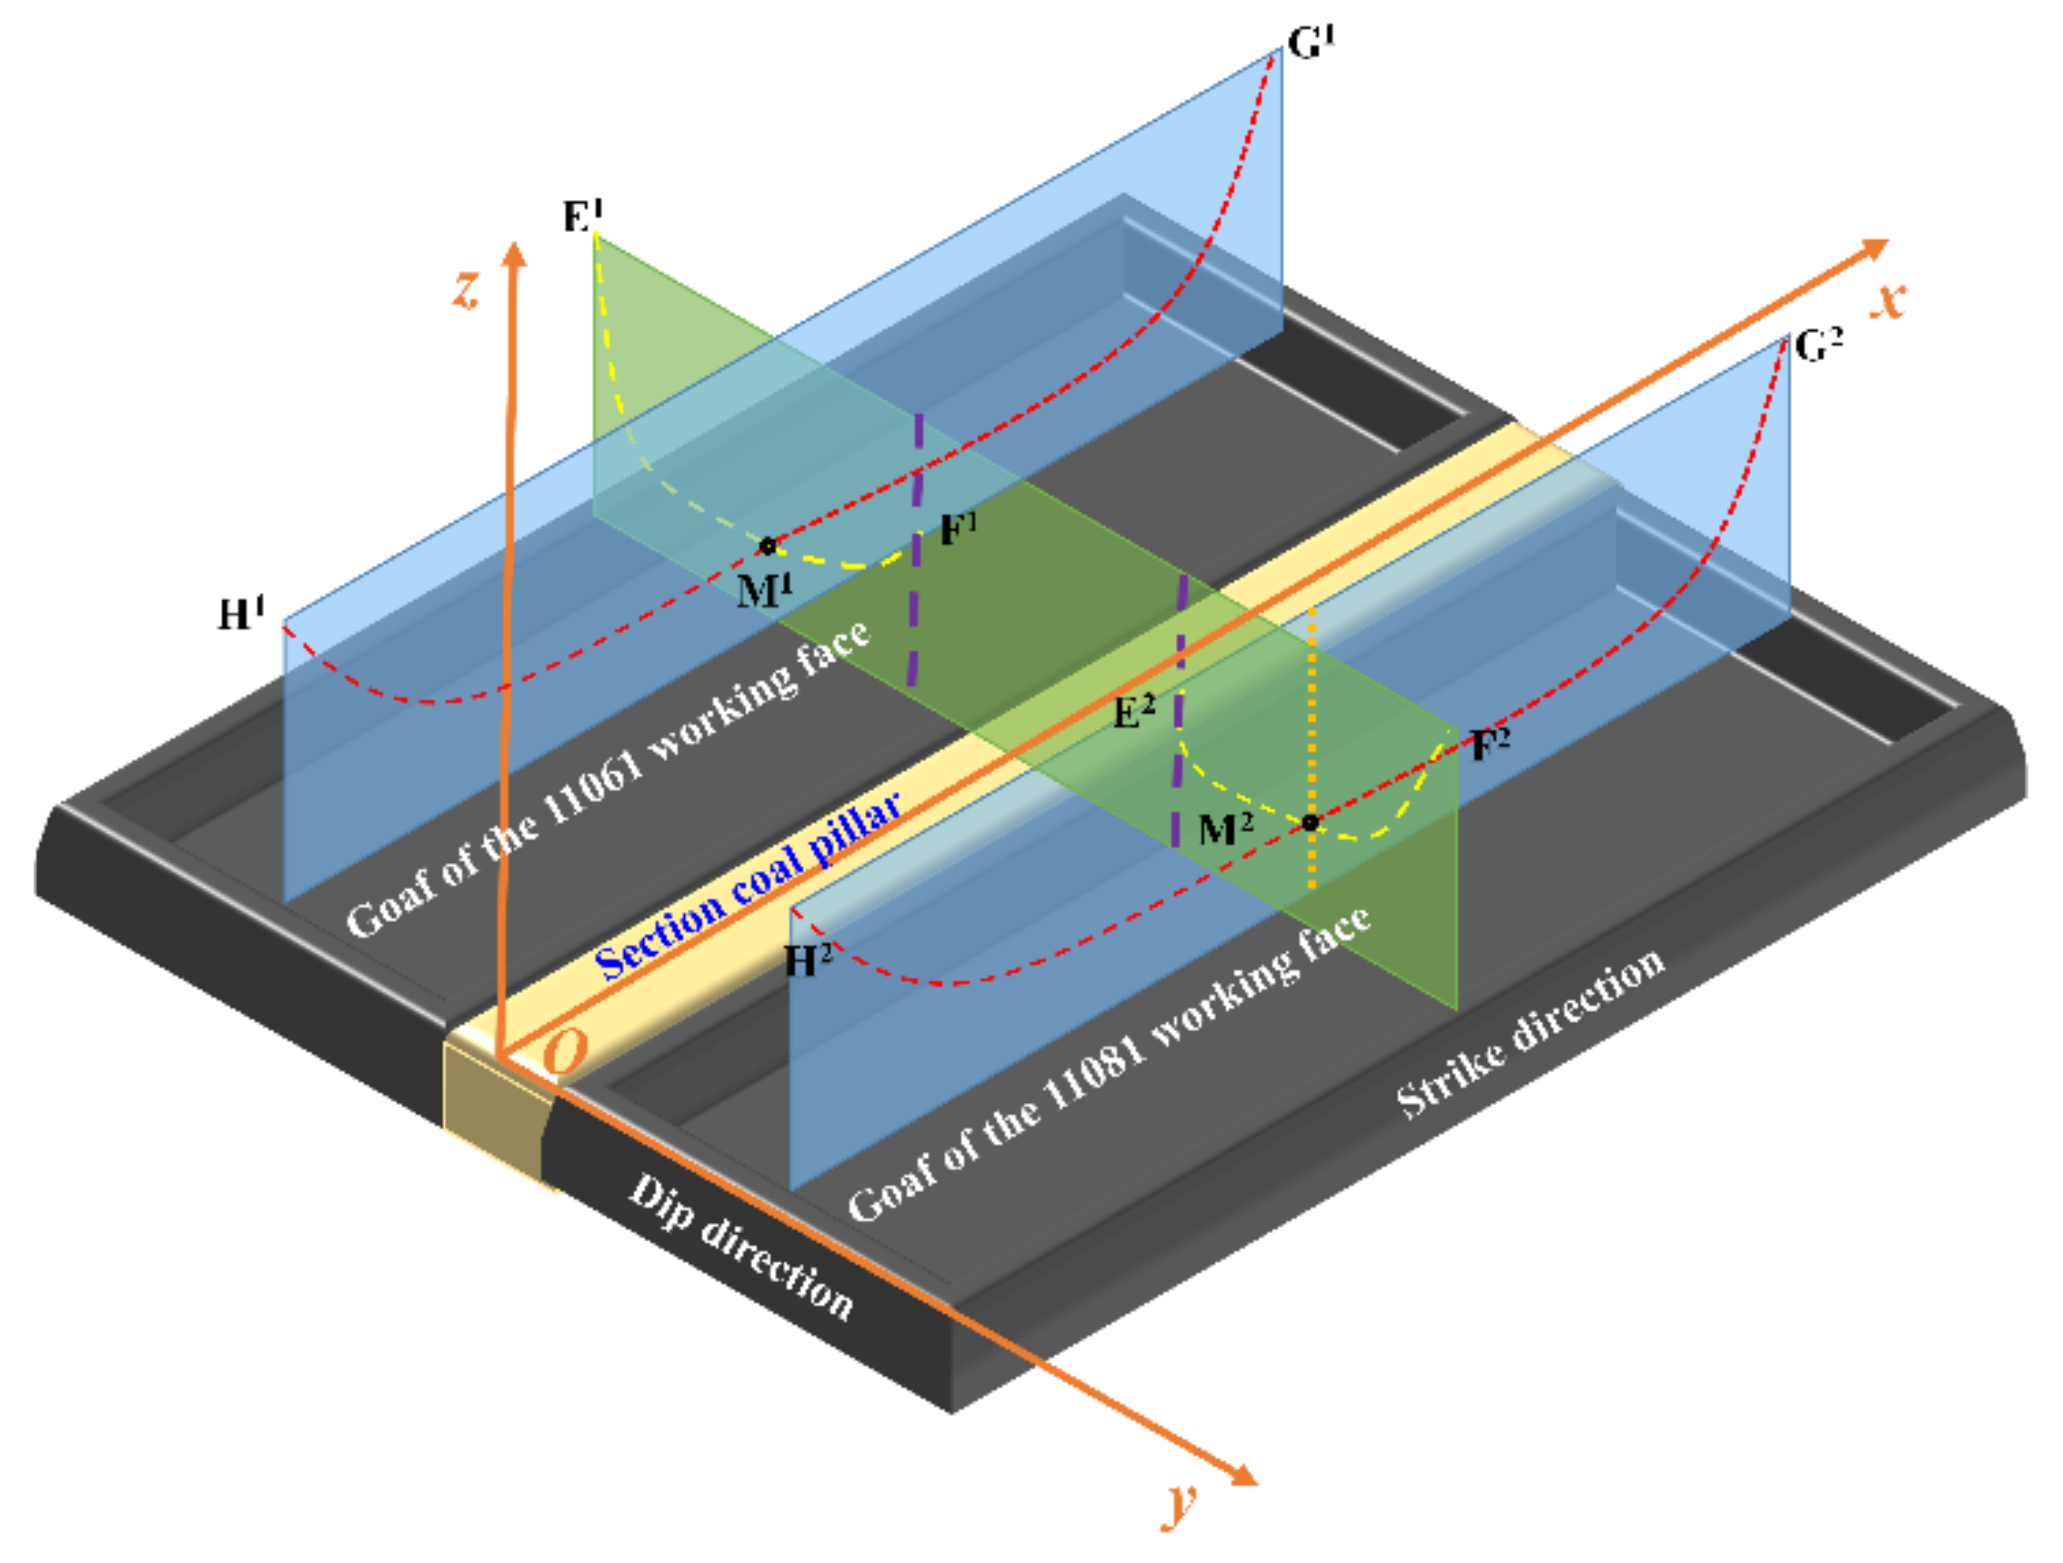
2.2. Adjacent Working Face Model Construction

2.2.1. Model Geometry Size Setting

A histogram of certain rock strata in the Longshan Coal Mine is shown in Figure 2, and the lithology of the overlying strata of the coal seam was considered as of a medium-hard type. Therefore, the empirical calculation formulas for the height of the caving zone and fracture zone shown in Formulas (1) and (2) were applied to estimate the height of the two zones [29].
H k = 100 V 4.7 V + 19 ± 2.2
H l = 100 V 1.6 V + 3.6 ± 5.6
where V is the mining thickness, m; Hk is the height of the caving zone, m; and Hl is the height of the fracture zone, m. By calculation, Hk = 9.56–13.96 m and Hl = 37.5–48.7 m. The height range of the caving zone and fracture zone, calculated in advance by the empirical formula, can provide a basis of judgment when determining the geometric size of the adjacent working face model and whether the model calculation results are reasonable and reliable.
To eliminate the influence of the boundary effect, the height of the rock strata at the bottom of the coal seam was set to 15 m, and the width of the left and right boundary coal pillars was set to 100 m in the model. The overall height of the model was set to 180 m and 2 m along the y-axis (Figure 3 and Figure 4). To analyze the influence of different-section coal pillar widths on the porosity distribution of overlying strata in the GAWF, the dip model of the adjacent working face constructed by 3DEC software had the same height (180 m) and different widths. The width of the dip model was the sum of the section coal pillar width, dip length of the two working faces (200 m) and boundary coal pillar length (200 m).
Wilson et al. [30] divided the section coal pillar into two parts: yield zone and core zone. The stress in the yield zone was high, and the coal body in this zone basically lost its supporting effect on the overlying strata. Compared with the yield zone, the stress in the core zone was low, and the coal body in this zone showed a supporting effect on the overlying strata. If the width of the section coal pillar in GAWF was less than or equal to the sum of the two yield zone widths, the section coal pillar was unstable and destroyed. To avoid the instability of and damage to the section coal pillar, a width of greater than or equal to two times the width of the mining thickness was generally set as the core zone width in the middle of the section coal pillar. Therefore, the formula for calculating the minimum width of the section coal pillar to maintain stability is shown as follows:
B = x 0 + x 1 + R
where B is the minimum width of the section coal pillar to maintain stability, m; x0 and x1 are the width of the yield zone on the left side and right side, respectively, of the section coal pillar, m; and R is the core zone width of the section coal pillar, m (R = 2 V).
According to the limit equilibrium theory [31], Formulas (4) and (5) can be used to calculate the yield zone width on both sides of the section coal pillar.
x = V 2 f λ ln ( f K γ H + c ( λ 1 ) c f cot φ + c )
λ = 1 + sin φ 1 sin φ
where f is the friction factor of the contact surface between the roof and floor strata and the coal seam; φ is the internal friction angle of the coal body, degree; K is the stress concentration coefficient; γ is the average bulk density of the coal seam and rock strata, N/m3; H is the buried depth of the coal seam, m; and c is the cohesion of the coal body, MPa. According to the data provided by the coal mining enterprise and laboratory experiments, the values of the parameters in Table 1 are obtained.
Based on the data in Table 1, the calculation shows that the minimum width of the section coal pillar needed to maintain stability is 25 m. In addition, from the perspective of the section coal pillar width-to-height ratio, certain scholars have proposed that when the width-to-height ratio is greater than 10, the section coal pillar is difficult to damage [32]. Corresponding to the Longshan Coal Mine, when the section coal pillar width is greater than 50 m, it is basically undamaged.
The theoretical calculation of the section coal pillar width in advance can provide a reference when setting the section coal pillar width during model construction and verifying the model calculation results. Based on the calculation results, eight groups of section coal pillars with different widths of 10, 15, 20, 25, 30, 40, 50 and 60 m were set up for the control test. Furthermore, the simple analysis shows that the strike model of the adjacent working face is similar to that of a single working face, so the geometric size of the strike model is set to 550 × 180 × 2 m.

2.2.2. Model Mechanical Parameter Setting

The rock mass mechanics parameter values set in 3DEC software are different from the rock mechanics parameter values measured in the laboratory [22,33,34]. Combined with the relevant rock mechanical parameters of the Longshan Coal Mine measured in the laboratory, the rock mass and joint mechanics parameters set in the adjacent working face model are shown in Table 2 and Table 3.

2.2.3. Constitutive Model Selection and Calculation Conditions Setting

The Mohr–Coulomb elastic–plastic model was selected as the constitutive model of the rock mass, and the Coulomb slip joint model was selected as the constitutive model of the joint plane. In the strike and dip model of the adjacent working face, the velocity of the model’s left and right boundaries was set to 0 along the x-axis direction, the velocity of the model’s front and back boundaries was set to 0 along the y-axis direction, and the velocity of the model bottom boundary was set to 0 along the z-axis direction. Since the constructed model intercepts only part of the overlying strata of the coal seam, it is necessary to equate the disregarded rock strata from the surface to the No. 1 rock stratum to a certain value of axial pressure. The calculation formula is shown as follows:
q a = ρ a g h d
where qa is the equivalent axial pressure, Pa; ρa is the disregarded average density of the coal seam and rock strata, kg/m3; g is gravity, N/kg; hd is the disregarded total height of the rock strata, m; ρa = 2500 (considering the actual situation of the disregarded coal seam and rock strata in Longshan Coal Mine and simultaneously drawing lessons from the value of the disregarded average density of the rock strata in references [35,36]), g = 9.8, and hd = 492 were substituted into Formula (6) to obtain qa ≈ 12 MPa. Furthermore, the lateral pressure coefficient of the model was set to 1.1. The dip and strike models of the adjacent working face constructed in 3DEC software are shown in Figure 3 and Figure 4.
The excavation direction of the working face was from left to right, from the 11061 working face to the 11081 working face. The step-by-step excavation distance of the working face was 20 m. If the last step excavation distance is less than 20 m, the excavation operation should be carried out according to the remaining distance. The calculated stop condition at the end of excavation for each working face was set as the unbalanced force ratio of less than 10−5. The FISH language was selected to write a function to arrange a monitoring point every 5 m in the horizontal direction (along the x-axis direction) of each overlying rock stratum in the GAWF (Figure 4 shows the layout method of the No. 16 and No. 17 rock strata monitoring points) and to record the subsidence data of all monitoring points.

3. Subsidence Law of Overlying Strata in GAWF

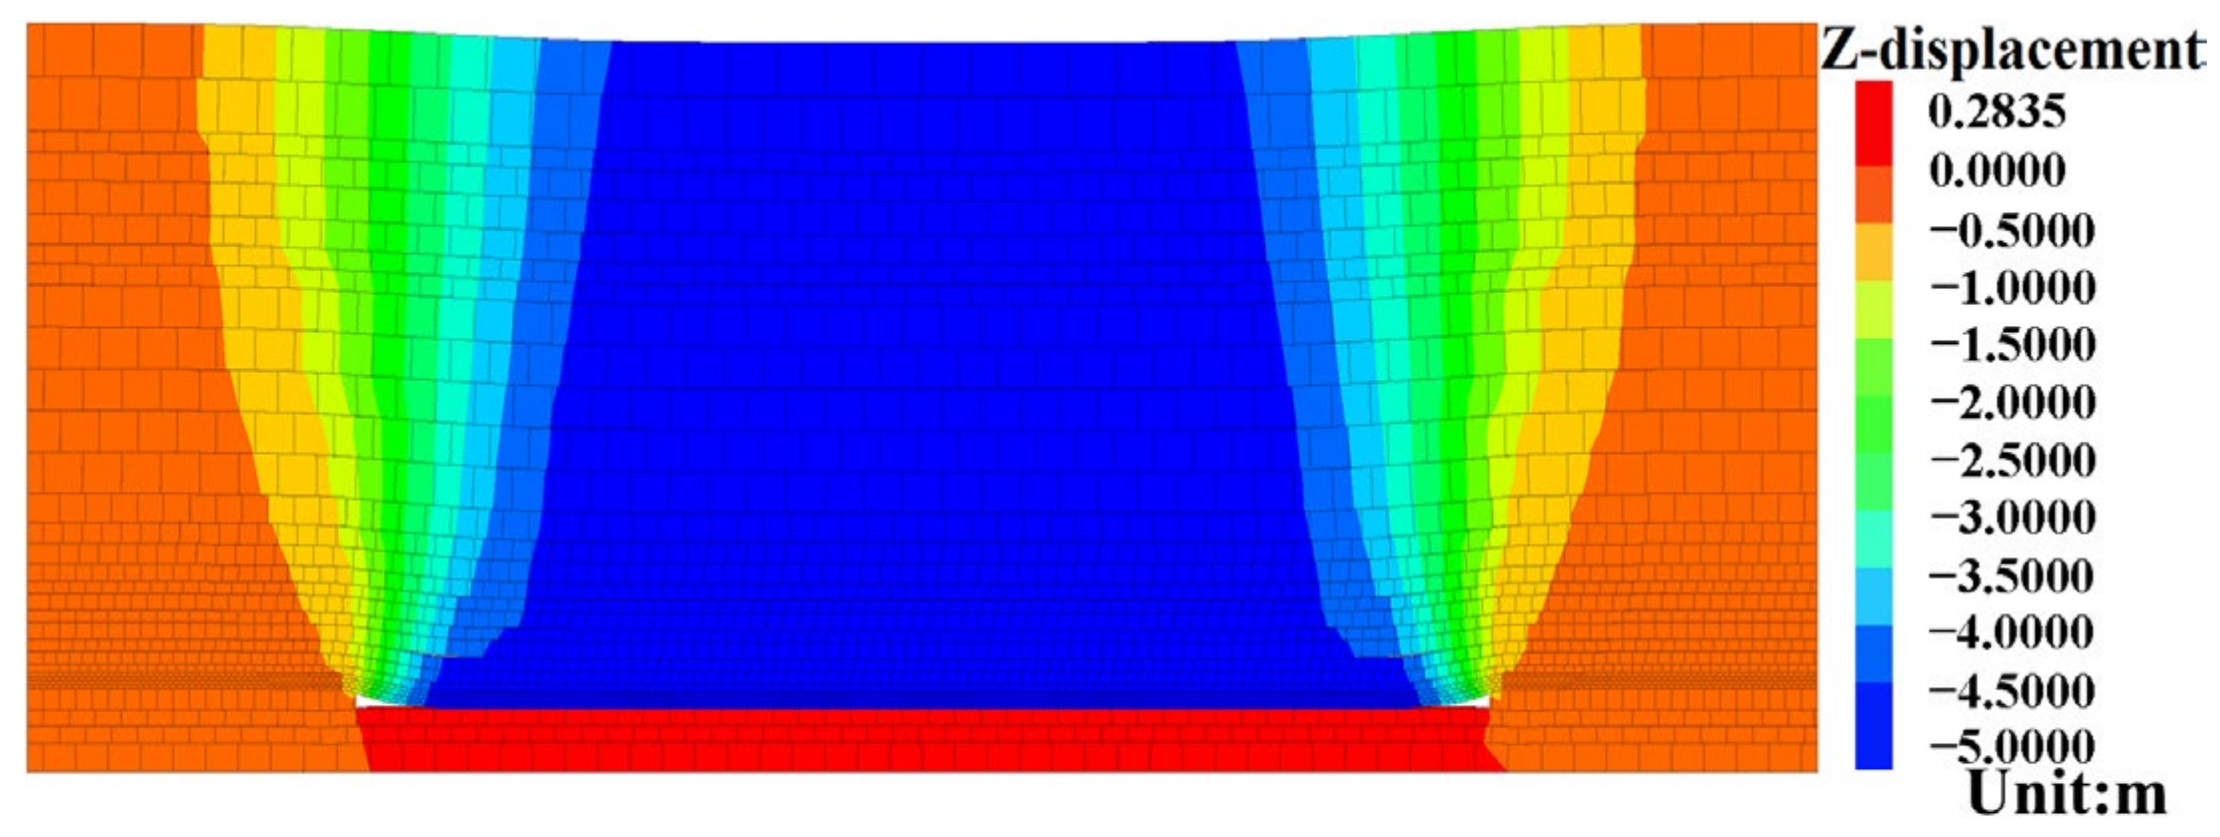
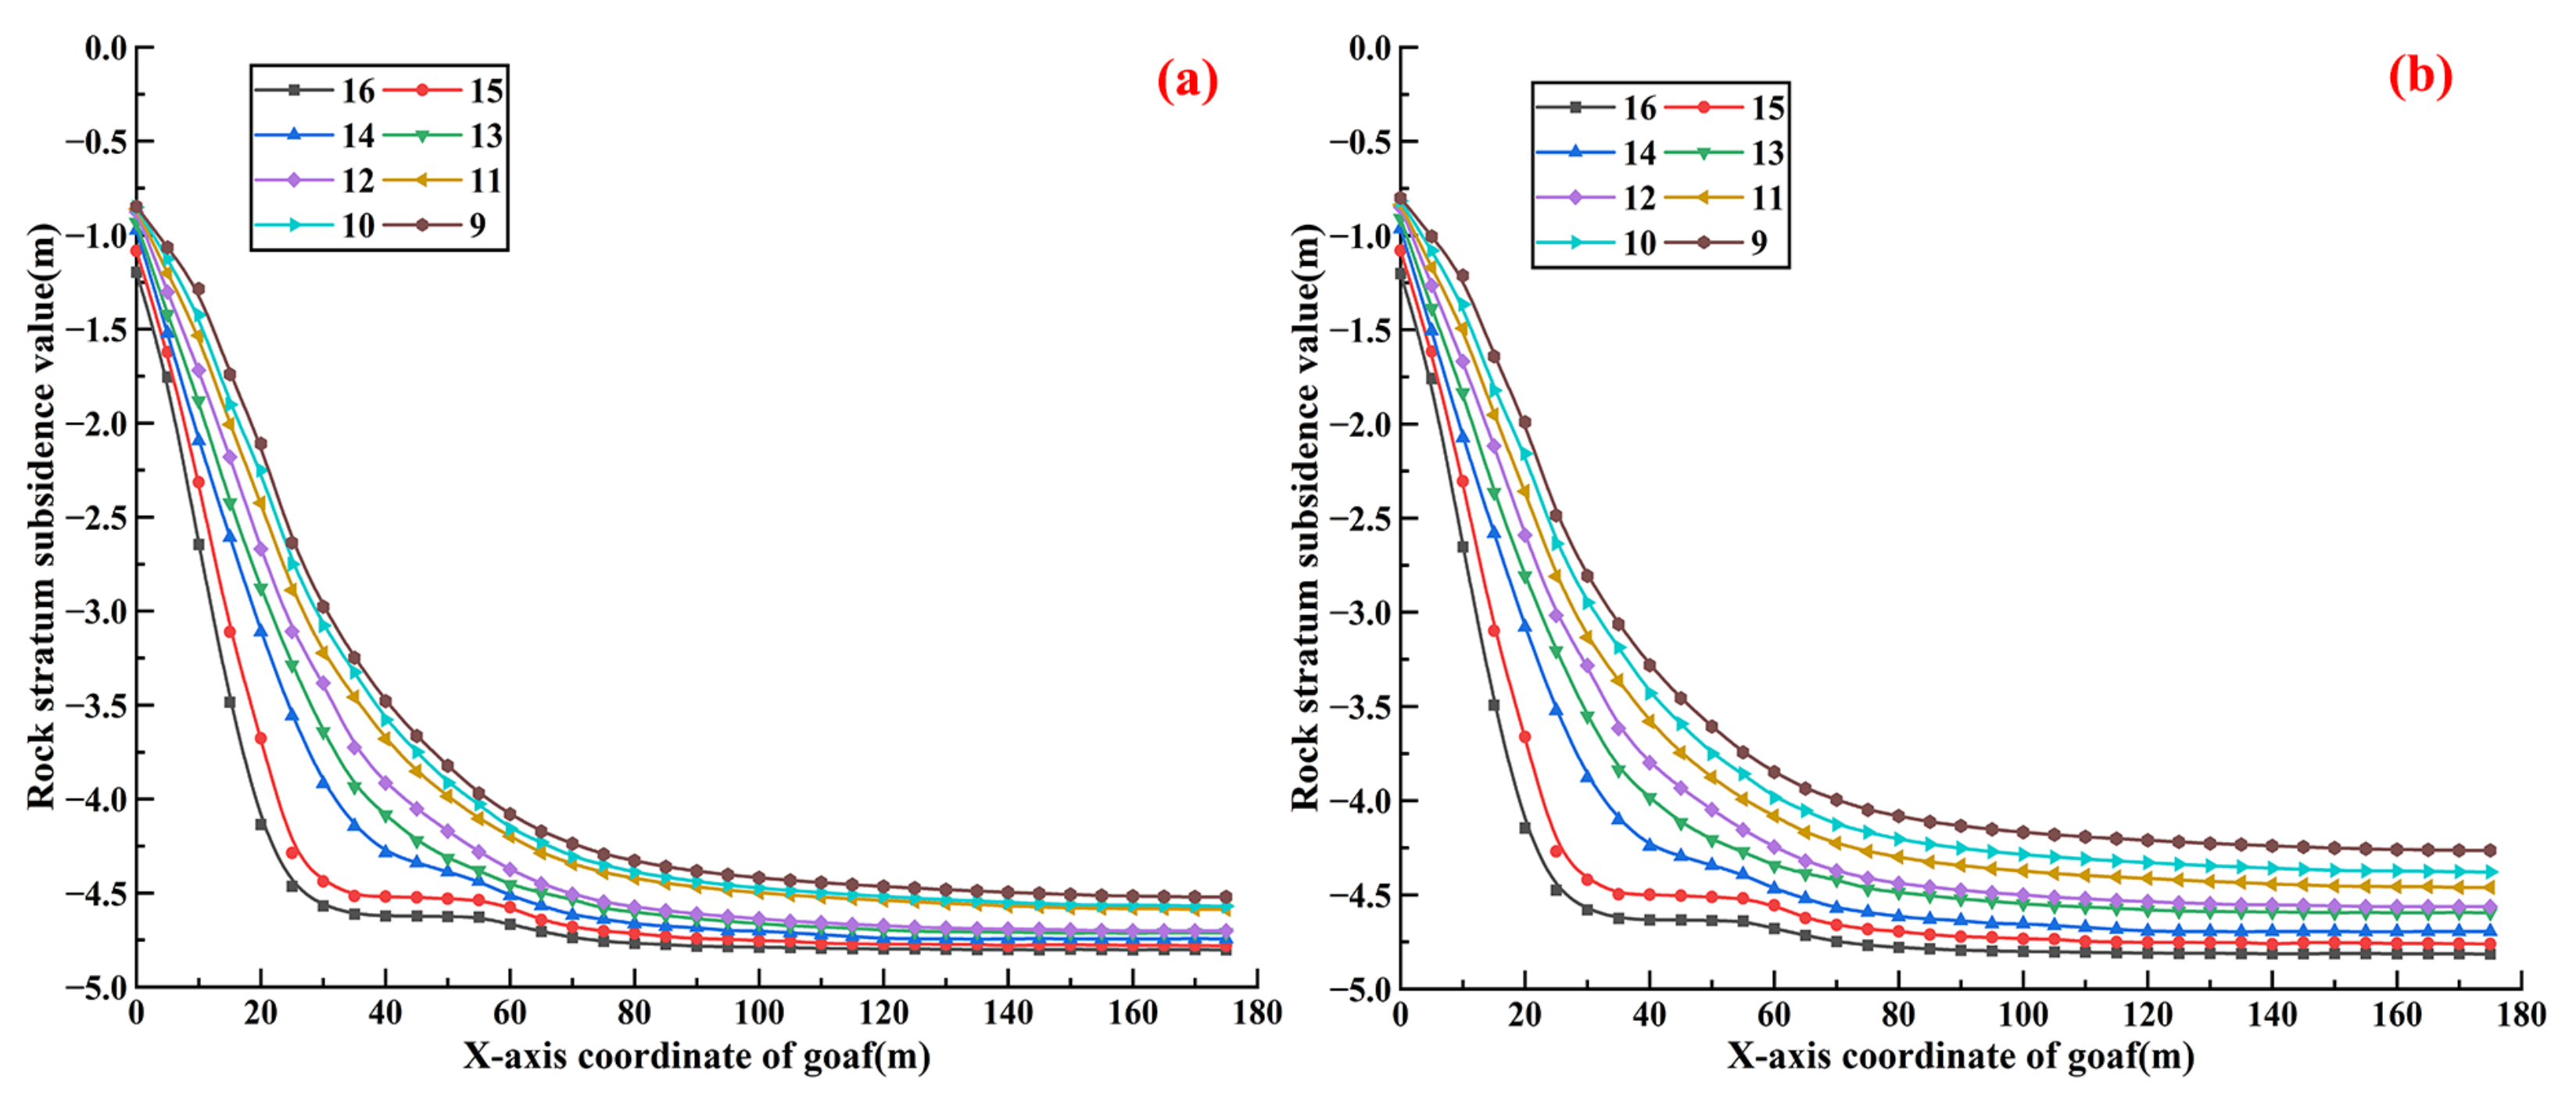
3.1. Numerical Calculation Results of Overlying Strata, Two-Dimensional (2D) Subsidence

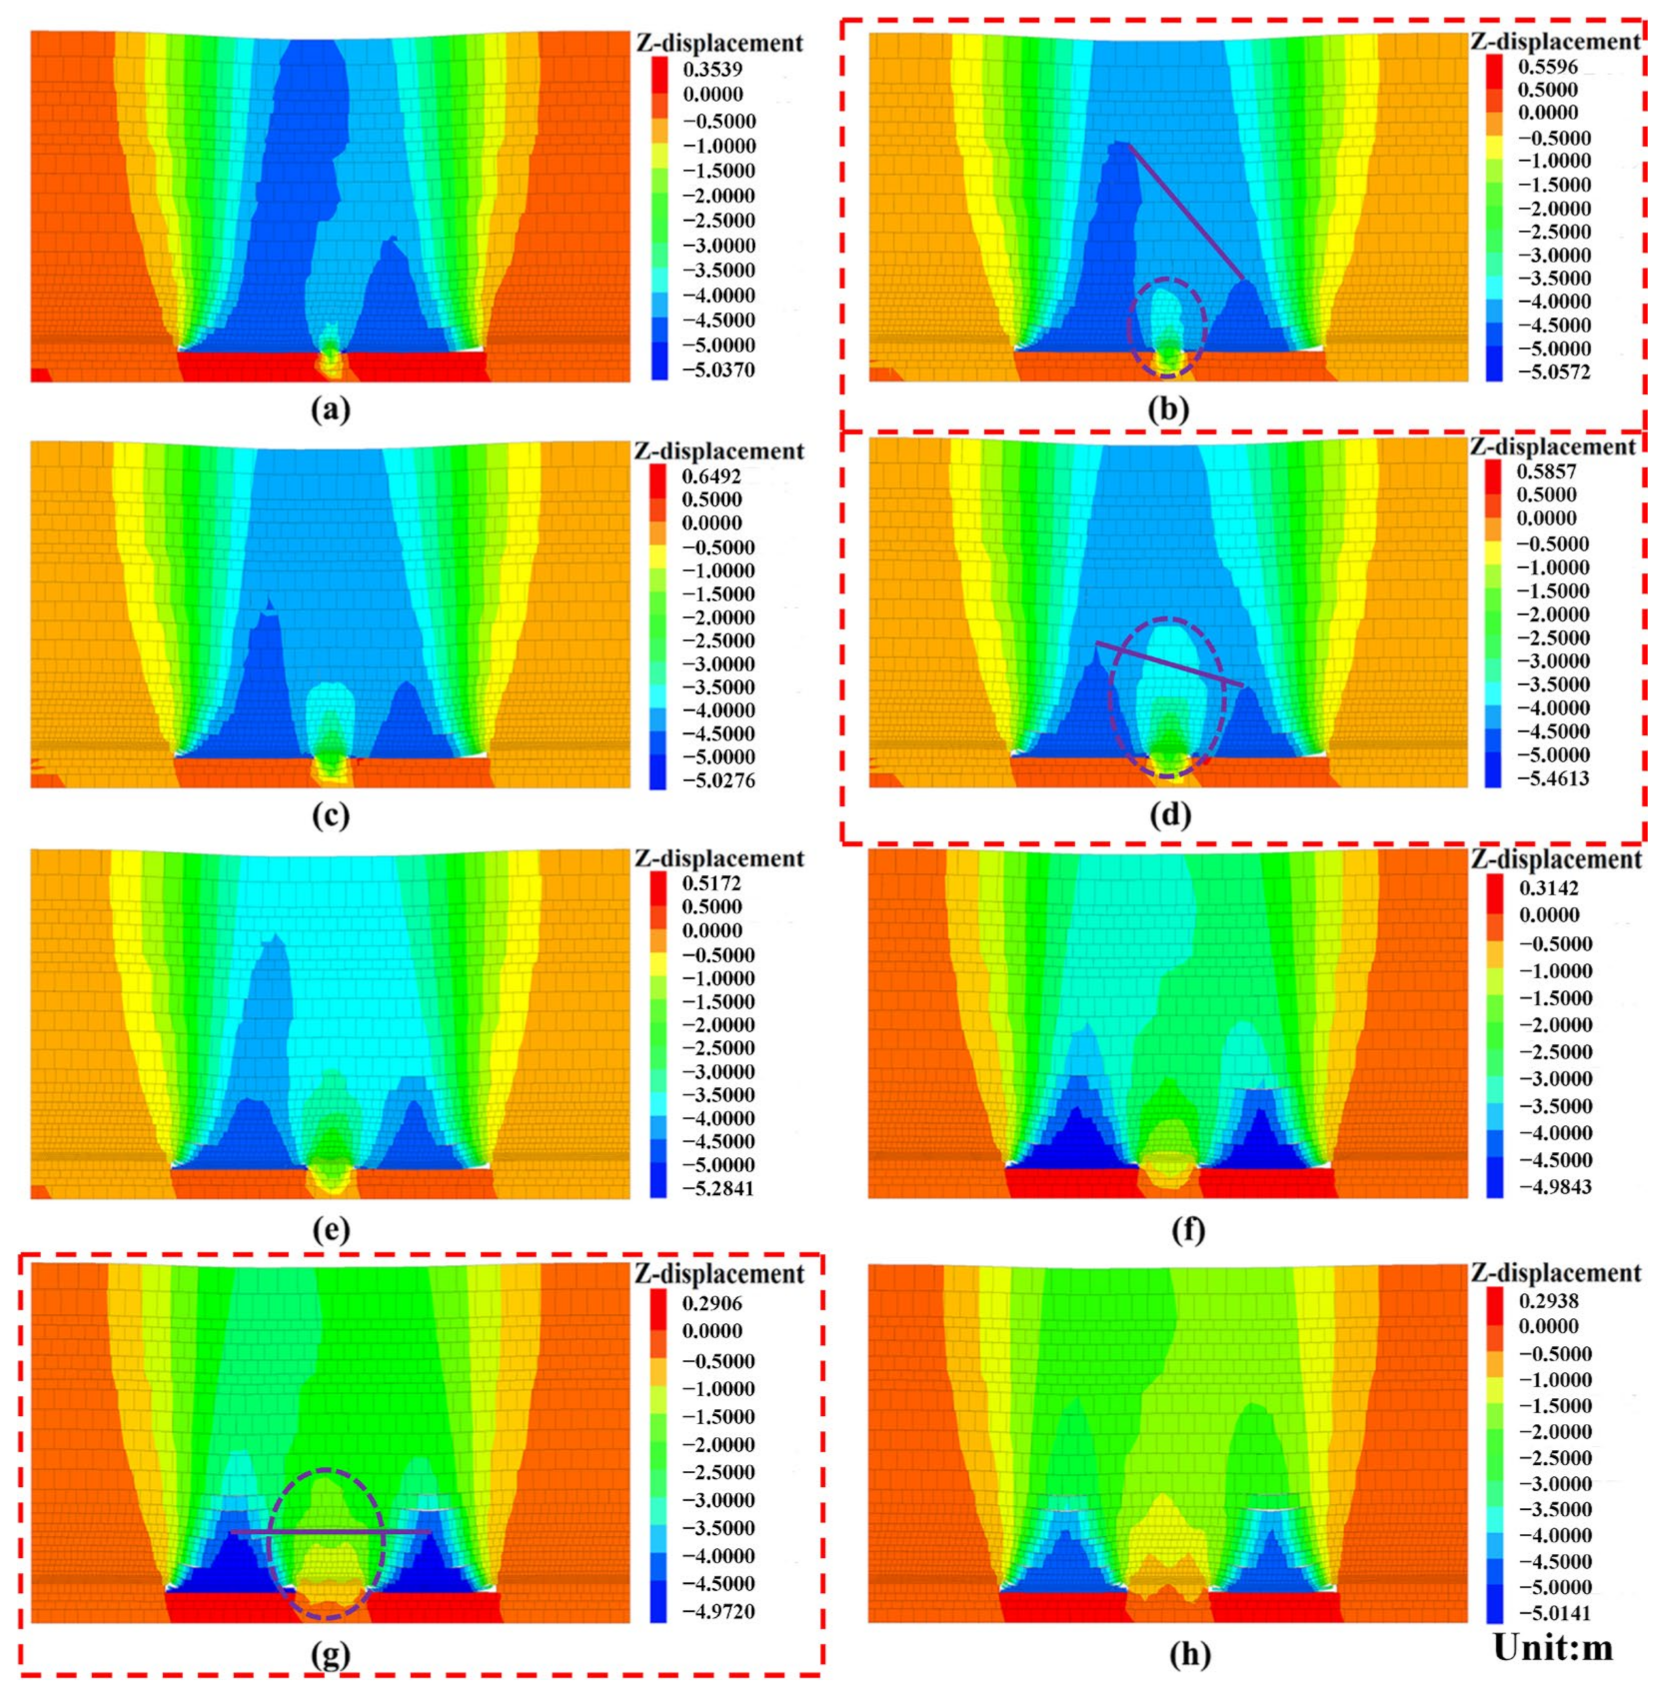
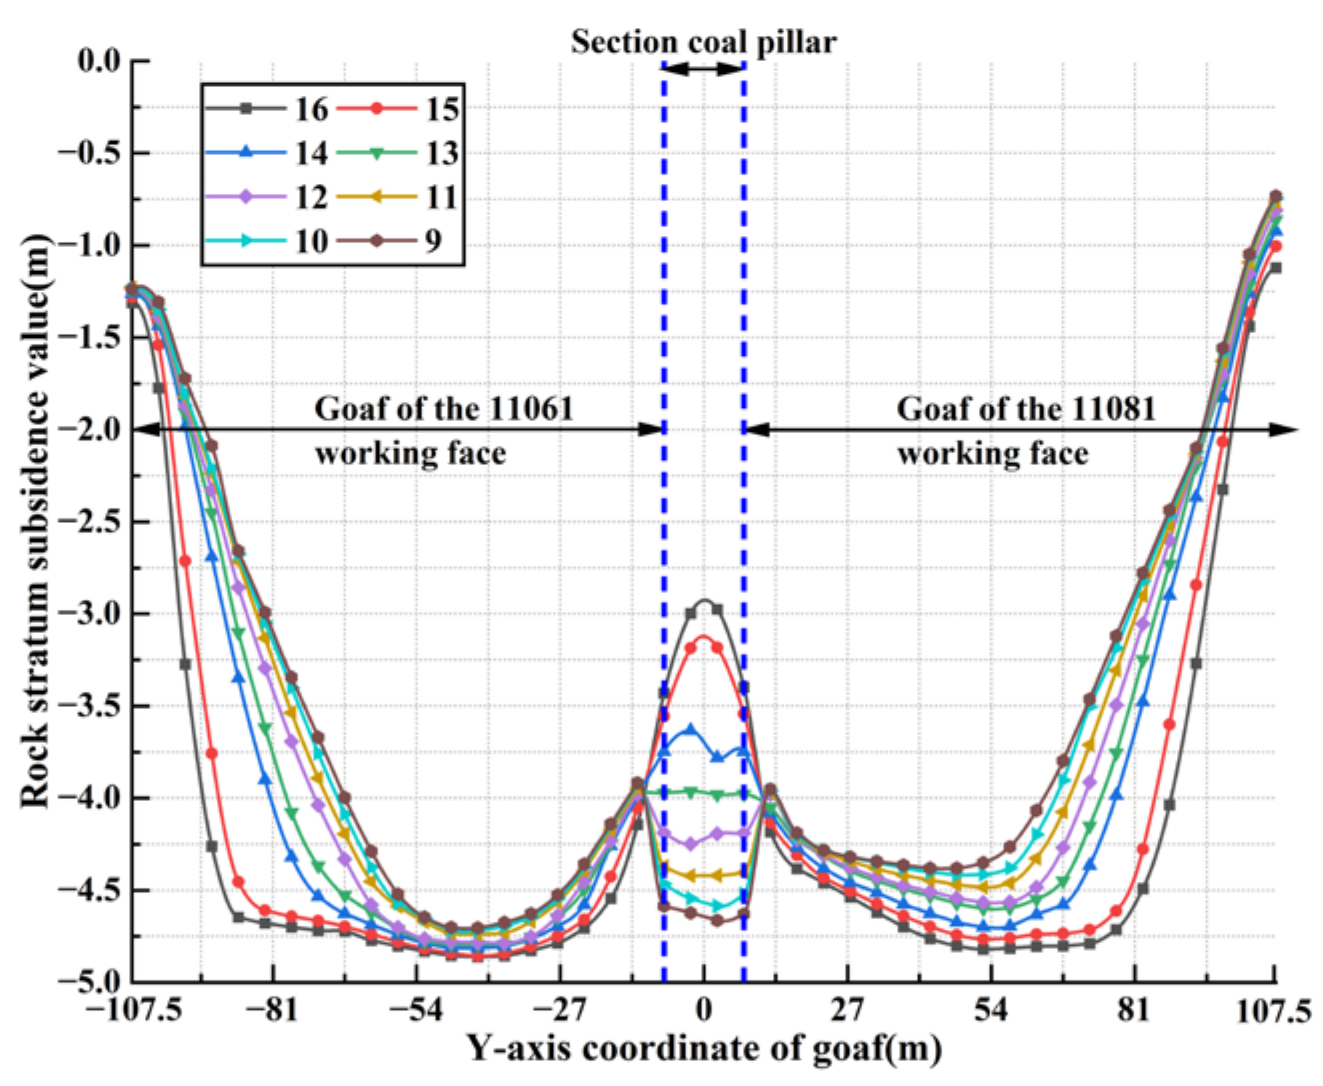
3.1.1. Calculation Results of Overlying Strata Subsidence Data of Single Working Face Strike and Dip Model

After the excavation of the 11061 working face was completed, the subsidence values of the overlying strata in the dip model of the adjacent working face, using different section coal pillar widths, were consistent. The calculation results are shown in Figure 5. The calculation results for the strike model are shown in Figure 6.
According to Figure 5 and Figure 6, the subsidence values of each overlying rock stratum in the strike model are greater than the subsidence values of each overlying rock stratum in the dip model of the adjacent working face. The reasons for this phenomenon are presented as follows: in reality, the overlying strata subside under the joint constraints of the strike and dip directions after excavation of the working face. The working face strike length is 350 m, and the dip length is 100 m. For the 2D strike and dip model, the excavation of the strike model is long, and the overlying strata are less constrained than the actual situation. The constraint conditions of the dip model are more consistent with the real situation. Therefore, Figure 5 shows that the heights of the overlying strata caving zone and fracture zone in the numerical simulation are 12 m and 47 m, respectively, which are within the calculation range of empirical Formulas (1) and (2), indicating that the model construction is reasonable and accurate.

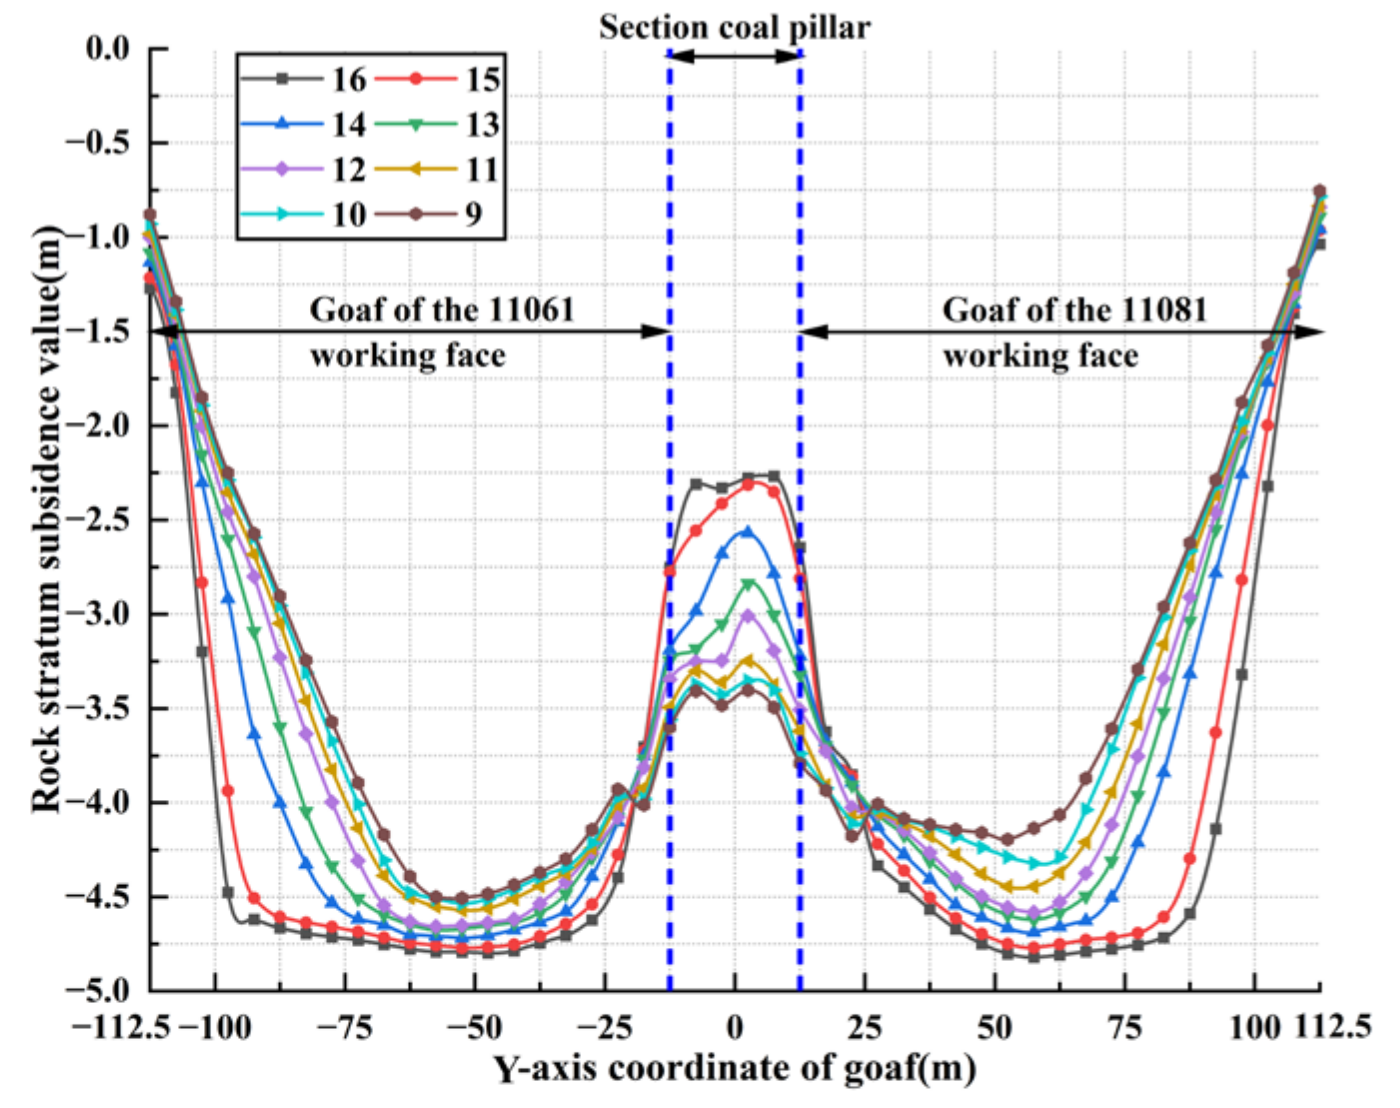
3.1.2. Calculation Results of Overlying Strata Subsidence Data of Adjacent Working Face Dip Model

Figure 7 shows the subsidence conditions of the overlying strata in the dip model of the adjacent working face, after the excavation of 11081 working face was completed, for different section coal pillar widths. The purple dotted line circle in Figure 7 shows the supporting effect of section coal pillars of different widths on its overlying strata, and the purple straight line represents the connecting line of the strata with a large subsidence value of the overlying strata in the goaf of the two adjacent working faces.
From the perspective of overlying strata subsidence value, Figure 7 shows the following results: (1) When the width of the section coal pillar is less than or equal to 15 m on the same rock stratum, the subsidence value of each overlying rock stratum in the goaf of the 11061 working face (former mining working face) is greater than that of each overlying rock stratum in the goaf of the 11081 working face (latter mining working face). The maximum subsidence value of each overlying rock stratum in the goaf of the 11061 working face is not located in the middle goaf of the 11061 working face, but is offset to the goaf direction of the 11081 working face. The higher the height of each overlying stratum (the height of the rock stratum refers to the vertical distance from the coal seam floor to the rock stratum roof), the greater the offset distance from the middle goaf of the 11061 working face. The maximum subsidence value position of each overlying rock stratum in the goaf of the 11081 working face is also offset to the goaf of the 11061 working face, but the offset distance of each overlying rock stratum is significantly smaller than that of the 11061 working face As the width of the section coal pillar increases, the height of each overlying stratum with a large subsidence value in the goaf of the two working faces continuously decreases. (2) When the width of section coal pillar is within the range of 15–25 m, with an increase in the section coal pillar width, the height of each overlying stratum with a large subsidence value in the goaf of the 11081 working face basically does not change. The height of each overlying stratum with a large subsidence value in the goaf of the 11061 working face decreases with an increase in the section coal pillar width. When the width of the section coal pillar reaches 25 m, the height of each overlying stratum with a large subsidence value in the goaf of the two working faces are basically similar. With an increase in the section coal pillar width, the maximum subsidence value position of each overlying rock stratum in the goaf of the two working faces is still offset to the goaf direction of the other working face, but the offset distance is less than the case where the section coal pillar width is less than or equal to 15 m. (3) After the section coal pillar width becomes greater than 25 m, within the range of 25–40 m, the offset distance of the maximum subsidence value position of each overlying rock stratum in the goaf of the two working faces toward the goaf direction of the other working face continues to decrease. When the section coal pillar width reaches 50 m, the subsidence movements of the overlying strata in the goaf of the two working faces no longer affect each other and are isolated by the section coal pillar into mutually independent GSWFs.
The offset distance of the maximum subsidence value position of each overlying rock stratum in the goaf of the two working faces to the goaf direction of the other working face, and the height of each overlying stratum with a large subsidence value, were negatively correlated with the stability (supporting effect) of the section coal pillar. The numerical simulation results of the overlying strata subsidence condition in the GAWF were consistent with the theoretical calculation results.
Based on the subsidence condition of overlying strata in the GAWF, as shown in Figure 7, the GAWF was divided into three types: goaf of an adjacent working face with small-section coal pillar width type (GFST, section coal pillar width is less than or equal to 15 m), goaf of an adjacent working face with moderate-section coal pillar width type (GFMT, section coal pillar width is greater than 15 m and less than or equal to 25 m), and goaf of an adjacent working face with large-section coal pillar width type (GFLT, section coal pillar width is greater than 25 m).
To facilitate the study of the porosity distribution law of overlying strata in the GAWF for different section coal pillar types, the GAWF with section coal pillar widths of 15, 25 and 50 m were selected to represent the three types of GAWF for subsequent research on the porosity distribution law.

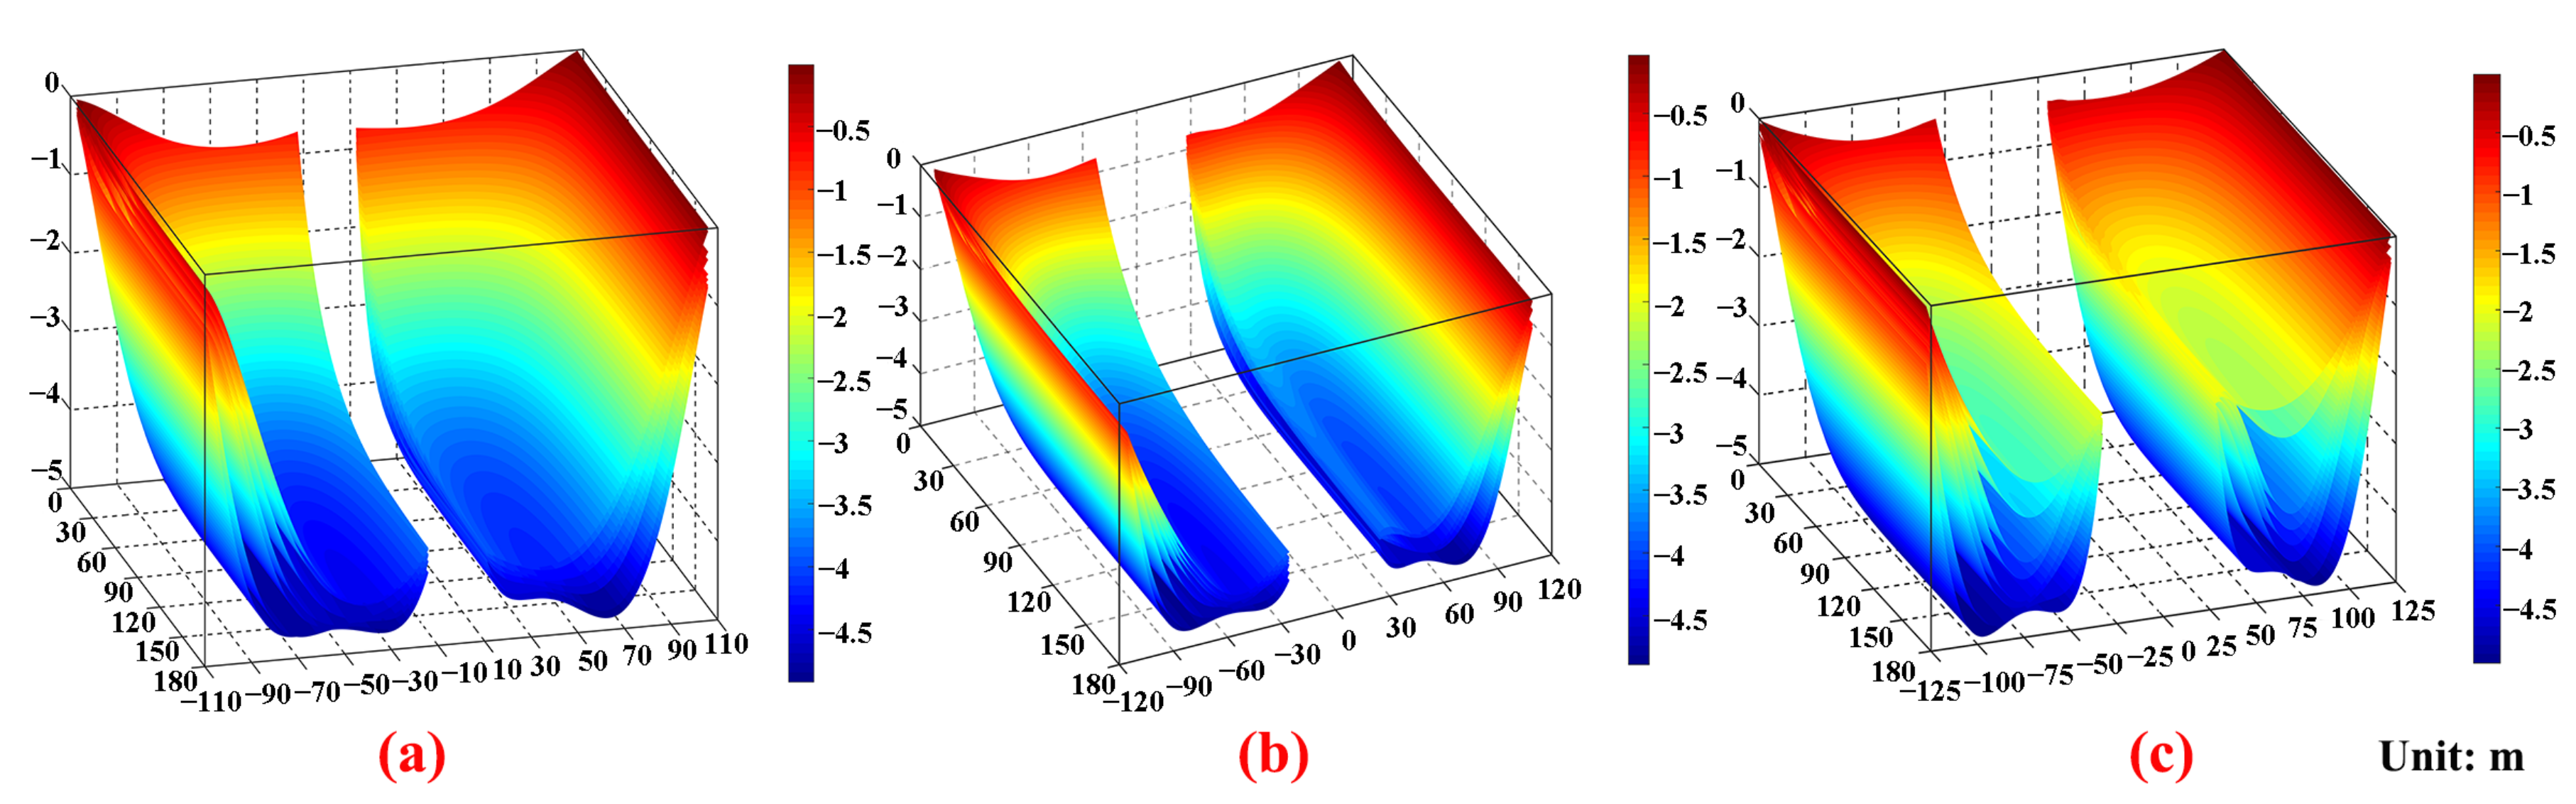
3.2. D Subsidence Value of the Overlying Strata Is Transformed into a 3D Subsidence Value

As shown in Figure 8, in a 3D space, setting the center of the floor on one side of the section coal pillar strike direction is the origin; the strike direction of the working face is the positive direction of the x-axis; the dip direction of the 11081 working face is the positive direction of the y-axis; the vertical direction pointing to the ground is the positive direction of the z-axis. Combined with the subsidence condition of the overlying strata in Section 3.1, this paper selected the overlying No. 9–16 rock strata in 3 types of GAWF as the research area to investigate the porosity distribution law of the overlying strata in the GAWF. Figure 9, Figure 10 and Figure 11 show the subsidence values of the overlying No. 9–16 rock strata in the dip model of the three types of GAWF.

3.2.1. Principle of 2D Subsidence Value Conversion to 3D Subsidence Value

The zoning calculation scheme was adopted to convert the 2D subsidence values of the overlying strata into 3D subsidence values and calculate the porosity values. The main reasons for this are as follows: (1) the subsidence laws of the overlying strata in the section coal pillar areas vary among the three types of GAWF, so the subsidence values of the overlying strata in the GAWF cannot be directly expressed by the same function formula (see Figure 9, Figure 10 and Figure 11). (2) The supporting effect width of the section coal pillar on the overlying strata is greater than the section coal pillar itself, so it cannot simply be divided and calculated according to the initial position of each working face and the section coal pillar (see Figure 9, Figure 10 and Figure 11) [37]. The specific zoning calculation scheme is described as follows: for the GFST, GFMT, and GFLT, the dip lengths goaf of each working face were taken as 95, 90 and 95 m, respectively. The remaining dip parts in the goaf of each working face were combined into the section coal pillar area for calculation; this area is uniformly referred to as the area affected by the section coal pillar (ASCP).
In each overlying rock stratum subsidence condition in the strike and dip model of the GAWF, as shown in Figure 8, there were intersection points M1 and M2 for each overlying rock stratum of the goaf strike and dip models of each working face. At points M1 and M2, the subsidence values of each rock stratum in the two models were equal. Since the subsidence condition of overlying strata in the dip model was more consistent with the real situation, the subsidence value of M1 and M2 of each overlying rock stratum in the dip model was taken as the fiducial value. The calibration coefficient of each rock stratum in the strike model was calculated by dividing the subsidence value of M1 and M2 of each overlying rock stratum in the strike model and the corresponding fiducial value. Calibration coefficients were utilized to calibrate the subsidence value of each rock stratum in the strike model. The calculation formula of the calibration coefficient is shown as follows:
ω i = w H ( k ) G ( k ) ( M i ) w E ( k ) F ( k ) ( M i )
where i is the rock stratum number; k = 1 or 2; ωi is the calibration coefficient of the No. i rock stratum; Mi is point M of the No. i rock stratum; and w(Mi) is the subsidence value of point M(k) on the H(k) − G(k) and E(k) − F(k) subsidence curves, m.
Figure 6 and related research results [38] show that the subsidence values of the overlying strata in the goaf of the working face were symmetrical along the middle goaf of the working face, so only the situation from one side in the strike direction to the middle in the goaf of the working face was evaluated. Using the GFST as an example, the subsidence values of each overlying rock stratum in the corrected strike model are drawn in Figure 12.
The overlying strata subsidence curve form in the strike model of the GAWF conforms to the negative exponential function relationship proposed by the “voussoir beam” theory [1,39], as shown in Formulas (8) and (9).
w i ( x ) = w m ( 1 exp ( x 2 l i ) )
l i = h R T 3 q
where wi(x) is the subsidence value at any point in the strike direction of No. i rock stratum, m; wm is the subsidence value of point M (maximum subsidence value of the rock stratum), m; RT is the tensile strength of the rock stratum, Pa; q is the overlying load, Pa; and h is the height of the rock stratum, m.
According to Formulas (8) and (9), when x = 0, wi = 0, the subsidence value of each overlying rock stratum at origin O is 0, which different from reality. The boundary coal pillar at origin O has a supporting effect on the overlying strata, but it is impossible to fully support this, so that all overlying strata subsidence values are 0. To reflect the actual situation, the structure of Formula (8) is transformed into Formula (10).
w i ( x ) = w ( 1 exp ( s x ) ) + w
w m = w + w
where s is the coefficient; w″ is the subsidence value of each rock stratum at x = 0, m; and w′ and w″ satisfy the relationship shown in Formula (11).
The subsidence value of each point on the E1F1 and E2F2 subsidence curves was converted into the subsidence coefficient. The subsidence coefficient is defined as the ratio between the subsidence value of each point on the subsidence curve and the subsidence value of point M(k). The calculation formula is shown as follows:
τ i ( n ) = w E ( k ) F ( k ) ( n i ) w E ( k ) F ( k ) ( M i )
where ni is each point on the subsidence curve of the No. i rock stratum, τi(n) is the subsidence coefficient at each point of the No. i rock stratum, and w(ni) is the subsidence value of each point on the E(k) − F(k) subsidence curve, m.
By multiplying the subsidence value of each rock stratum in the strike model by the subsidence coefficient of the corresponding dip model, the conversion of each stratum subsidence value from 2D to 3D can be realized. The calculation formula is shown as follows:
w i ( x , y ) = w i ( x ) τ i ( y )
MATLAB software was adopted to try to use Formulas (8) and (10) to fit the overlying strata subsidence coefficient value in the goaf dip model of each working face after zoning. However, the fitting effect was not ideal (mainly the GFST and GFMT) for the following reasons: Under the influence of the 11081 working face mining, the relatively stable bearing structure of the 11061 goaf becomes unstable again. Due to the support of the section coal pillar, the subsidence form and maximum subsidence value position of each overlying rock stratum in the goaf of each working face are different from those in the GSWF. Therefore, 1stOpt software was selected to automatically obtain the best fitting formula. By analyzing the fitting results of multigroup data, Formula (14) was considered to have the best fitting effect (the fitting R2 value of the subsidence coefficient of each rock stratum is greater than 0.98).
τ i ( y ) = l 1 + l 2 y + l 3 y 2 + l 4 y 3 + l 5 y 4 + l 6 y 5
where l1 is a constant and l2l6 are coefficients.
Consequently, the expression of the 3D subsidence value of overlying strata in the GAWF is shown as follows:
w i ( x , y ) = w i ( x ) τ i ( y ) = ( w ( 1 exp ( s x ) ) + w ) ( l 1 + l 2 y + l 3 y 2 + l 4 y 3 + l 5 y 4 + l 6 y 5 )

3.2.2. Conversion Results

The 3D subsidence value expression of overlying strata in three types of the GAWF was obtained by fitting (taking the GFST as an example, the specific expression of the 3D subsidence value of overlying strata in the GFST is shown in Formulas (16) and (17)), and a 3D subsidence value cloud map is drawn, as shown in Figure 13.
The specific expression of the 3D subsidence value of the overlying strata in the goaf of the 11061 working face is:
w i ( x , y ) = ( 3.605 × ( 1 e 0.06865 x ) 1.198 ) × ( 0.39712 0.056570 y 0.00188 y 2 2.68229 × 10 ( 5 ) y 3 1.49633 × 10 ( 7 ) y 4 1.46065 × 10 ( 10 ) y 5 ) i = 1 ( 3.697 × ( 1 e 0.05849 x ) 1.083 ) × ( 0.15883 0.087870 y 0.00339 y 2 5.98401 × 10 ( 5 ) y 3 4.77860 × 10 ( 7 ) y 4 1.33931 × 10 ( 9 ) y 5 ) i = 2 ( 3.770 × ( 1 e 0.04517 x ) 0.973 ) × ( 0.10763 0.096450 y 0.00404 y 2 8.01289 × 10 ( 5 ) y 3 7.41910 × 10 ( 7 ) y 4 2.50107 × 10 ( 9 ) y 5 ) i = 3 ( 3.780 × ( 1 e 0.04033 x ) 0.932 ) × ( 0.25716 0.076460 y 0.00315 y 2 6.32673 × 10 ( 5 ) y 3 6.03325 × 10 ( 7 ) y 4 2.09414 × 10 ( 9 ) y 5 ) i = 4 ( 3.826 × ( 1 e 0.03628 x ) 0.875 ) × ( 0.49000 0.042280 y 0.00155 y 2 3.07166 × 10 ( 5 ) y 3 3.11892 × 10 ( 7 ) y 4 1.14877 × 10 ( 9 ) y 5 ) i = 5 ( 3.727 × ( 1 e 0.03326 x ) 0.860 ) × ( 0.58000 0.030950 y 0.00105 y 2 2.05271 × 10 ( 5 ) y 3 2.20808 × 10 ( 7 ) y 4 8.57935 × 10 ( 9 ) y 5 ) i = 6 ( 3.718 × ( 1 e 0.03128 x ) 0.852 ) × ( 0.64900 0.020570 y 0.00054 y 2 9.69006 × 10 ( 6 ) y 3 1.19853 × 10 ( 7 ) y 4 5.18336 × 10 ( 10 ) y 5 ) i = 7 ( 3.672 × ( 1 e 0.03000 x ) 0.848 ) × ( 0.65300 0.021472 y 0.00055 y 2 9.65703 × 10 ( 6 ) y 3 1.20979 × 10 ( 7 ) y 4 5.30096 × 10 ( 10 ) y 5 ) i = 8
The specific expression of the 3D subsidence value of the overlying strata in the goaf of the 11081 working face is:
w i ( x , y ) = ( 3.615 × ( 1 e 0.06865 x ) 1.200 ) × ( 0.33253 + 0.072680 y 0.00321 y 2 + 6.54617 × 10 ( 5 ) y 3 5.99592 × 10 ( 7 ) y 4 + 1.94129 × 10 ( 9 ) y 5 ) i = 1 ( 3.681 × ( 1 e 0.05847 x ) 1.079 ) × ( 0.27613 + 0.081040 y 0.00368 y 2 + 7.70417 × 10 ( 5 ) y 3 7.26975 × 10 ( 7 ) y 4 + 2.44358 × 10 ( 9 ) y 5 ) i = 2 ( 3.732 × ( 1 e 0.04516 x ) 0.963 ) × ( 0.52255 + 0.047670 y 0.00221 y 2 + 4.96123 × 10 ( 5 ) y 3 5.09902 × 10 ( 7 ) y 4 + 1.84641 × 10 ( 9 ) y 5 ) i = 3 ( 3.686 × ( 1 e 0.04033 x ) 0.909 ) × ( 0.61185 + 0.037270 y 0.00175 y 2 + 4.06360 × 10 ( 5 ) y 3 4.33553 × 10 ( 7 ) y 4 + 1.61351 × 10 ( 9 ) y 5 ) i = 4 ( 3.714 × ( 1 e 0.03628 x ) 0.849 ) × ( 0.70128 + 0.022470 y 0.00098 y 2 + 2.35003 × 10 ( 5 ) y 3 2.69482 × 10 ( 7 ) y 4 + 1.05211 × 10 ( 9 ) y 5 ) i = 5 ( 3.624 × ( 1 e 0.03325 x ) 0.837 ) × ( 0.77409 + 0.014670 y 0.00054 y 2 + 1.31638 × 10 ( 5 ) y 3 1.66813 × 10 ( 7 ) y 4 + 6.89180 × 10 ( 10 ) y 5 ) i = 6 ( 3.563 × ( 1 e 0.03128 x ) 0.816 ) × ( 0.83776 + 0.006500 y 0.00014 y 2 + 3.85087 × 10 ( 6 ) y 3 7.26670 × 10 ( 8 ) y 4 + 3.50005 × 10 ( 10 ) y 5 ) i = 7 ( 3.464 × ( 1 e 0.02998 x ) 0.800 ) × ( 0.83278 + 0.009224 y 0.00021 y 2 + 3.90090 × 10 ( 6 ) y 3 6.32333 × 10 ( 8 ) y 4 + 2.93430 × 10 ( 10 ) y 5 ) i = 8
Figure 13 shows that the 3D subsidence values of overlying strata in GAWF are consistent with the subsidence values and subsidence laws of rock strata extracted from the 2D models.

4. Porosity Distribution Law of Overlying Strata in GAWF

4.1. Porosity Calculation Method

Generally, rock porosity is defined as the ratio of the total volume of pores and fissures in the rock mass to the total volume of the rock mass, and the calculation formula is as follows:
p = V 2 V 1 V 2
where V1 is the original rock volume, m3; V2 is the volume of broken rock mass, m3; p is the rock porosity.
The porosity of rock stratum consists of two parts: the initial porosity of rock stratum and the change porosity value of rock stratum (reaccumulation and distribution after mining). With the same calculation, the change porosity value of the rock stratum is the ratio of the change value of rock stratum height to the height of rock stratum. Therefore, the calculation formula of rock porosity (Formula (18)) can be improved, and the formula used to calculate the porosity of the overlying strata in the goaf of the working face can be obtained as follows:
p i = W i W i + 1 Q i W i W i + 1 + p i c
W i = H i + w i ( x , y )
where Wi is the height of the No. i rock stratum in the goaf of the working face, m; Qi is the initial height of the No. i rock stratum, m; pi is the porosity of the No. i rock stratum in the goaf of the working face; p i c is the initial porosity of the No. i rock stratum; W17 = 0; and Hi is the initial height of the No. i rock stratum, m. The initial porosity of certain rock strata is shown in Table 4 (the initial porosity value of each rock stratum is obtained from the data provided by the coal-mining enterprise).
Taking the goaf of the 11061 working face as an example, its porosity calculation formula of overlying strata is as follows:
p i = W 1 W 0 Q 1 W 1 W 0 + p 1 c = w 1 + 5 w 1 + 9 + 0.05 i = 1 W 2 W 1 Q 2 W 2 W 1 + p 2 c = w 2 w 1 w 2 w 1 + 5 + 0.02 i = 2 W 3 W 2 Q 3 W 3 W 2 + p 3 c = w 3 w 2 w 3 w 2 + 7 + 0.05 i = 3 W 4 W 3 Q 4 W 4 W 3 + p 4 c = w 4 w 3 w 4 w 3 + 7 + 0.04 i = 4 W 5 W 4 Q 5 W 5 W 4 + p 5 c = w 5 w 4 w 5 w 4 + 7 + 0.03 i = 5 W 6 W 5 Q 6 W 6 W 5 + p 6 c = w 6 w 5 w 6 w 5 + 10 + 0.02 i = 6 W 7 W 6 Q 7 W 7 W 6 + p 7 c = w 7 w 6 w 7 w 6 + 7 + 0.04 i = 7 W 8 W 7 Q 8 W 8 W 7 + p 8 c = w 8 w 7 w 8 w 7 + 10 + 0.03 i = 8
The formula for calculating the porosity of overlying strata in the ASCP is shown as follows:
n i = ( ( w i 1 + w i 2 + + w i t ) / t ) ( ( w i + 1 1 + w i + 1 2 + + w i + 1 t ) / t ) ( ( w i 1 + w i 2 + + w i t ) / t ) ( ( w i + 1 1 + w i + 1 2 + + w i + 1 t ) / t ) + Q i + n i c
where n i is the average porosity of the No. i rock stratum in the ASCP; w i t is the subsidence value at point t of the No. i rock stratum in the ASCP, m; and t is the total number of points for monitoring the No. i rock stratum subsidence data in the ASCP.

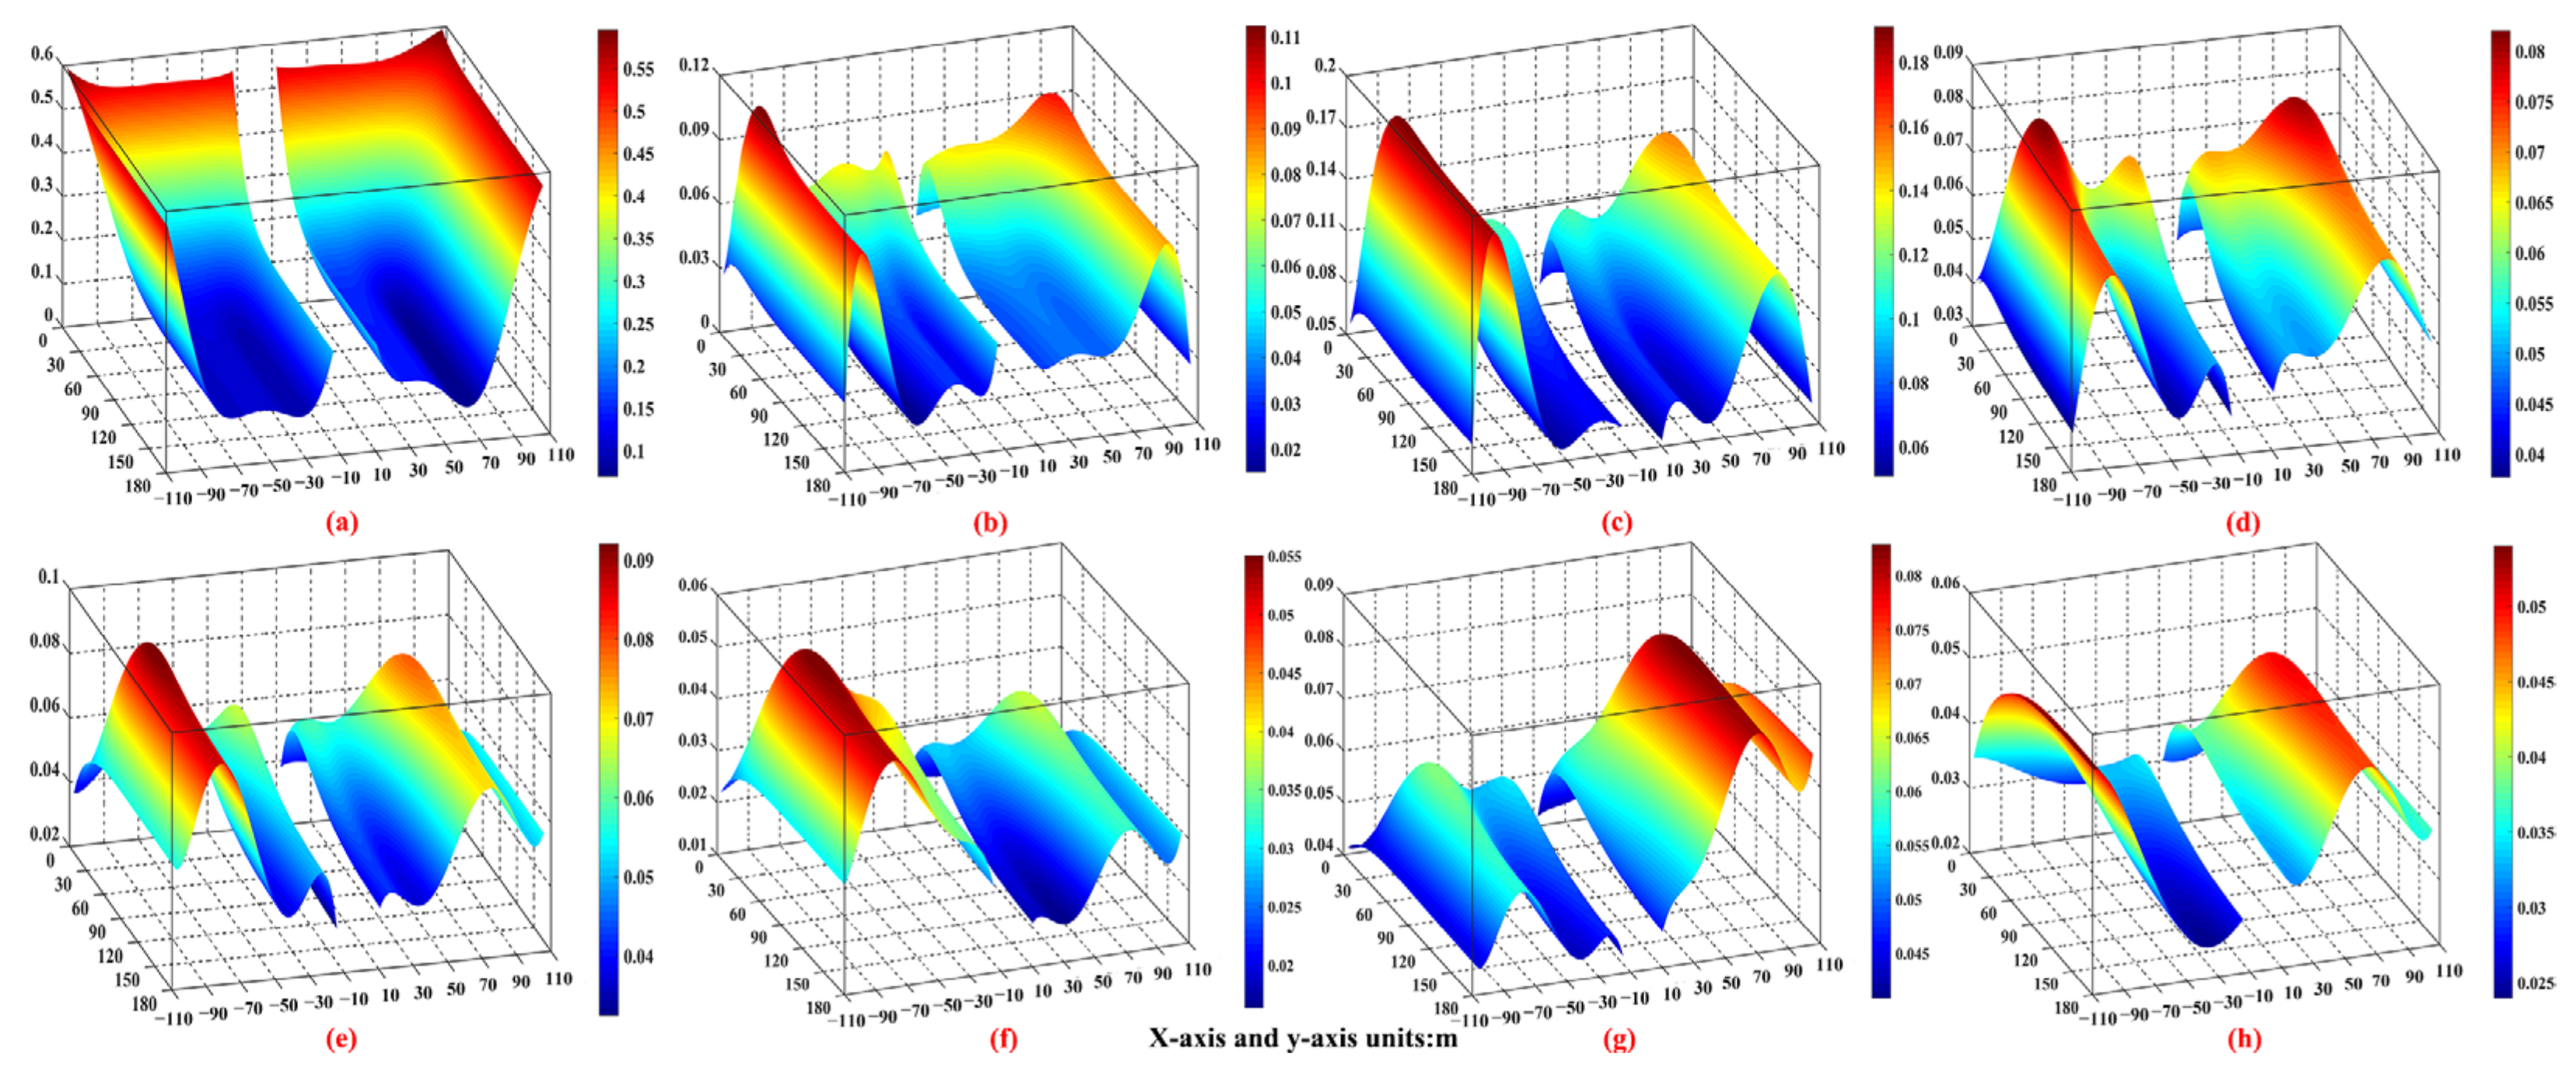
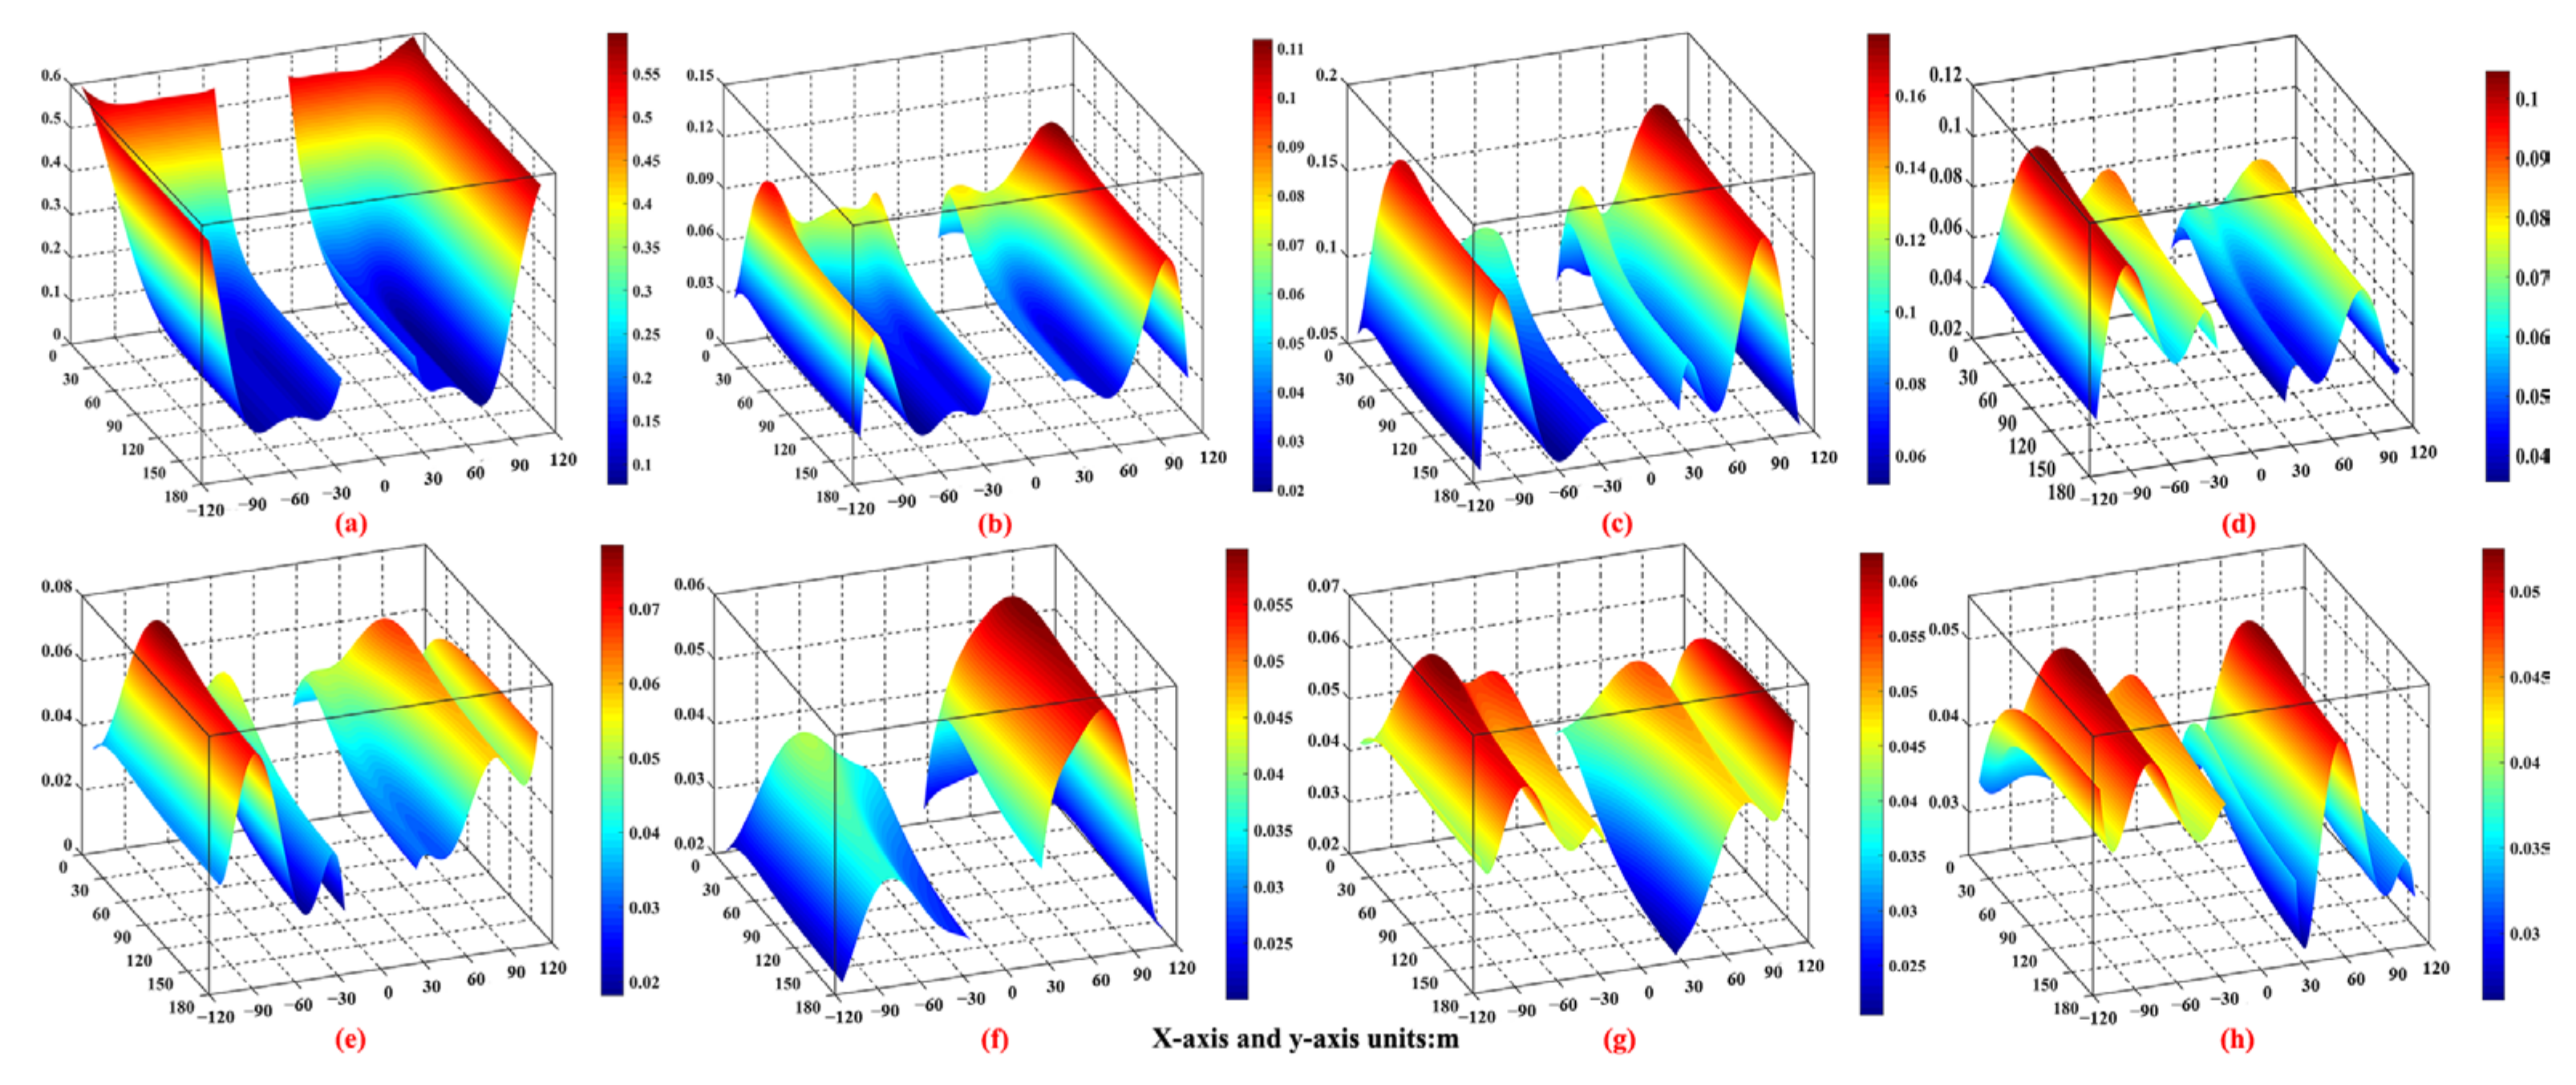
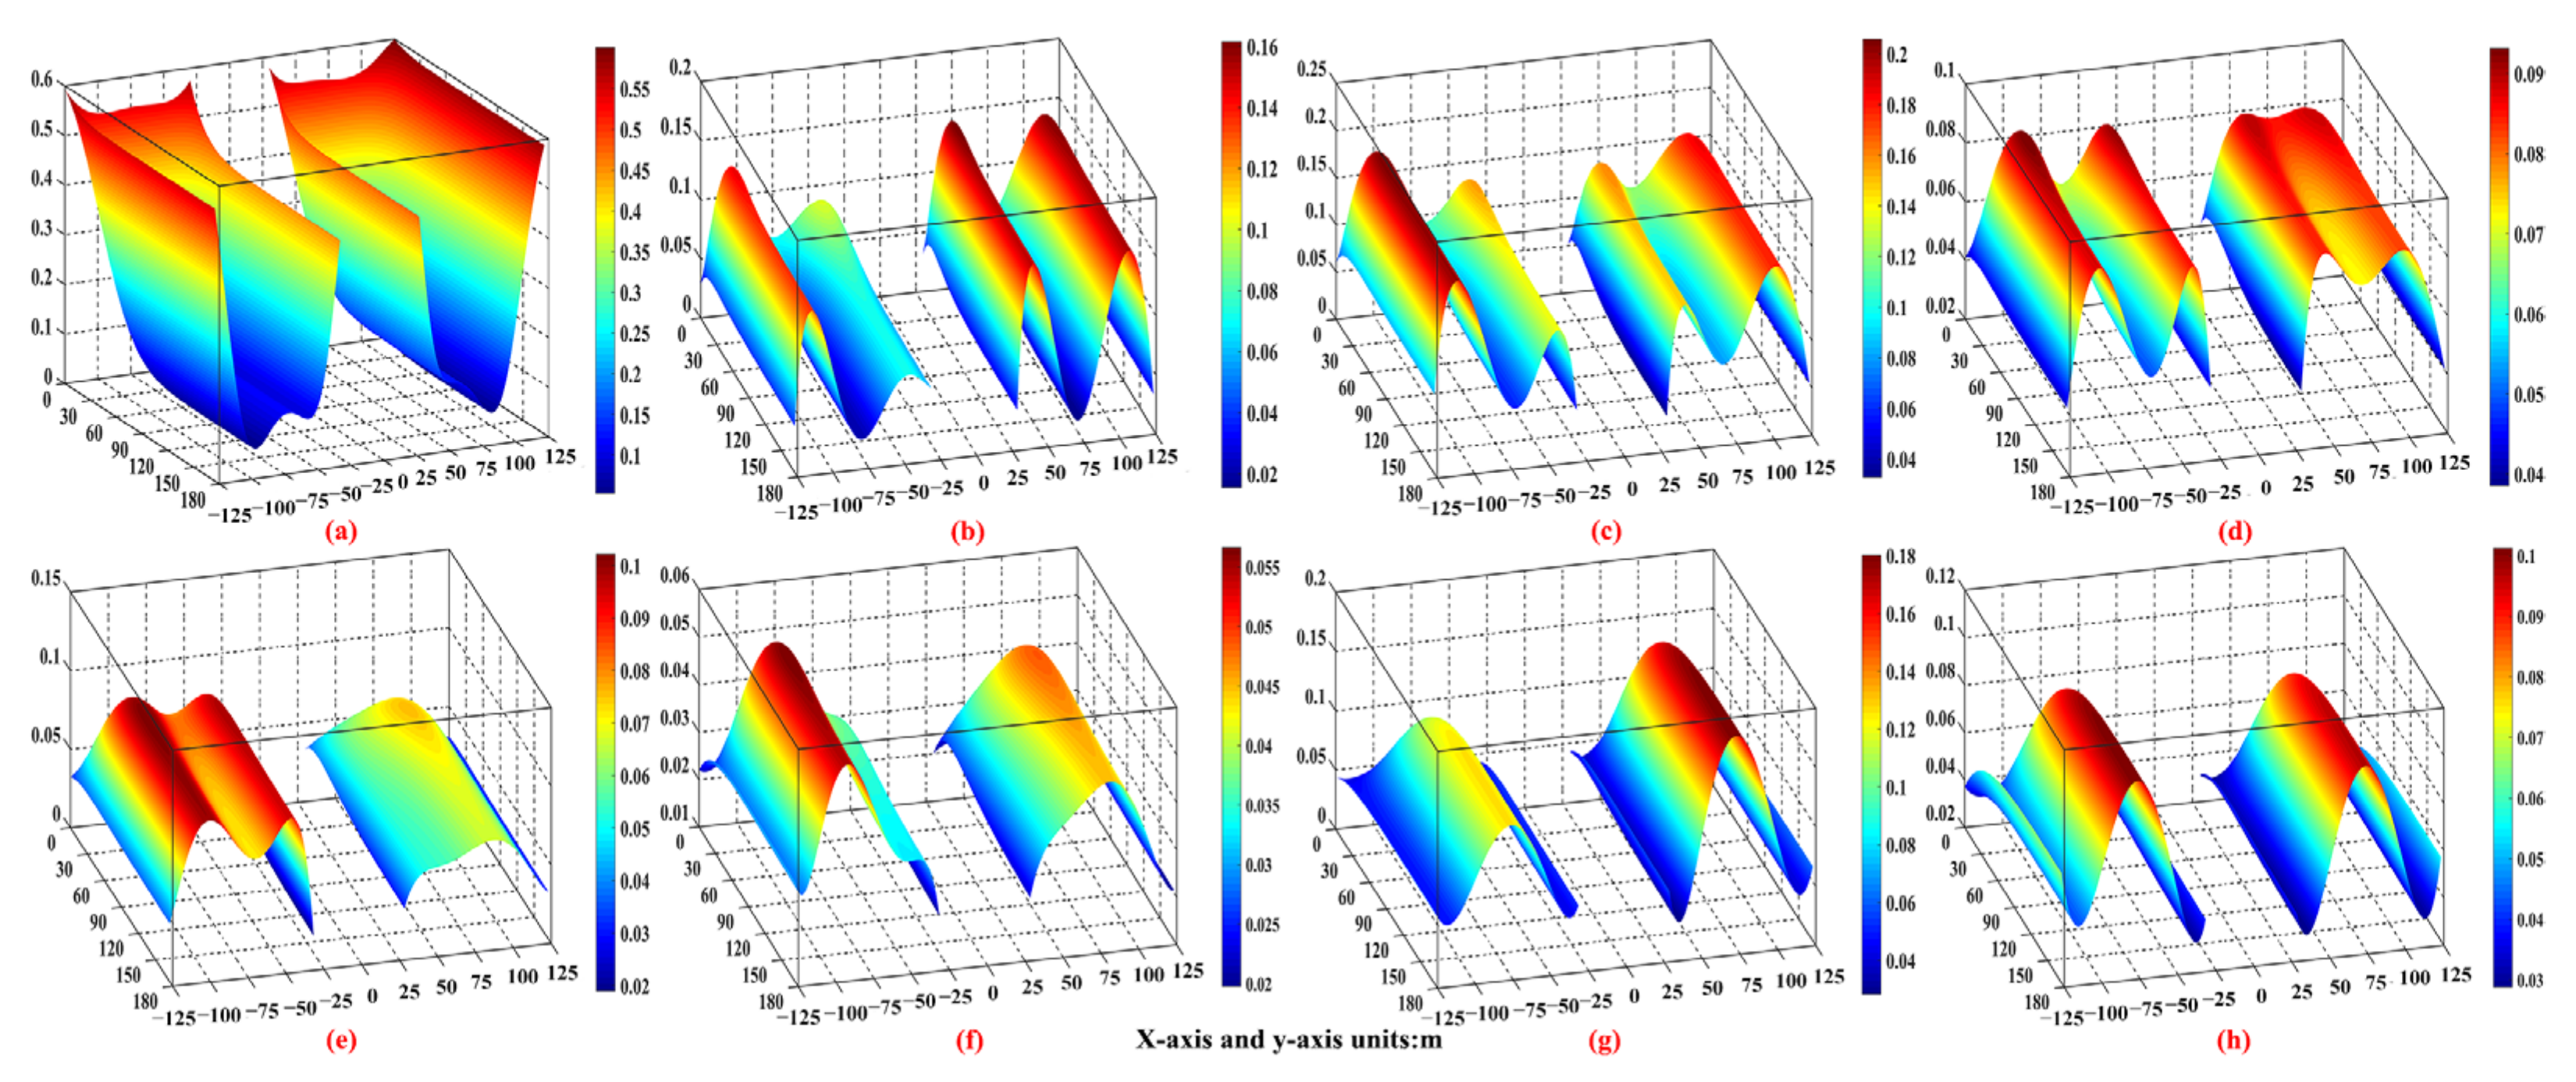
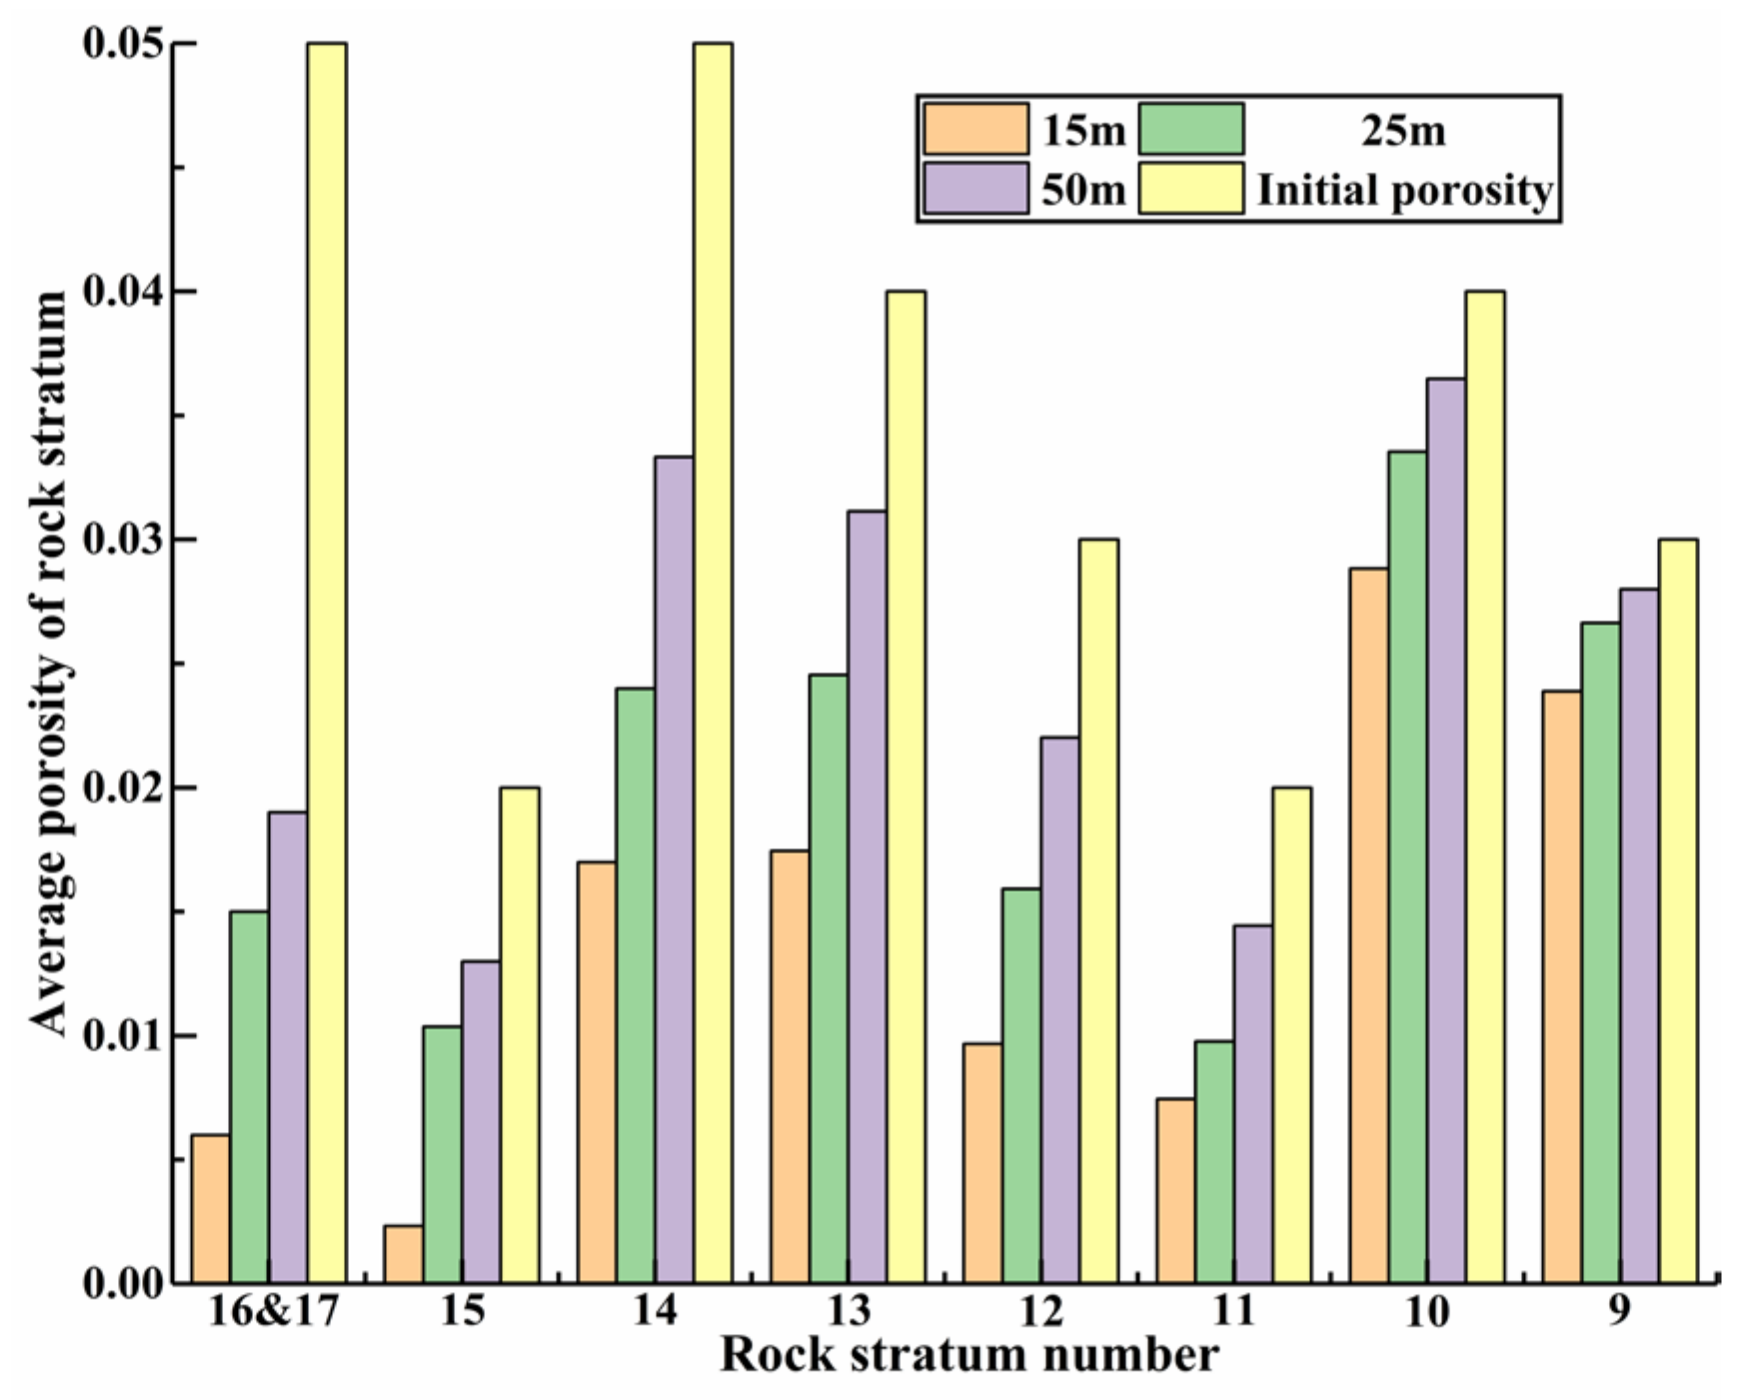
4.2. Porosity Distribution Law

4.2.1. Porosity Distribution Law of Overlying Strata in the GFST

The porosity distribution condition of the overlying strata in the GFST is shown in Figure 14.
Figure 14 shows the porosity value distribution law: (1) The porosity value in the No. 16 rock stratum area in the goaf of each working face decreases from all around the edge of the rock stratum to the middle of the rock stratum, and the maximum porosity value area is the periphery edge (excluding the edge adjacent to the section coal pillar) area of the rock stratum. (2) In the area of the No. 9–15 rock strata, the porosity value shows a trend of small–large–small variation from the rock strata peripheral edge to the middle of the strata. The area with the maximum porosity value is offset to the middle of the strata, and the offset distance is basically positively correlated with the height of each overlying stratum. (3) In the area of the No. 11–15 rock strata, the porosity values of the overlying strata in the goaf of the 11061 working face are greater than those of the 11081 working face. In the area of the No. 9–10 rock strata, the porosity values of the overlying strata in the goaf of the 11081 working face are greater than those of the 11061 working face. The porosity values of the overlying strata in the goaf of the former mining working face are greater than those of the latter mining working face. With an increase in the height of each overlying strata, the porosity values of the overlying strata in the goaf of the latter mining working face are greater than those of the former mining working face.
In terms of the porosity spatial form distribution law, from the coal seam floor upward, the porosity spatial form distribution condition of the overlying strata in the goaf of each working face is described as follows: a partial “dustpan” shape–unilateral “concave–convex peak” combined shape.

4.2.2. Porosity Distribution Law of Overlying Strata in the GFMT

The porosity distribution condition of the overlying strata in the GFMT is shown in Figure 15.
As shown in Figure 15, in terms of the porosity value distribution law, the porosity value variation law of each rock stratum is basically consistent with that of the overlying strata in the GFST. A comparison of the porosity values of each overlying rock stratum in the goaf of the former mining working face with that of the latter mining working face reveals that there is no obvious porosity value distribution law. This finding indicates that, compared with the GFST, the influence of the working face mining sequence on the porosity value distribution of the overlying strata in the GFMT has disappeared.
In terms of the porosity spatial form distribution law, the porosity spatial form distribution condition of the overlying strata in the goaf of each working face is basically consistent with that of the GFST.

4.2.3. Porosity Distribution Law of Overlying Strata in the GFLT

The porosity distribution condition of the overlying strata in the GFLT is shown in Figure 16.
Figure 16 shows the porosity value distribution law: (1) The porosity value for the No. 16 rock stratum area in the goaf of each working face decreases from all around the edge of the rock stratum to the middle of the rock stratum, and the maximum porosity value area is all around the edge area of the rock stratum. (2) In the area of the No. 11–15 rock strata, the porosity value shows a trend of small–large–small variation from the rock strata all around the edge to the middle of the rock strata. In the area of the No. 9–10 rock strata, the porosity value for the rock strata increases from all around the edge to the central section, and the porosity value for the middle of the rock strata is the largest. In the area of the No. 9–15 rock strata, the offset distance from the maximum porosity value area to the middle of the rock strata is positively correlated with the height of each overlying stratum. (3) A comparison of the porosity values of each overlying rock stratum in the goaf of the former mining working face with that of the latter mining working face reveals that the porosity value distribution of each overlying rock stratum in the goaf of the two working faces is similar. This finding shows that the section coal pillar isolates the goaf of two adjacent working faces into a mutually independent goaf of the working face.
In terms of the porosity spatial form distribution law, from the coal seam floor upward, the porosity spatial form distribution condition of overlying strata in the goaf of each working face is expressed as follows: “dustpan” shape–“concave-convex peak” combined shape–“Λ” shape.

4.2.4. Porosity Distribution Law of Overlying Strata in the ASCP

The average porosity calculation results of the overlying strata in the ASCP are shown in Figure 17 (the initial porosities of the coal seam and No. 16 rock stratum are both 0.05, so the two are combined into the same rock stratum to calculate the porosity).
Figure 17 shows that as the width of the section coal pillar increases, the porosity value from the bottom of the section coal pillar to each overlying rock stratum continues to increase, but is still less than its initial porosity value, and the increase rate continuously decreases. The main reason that the porosity of each rock stratum is always less than its initial porosity is as follows: after coal seam mining, the stress from the bottom of the section coal pillar to each overlying rock stratum must be greater than its original stress. The increase in the stress of each rock stratum will reduce the volume of pores and fissures contained in the rock stratum, resulting in the porosity of each rock stratum being less than its initial porosity.

4.2.5. Discussion

In this paper, the porosity distribution law of overlying strata in the GAWF under different section coal pillar types is obtained. It is proved that the porosity distribution of the overlying strata in the GAWF is different due to the influence of section coal pillar width, and this influence factor cannot be ignored. The porosity distribution law of overlying strata in the GFST and GFMT is different from that of the GSWF, and is affected by the mining sequence [18,40].
By comparing the porosity distribution of overlying strata in the GAWF with that in the GSWF, it is concluded that: (1) For the GFST, the porosity distribution of overlying strata in the goaf of the two working faces can be combined to form a complete “porosity distribution of overlying strata in the GSWF”. (2) For the GFMT, the porosity distribution of overlying strata in the goaf of each working face is similar to a complete “porosity distribution of overlying strata in the GSWF”. (3) For the GFLT, the porosity distribution of overlying strata in the goaf of each working face is basically the same as that in the GSWF.
The research results of this paper can provide certain guidance for the research and practical application of accurate gas extraction, precise prediction of the coal spontaneous combustion area in the goaf, etc. For example, at this stage in the ongoing project of gas resource extraction and utilization of abandoned coal mines in China, the research results of this paper will help coal mining enterprises to identify the gas enrichment areas (areas with large porosity) of abandoned coal mines, and optimize the location of gas drainage to more accurately extract gas resources [41,42].

5. Conclusions

In this paper, from the perspective of different section coal pillar types, three methods of theoretical analysis, numerical simulation and formula fitting were combined to study the porosity distribution law of overlying strata in GAWF. The main conclusions are as follows:
(1)
The offset distance of the maximum subsidence value position of each overlying rock stratum in the goaf of the two adjacent working faces to the goaf direction of the other working face, and the heights of rock strata with large subsidence values, are negatively correlated with the width of the section coal pillar. Using the limit equilibrium theory and combined with the width-to-height ratio of the section coal pillar, the supporting effect of the section coal pillar in GAWF can be accurately predicted. Through the comparative analysis of overlying strata subsidence conditions in the GAWF under different section coal pillar widths, the GAWF can be divided into three types: GFST, GFMT, and GFLT.
(2)
In terms of the porosity value distribution law, the offset distance of the maximum porosity value area of each overlying rock stratum in the goaf of the working face to the middle of the rock strata is positively correlated with the height of each overlying stratum. In ASCP, porosity values from the bottom of the section coal pillar to each overlying rock stratum increase with an increase in the section coal pillar width, but are still less than its own initial porosity value, and the increase rate is continuously decreasing. When the section coal pillar width is smaller than (greater than or equal to) the width required to provide stable support, the porosity distribution condition of the overlying strata is significantly affected (not affected) by the mining sequence.
(3)
In terms of the porosity spatial form distribution law, from the coal seam floor upward, the spatial form distribution condition of overlying strata in the GFST and GFMT is expressed as follows: partial “dustpan” shape–unilateral “concave–convex peak” combined shape. The spatial form distribution condition of overlying strata in the GFLT is described as follows: “dustpan” shape–“concave–convex peak” combined shape-“Λ” shape.
In this study, the goaf of a horizontal adjacent working face is taken as the research object, and the obtained porosity distribution law can only be applied to the goaf of a horizontal adjacent working face, not to the goaf of an inclined adjacent working face. To apply the porosity distribution law to the production practice activities, such as optimizing the location of gas drainage, the same method can be used to study the porosity distribution law of overlying strata in the goaf of an inclined adjacent working face in the future research work. In the future, the porosity distribution model of overlying strata in the GAWF can be derived from the perspective of the rock expansion coefficient, and the influence of fractures or structural zones on the porosity distribution law of overlying strata in the goaf can be discussed.

Author Contributions

Conceptualization, S.T. and J.M.; methodology, J.M.; software, J.M.; validation, H.L.; formal analysis, J.M.; investigation, J.M.; resources, S.T.; data curation, J.M.; writing—original draft preparation, J.M.; writing—review and editing, S.T. and H.L.; visualization, J.M. and H.L.; supervision, S.T. and H.L.; project administration, S.T.; funding acquisition, H.L. All authors have read and agreed to the published version of the manuscript.

Funding

This research was funded by the National Natural Science Foundation of China (Grant No. U1904210, Grant No. 51874237, and Grant No. 71273208).

Data Availability Statement

The data used to support the findings of this study are available from the corresponding author upon request ([email protected]).

Acknowledgments

We thank Jingli Zhang for her help in software operation.

Conflicts of Interest

The authors declare no conflict of interest.

References

  1. Qian, M.; Xu, J. Behaviors of strata movement in coal mining. J. China Coal Soc. 2019, 44, 973–984. [Google Scholar]
  2. Zhang, Y.; Niu, K.; Du, W.; Zhang, J.; Wang, H.; Zhang, J. A method to identify coal spontaneous combustion-prone regions based on goaf flow field under dynamic porosity. Fuel 2021, 288, 119690. [Google Scholar] [CrossRef]
  3. Qu, Q.; Xu, J.; Wu, R.; Qin, W.; Hu, G. Three-zone characterisation of coupled strata and gas behaviour in multi-seam mining. Int. J. Rock Mech. Min. 2015, 78, 91–98. [Google Scholar] [CrossRef]
  4. Ma, L.; Guo, R.; Wu, M.; Wang, W.; Ren, L.; Wei, G. Determination on the hazard zone of spontaneous coal combustion in the adjacent gob of different mining stages. Process Saf. Environ. Prot. 2020, 142, 370–379. [Google Scholar] [CrossRef]
  5. Brodny, J.; Tutak, M.; John, A. Analysis of Influence of Types of Rocks Forming the Goaf with Caving on the Physical Parameters of Air Stream Flowing Through These Gob and Adjacent Headings. Mechanics 2018, 24, 43–49. [Google Scholar] [CrossRef] [Green Version]
  6. Tutak, M.; Brodny, J. Determination of Particular Endogenous Fires Hazard Zones in Goaf with Caving of Longwall. IOP Conf. Ser. Earth Environ. Sci. 2017, 95, 042026. [Google Scholar] [CrossRef]
  7. Brodny, J.; Tutak, M. Applying computational fluid dynamics in research on ventilation safety during underground hard coal mining: A systematic literature review. Process Saf. Environ. Prot. 2021, 151, 373–400. [Google Scholar] [CrossRef]
  8. Wang, W.; Sui, W.; Faybishenko, B.; Stringfellow, W. Permeability variations within mining-induced fractured rock mass and its influence on groundwater inrush. Environ. Earth Sci. 2016, 75, 326. [Google Scholar] [CrossRef]
  9. Li, P.; Wang, X.; Cao, W.; Zhang, D.; Qin, D.; Wang, H. Influence of Spatial Relationships between Key Strata on the Height of Mining-Induced Fracture Zone: A Case Study of Thick Coal Seam Mining. Energies 2018, 11, 102. [Google Scholar] [CrossRef] [Green Version]
  10. Tian, S.; Yang, P.; Tang, K.; Shen, X.; Shi, F. Safety performance of coal mine survey technology using nano-fiber material in coal mining process. Arabian J. Geosci. 2020, 13, 841. [Google Scholar] [CrossRef]
  11. Kuyucak, N. Water in Mining and Environment for Sustainability. Mine Water Environ. 2021, 40, 815–817. [Google Scholar] [CrossRef]
  12. Wang, W.; Li, Z.; Yu, H. Goaf Gas Control Improvement by Optimizing the Adjacent Roadway Large-Diameter Boreholes. Adv. Civ. Eng. 2021, 2021, 1933010. [Google Scholar] [CrossRef]
  13. Liang, Y.; Wang, S. Prediction of coal mine goaf self-heating with fluid dynamics in porous media. Fire Saf. J. 2017, 87, 49–56. [Google Scholar] [CrossRef]
  14. Wang, G.; Xu, H.; Wu, M.; Wang, Y.; Wang, R.; Zhang, X. Porosity model and air leakage flow field simulation of goaf based on DEM-CFD. Arabian J. Geosci. 2018, 11, 148. [Google Scholar] [CrossRef]
  15. Jia, N.; Li, Z. Porosity Estimation of a Porous Goaf Area Based on Seismic Wave Attenuation. Pure Appl. Geophys. 2021, 178, 1845–1858. [Google Scholar] [CrossRef]
  16. Zhu, H.; Fang, S.; Huo, Y.; Liao, Q.; Hu, L.; Zhang, Y.; Li, F. Study on the optimal position of the roof low roadway based on the response surface methodology. Sci. Rep. 2021, 11, 14508. [Google Scholar] [CrossRef]
  17. Wang, S.; Wang, D.; Cao, K.; Wang, S.; Pi, Z. Distribution law of 3D fracture field of goaf and overlying strata. J. Cent. South Univ. (Sci. Technol.) 2014, 45, 833–839. [Google Scholar]
  18. Wang, S.; Li, X.; Wang, D. Void fraction distribution in overburden disturbed by longwall mining of coal. Environ. Earth Sci. 2016, 75, 151. [Google Scholar] [CrossRef]
  19. Li, Z.; Yi, G.; Wu, J.; Guo, D.; Zhao, C.; Zhao, D. Study on spontaneous combustion distribution of goaf based on the “O” type risked falling and non-uniform oxygen. J. China Coal Soc. 2012, 37, 484–489. [Google Scholar]
  20. Li, L.; Li, G.; Gong, W.; Deng, H. Energy Evolution Pattern and Roof Control Strategy in Non-Pillar Mining Method of Goaf-Side Entry Retaining by Roof Cutting—A Case Study. Sustainability 2019, 11, 7029. [Google Scholar] [CrossRef] [Green Version]
  21. Yang, H.; Han, C.; Zhang, N.; Sun, C.; Pan, D.; Dong, M. Stability Control of a Goaf-Side Roadway under the Mining Disturbance of an Adjacent Coal Working Face in an Underground Mine. Sustainability 2019, 11, 6398. [Google Scholar] [CrossRef] [Green Version]
  22. Gao, Y.; Liu, D.; Zhang, X.; He, M. Analysis and Optimization of Entry Stability in Underground Longwall Mining. Sustainability 2017, 9, 2079. [Google Scholar] [CrossRef] [Green Version]
  23. Najafi, M.; Shishebori, A.; Gholamnejad, J. Numerical Estimation of Suitable Distance between Two Adjacent Panels’ Working Faces in Shortwall Mining. Int. J. Geomech. 2017, 17, 04016090. [Google Scholar] [CrossRef]
  24. Shen, W.; Bai, J.; Li, W.; Wang, X. Prediction of relative displacement for entry roof with weak plane under the effect of mining abutment stress. Tunn. Undergr. Sp. Tech. 2018, 71, 309–317. [Google Scholar] [CrossRef]
  25. Yu, B.; Zhang, Z.; Kuang, T.; Liu, J. Stress Changes and Deformation Monitoring of Longwall Coal Pillars Located in Weak Ground. Rock Mech. 2016, 49, 3293–3305. [Google Scholar] [CrossRef]
  26. Xia, Z.; Yao, Q.; Meng, G.; Xu, Q.; Tang, C.; Zhu, L.; Wang, W.; Shen, Q. Numerical study of stability of mining roadways with 6.0-m section coal pillars under influence of repeated mining. Int. J. Rock Mech. Min. 2021, 138, 104641. [Google Scholar] [CrossRef]
  27. Chen, Y.; Li, D.; Jiang, F.; Zhang, L.; Wang, C.; Zhu, S. Use of the Equivalent Mining Height Method for Understanding Overlying Strata Movement and Stress Distribution in an Isolated Coal Pillar. Shock Vib. 2020, 2020, 8820886. [Google Scholar] [CrossRef]
  28. Yu, B.; Tai, Y.; Gao, R.; Yao, Q.; Li, Z.; Xia, H. The sustainable development of coal mines by new cutting roof technology. R. Soc. Open Sci. 2020, 7, 191913. [Google Scholar] [CrossRef]
  29. Chinese Specifications. National Coal Mine Safety Administration. Regulations of Buildings, Water, Railway and Main Well Lane Leaving Coal Pillar and Press Coal Mining; Coal Industry Press: Beijing, China, 2017; pp. 55–56. Available online: https://www.chinamine-safety.gov.cn/zfxxgk/fdzdgknr/tzgg/201707/t20170703_349044.shtml (accessed on 23 May 2022).
  30. Wilson, A.; Ashwin, D. Research into the determination of pillar size. Min. Eng. 1972, 31, 409–430. [Google Scholar]
  31. Lu, S. Roadways in Pillarless Districts: Occurrence of Mine Pressure and Adaptability. J. China Univ. Min. Technol. 1980, 4, 1–22. [Google Scholar]
  32. Liu, Y. Comprehensive Evaluation of Stability of Residual Coal-pillar after Room-and-pillar Mining. Coal Min. Technol. 2013, 18, 78–80. [Google Scholar]
  33. Pan, J.; Qi, Q.; Mao, D.; Ren, Y. Study on Movement and Stress Evolutionary Process of Impacted Roof with 3DEC. Chin. J. Rock Mech. Eng. 2007, 26, 3546–3552. [Google Scholar]
  34. Mohammad, N.; Reddish, D.; Stace, L. The relation between in situ and laboratory rock properties used in numerical modelling. Int. J. Rock Mech. Min. 1997, 34, 289–297. [Google Scholar] [CrossRef]
  35. Feng, G.; Zhang, A.; Hu, S.; Cheng, J.; Miu, X.; Hao, G.; Han, D.; Guan, S.; Zhao, G. A Methodology for Determining the Methane Flow Space in Abandoned Mine Gobs and Its Application in Methane Drainage. Fuel 2018, 227, 208–217. [Google Scholar] [CrossRef]
  36. Feng, G.; Li, Z.; Hu, S.; Zhang, Y.; Zhang, A.; Gao, Q.; Jiang, H.; Guo, X.; Li, C.; Cui, J. Distribution of Gob Empty Space for Methane Drainage during the Longwall Mining: A Case Study. J. Nat. Gas Sci. Eng. 2018, 60, 112–124. [Google Scholar] [CrossRef]
  37. Lai, X.; Li, J.; Cui, F.; Shan, P. Study on Overlying Strata Movement in Mining Adjacent Working Face of Extra Thick Seam. Saf. Coal Mines 2020, 51, 70–75. [Google Scholar]
  38. Wang, S.; Li, X.; Wang, S. Separation and fracturing in overlying strata disturbed by longwall mining in a mineral deposit seam. Eng. Geol. 2017, 226, 257–266. [Google Scholar] [CrossRef]
  39. Li, S.; Qian, M.; Shi, P. Study on Bed-Separated Fissures of Overlying Stratum and Interstice Permeability in Fully-Mechanized Top Coal Caving. Chin. J. Rock Mech. Eng. 2000, 19, 604–607. [Google Scholar]
  40. Liu, Q.; Lin, B.; Zhou, Y.; Li, Y. Porosity model of the goaf based on overlying strata movement and deformation. Environ. Earth. Sci. 2022, 81, 214. [Google Scholar] [CrossRef]
  41. Zheng, G.; Han, J.; Sang, F.; Gao, T.; Chen, D.; Zhang, Z. Case Study of Gas Drainage Well Location Optimization in Abandoned Coal Mine Based on Reservoir Simulation Model. Energy Explor. Exploit. 2021, 39, 1993–2005. [Google Scholar] [CrossRef]
  42. Qin, W.; Xu, J.; Hu, G. Optimization of Abandoned Gob Methane Drainage through Well Placement Selection. J. Nat. Gas Sci. Eng. 2015, 25, 148–158. [Google Scholar] [CrossRef]
Figure 1. Schematic of the study area location.
Minerals 12 00782 g001
Figure 2. Histogram of certain rock strata in the Longshan Coal Mine.
Minerals 12 00782 g002
Figure 3. Dip model of the adjacent working face (30 m section coal pillar as an example).
Minerals 12 00782 g003
Figure 4. Strike model of the adjacent working face.
Minerals 12 00782 g004
Figure 5. Subsidence conditions of overlying strata after complete excavation of the 11061 working face.
Minerals 12 00782 g005
Figure 6. Subsidence conditions of overlying strata after complete excavation of the strike model.
Minerals 12 00782 g006
Figure 7. Subsidence conditions of overlying strata in the GAWF for different section coal pillar widths. (a) 10 m. (b) 15 m. (c) 20 m. (d) 25 m. (e) 30 m. (f) 40 m. (g) 50 m. (h) 60 m.
Minerals 12 00782 g007
Figure 8. Schematic of the principle of converting the overlying strata 2D subsidence value to the 3D subsidence value in the GAWF.
Minerals 12 00782 g008
Figure 9. Subsidence values of overlying strata in the dip model of the GFST.
Minerals 12 00782 g009
Figure 10. Subsidence values of overlying strata in the dip model of the GFMT.
Minerals 12 00782 g010
Figure 11. Subsidence values of overlying strata in the dip model of the GFLT.
Minerals 12 00782 g011
Figure 12. Subsidence values of overlying strata after the corrected strike model of GAWF. (a) Goaf of the 11061 working face. (b) Goaf of the 11081 working face.
Minerals 12 00782 g012
Figure 13. 3D subsidence value cloud map of overlying strata in GAWF. (a) GFST, (b) GFMT, and (c) GFLT.
Minerals 12 00782 g013
Figure 14. Porosity distribution condition of overlying strata in the GFST. (a) No. 16 rock stratum. (b) No. 15 rock stratum. (c) No. 14 rock stratum. (d) No. 13 rock stratum. (e) No. 12 rock stratum. (f) No. 11 rock stratum. (g) No. 10 rock stratum. (h) No. 9 rock stratum.
Minerals 12 00782 g014
Figure 15. Porosity distribution condition of overlying strata in GFMT. (a) No. 16 rock stratum. (b) No. 15 rock stratum. (c) No. 14 rock stratum. (d) No. 13 rock stratum. (e) No. 12 rock stratum. (f) No. 11 rock stratum. (g) No. 10 rock stratum. (h) No. 9 rock stratum.
Minerals 12 00782 g015
Figure 16. Porosity distribution condition of overlying strata in GFLT. (a) No. 16 rock stratum. (b) No. 15 rock stratum. (c) No. 14 rock stratum. (d) No. 13 rock stratum. (e) No. 12 rock stratum. (f) No. 11 rock stratum. (g) No. 10 rock stratum. (h) No. 9 rock stratum.
Minerals 12 00782 g016
Figure 17. Average porosity value of overlying strata in the ASCP.
Minerals 12 00782 g017
Table 1. Calculation parameters for the width of the section coal pillar yield zone.
Parameter Namef φ λKγHcR
Value0.12252.462.524,5006521.910
Table 2. Rock mass mechanical parameters.
LithologyDensity
/(kg·m−3)
Bulk
Modulus
/(GPa)
Shear Modulus
/(GPa)
Tensile Strength
/(MPa)
Cohesion
/(MPa)
Internal
Friction Angle
/(°)
Mudstone26902.411.050.428.5023.0
Medium sandstone26801.891.032.501.9032.0
Sandy mudstone25901.331.002.0010.5525.0
Siltstone27000.900.731.801.7021.0
Fine sandstone27504.813.313.704.3027.0
Coal14601.230.671.001.9032.0
Table 3. Mechanical parameters of joints.
Joint TypeNormal
Stiffness
/(GPa)
Shear
Stiffness
/(GPa)
Tensile Strength
/(MPa)
Cohesion
/(MPa)
Internal
Friction Angle
/(°)
Mudstone0.730.280.304.0022.0
Medium sandstone1.630.640.701.0025.0
Sandy mudstone0.640.271.205.5021.0
Siltstone0.780.330.600.9015.0
Fine sandstone3.671.510.602.1023.0
Coal0.370.150.151.0025.0
Table 4. Initial porosity of certain rock strata.
LithologyMudstoneMedium SandstoneSandy
Mudstone
Fine
Sandstone
Coal
Porosity0.050.020.040.030.05
Publisher’s Note: MDPI stays neutral with regard to jurisdictional claims in published maps and institutional affiliations.

