Article

Mining Residues Characterization and Sentinel-2A Mapping for the Valorization and Efficient Resource Use by Multidisciplinary Strategy

by
Daniela Guglietta
1,*,
Aida Maria Conte
1,
Matteo Paciucci
1,
Daniele Passeri
2,
Francesca Trapasso
1 and
Rosamaria Salvatori
3
1
Institute of Environmental Geology and Geoengineering, National Research Council of Italy (CNR IGAG), Research Area of Rome 1, 00010 Rome, Italy
2
Geotechnical and Environmental Engineering Group, Corso d’Italia 97, 00198 Rome, Italy
3
Institute of Polar Sciences, National Research Council of Italy (CNR ISP), Research Area of Rome 1, 00010 Rome, Italy
*
Author to whom correspondence should be addressed.
Minerals 2022, 12(5), 617; https://doi.org/10.3390/min12050617
Submission received: 23 March 2022 / Revised: 3 May 2022 / Accepted: 11 May 2022 / Published: 12 May 2022

Abstract

:
Raw materials are essential for all sectors of the economy as well as for all innovative technologies. Currently, industry is largely dependent on imports and consumption of these materials, and in the future, following the global energy transition, this trend will drastically increase. For this reason, it is necessary to develop new strategies to meet the supply–demand of raw materials by strategic sectors and technologies. To this end, mining residues are turning into viable raw materials sources as they represent reliable access to valuable resource supply. This work aims to validate a methodology providing more in-depth quali-quantitative information about 100 samples of mining residues collected in the Joda West mine (India) by multidisciplinary strategy in order to valorize and promote efficient resource use. In this paper, physicochemical and mineralogical characterization and hyperspectral signatures have been integrated with satellite Sentinel-2A data. In particular, the X-ray powder diffraction (XRPD), X-ray fluorescence (XRF), and scanning electron microscopy with energy dispersive spectroscopy (SEM-EDS) analyses indicated the presence of mining residues samples rich in raw materials that were possible to spectrally distinguish in order to use them as input for the object-oriented classification of a satellite image. The satellite resulting map highlighted four different classes of mining residues with mean concentrations of around 36% for hematite, 23.5% for quartz, 9% for kaolinite and 5% for pyrolusite. These results represent the possibility of transforming an environmental problem (mining residues) into a resource potentially exploitable by industries knowing their composition and position in the study area. Moreover, by doing so, it will be possible to ensure sustainable consumption of the raw materials and to build resilient economies and societies, minimizing environmental degradation.

1. Introduction

Waste production and management traditionally follow a linear economy approach (take-make-dispose), and nowadays, the challenge is represented by the possibility of applying a circular economy strategy to transform problems into opportunities as well as to change the negative perception of society.
During all mining operations (from extraction to processing and disposal), different kinds of waste are generated (e.g., waste rock, slags, overburden, stockpiles of low-grade ore), altering the landscape and causing environmental degradation, but on the other hand, mining has been important in economic development and technological progress of many countries in the world.
Nowadays, it is fundamental to foster research and innovation in order to develop new technologies to discover new mines, boost the life cycle of geomaterials using them as a secondary resource and minimize the environmental footprint due to mining activities [1]. Raw materials are essential to the economy and industries, but the linear model (take-use-throwaway approach) used to date is not sustainable and circular thinking is becoming increasingly important [2]. To achieve circular thinking involves improving the existing product design and business models, treating waste as a resource, extending the lifetime of products, changing the behaviors of consumers, developing new standards and educating new generations about the circular model [3]. New strategies for implementing a resource-efficient and competitive economy that transforms environmental problems into opportunities are strongly encouraged by the United Nations through the Sustainable Development Goals (SDGs) [4].
To date, industries need to be resilient in relation to raw materials (RMs); in order to achieve this objective, they have to diversify the supply chain of primary and secondary sources, reduce dependence on imports and use the resources in a circular and sustainable manner [5]. To overcome these challenges, it is fundamental to strengthen the knowledge, develop robust evidence, plan sustainable supply and circular use of resources and integrate incomplete information with new data on the amount of RMs contained in products or waste potentially available for recovery or recycling [5]. To this end, it is fundamental to develop actions to map the potential supply of raw materials from stocks and wastes and identify a viable recovery approach, especially in those areas that have a long tradition of mining and extractive activities and where it could develop strategies to source critical raw materials (CRMs).
In recent years, abandoned mining areas, historical dumps and tailings are attracting scientific interest due to the increasing demand for RMs to sustain the growing digital and green society. To this end, mining residues are turning into viable RM sources as they represent reliable access to a valuable resource supply.
Several factors come into play, such as concentration, mineralogy, commercial availability, economic viability and market demands, to recover RMs from mining waste [6].
The state-of-the-art for mining residue management includes the characterization, remediation and reuse in different geoengineering applications [7], and at the same time, it proposes new methods such as remote sensing maps and hyperspectral instruments to determine the extent of residues and environmental pollution [8,9].
Since emerging technologies and society’s wellbeing depend on an ever-increasing number of raw materials (RMs), the transition toward a society with a “close to zero waste production” attitude has not only an environmental rationale but also represents a key to competitiveness.
The waste is often stored in the proximity of the mine area or used for the backfilling of mined-out areas. These disposal sites are new environments that have been superimposed on existing ones, and they are represented by bare surfaces that accumulate materials with different physicochemical characteristics. These sites with abandoned mining waste can be detectable on remotely sensed images based on their surface characteristics such as roughness and presence/absence of vegetation that, over the years, could colonize these materials.
Moreover, remote sensing images can provide information about spectral characteristics of waste generated during all phases of mining activities (from extraction to processing and disposal) in order to delineate the mineral of interest. In addition, in recent years, the possibility to use free access data, such as Sentinel-2A images (collected by the ESA Copernicus Satellite), with sufficient area coverage and continuity of data in time made remote sensing an even more promising and valuable tool for mining residue mapping [10,11]. Since the simultaneous availability of remote sensing images and mineralogical/geochemical data of materials and rocks occur at the Earth’s surface is difficult, the possibility of combining and converting important data such as chemical, physical, spectral characteristics and geolocalization of mine residues into smart data (i.e., site mapping and classification based on exploitable RMs) can provide useful information for their proper valorization.
The primary aim of this study is the characterization and mapping of mining residues for further valorization and the efficient resource use by multidisciplinary strategy integrating physical, mineralogical, chemical and spectral data and remote sensing technology in a context of a circular economy. In particular, the proposed multidisciplinary strategy can be summarized as follows:
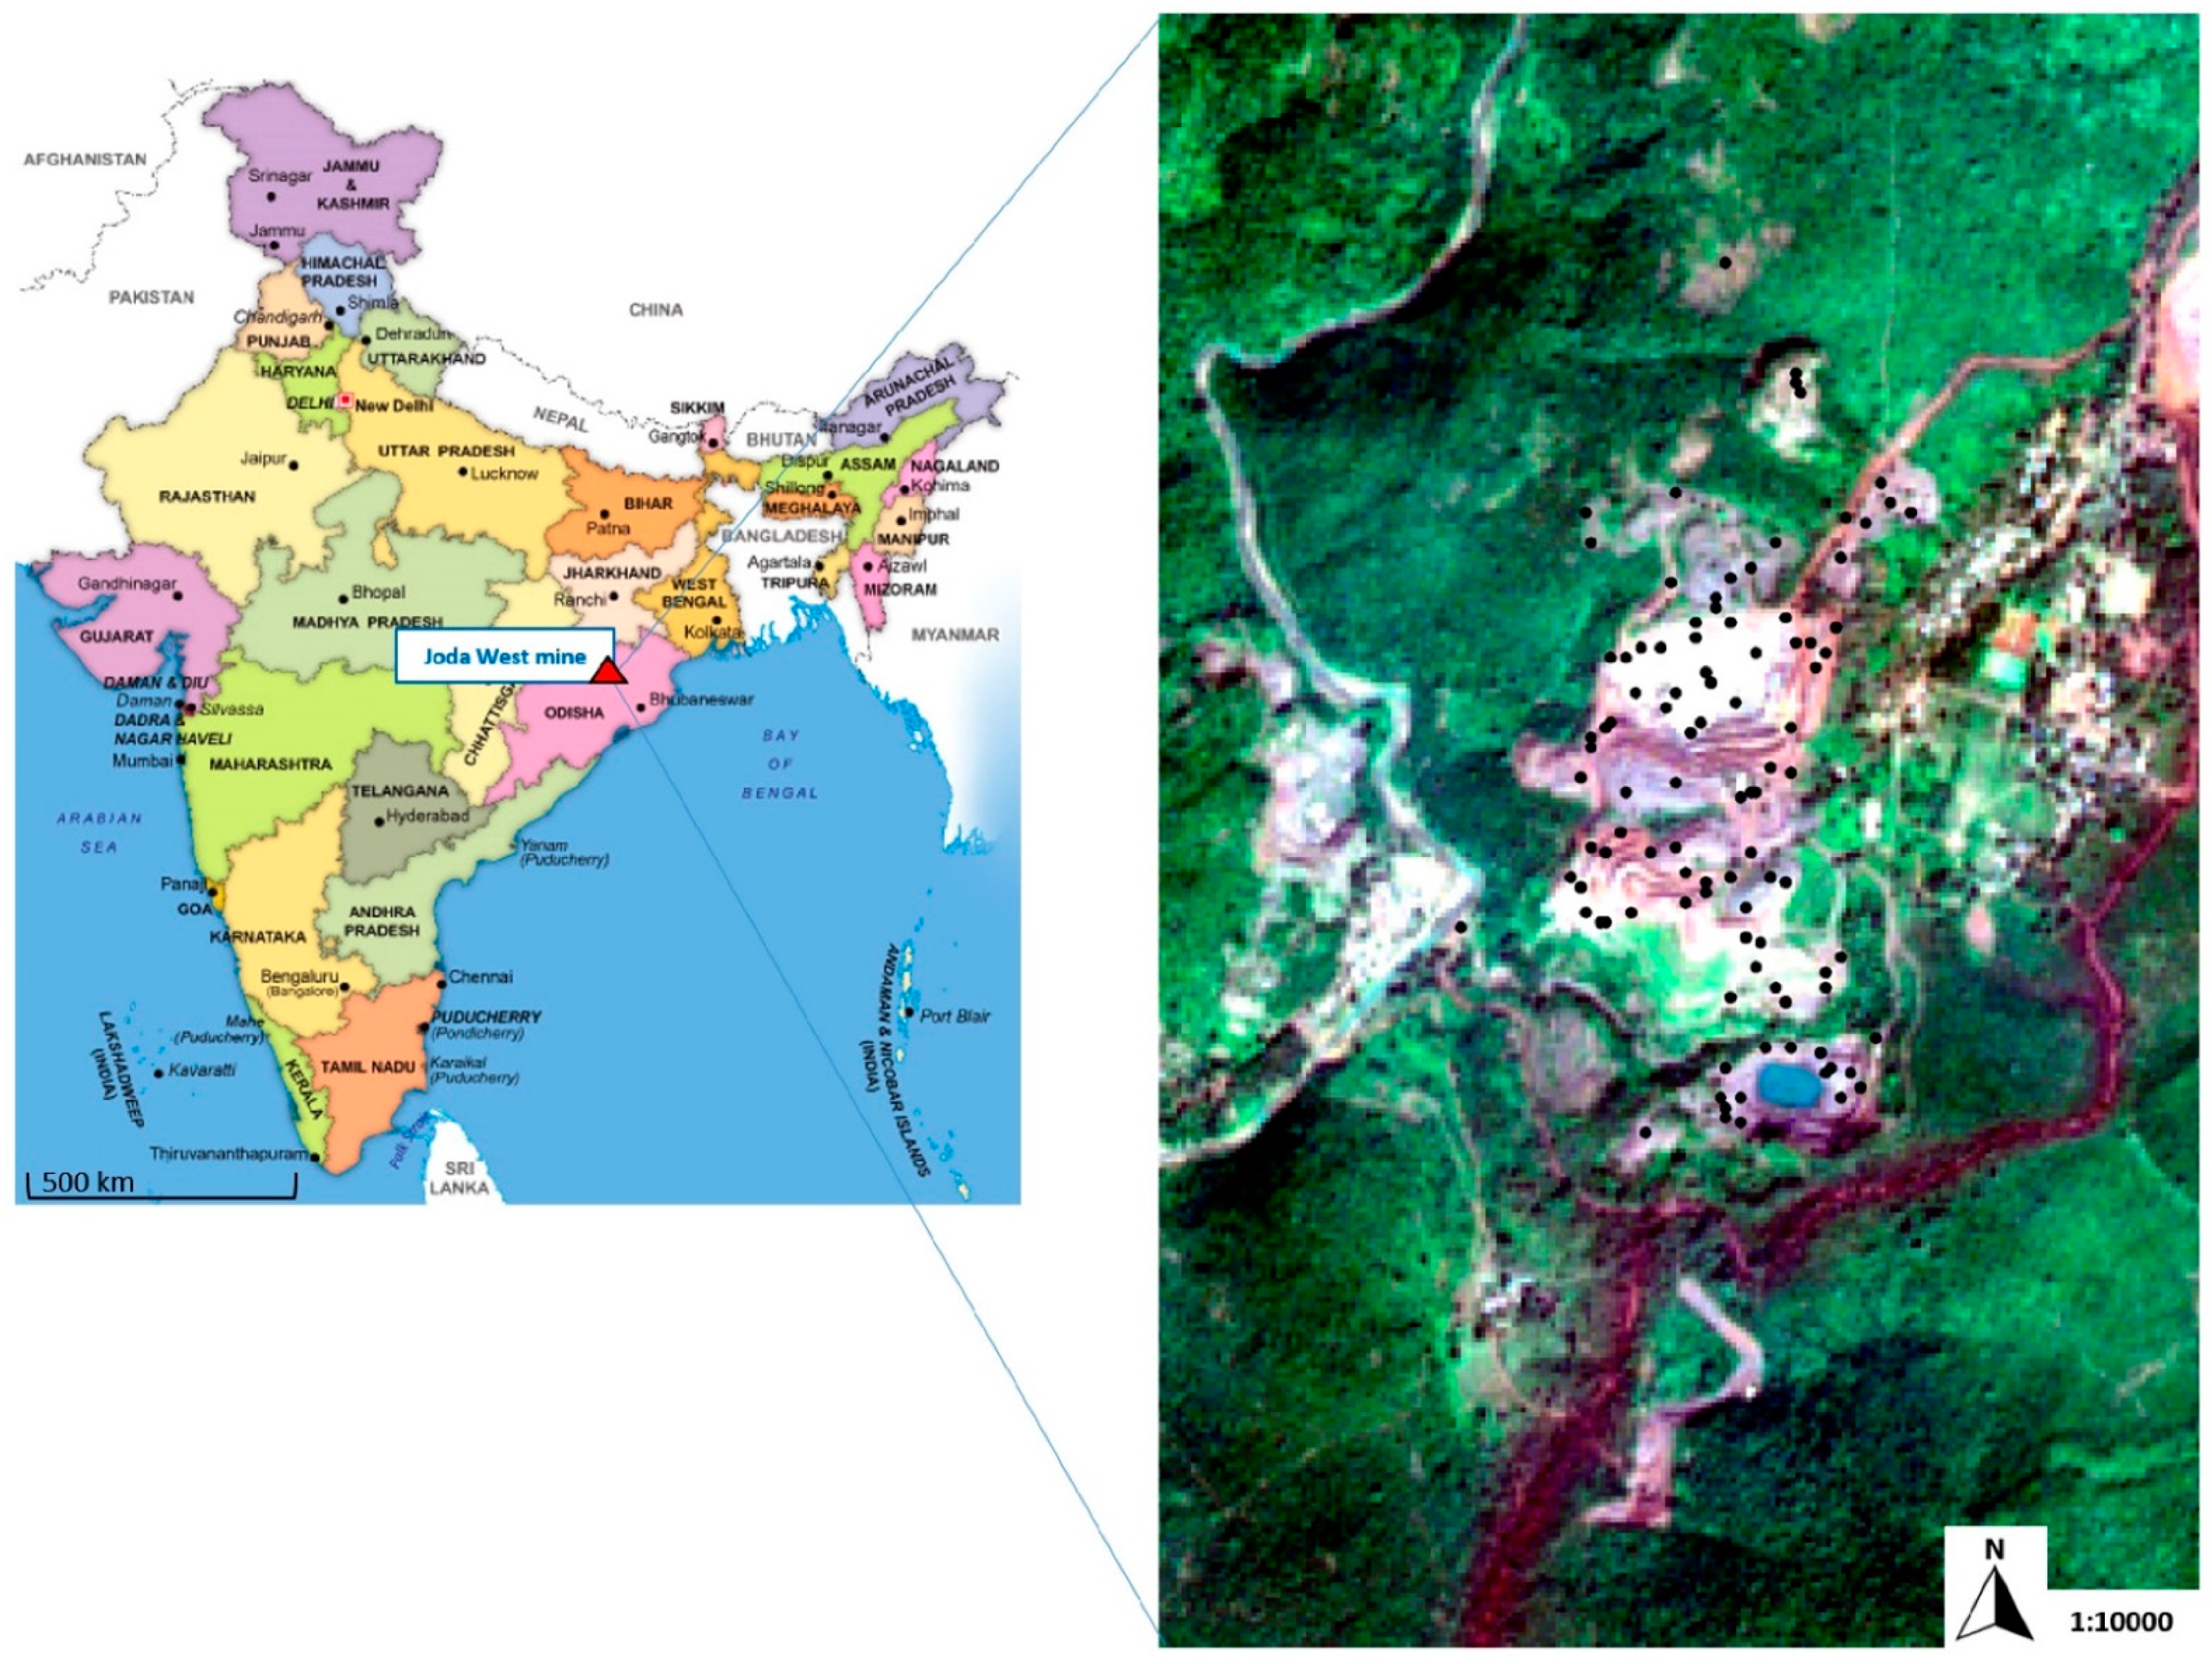
Collection of samples from the mine area for laboratory analysis;
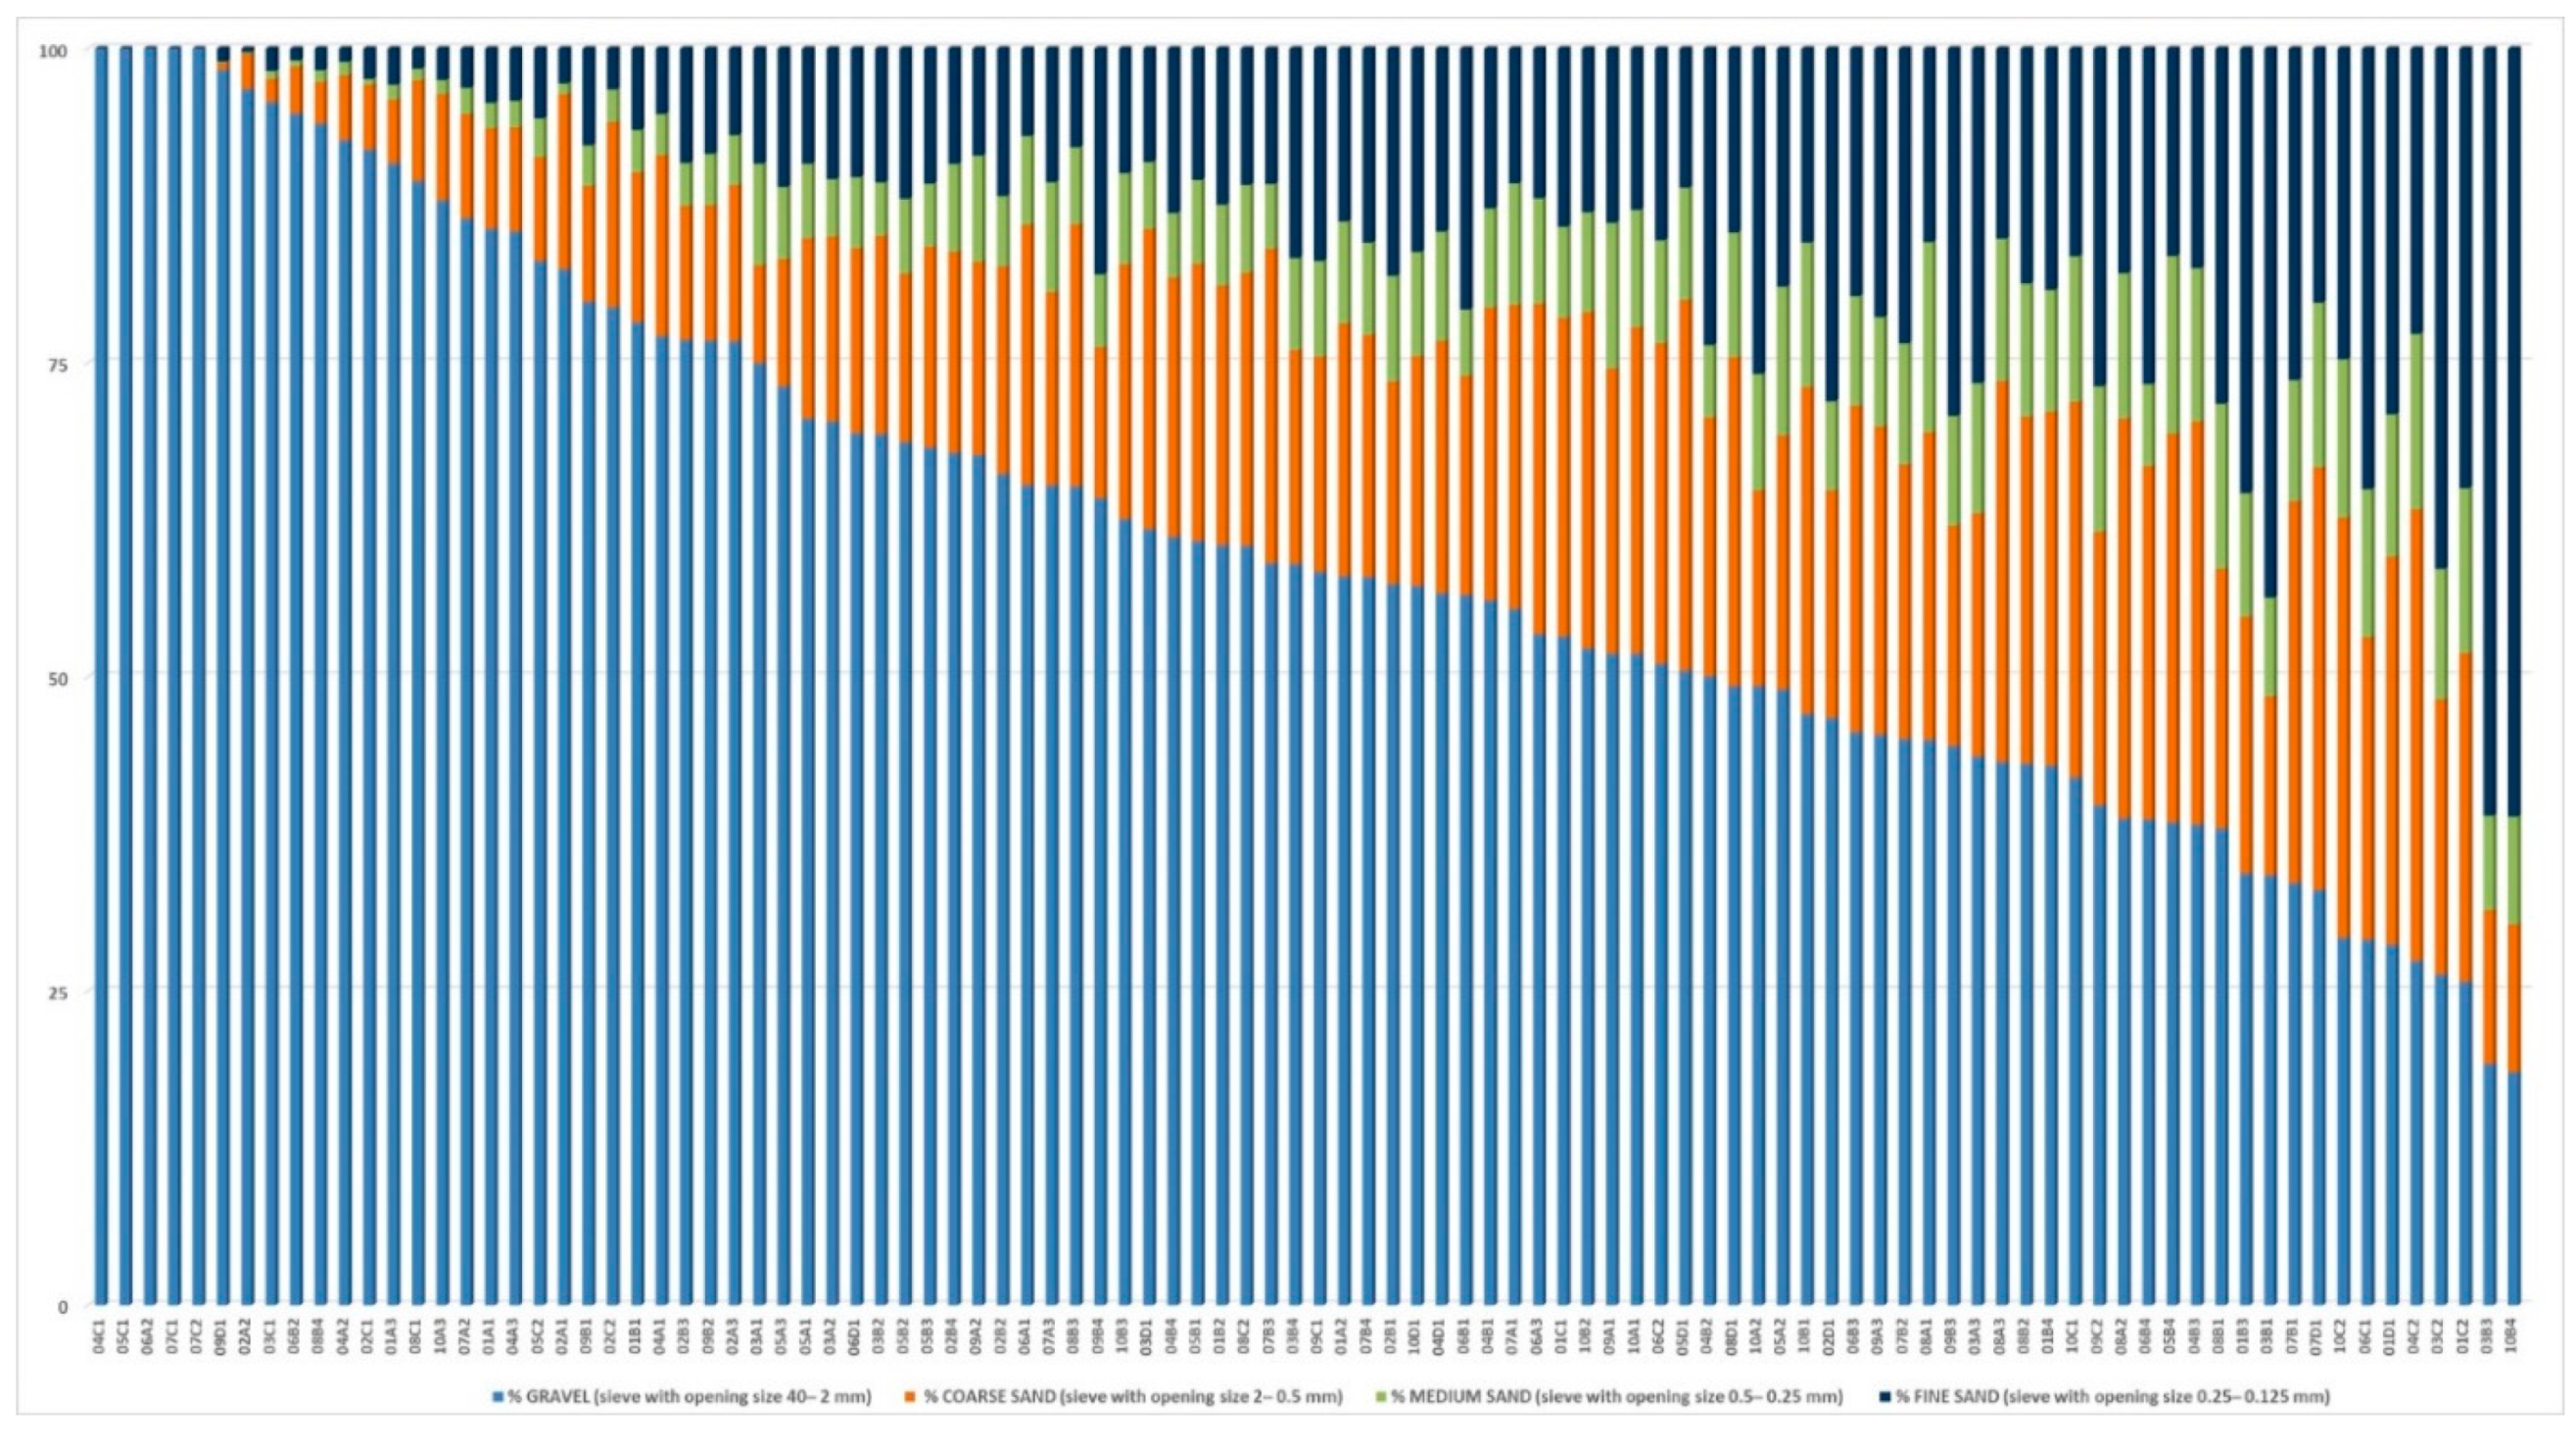
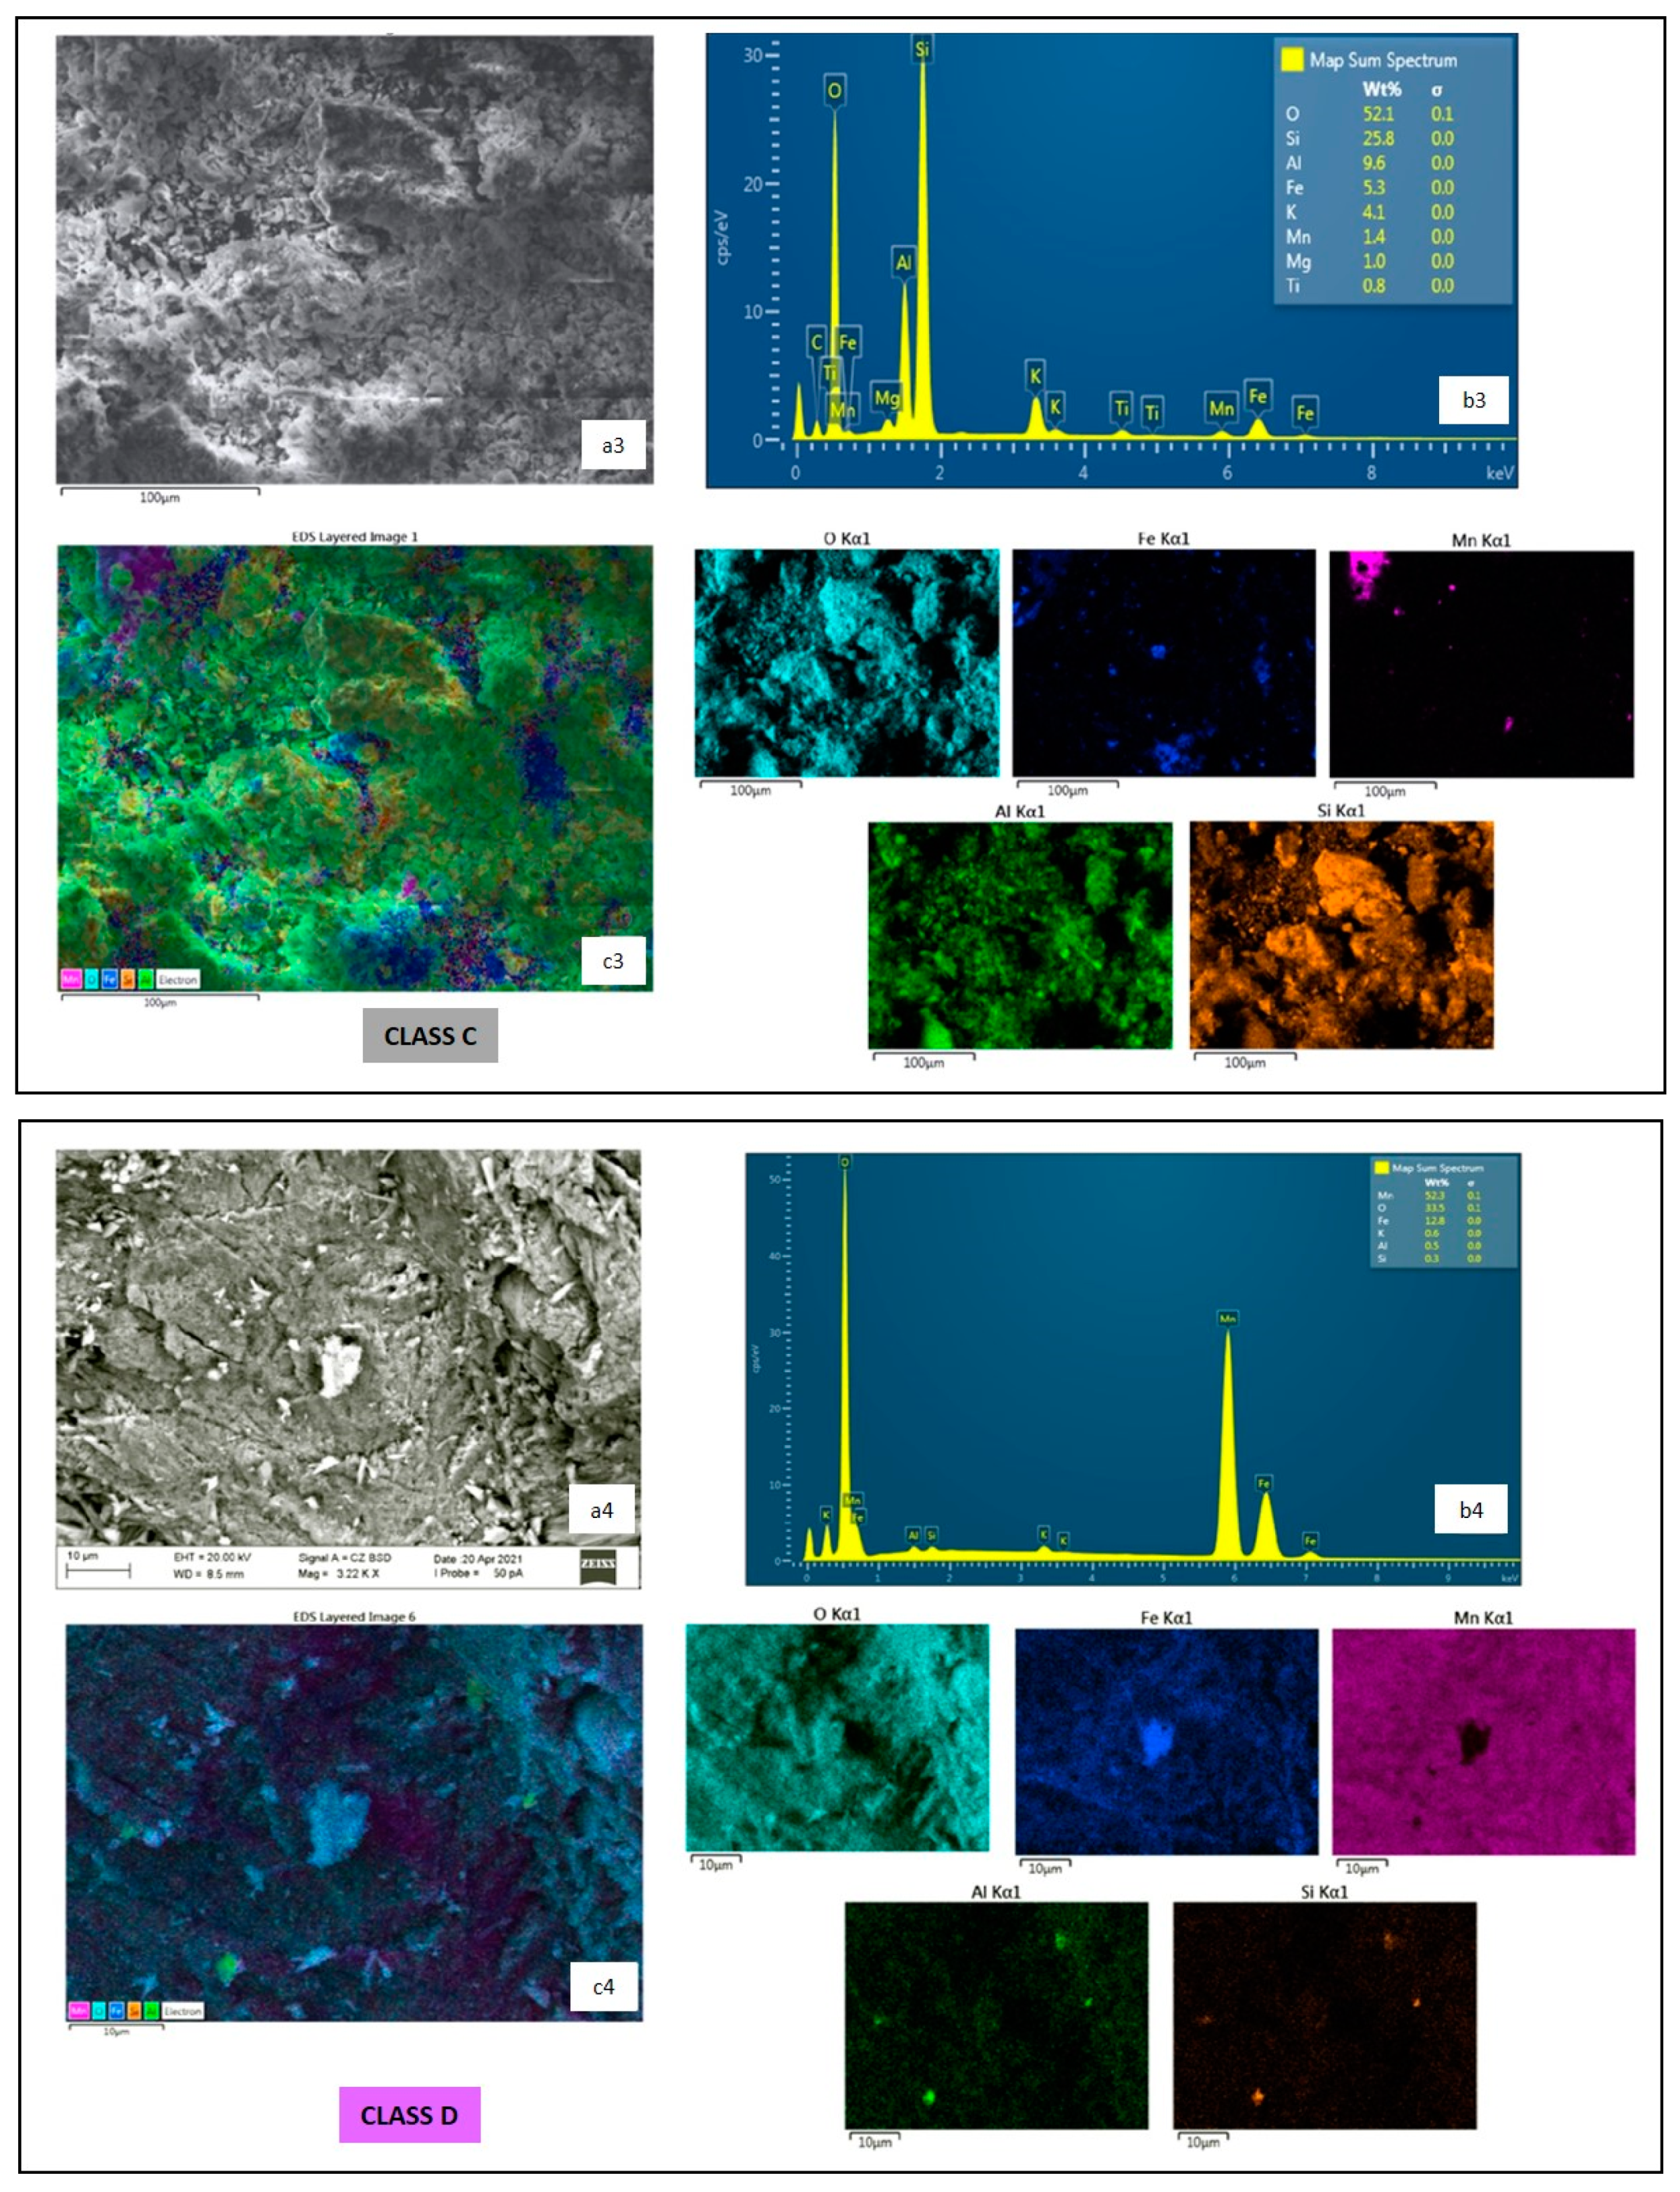
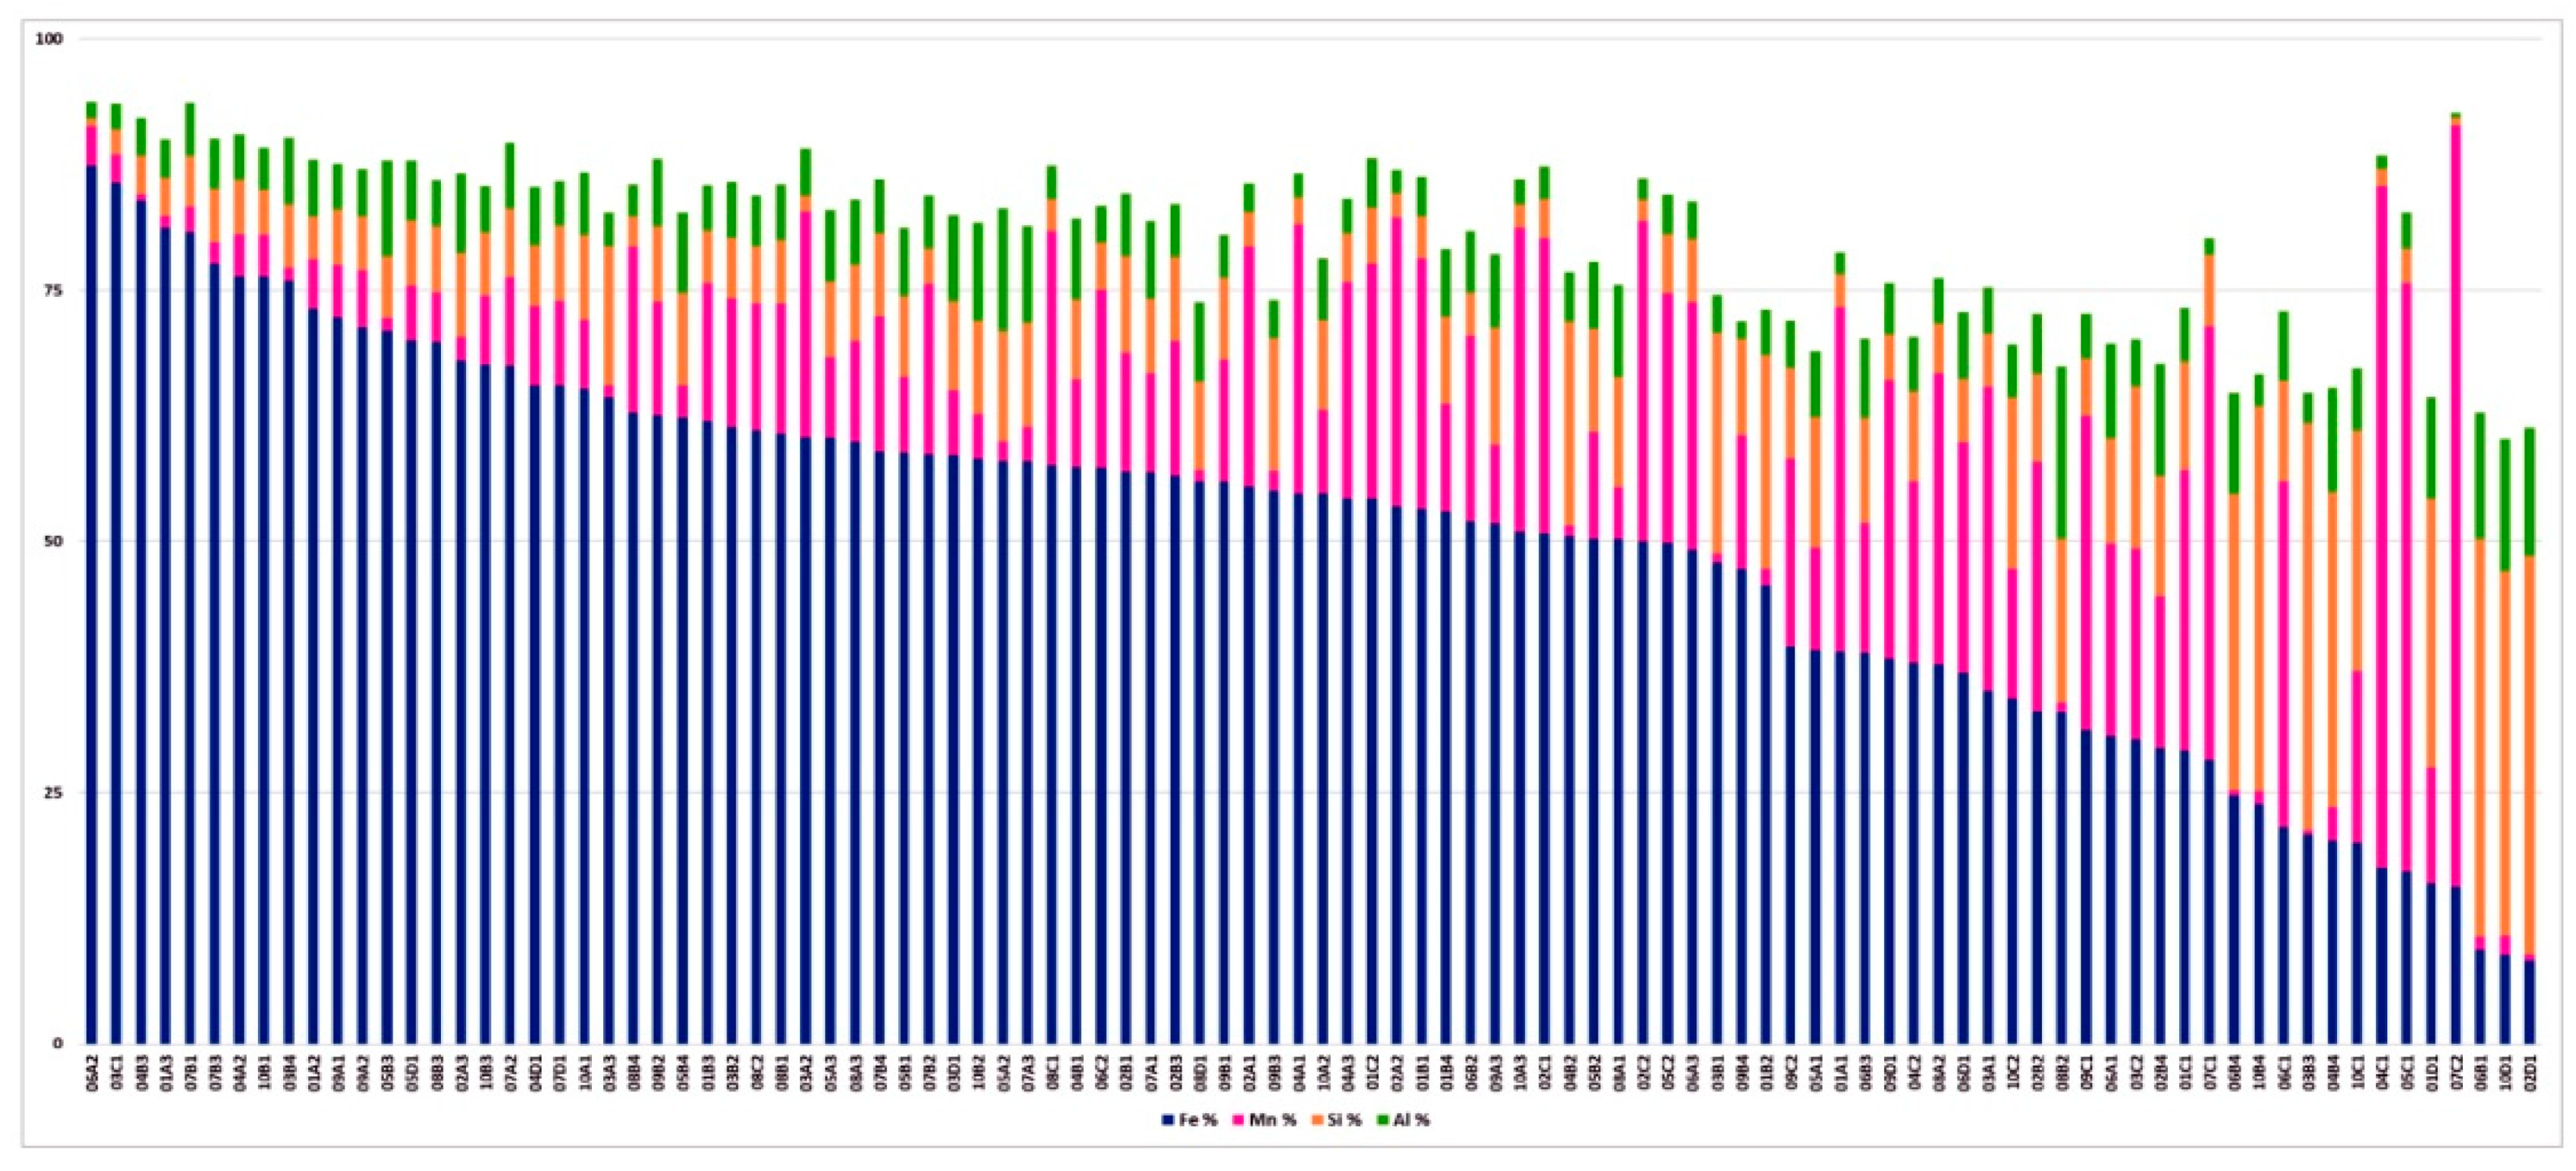
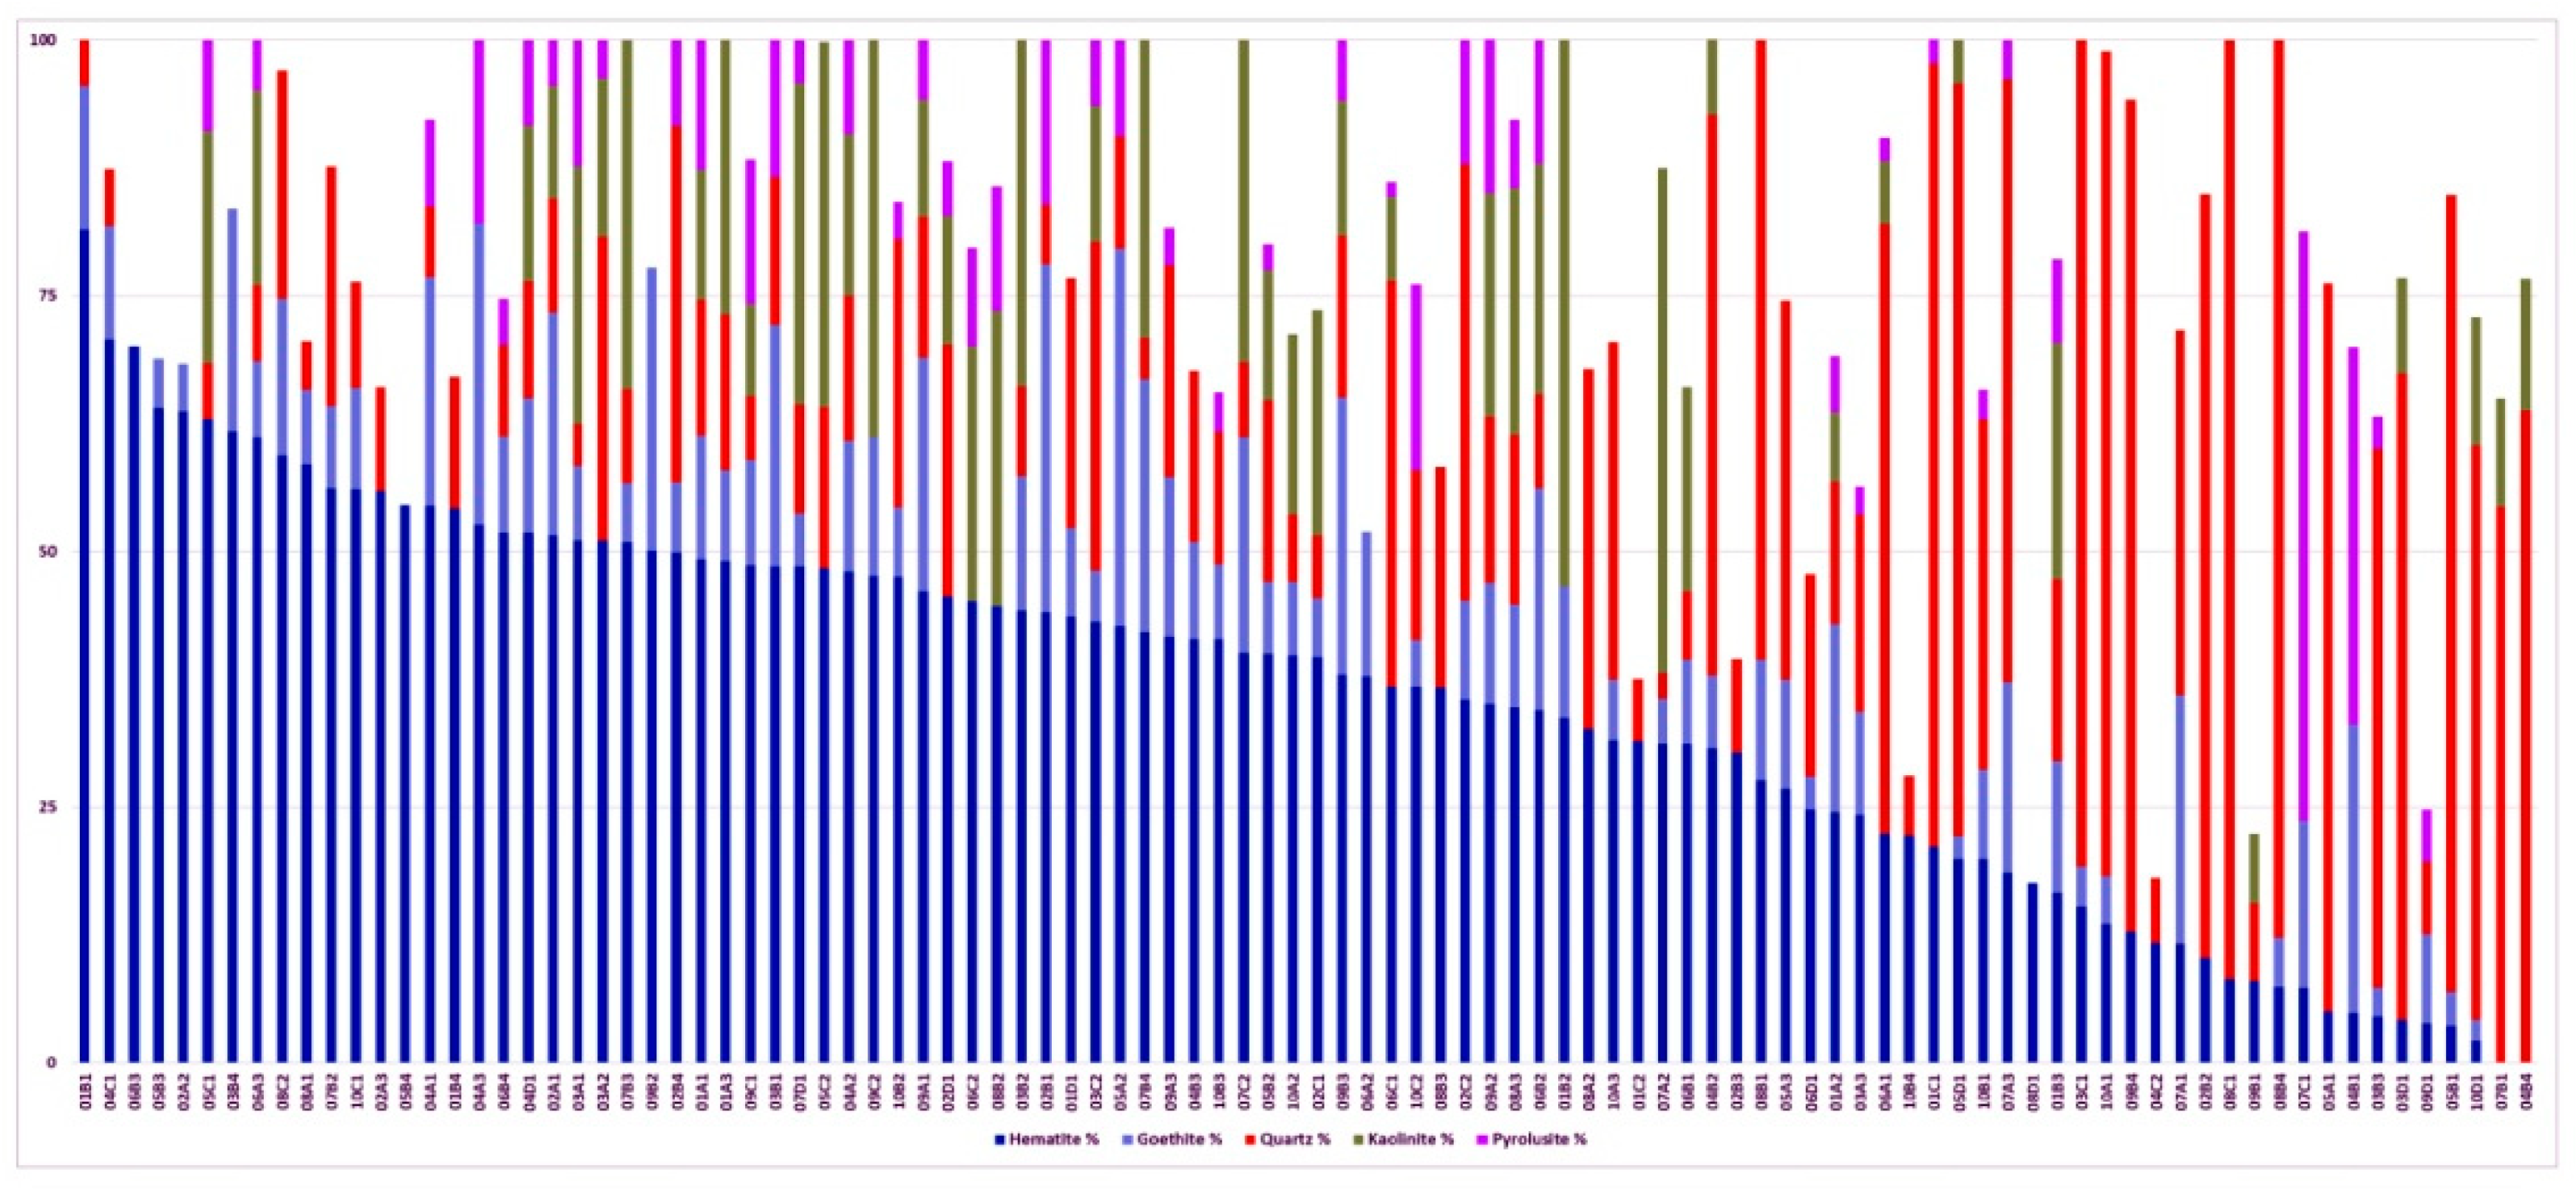
Characterization of mining residues by XRD, XRF and SEM-EDS in order to individuate the RMs of economic and strategic importance;
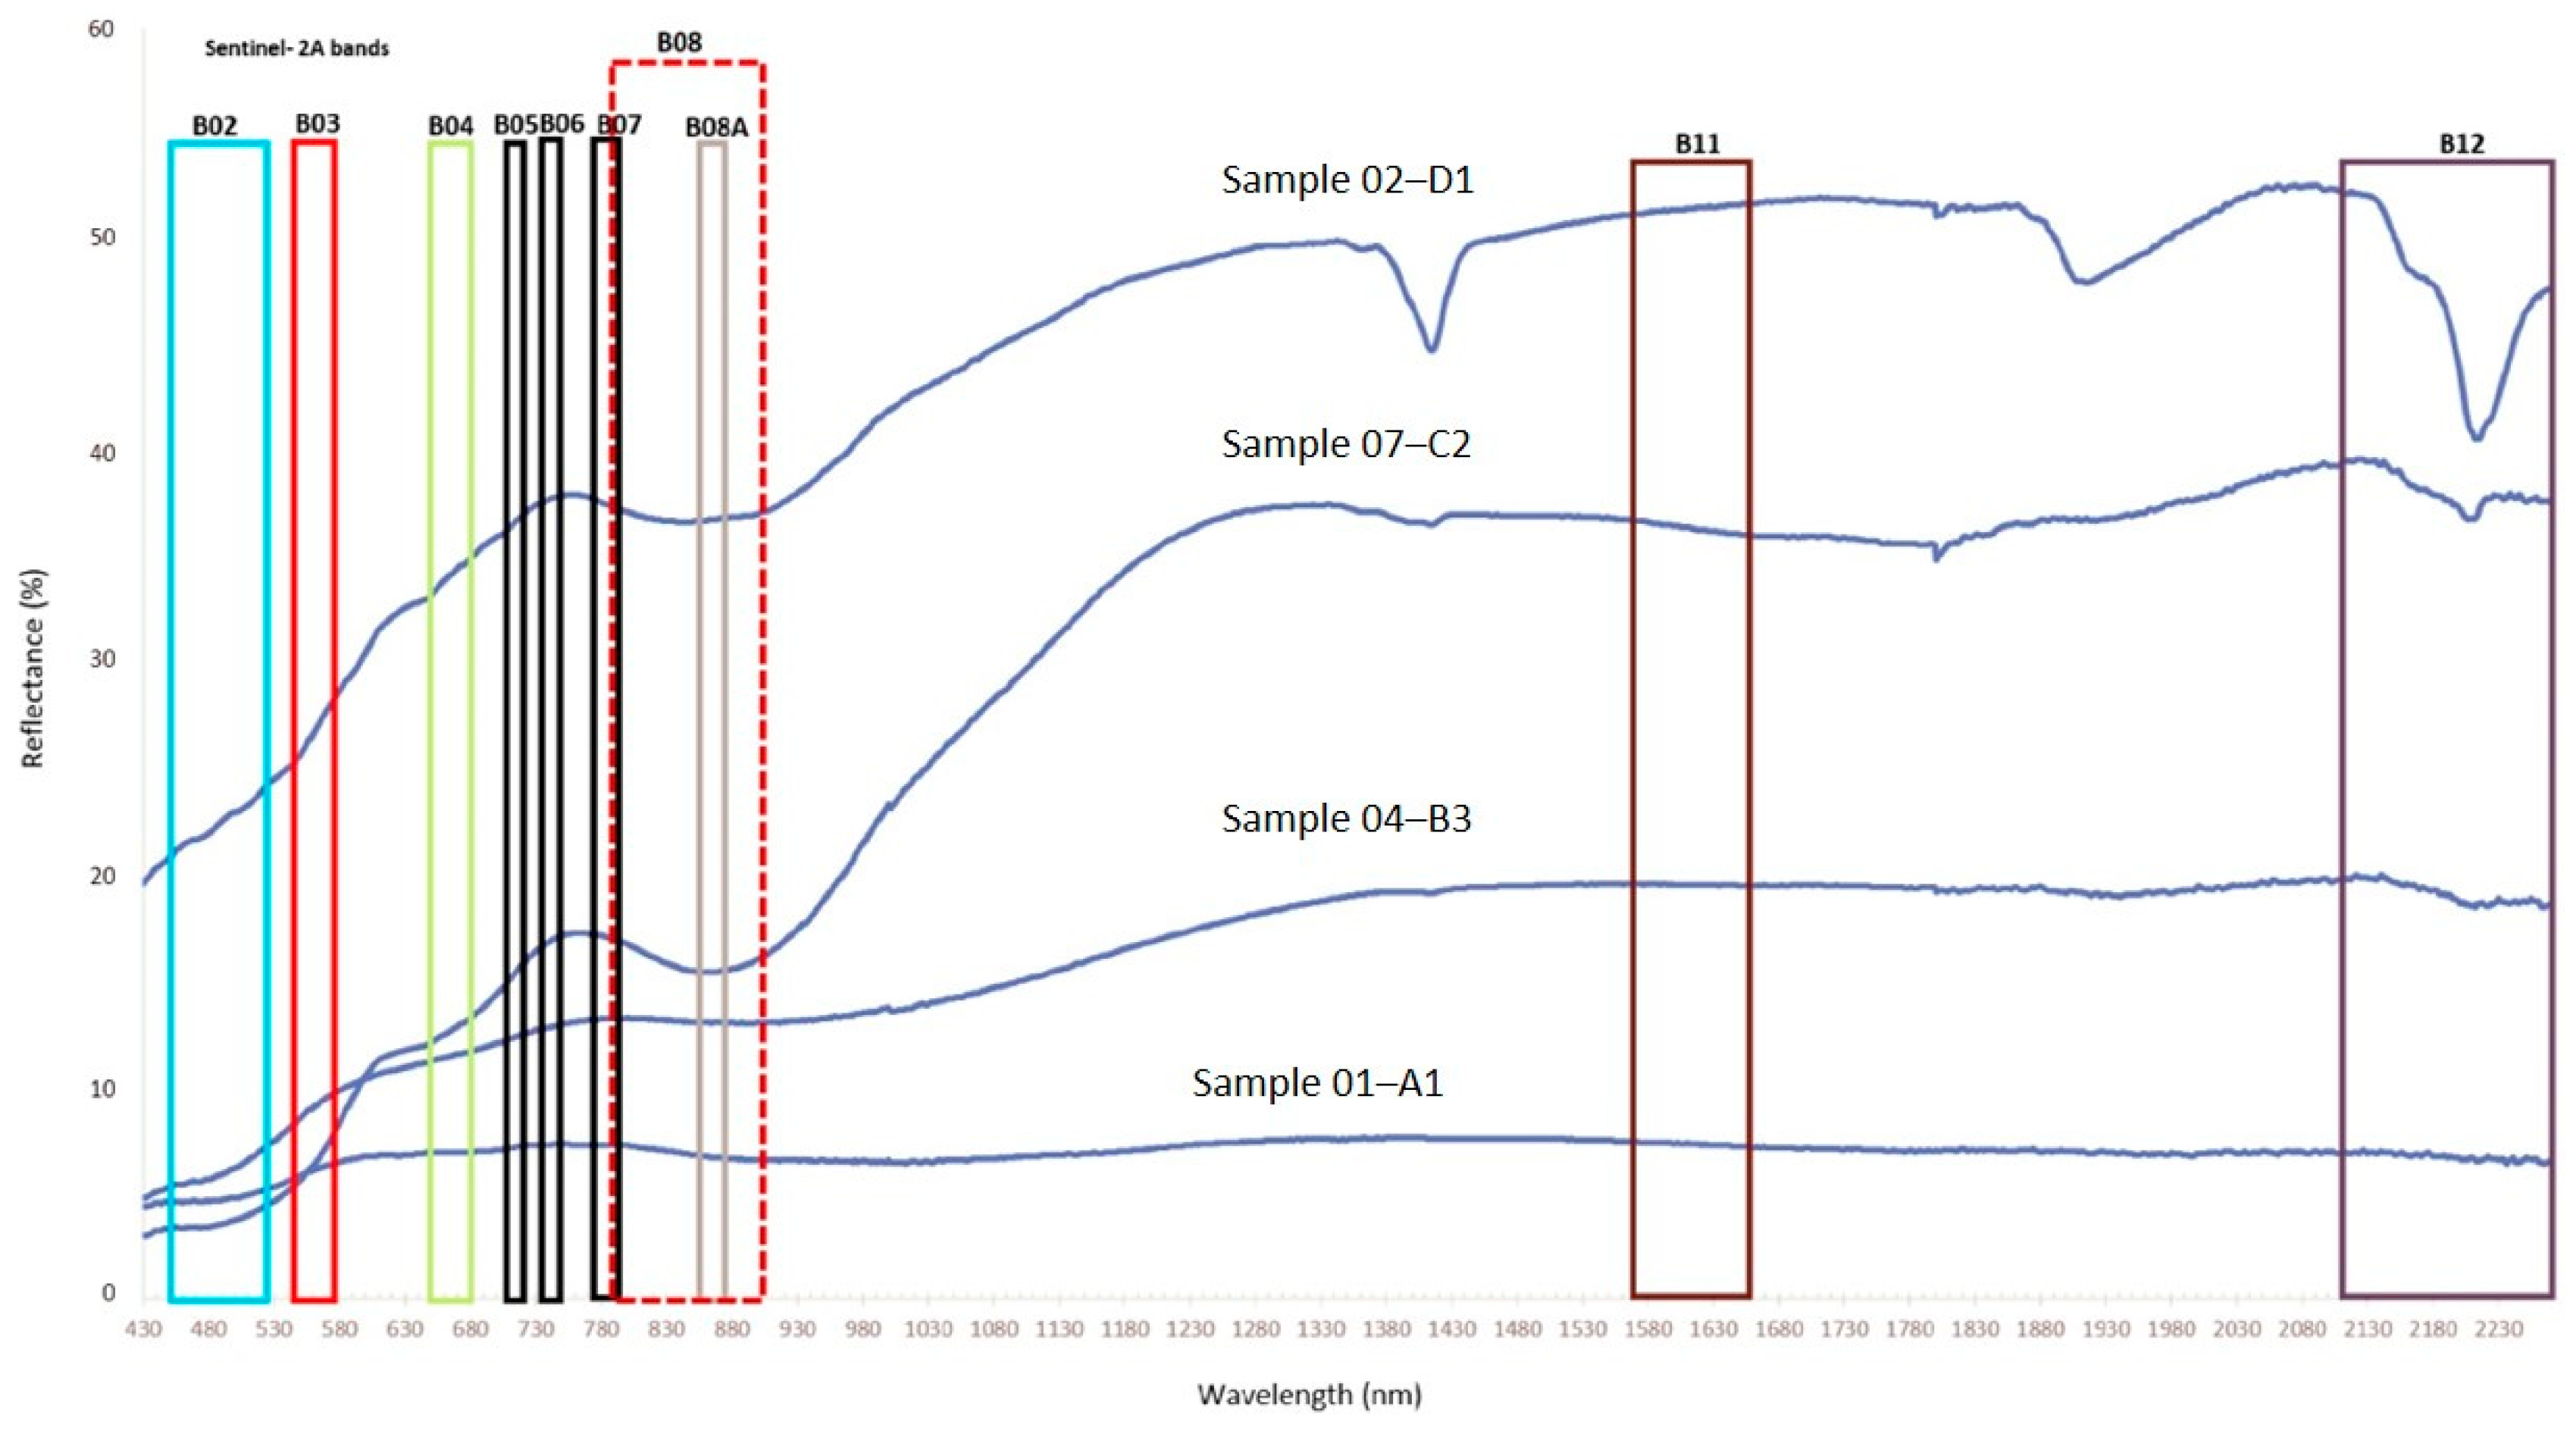
Acquisition of spectral signatures by ASD (analytical spectral device) spectroradiometer in order to associate each spectral feature to characterized mining residue sample (and create the spectral library of mining residues);
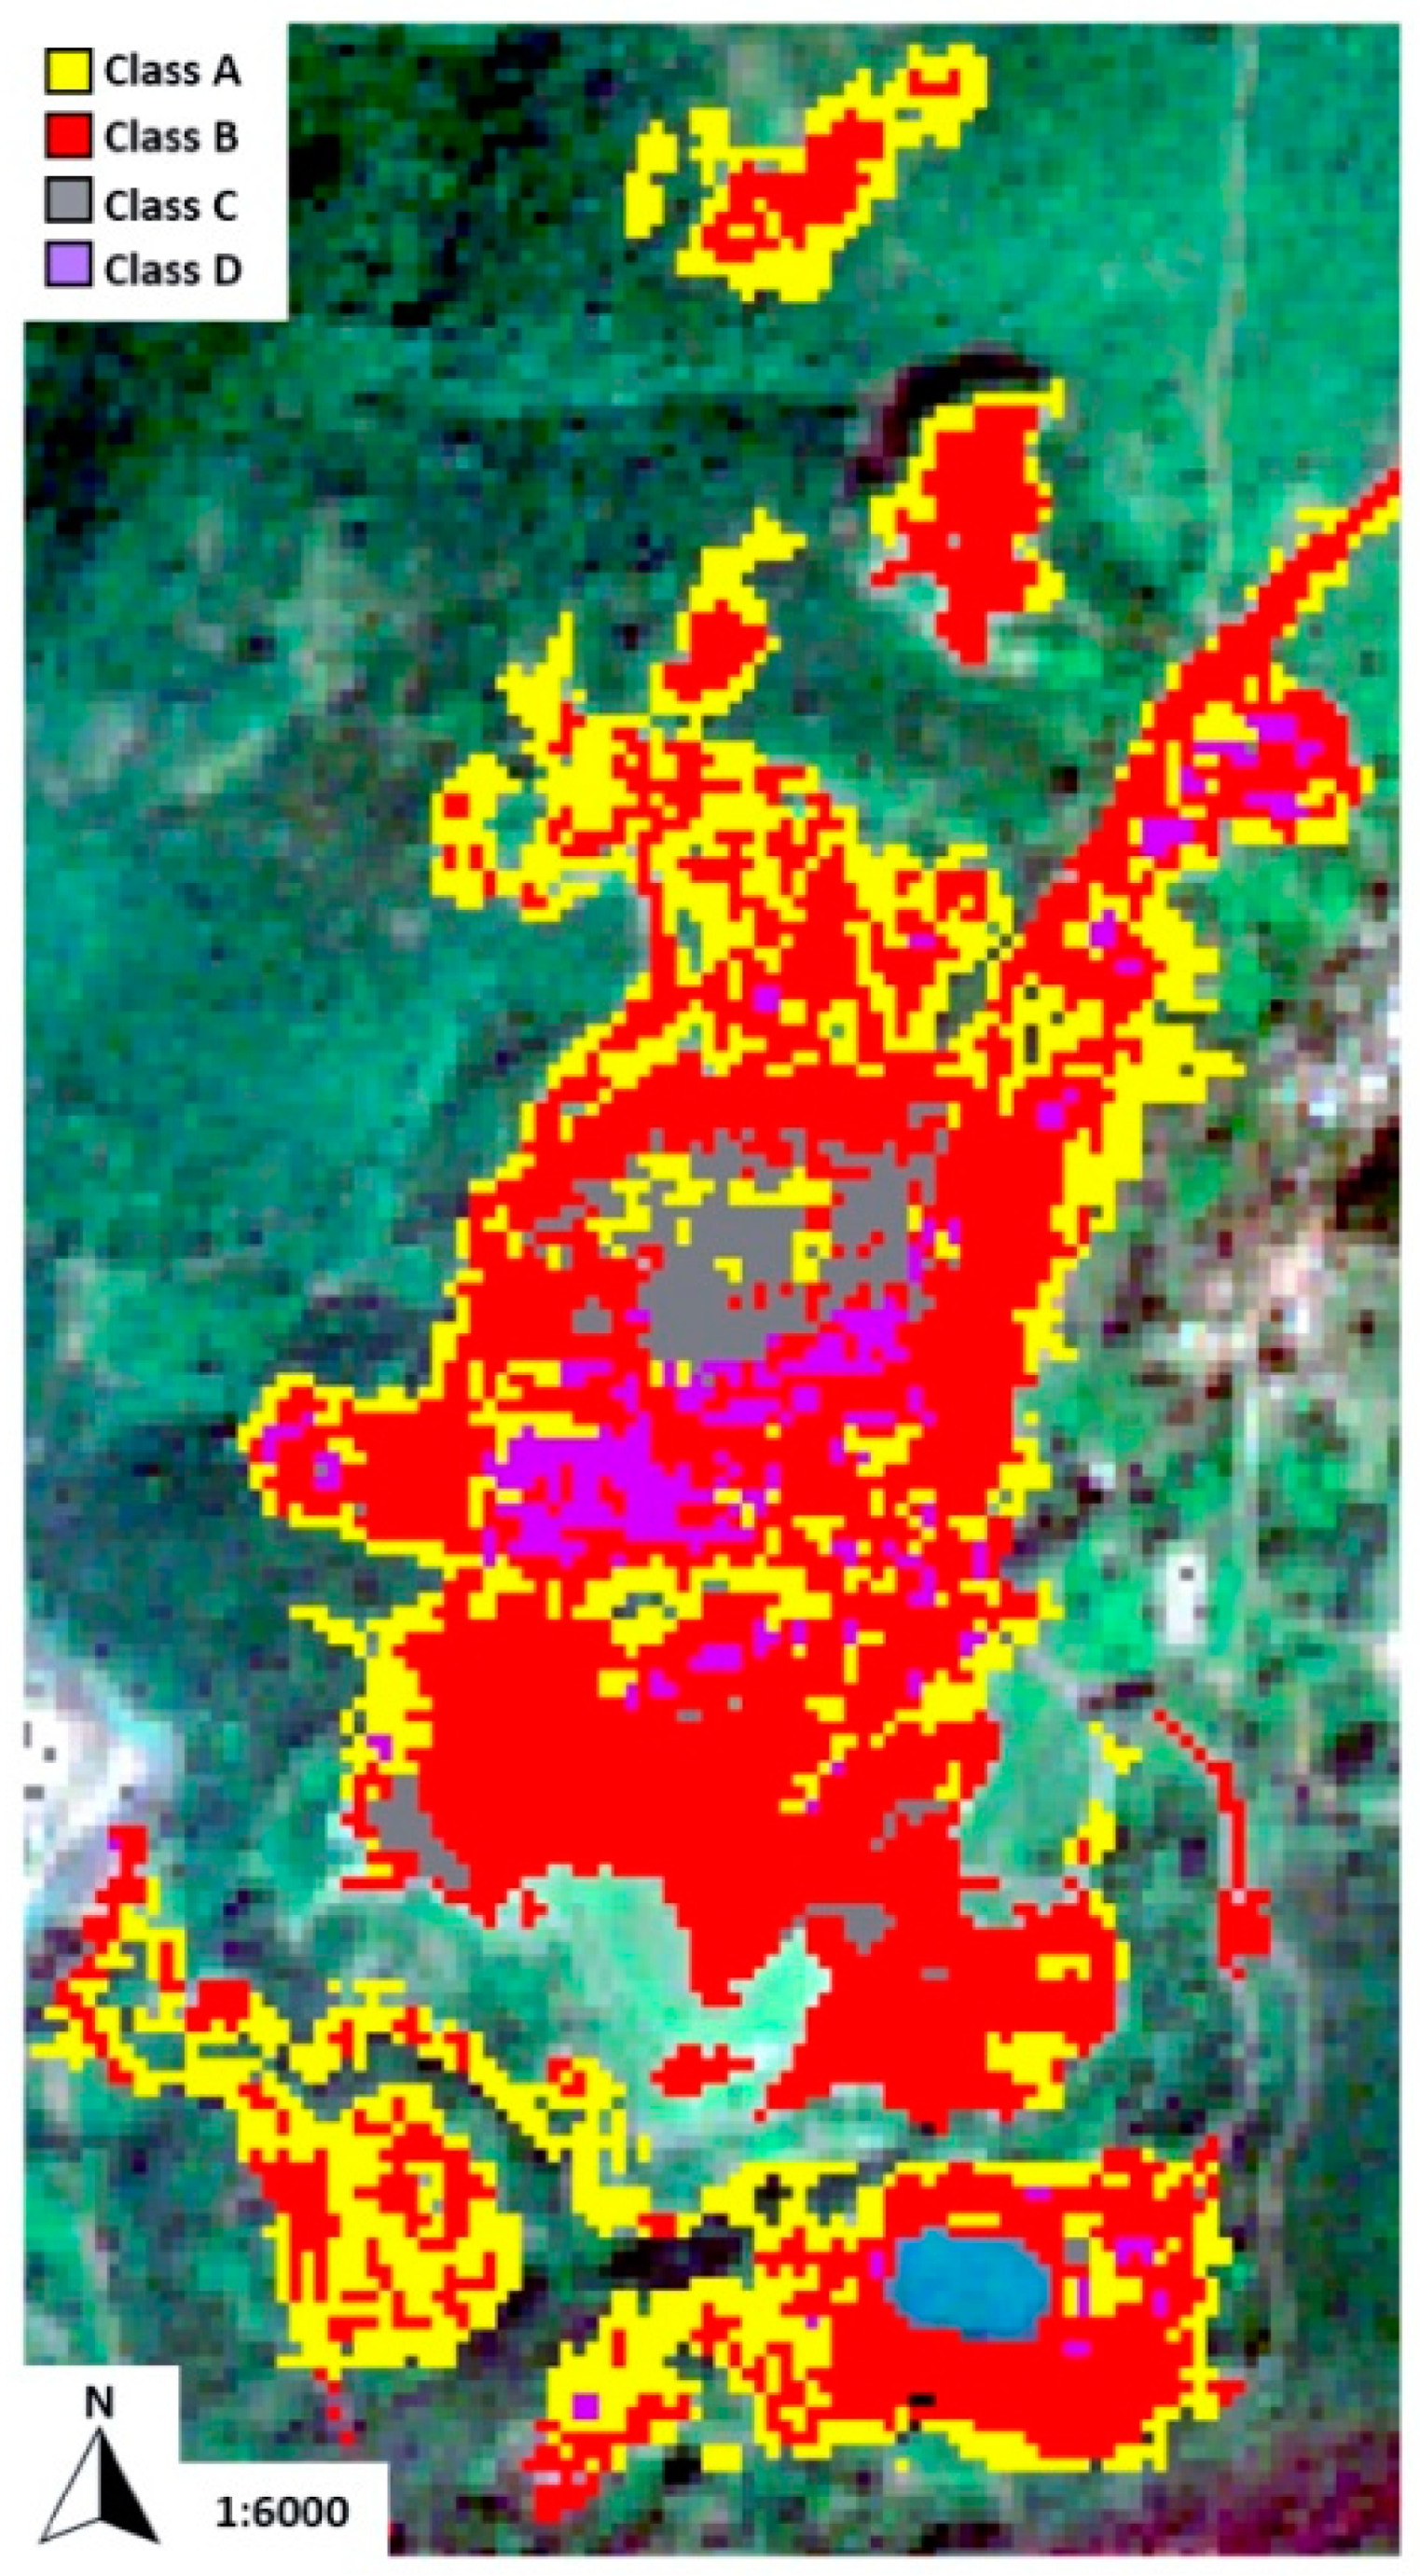
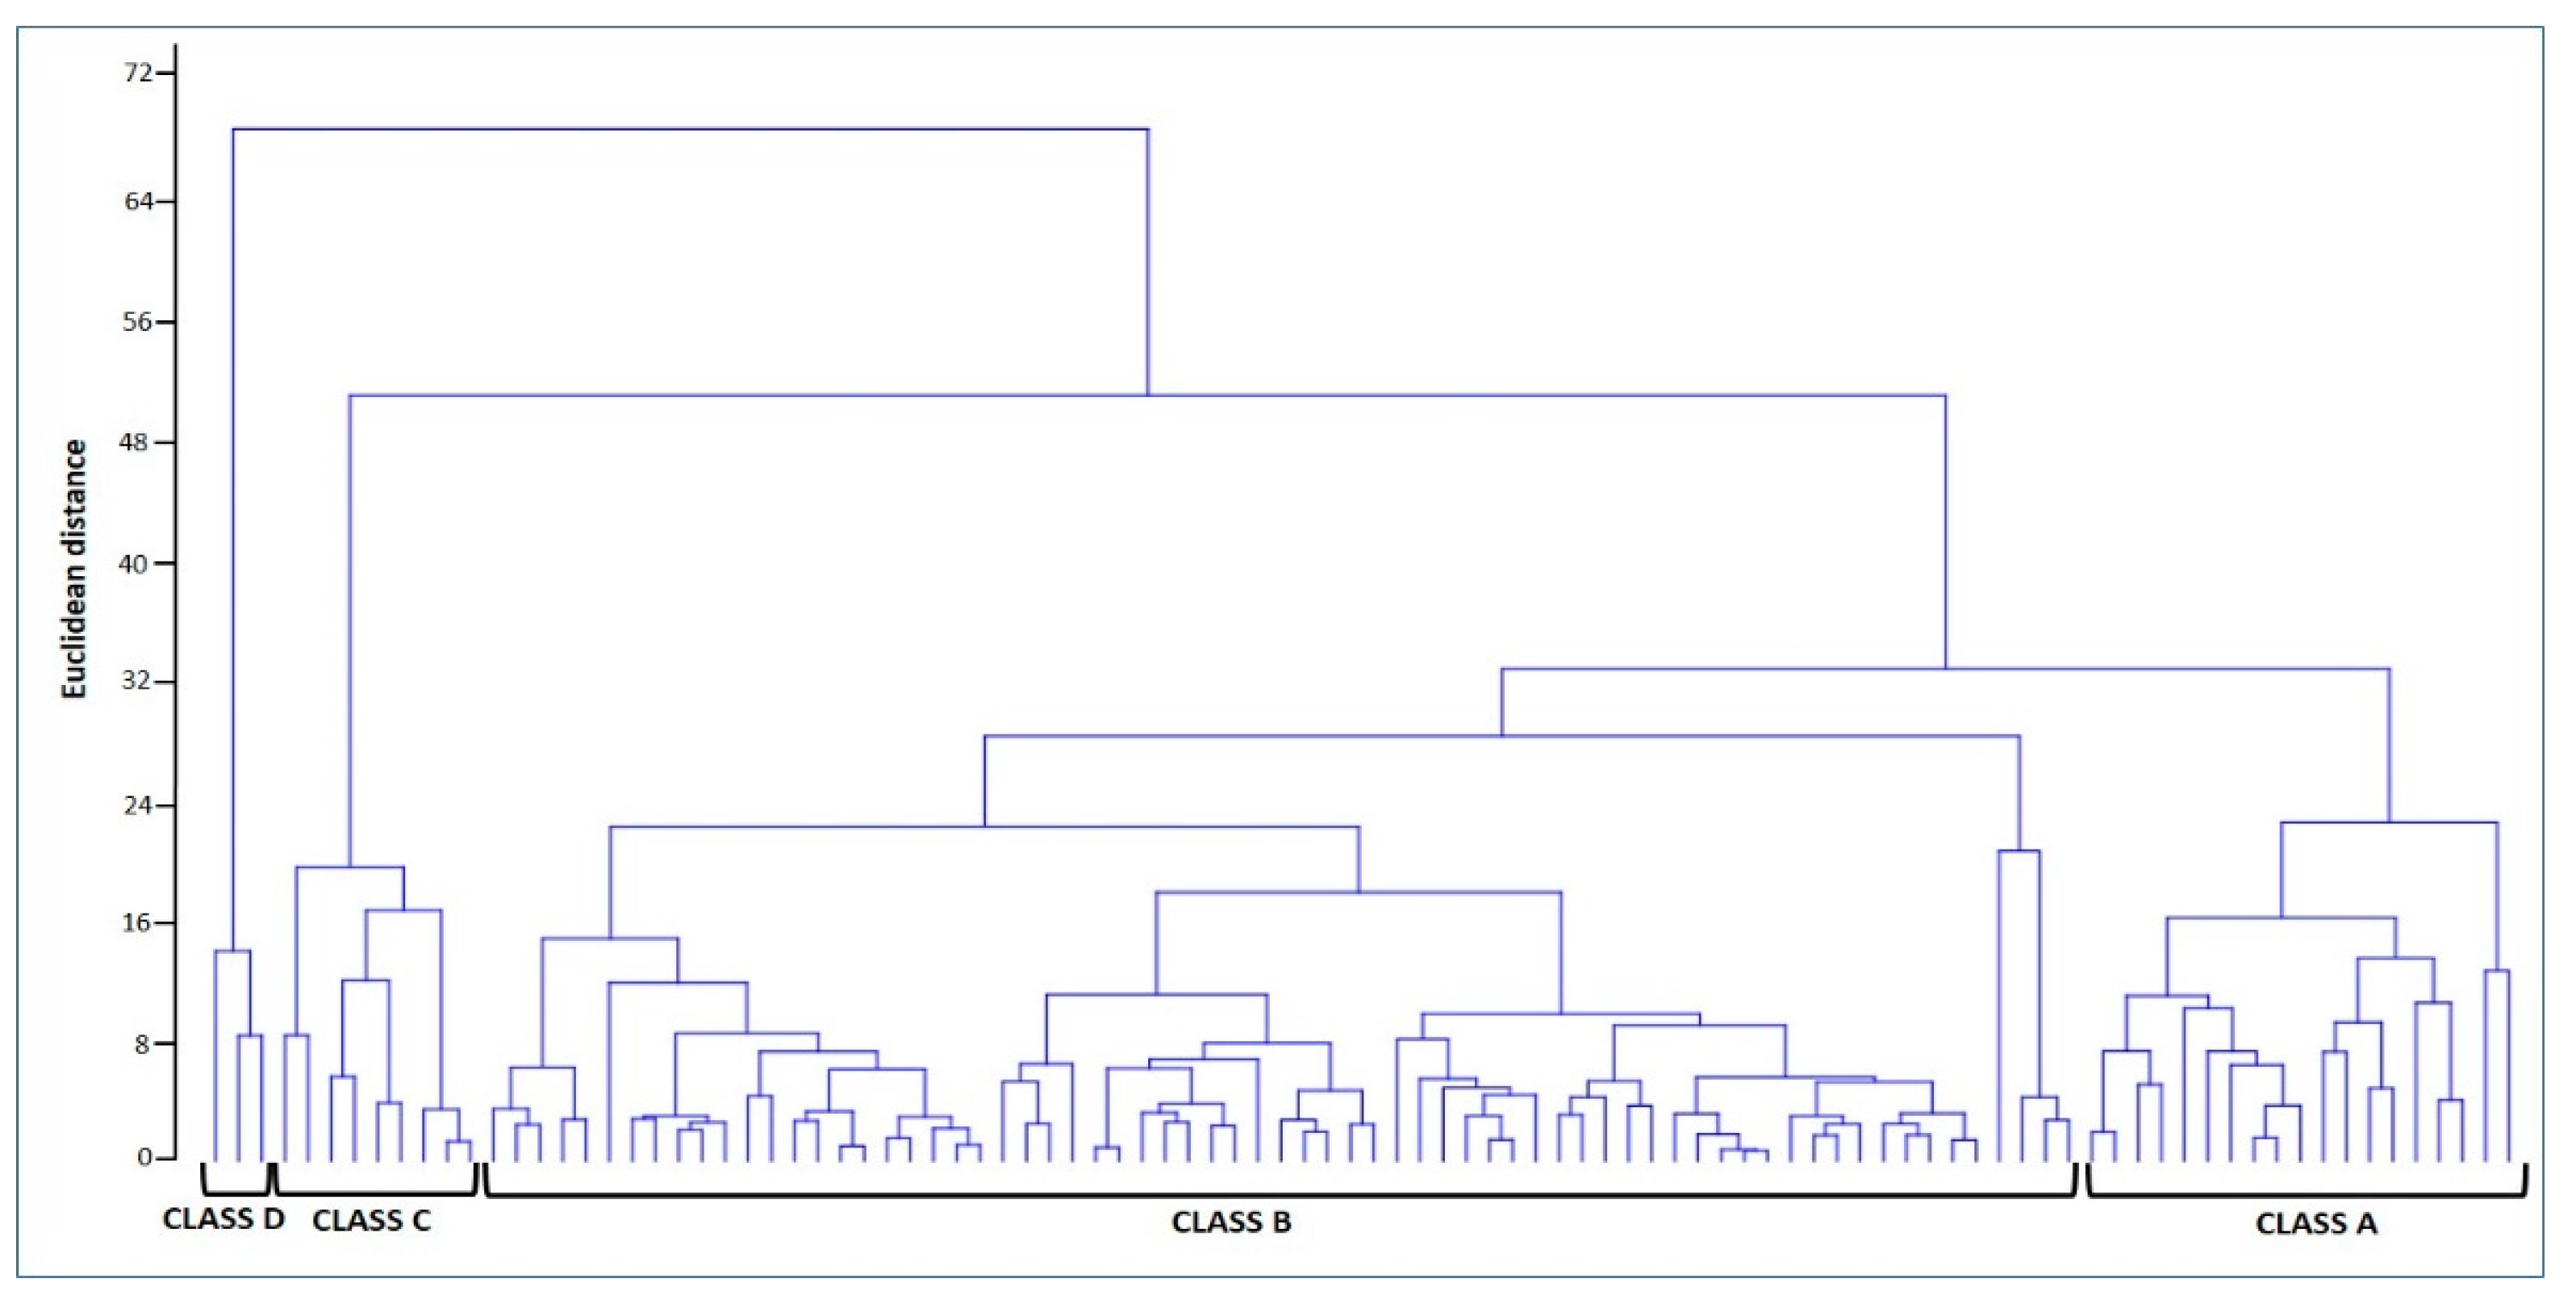
Object-based image analysis (OBIA) in order to test the capacity of Sentinel-2A to correctly classify the characterized mining residue samples;
Generation of characterized mining residue map in order to valorize the abandoned mining residues with the presence of potential minerals for further efficient resource use from industry.

2. Materials and Methods

A preliminary approach was tested by our research group for the optimized management of Fe and Mn-rich residues in the Indian mine area of Joda West [10]. In this mine, the extracted materials, unsuited to industry due to their particle size or lower mineral content, are placed into overburdened dumps without planned management. Moreover, it sometimes happens that these deposits need to be moved to other areas to make way for expanding mining activity. These encouraging data have permitted to give rise to a second in situ sampling campaign in order to develop an integrated and performed strategy to valorize the mining residues that have the potential to unlock economic opportunities as well as to reduce environmental impact.
During the second in situ sampling campaign, it was possible to validate the results of the first satellite classification and, at the same time, collect 100 samples within the mine area (Figure 1). Furthermore, the characterization of mining residues samples by physical and SEM-EDS analyses and the accuracy of satellite classification have been improved by identifying polygons (and not single pixels) with the same mineral composition.

2.1. Characterization Analyses of Mining Residues

The particle size analysis is a very important physical property of mining residue samples. To estimate the PSD (particle size distribution) of materials and to determine the proportions of different grain sizes, the sieve analysis procedure was used. In the first step, the sieves (with known aperture sizes) were shaken for ten minutes in order to pass the particles. Then, the particles that are in each sieve were weighed and subtracted from the total (BS EN 933 Pt. 1: 1997). In particular, to calculate the percentage passing, the cumulative percent retained was subtracted from 100%. Finally, a semi-logarithmic curve was plotted: the ordinary axis is the percent fines and the abscissa axis is the opening size. The mechanical sieving was applied to 100 samples using sieves with opening sizes ranging from 40 mm to 0.125 mm.
Mineralogical analysis was performed using a Bruker D8 Advance XRD (with Cu-Ka radiation and working at 40 kV and 30 mA). The X-ray powder diffraction (XRPD) is a non-destructive method that analyzes the material structure (at an atomic or molecular level) for phase identification by measuring the intensity of scattered X-rays (in nanometers) from samples. XRPD spectra were obtained in randomly oriented powder samples between 0° and 70° 2θ. DIFFRAC. EVA software and Crystallography Open Database (COD) were used to elaborate the diffraction data for all samples.
The chemical composition of each sample was determined by XRF using a dispersive energy X-ray fluorescence spectrometer (SPECTRO XEPOS). Each sample (fraction < 75 µm) was dried (at 105 °C) and prepared following the compacted powder method. The calibration curves were constructed using OREAS® certified reference materials (CRM) and the common linear model by Lukas-Tooth and Price. The results were compared with those obtained with the SPECTRO procedure calibration model, a combination of fundamental parameters and an extended Compton scattering model with a calibration of the mass attenuation coefficient. The best correspondences of the analytical results with the given concentrations of CRM were chosen as the best calibration curve of each element.
The samples have also been characterized by SEM-EDS analysis. SEM-EDS is an elemental microanalysis technique that involves elemental identifications and concentration determinations: electron-excited characteristic X-ray peaks identify and quantify all elements of the periodic table (except for H, He and Li). The sample was disrupted with mortar and pestle and coated with a conductive film of C. The SEM used to analyze the samples is a Zeiss EVO MA10 with LaB6 source, equipped with EDS (Oxford Instruments X-MAX 80 mm2 detector and AZTEK software package).
In the laboratory, spectral characterization analysis was performed using an ADS Fieldspec® 3 portable spectroradiometer ranging from visible to short-wave infrared (350–2500 nm)—for the spectral measurements, see Guglietta et al. [10]. The spectral characterization analysis was carried out on raw samples with particle sizes ranging from 0.1 mm to 5 cm. Furthermore, in order to use hyperspectral signatures for Sentinel-2A image processing, each spectral signature was resampled according to the satellite spectral band ranges (Figure 2). The details of the image are listed in Table 1.

2.2. Remote Sensing Analysis

In recent years, the possibility to exploit the free access data of Sentinel missions has promoted the frequent use of remote sensing images in the context of mining activities, especially for ecological degradation and environmental pollution [11], for geological applications [12] and for mapping the surface mineralogy due to hydrothermal alteration systems [12]. The Sentinel-2A platform of the European Space Agency (ESA) offers multispectral images with 10 m of spatial resolution in the range of visible and near-infrared and 20 m in the near and short-wave infrared range. From the spectral point of view, Sentinel-2A images provide 10 bands ranging from 490 nm to 2190 nm and this spectral range displays the key spectral characteristic bands that are associated with the main mineralogical phases (hematite, goethite) [13].
In this study, a Sentinel-2A image was downloaded from the ESA Copernicus Open Access hub and acquired in the Joda West mine area on 14 November 2018 in order to create a map of Fe and Mn mining residues. The sample site was overlaid on the georeferenced image, and, for each site, the spectrum was extracted and coupled to the spectrum acquired in the laboratory on the raw material collected at that site. To elaborate on the acquired Sentinel-2A image, an object-based image analysis (OBIA) was applied using the eCognition software (Definiens, München, Germany). In the OBIA method, the image segmentation represents the first step in which homogeneous pixels are merged with neighboring ones until a heterogeneity threshold, thus defining scale parameters and determining segmentation parameters. The Sentinel-2A image was divided into homogenous image objects by using eCognition commercial software (Definiens, München, Germany). The weight parameters used for Sentinel-2A image segmentation were set to 0.2/0.8 for shape/color features, 0.4/0.6 for compactness/smoothness features and 20 for the scale parameter. To distinguish the classes, different features were selected: spectral features (Sentinel-2A bands, mean and variance of brightness for each band), normalized difference vegetation index (calculated from the following equation: NDVI = (NIR-RED) reflectance/(NIRRED) reflectance) and normalized difference water index (calculated from the following equation: NDWI = (NIR-MIR) reflectance/(NIR + MIR) reflectance). In this approach, the spatial context is considered by segmenting the image into objects and then classifying the objects rather than pixels. The training sites (samples collected during in situ campaign) were recognized on the image objects and a supervised classification procedure was used to assign image objects to classes considering the minimum distance measurements to training samples.

3. Results and Discussions

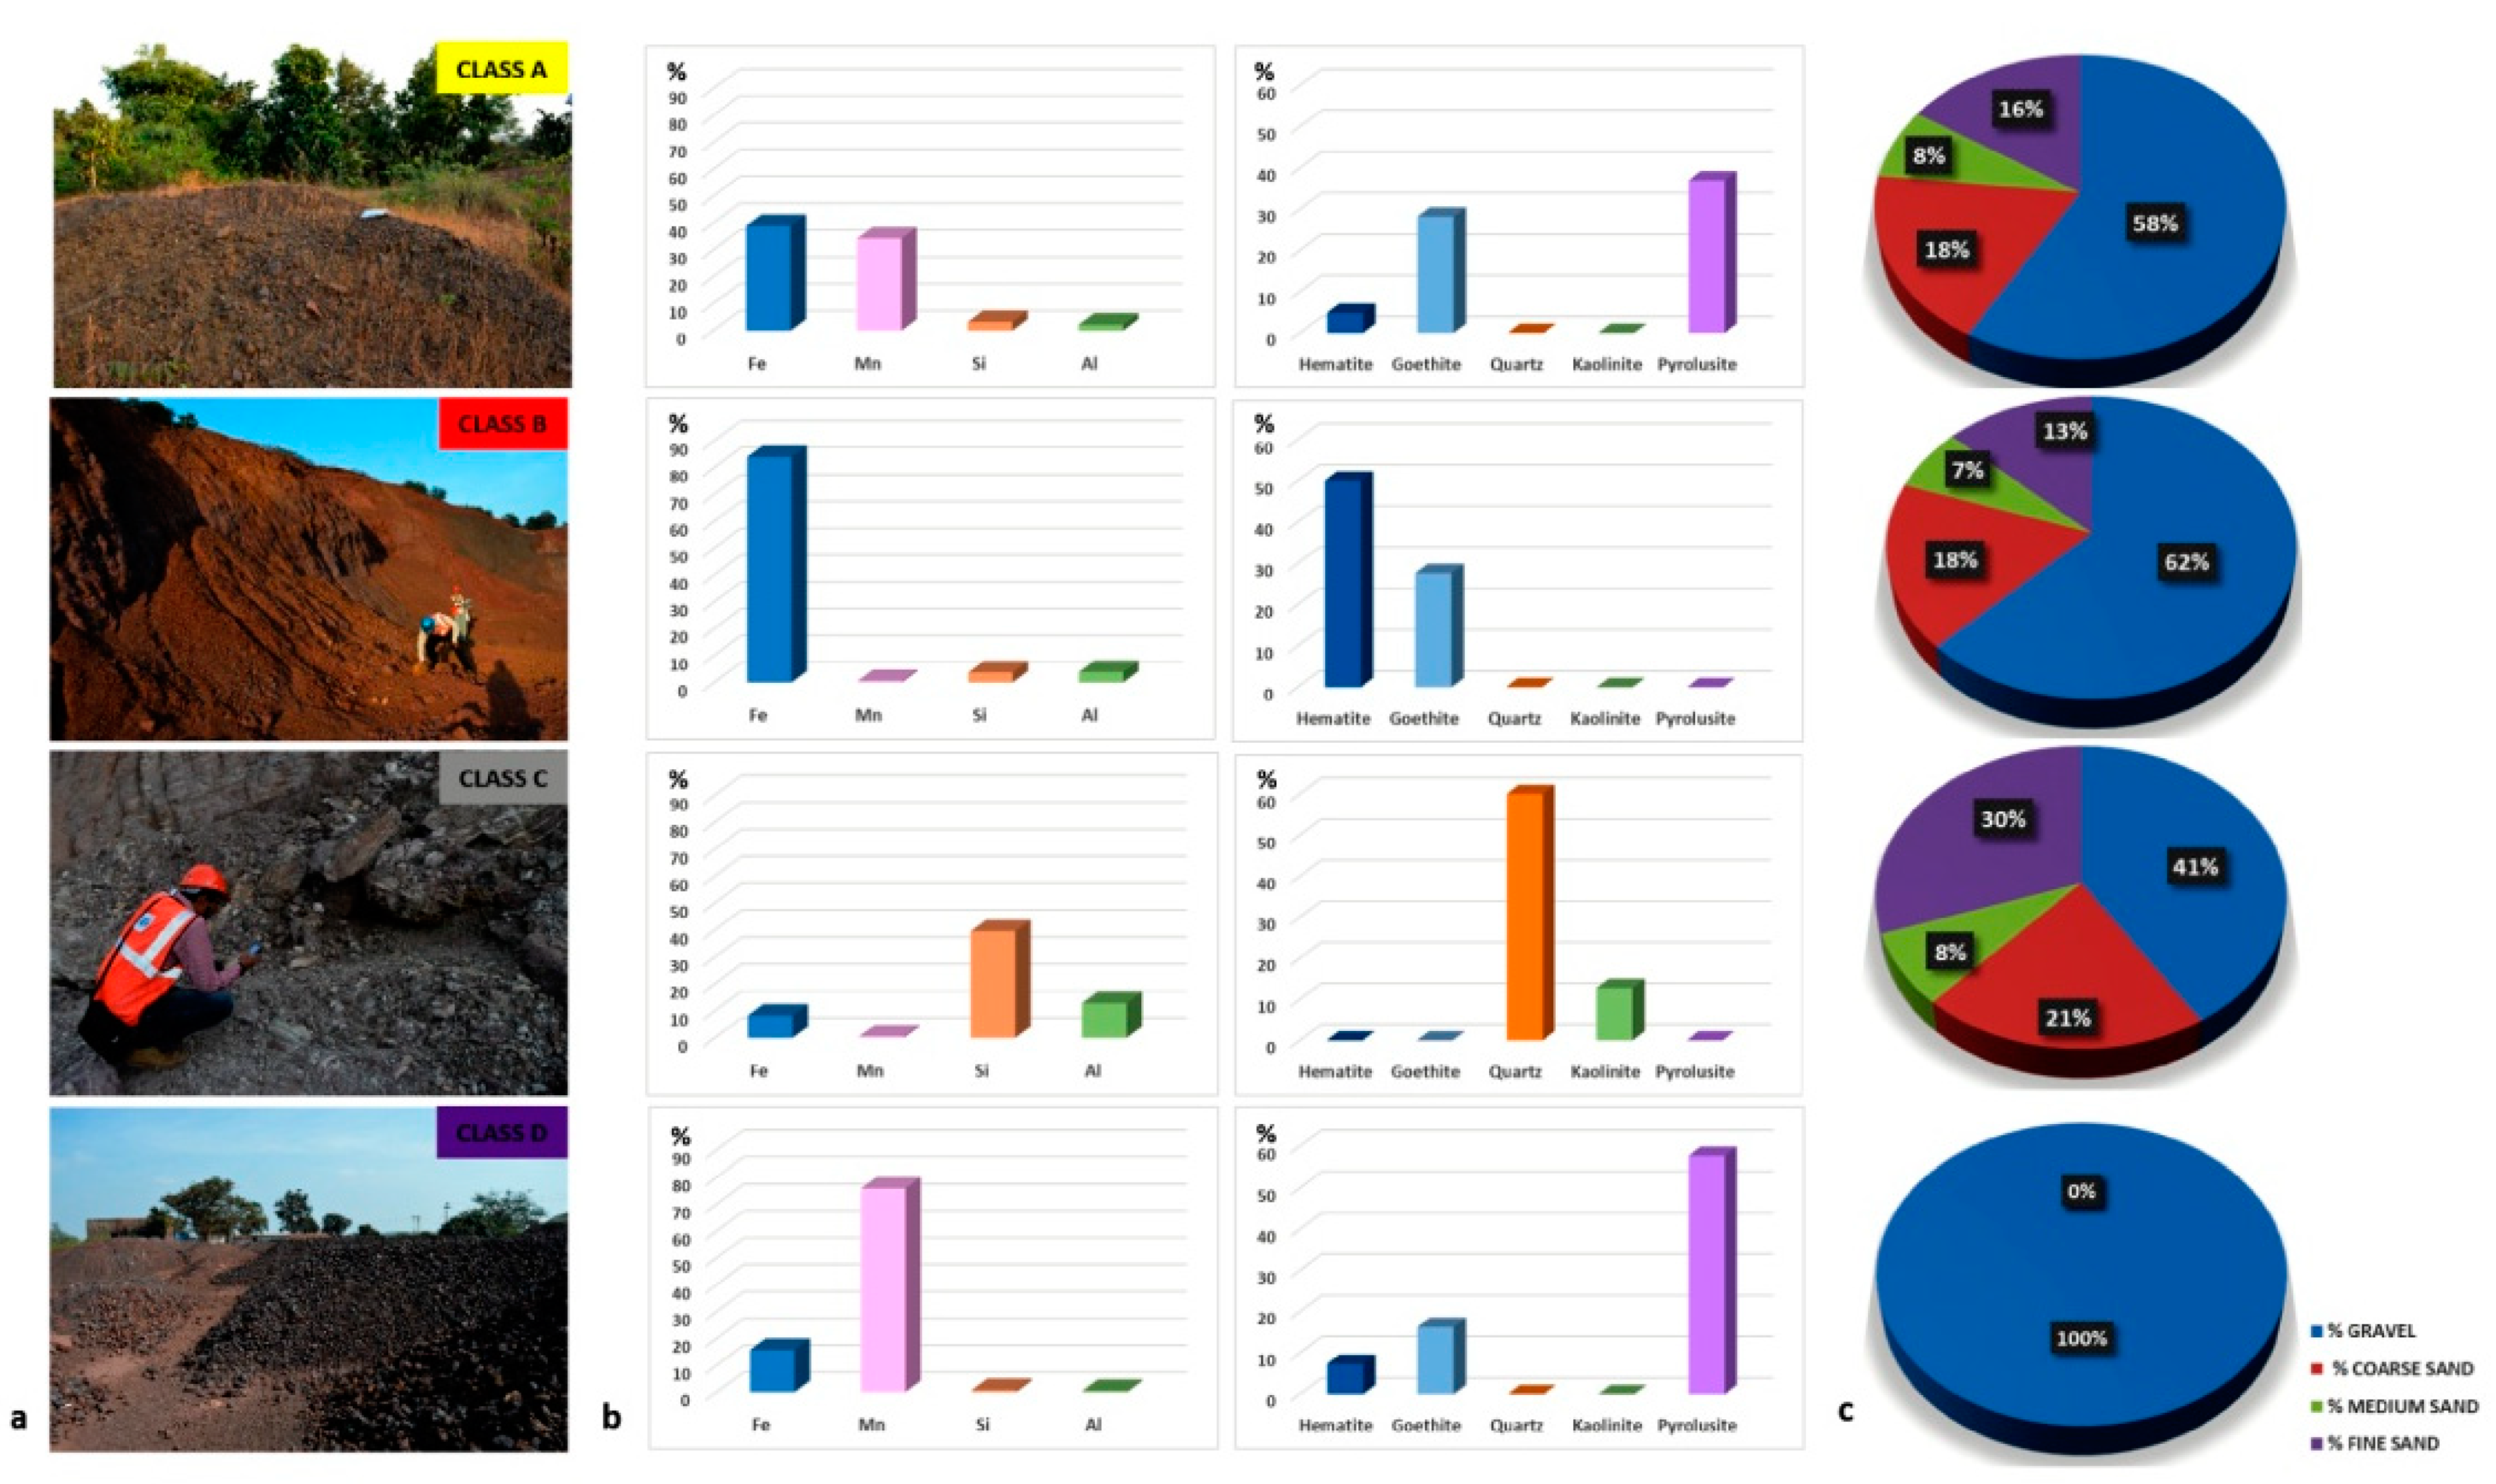
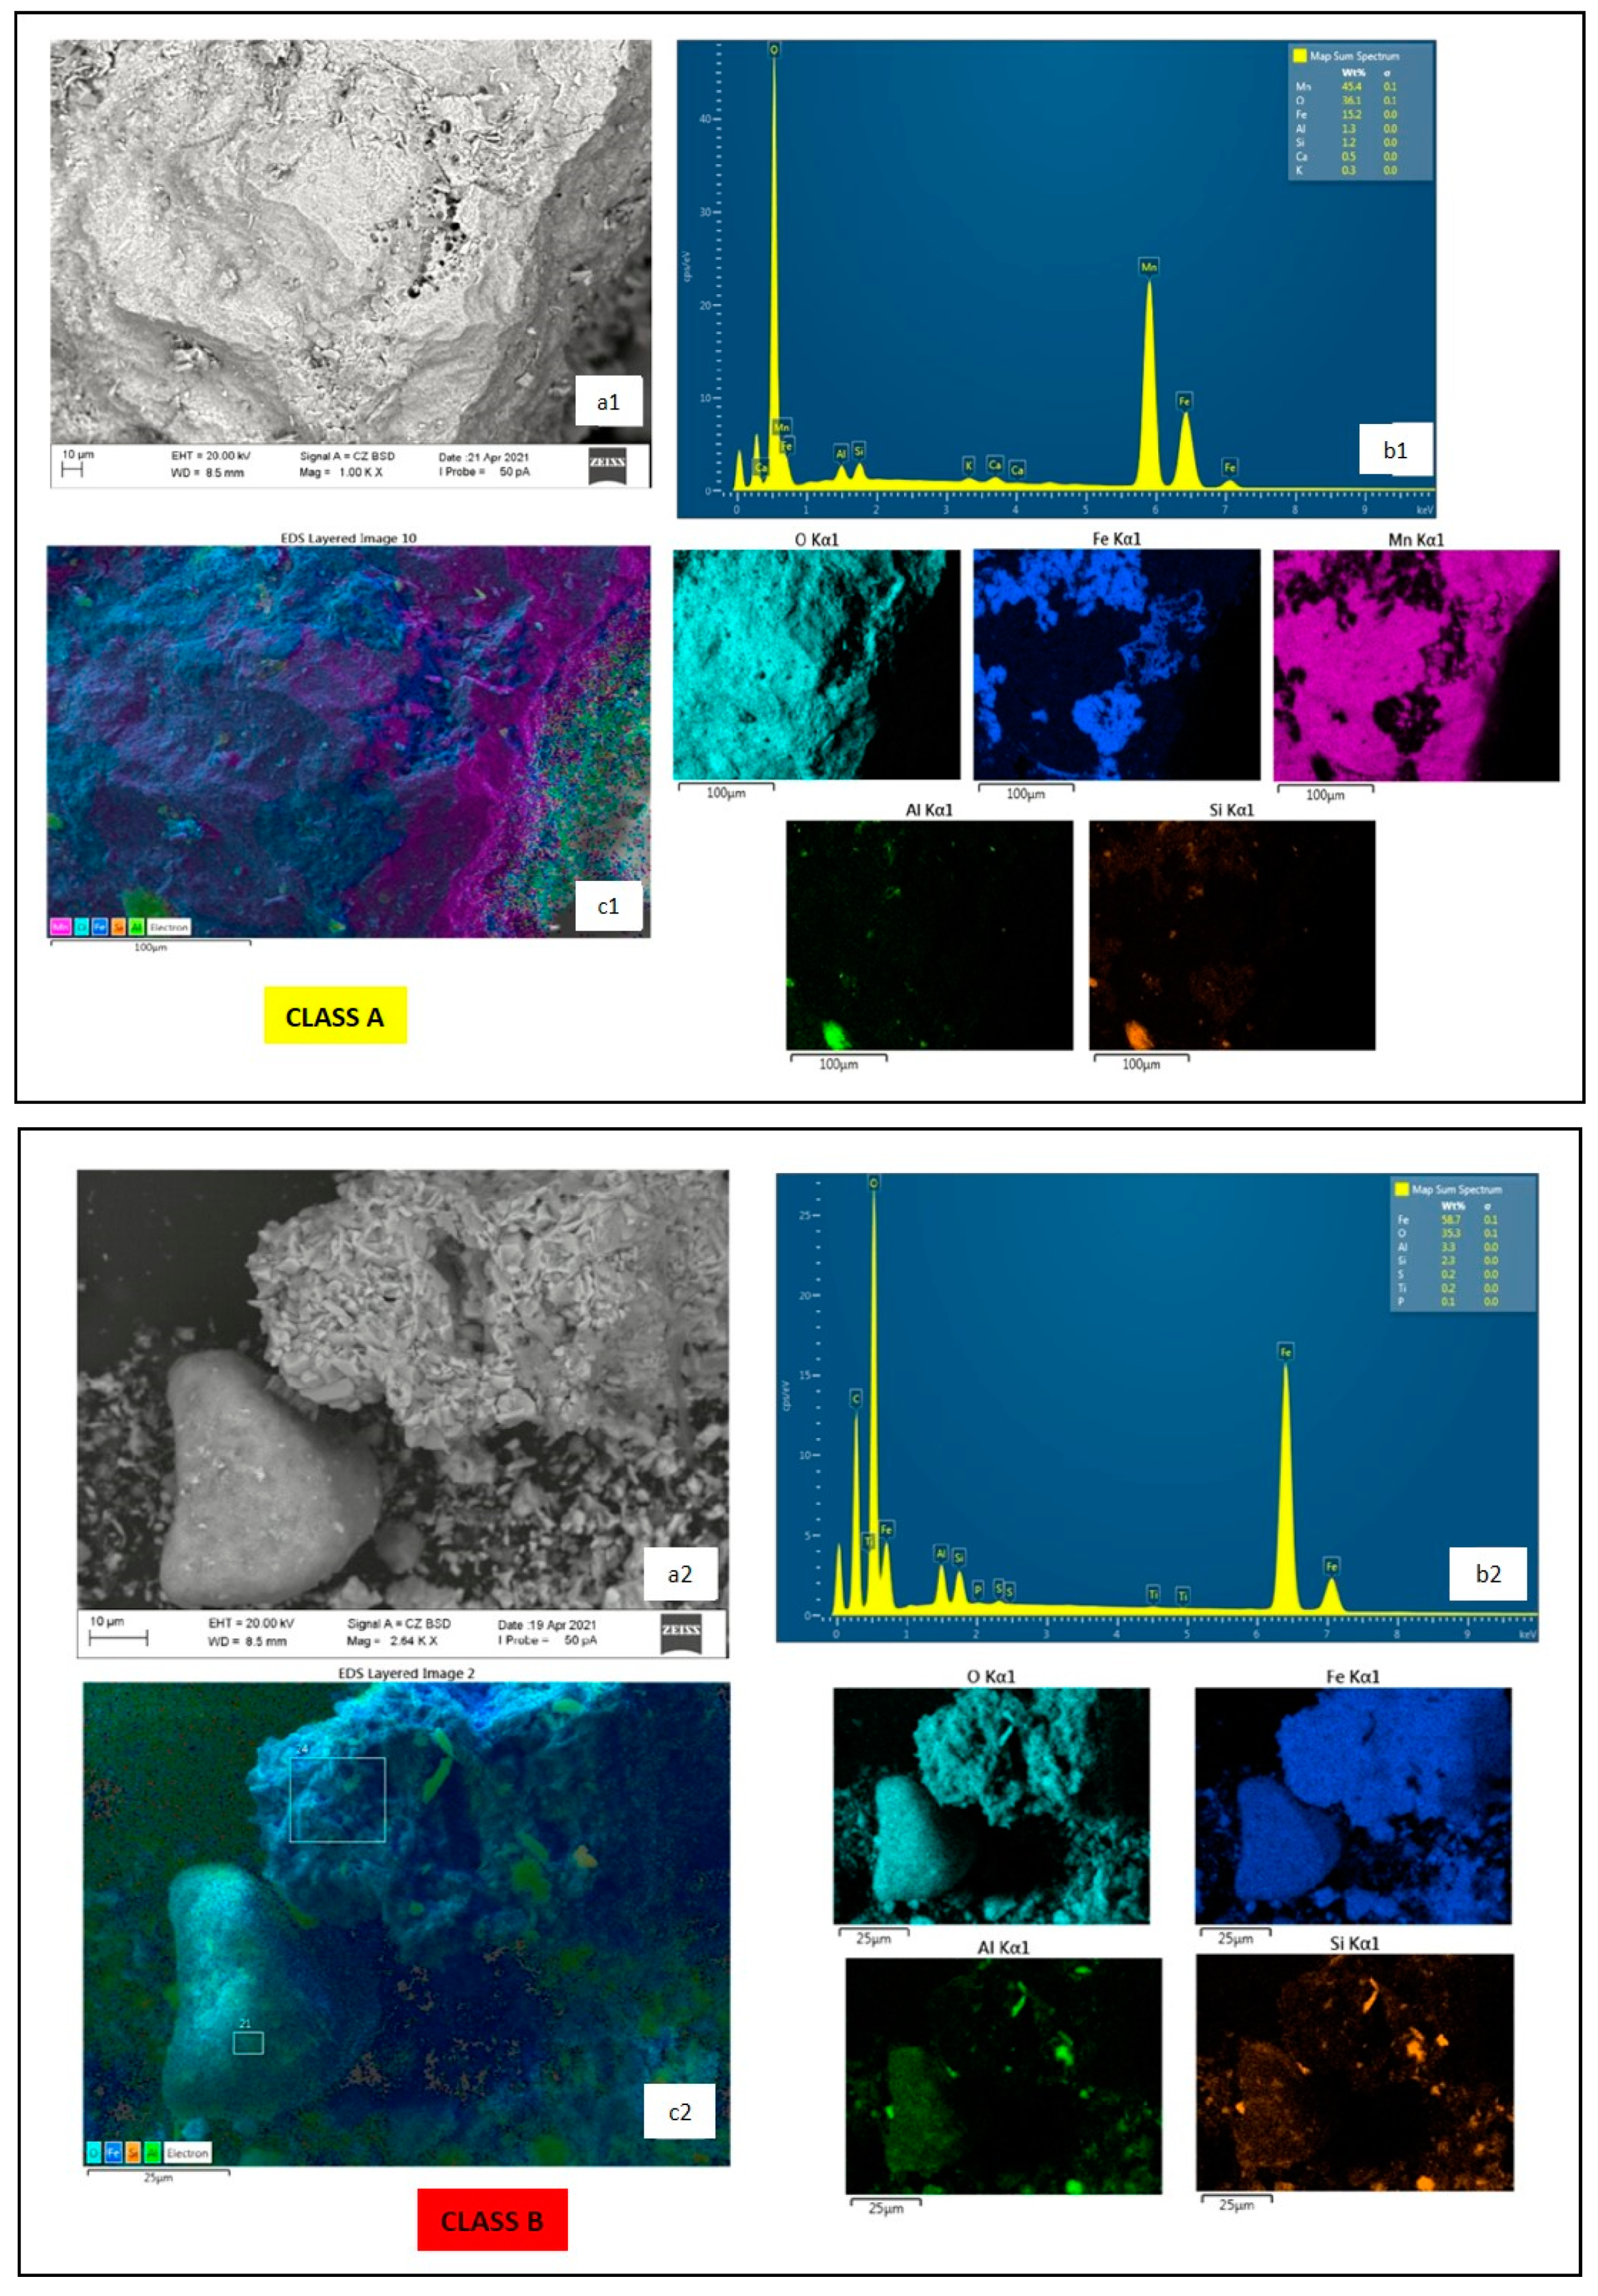
3.1. Mining Residue Sample Characterization

Open-pit mining operations generate significant volumes of mining residues that are deposited in surface piles because their metal content is lower than the operationally cut-off grade. These piles contain materials characterized by high heterogeneity of PSD (varying from mm to cm), which in turn, are correlated to the mineralogy of the mining residues. In this work, PSD is classified in accordance with the textural classification system of USDA (United States Department of Agriculture, 1951). The proportions of different grain sizes of mining residues samples range from gravel (which is the fraction retained on the sieve with an opening size ranging from 40 to 2 mm) to fine sand (which is the fraction retained on the sieve with an opening size ranging from 0.25 to 0.125 mm) (Figure 3). In particular, most samples (67 out of 100) present more than 50 percent of the fraction retained in the gravel class; only 33 out of 100 samples fall into the sand class (divided into coarse, medium and fine sand).
In addition, a deeper understanding of mining residues permits to make the best of the potential raw materials contained in it. The summary of the chemical composition is shown in Figure 4: the samples are mainly composed of Fe, Mn, Si and Al, with mean concentrations around 51%, 14%, 10% and 6%, respectively. Some other elements are marginally present, such as Ca, P and Mg with a mean lower than 5%, which is why they are not considered in further analysis.
The main mineralogical phases included hematite, quartz, goethite, kaolinite and pyrolusite, with mean concentrations around 36%, 23.5%, 9%, 9% and 5%, respectively (Figure 5). In this study, the mineralogical phases with mean concentrations lower than 5% are not considered.

3.2. Mining Residue Map

In this research, a hierarchical clustering using the Euclidean distance and the average linkage between groups criterion (UPGMA) (Legendre and Legendre, 2012) was performed in order to identify image objects of mining residues with similar mineralogical, chemical composition and spectral behavior. In particular, the percentage values of the main elements (Fe, Mn Si and Al), the main mineralogical phases including hematite, goethite, pyrolusite, quartz and kaolinite and the spectral signatures of each raw sample from ASD and Sentinel-2A have been used as input data. The result of the clustering procedure is presented in the dendrogram that has identified four distinct groups of mining residues (Figure 6).
To complete the Sentinel-2A classification, the image objects of each detected group have been assigned and subsequently used as a training set. The four classes identify four distinct typologies of areas containing mining residues: Class A—residues dumped in the old area of mine with the presence of sparse herbaceous vegetation; Class B—residues accumulated at the foot of the mine wall where the extraction process is carried out and fresh residues accumulated along the roadside of the mine area; Class C—residues abandoned in the closed mine; Class D—residues deposits of lower mineral content.
The results of the OBIA classification were used to map the mining residues deposits in the Joda West mine. In particular, the map identifies the location of the four mining residues classes (Figure 7). The total classified area is equal to 92 hectares; in particular, objects classified as Class A measure 36 ha, Class B measure 49 ha, Class C measure 4 ha and Class D measure 3 ha. The accuracy results include the user’s accuracy (95.62%), producer’s accuracy (96.42%), overall accuracy (96.76%) and kappa coefficient (0.815).
Moreover, each class (Figure 8a) identifies residues deposit areas with different percentage mean of Fe, Mn, Si and Al elements, hematite, goethite, pyrolusite, quartz and kaolinite minerals (Figure 8b) and particle size distribution (Figure 8c). Class A, Class B and Class D are made up mainly of gravel and they are enriched in Fe and Mn, considered relevant metals and of economic importance [11]. In particular, Class A and Class D are distinguished from Class B by the high mean concentration of pyrolusite and goethite with respect to hematite. Moreover, in Class A and Class D, the high percentage of goethite compared to hematite can be explained by longer deposit time and the presence of vegetation can confirm it. On the other hand, almost exclusively Fe characterizes Class B and the mean concentration of hematite is about twice that of goethite, while those of quartz and kaolinite are almost insignificant (less than 1%). The deposits of Class C are localized in areas where all the mining activities were declared complete some time ago and the quartz and kaolinite reach the highest mean percentage (60% and 10%, respectively) and the main particle size distribution is the fine sand.
Furthermore, for each class, SEM-BSD images, EDS spectra and the X-ray maps were acquired (Figure 9) and the results confirm that Class A displays a clear prevalence of the Mn and Fe content while the remaining elements (Si, Al) are concentrated in very limited areas (Figure 9. Class A); Class B shows a composition with a prevalent Fe content (Figure 9. Class B); Class C is characterized by a silico-aluminous composition due to the prevalence of Si and Al over the other elements, essentially represented by Fe and Mn (Figure 9. Class C); Class D is mostly composed by Mn and Fe elements and occurrences of Si and Al in very subordinate concentrations (likely less than 1%) (Figure 9. Class D).
Many studies include the use of remote sensing analysis in mining areas and abandoned waste, mainly for environmental, pollution and health problems [14,15,16]. Recently, particular attention has been paid to the mapping of mining residues by using satellite data or hyperspectral data combined with sampling data and/or physical, mineralogical, chemical characterization, and geostatistical approaches [11,13,17], providing additional information and achieving interesting results in order to improve the mineral estimation and accuracy of classification. In this research study, all the above-mentioned data and analyses have been used and each of them provides unique information to better distinguish the different samples in the study area and so to improve the map accuracy that provides a precise and large amount of information over the full mine area validated with field samples and performed laboratory analyses.
The results highlight that these mining residue deposits represent a new source of RMs supply that the modern technologies and the availability of new equipment have to valorize in order to ensure the sustainable raw materials supply through circular use of resources. The mining residues map is a promising tool for planning residues management activities and for unlocking minerals rich in Fe and Mn (and also Si and Al), which find many applications such as the production of cement and concrete, production of geopolymers, water treatment for arsenic removal and the recovery in a sustainable way of primary and secondary raw materials [7,18,19]. Furthermore, the mining residues map demonstrates the potential for being a useful tool in the mining industry as well as in the mitigation of environmental impacts, human health protection and soil consumption.

4. Conclusions

Remote sensing techniques together with spectral identification of rocks and minerals have been widely applied to lithological mapping, mineral exploration and mine geology. In this research, Sentinel-2A image classification, combined with hyperspectral signatures and physical, mineralogical and chemical characterization analysis, has produced a map of mining residues for the valorization and further efficient resource use from industry.
A mining residue map is a key tool for developing innovative strategies in the field of waste reduction, reusing, recycling and recovery, which are of strategic importance for Europe and for those extra-European Countries with a long mining tradition.
The results prove the ability of this multidisciplinary strategy to identify, distinguish and map the minerals of interest contained in mining waste and the value added by the map is represented in the capacity to be a user-friendly tool to select deposits rich in raw materials for further applications. In this way, characterization and production of a detailed map of mining residues permit the valorization of this material, considered waste, in order to transform it into a valuable resource and at the same time to respond to the growing demand for raw materials due to industrialization, digitalization and transition to climate neutrality for 2030.
Furthermore, this multidisciplinary strategy is reliable, cost-friendly and relatively fast and it can be applied to mining residue management at any mine and can help to solve the issue of environmental pollution and land degradation and to improve the opinion of society towards the mining sector.
Finally, this research confirms the possibility of individuating new sources of raw material supply as well as minimizing the impacts and production of mining waste accumulated in the mine and surrounding areas.

Author Contributions

Data curation, D.G., R.S., A.M.C., M.P., D.P. and F.T.; Investigation, D.G.; Methodology, D.G.; Resources, D.G.; Writing—original draft, D.G. and R.S.; Writing—review and editing, D.G., R.S., A.M.C., M.P., D.P. and F.T. All authors have read and agreed to the published version of the manuscript.

Funding

This research was supported by the TECO Project ICI+/2014/342-817—Technological Eco—Innovations for the Quality Control and the Decontamination of Polluted Waters and Soils.

Data Availability Statement

Not applicable.

Acknowledgments

The authors would like to thank Girolamo Belardi from the Institute of Environmental Geology and Geoengineering, Italian National Research Council (CNR IGAG), for their suggestion on characterization analysis. Moreover, the authors would like to thank Ilaria Mazzini from CNR IGAG, Tata Steel staff, Shalini Dhyani and Paras R. Pujari from National Environmental Engineering Research Institute for their support during in situ sampling campaign.

Conflicts of Interest

The authors declare no conflict of interest.

References

  1. EEA. Paving the Way for a Circular Economy: Insights on Status and Potentials; EEA Report No 11/2019; European Environment Agency: Copenhagen, Denmark, 2019. [Google Scholar]
  2. ERA-MIN Research Agenda-Insu-00917653, version 1; Network on the Industrial Handling of Raw Materials for European Industries; 12 December 2013; Available online: https://www.era-min.org/ (accessed on 12 January 2022).
  3. European Commission–Communication from the Commission to the European Parliament, the Council, the European Economic and Social Committee and the Committee of the Regions. The European Green Deal Brussels, 11.12.2019 COM(2019) 640 Final. Available online: https://eur-lex.europa.eu/resource.html?uri=cellar:b828d165-1c22-11ea-8c1f-01aa75ed71a1.0002.02/DOC_1&format=PDF (accessed on 11 December 2019).
  4. UN General Assembly. Transforming Our World: The 2030 Agenda for Sustainable Development 21 October 2015. A/RES/70/1. 2015. Available online: https://www.refworld.org/docid/57b6e3e44.html (accessed on 20 May 2021).
  5. European Circular Economy Research Alliance (ECERA). White Paper-Digital Circular Economy as a Cornerstone of a Sustainable European Industry Transformation; European Circular Economy Research Alliance (ECERA): Boeretang, Belgium, 2020. [Google Scholar]
  6. Mathieux, F.; Ardente, F.; Bobba, S.; Nuss, P.; Blengini, G.; Alves Dias, P.; Blagoeva, D.; Torres De Matos, C.; Wittmer, D.; Pavel, C.; et al. Critical Raw Materials and the Circular Economy—Background Report. In JRC Science-for-Policy Report; EUR 28832 EN; Publications Office of the European Union: Luxembourg, 2017; ISBN 978-92-79-74282-8. [Google Scholar]
  7. Capasso, I.; Lirer, S.; Flora, A.; Ferone, C.; Cioffi, R.; Caputo, D.; Liguori, B. Reuse of mining waste as aggregates in fly ash-based geoplymers. J. Clean. Prod. 2019, 220, 65–73. [Google Scholar] [CrossRef]
  8. Buzzi, J.; Riaza, A.; García-Meléndez, E.; Weide, S.; Bachmann, M. Mapping changes in a recovering mine site with hyper spectral airborne HyMap imagery (Sotiel, SW Spain). Minerals 2014, 4, 313–329. [Google Scholar] [CrossRef] [Green Version]
  9. Aznar-Sánchez, J.A.; García-Gómez, J.J.; Velasco-Muñoz, J.F.; Carretero-Gómez, A. Mining Waste and Its Sustainable Management: Advances in Worldwide Research. Minerals 2018, 8, 284. [Google Scholar] [CrossRef] [Green Version]
  10. Guglietta, D.; Belardi, G.; Passeri, D.; Salvatori, R.; Ubaldini, S.; Casentini, B.; Trapasso, F. Optimising the management of mining waste by means Sentinel-2 imagery: A case study in Joda West Iron and Manganese Mine (India). J. Sustain. Min. 2020, 19, 4. [Google Scholar] [CrossRef]
  11. Prokop, P. Remote sensing of severly-degraded land: Detection of long-term land-use changes using high-resolution satellite images on the Meghalaya Plateau, northest India. Remote Sens. Appl. Soc. Environ. 2020, 20, 100432. [Google Scholar] [CrossRef]
  12. Van der Werff, H.M.A.; Van der Meer, F.D. Sentinel-2A MSI and Landsat 8 OLI provide data continuity for geological remote sensing. Remote Sens. 2016, 11, 883. [Google Scholar] [CrossRef] [Green Version]
  13. Peyghambari, S.; Zhang, Y. Hyperspectral remote sensing in lithological mapping, mineral exploitation, and environmental geology: An updated review. J. Appl. Remote Sens. 2021, 15, 031501. [Google Scholar] [CrossRef]
  14. Ferrier, G. Application of imaging spectrometer data in identifying environmental pollution caused by mining at Rodaquilar, Spain. Remote Sens. Environ. 1999, 68, 125–137. [Google Scholar] [CrossRef]
  15. Choe, E.; Van der Meer, F.; Van Ruitenbeek, F.; Van der Werff, H.; Boudewijn de Smeth, B.; Kim, K.W. Mapping of heavy metal pollution in stream sediments using combined geochemistry, field spectroscopy, and hyperspectral remote sensing: A case study of the Rodalquilar mining area, SE Spain. Remote Sens. Environ. 2008, 112, 3222–3233. [Google Scholar] [CrossRef]
  16. Werner, T.T.; Bebbington, A.; Gregory, G. Assessing impacts of mining: Recent contributions from GIS and remote sensing. Extr. Ind. Soc. 2019, 6, 993–1012. [Google Scholar] [CrossRef]
  17. Bruno, R.; Kasmaeeyazdi, S.; Tinti, F.; Mandanici, E.; Balomenos, E. Spatial component analysis to improve mineral estimation using Sentinel-2 band ratio: Application to a Greek bauxite residue. Minerals 2021, 11, 549. [Google Scholar] [CrossRef]
  18. Casentini, B.; Lazzazzara, M.; Amalfitano, S.; Salvatori, R.; Guglietta, D.; Passeri, D.; Belardi, G.; Trapasso, F. Mining rock wastes for water treatment: Potential reuse of Fe and Mn rich materials for arsenic removal. Water 2019, 11, 1897. [Google Scholar] [CrossRef] [Green Version]
  19. Scotti, A.; Milia, S.; Silvani, V.; Cappai, G.; Guglietta, D.; Trapasso, F.; Tempesta, E.; Passeri, D.; Godeas, A.; Gómez, M.; et al. Sustainable Recovery of Secondary and Critical Raw Materials from Classified Mining Residues Using Mycorrhizal-Assisted Phytoextraction. Metals 2021, 11, 1163. [Google Scholar] [CrossRef]
Figure 1. Fe and Mn mine of Joda West study area with 100 samples (black dots) highlighted on the Sentinel-2A image.
Minerals 12 00617 g001
Figure 2. Spectra of raw samples acquired by spectroradiometer and spectral resolution of Sentinel-2A bands.
Minerals 12 00617 g002
Figure 3. The proportions of different grain sizes of 100 mining residues samples in accordance with the textural classification system of the U.S. Department of Agriculture (USDA, 1951).
Minerals 12 00617 g003
Figure 4. Chemical composition summary of 100 samples. The main elements are iron, manganese, silica and aluminum.
Minerals 12 00617 g004
Figure 5. Mineralogical composition summary of 100 samples. The main minerals in Joda West mine samples are hematite, quartz, goethite, kaolinite and pyrolusite.
Minerals 12 00617 g005
Figure 6. Results of cluster analysis. Four classes have been highlighted and subsequently used to classify the Sentinel-2A image.
Minerals 12 00617 g006
Figure 7. Map of mining residues deposits in the Fe and Mn Joda West mine.
Minerals 12 00617 g007
Figure 8. Description of four classes: Class A (yellow)—residues dumped in the old area of mine with the presence of sparse herbaceous vegetation; Class B (red)—residues accumulated at the foot of the mine wall where the extraction process is carried out and fresh residues accumulated along the roadside of the mine area; Class C (grey)—residues abandoned in the closed mine; Class D (purple)—residues deposits of lower-grade ores (a). For each class, the concentrations of the main elements and minerals (in percentage) (b) and the particle size distribution (c) are highlighted.
Minerals 12 00617 g008
Figure 9. SEM-EDS results for Class A, Class B, Class C and Class D. In particular, for each class, SEM-BSD images (a1a4), EDS spectra (b1b4) and the X-ray maps (c1c4) were acquired.
Minerals 12 00617 g009aMinerals 12 00617 g009b
Table 1. Details of Sentinel-2A bands used in the research.
BandCentral Wavelength (nm)Bandwidth (nm)Spatial Resolution (m)
2496.69810
3560.045
4664.538
8835.1145
5703.91920
6740.218
7782.528
8a864.833
111613.7143
122202.4242
Publisher’s Note: MDPI stays neutral with regard to jurisdictional claims in published maps and institutional affiliations.

