Abstract
Cohesion and friction angle are important indicators of shear strength in mining engineering. Indoor testing methods are detached from the actual state of the rock mass and affected by disturbances and significant dimensional effects that do not fully reflect the shear strength of the rock mass itself. In situ borehole shear testing is of great practical importance because of its low disturbance and high speed. In this paper, a new testing device based on the principle of a rock borehole shear tester was designed to simulate the shear test in the laboratory. Seven shear indenters were designed to test the effect of different tooth heights, spacing, and angles on the shear strength of rock-like specimens, and the damage surface was scanned in three dimensions and compared with conventional triaxial tests and compression shear tests. The results show that as the tooth height increases, the flatness of the press-in damage surface increases, and the results will be closer to the press-shear test. As the spacing increases, the maximum damage angle and the damage surface between the grooves gradually decrease. The tooth angle has little effect on the friction angle, but cohesion decreases significantly when exceeds 60°.
1. Introduction
The shear strength index (cohesion and friction angle) is one of the basic mechanical parameters of engineering rock and is an important reference basis for stability analysis and excavation support design in mining engineering. At present, methods of shear strength testing can be divided into two main categories, in situ and indoor testing, but both have certain engineering limitations as well as the subjectivity of empirical guidelines and are notoriously different from each other. The borehole in situ shear test is an emerging method of shear strength testing in which geotechnical shear strength parameters are determined by direct shear tests at different normal pressures on the sidewalls of boreholes. In 1974, the International Society of Rock Mechanics proposed regulations for in situ rock shear test methods, which are still commonly used today for the practical estimation of foundation strength.
The in situ borehole shear test method was first developed by Handy et al. [1,2,3] in the 1960s for use in soil borehole shear tests. Pan et al. [4] developed a multipurpose borehole testing device to provide design parameters for foundations in soft rock. Jia et al. [5] developed a rock borehole elastic modulus testing system based on rock borehole shear that is capable of acquiring rock mechanics and deformation parameters simultaneously and carried out in situ borehole shear testing in the Xiangjiaba Hydropower Station Project. Using a self-designed in situ shear instrument, Ding et al. [6] tested soil–rock contact surfaces with different roughness and found that the contact surfaces exhibited typical softening characteristics.
Higgins and Rockaway, and Pitt et al. [7,8,9] successfully determined rock shear strength indices with borehole shears. Oyanguren [10] compared the results of in situ tests with the shear criterion and used a computer program to determine the safety factor of a rockfill dam. Wang et al. [11] found that the rock in situ borehole shear tester was applicable to soft and medium hard rocks and that the cohesion and internal friction angle values were smaller than the conventional triaxial and indoor direct shear test results. Li et al. [12] carried out in situ direct shear tests on human weathered siltstone and showed that the displacement corresponding to the maximum shear stress decreases as the number of normal loads increases. Zhao et al. [13] obtained the same result by carrying out multiple sets of rock borehole shear tests at Xiangjiaba Hydropower Station and using the least squares method to calculate their shear strength. Bo Li et al. [14] conducted in situ shear tests and numerical simulations on tightly jointed rock masses containing continuous and intersecting joints, indicating that the jointed rock masses have strong anisotropic shear properties. Nizametdinov [15] developed an in situ shear test procedure to evaluate the shear strength characteristics of rocks and estimated the cohesion and friction angle based on laser scanning and limit equilibrium equations. Lv and Zhou [16] demonstrated that there is a strong linear correlation between the results of the in-situ borehole pressure-shear test and the direct shear test. Han et al. [17] conducted field tests and borehole shear tests in the fracture zone to analyze the causes of tunnel deformation and instability and made recommendations for tunnel support. Tan [18] combined in situ direct shear tests and UDEC numerical simulations to reveal the shear mechanical behavior and progressive damage mechanism of muddy structural surfaces. Ishida et al. [19] carried out finite element simulations of in situ shear and found that the direct shear damage angles were similar to those in triaxial compression tests. Sanei [20] combined in situ tests, direct shear tests, and numerical simulations to demonstrate that the peak shear strength of the discontinuity decreases as a function of the discontinuity length. After evaluating thirteen damage criteria used to predict shear damage in boreholes, Rahimi et al. [21,22] observed that the degree of response of the damage criteria varied for different rock strength classes.
Many researchers [23,24,25,26,27] have conducted theoretical analyses and numerical simulations of the indentation process of the indenter and proposed a model of the rock-breaking mechanism based on the pressure-bearing nucleus theory. Zhou [28] and Tian et al. [29] investigated the effects of different confining pressures, invasion angles and tooth spacing on the rock breaking effectiveness of pick cutters. However, few studies have been performed on its mechanism of action, especially on the intrusion of the shear indenter teeth into the rock. To further investigate the mechanism of in situ borehole shear, the process of shear indenter intrusion into the rock was analyzed, and a new borehole shear indoor test apparatus was designed. The effect of different shear indenter parameters (height, angle and spacing) on the test results was investigated using orthogonal experiments, and the characteristics of the shear surface after damage were analyzed.
2. Preparation of Specimen Manufacture and Experimental Procedure
2.1. Simplification of the Rock Borehole In Situ Test System
The rock borehole shear test (RBST) must ignore some important information and parameters during the test to ensure that it is simple and easy to operate. To observe damage conditions during testing and evaluate the effect of the parameters of the teeth on the shear plate in the calculation value of the shear strength index, it is essential to redesign and refine the experimental plan. As shown Figure 1, the rock borehole shear rig included: manual hydraulic pumps, hydraulic table for shear stress and normal stress, multi-pipe valve handles, shear indenter, claw forceps, hydraulic jacks, leveling of the base plate, oil pipe, and connecting rod. The direct shear test was used to carry out the compression-shear test because it can exert loading and shear loading similar to the RBST rig.
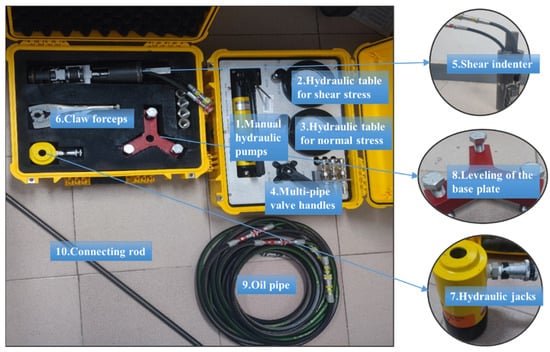
Figure 1.
Rock in situ shear. (1.) Manual hydraulic pumps (2.) Hydraulic table for shear stress (3.) Hydraulic table for normal stress; (4.) Multi-pipe valve handles (5.) Shear indenter (6.) Claw forceps (7.) Hydraulic jacks (8.) Leveling of the base plate (9.) Oil pipe (10.) Connecting rod.
The RBST in situ rock borehole shear tester is not conducive to the development of indoor research tests. To investigate the accuracy of the rock borehole shear tester on rocks of different hardness and the mechanism of damage to the rock surface when parallel teeth on the shear indenter are pressed into the rock, we designed an indoor rock cohesion and friction angle testing device [30] based on the rock borehole shear tester test principle. The device consists of normal and tangential pressure devices, tangential fixation device, bottom bearing device, ball bearing plate, upper and lower shear boxes, and shear indenter, which requires the use of a rock indoor straight shear to complete the test work, as shown in Figure 2.
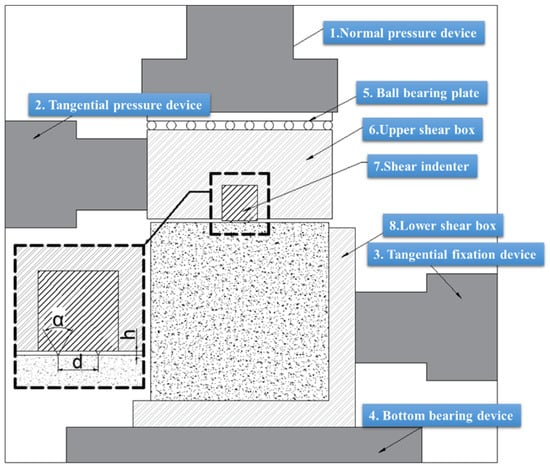
Figure 2.
Diagram of the test rig. (1.) Normal pressure device (2.) Tangential pressure device (3.) Tangential fixation device (4.) Bottom bearing device (5.) Ball bearing plate (6.) Upper shear box (7.) Shear indenter (8.) Lower shear box.
The YZW50B microcomputer-controlled electric stress type direct shear instrument is used. This equipment is widely used for direct shear testing of rocks, concrete, and other materials. The equipment is easy to operate, the control software is simple and easy to understand and easy to operate, the test process displays data changes in real time, and the end of the test can export a variety of curves and data.
2.2. Specimen Preparation and Testing Procedure
Rocklike materials are widely used in various rock mechanics experiments. Many researchers [31,32,33] have investigated the influence of the mixture ratio of cement and quartz sand on the mechanical properties of rock-like material. In light of these studies, the ratio of Portland cement: River quartz sand (<20 mesh): Water = 1:0.8:0.45 was chosen in this experiment. Following the suggestion of ISRM, three standard rock specimens, φ50 mm × H100 mm (cylindrical), 70 mm × 70 mm × 70 mm (cube), and 100 mm × 100 mm × 100 mm (cube), were prefabricated using the above material ratios. After over 28 days of concrete standard curing (humidity: >95% and temperature: 20 ± 2 °C), a series of experiments, including the Brazilian split test, variable angle shear test, and conventional triaxial compression test, were performed to determine the physical-mechanical properties. These basic physical-mechanical properties of the specimens are listed in Table 1, and the parameters of cohesion and internal friction angle have two different values resulting from the variable angle shear test and conventional triaxial compression test.

Table 1.
Physical-mechanical properties of specimens.
In this research, the Brazilian split test and variable angle shear test were conducted on a new SANS electrohydraulic servo-controlled rigidity testing machine and a DCS-200 loading control system. In the variable angle shear test, the specimens were crushed and destroyed by compression-like loads instead of cutting along the predetermined shear surface if the inclination angle was too small, and the specimens would pump and experience a force coupling effect if the inclination angle was too large. Hence, three suitable values of 45°, 60° and 70° were adopted. In addition, a conventional triaxial compression test was performed in an MTS 815 electrohydraulic servo-controlled rock mechanics testing system. The confining pressures were 0, 5, 10, and 15 MPa. By using the regression analysis method, the shear strength curve was obtained, and the shear strength parameters (c, φ) were calculated. To reduce error and obtain exact results, all the experiments were replicated 3 times, and the final results were averaged over the three replicated trials.
2.3. Damage Observation of the Specimen Surface after the Compression-Shear Test
Three-dimensional scanning technology can help digitize and characterize the surface morphology of specimens quickly, with high precision and no damage [34,35,36,37]. The task consists of the following steps. First, as shown in Figure 3, a 3D laser scanner (ATOS III TRIPLE SCAN) was used to obtain the point cloud data of the specimen surface after compression or compression-shear loading. The 3D laser scanner has an accuracy of ±0.01 mm and a resolution of 3692 × 2472 pixels in the range of 100 mm × 75 mm Second, Geomagic software was used to realize point cloud data processing, including selecting the point cloud data in the object area, adjusting the initial irregular plane to the horizontal unique plane by making use of the transformation of coordinate translation, coordinate rotation, changing the initial cloud point into an interpolated point cloud point, etc. Finally, MATLAB software was used to analyze different roughness degrees of the compression-shear surface and damage extension of specimens.
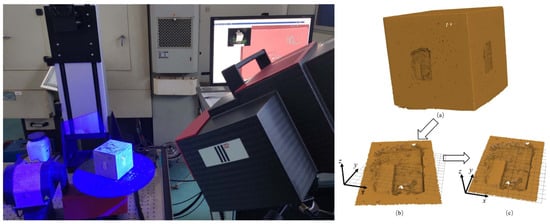
Figure 3.
3D laser scanner and data processing. (a) 3D image of the specimen surface (b) Data selection (c) Coordinate transformation.
The JRC value is a parameter that quantitatively characterizes the degree of roughness coefficient of the structural surface of a rock, first proposed by Barton [38,39] and refined by numerous researchers [40,41], and most commonly calculated by the root mean square difference method. In this research, the JRC was calculated as Equation (1) suggested by Yu and Vayssade [42], in which the JRC value is considered to be related to the point taking interval.
where Z2 is root mean square difference, and Δx is point taking interval.
3. The Experimental Study for Measuring the Shear Strength Indices
3.1. Experimental Study under Compression-Shear Loading with Different Shear Indenters
To explore the effect of different parameters of the serrations on the measurement of the shear strength index, experiments were designed with different heights, spacing, and angles of the saw teeth, as shown in Figure 4. The experimental scheme and parameters are shown in Table 2.
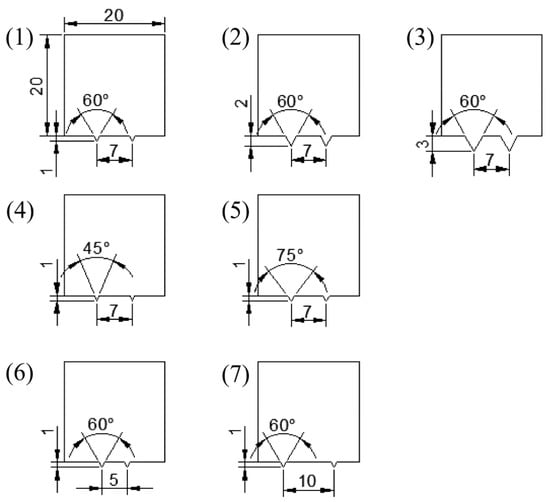
Figure 4.
Seven types of shear indenter. (1) Shear indenter 1 (2) Shear indenter 2 (3) Shear indenter 3 (4) Shear indenter 4 (5) Shear indenter 5 (6) Shear indenter 6 (7) Shear indenter 7.
Table 2.
Parameters of seven types of shear indenter.
A normal force with a certain value was gradually loaded above the specimen and then kept constant until the end of the experiment. After loading the normal force to a certain value, the shear force slowly increases until obvious slippage occurs. Finally, the maximum shear force corresponding to different normal forces can be obtained. The value of the normal force was changed, and the above steps were repeated. In this experiment, the normal force (P) had four values: 10 kN, 12 kN, 14 kN, and 16 kN.
After the test, the data are combined with the length a (30 mm) and width b (20 mm) of the bottom surface of the shear indenter, and the corresponding normal stress σ and tangential stress τ are calculated according to Equations (2) and (3).
where P is the normal force; Q is the tangential force; a, the length of the indenter (30 mm); b, the width of the indenter (20 mm).
Then, the strength curve reflecting the occurrence of shear damage of the rock is fitted using Equation (4) to obtain the values of c and φ for the rock specimens.
where c is the intercept of the fitted curve, which is the cohesion of the rock, and φ is the dip angle of the fitting curve, which is the internal friction angle of the rock.
3.2. Analysis of Parameters of the Shear Indenter
The data obtained from the tests were processed to obtain the fitted equations and curves, as shown in Figure 5, where the R2 was close to 1, indicating an overall well fit. The values of c and φ measured for each type of shear indenter are listed in Table 3.
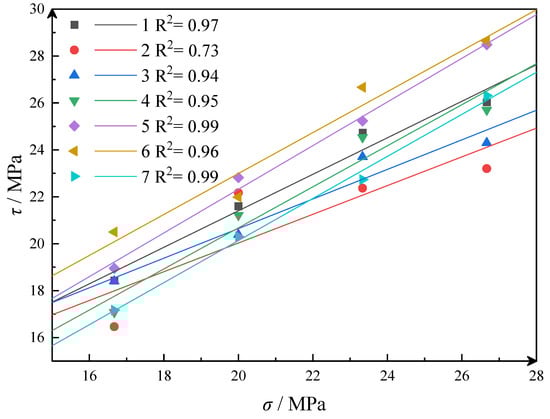
Figure 5.
The strength curve of seven shear indenters.
Table 3.
Values of c and φ measured for seven shear indenters.
Before in situ shear testing, the values of cohesion and friction angle were also fitted to data obtained from compression shear tests as well as conventional triaxial tests, the results of which are shown in Figure 6. The compression-shear fitting curve results in a cohesive force of 7.55 MPa and an internal friction angle of 33.67° for the specimen.
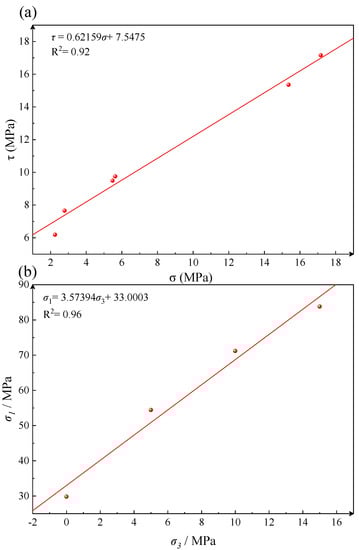
Figure 6.
Fitted curves for indoor test: (a) compression shear test (b) conventional triaxial test.
The slope of the conventional triaxial fitting curve is 3.57394, and the intercept is 33.0003. According to the Mohr–Coulomb strength criterion, using Equations (5) and (6), the cohesion of the specimen is 8.72 MPa, and the friction angle is 34.25°.
where M is the slope of the fitted curve and n is the intercept.
The variations in the c and φ values of the specimens under the action of different tooth heights, spacing, and angles are shown in Figure 7.
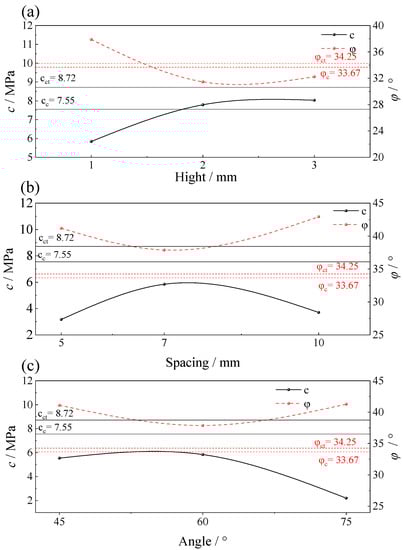
Figure 7.
Influence of different tooth heights, tooth spacing and tooth angles on c, φ: (a) height (b) spacing (c) angle. Note: φc and cc are measured by compression shear test, and φct and cct are measured by conventional triaxial test.
In Figure 7a, the measured cohesion is smaller than the indoor test results when the height is 1 mm, while the friction angle is larger. After increasing the height to 2 mm and 3 mm, the measured values of cohesion and friction angle are fairly close to the results of the two indoor tests. The cohesion is between the compression shear test and conventional triaxial test, and the friction angle is slightly smaller.
As shown in Figure 7b, when the tooth spacing is increased from 5 mm to 10 mm, the c-value change curve becomes inverted V-shaped, and there is a maximum cohesion at 8 mm, but all cohesions are smaller than conventional triaxial and compression shear tests. The variation in the φ-value is completely opposite to c.
As shown in Figure 7c, all c values are smaller than the results measured by indoor text, but φ values are larger. The c value remained stable for tooth angles below 60°, and when greater than 60°, the c values were significantly reduced. With the tooth angle increasing, φ values do not change significantly, and there is a minimum friction angle at 60.
4. Analysis of the Surface Morphology of Specimens Subject to Compression Loading
4.1. Theoretical Analysis of the Shear Indenter Press-In Process
During the intrusion of the shear indenter teeth, there is leapfrog intrusion, pressure bearing nucleation, and stabilization of the crushing angle, and the increase in load is not proportional to the increase in depth of tooth intrusion. After the load is applied, the load increase is first linearly related to the growth of the intrusion depth of the teeth, and when the load continues to increase to a certain value, the load suddenly decreases. Continuing to increase the load, this phenomenon is repeated, but the critical load value increases time by time, as shown in Figure 8.
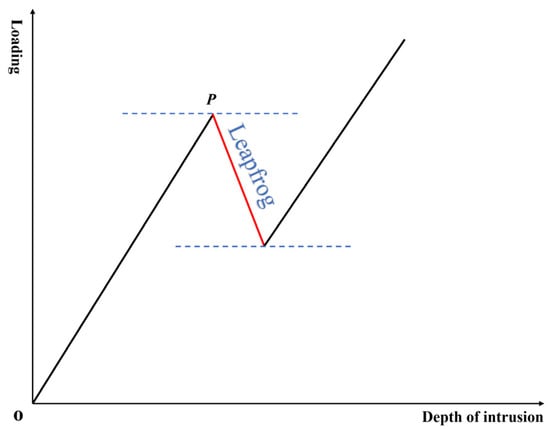
Figure 8.
Diagram of the leapfrog intrusion curve.
The direct cause of the leapfrog intrusion phenomenon is the pressure-bearing core. The pressure-bearing core is a pocket or spherical area of crushed or significantly deformed rock that occurs in front of the intrusion location before the rock is completely crushed, which is the load energy store and transmitter.
According to Yu’s theory [26], the process of shear indenter tooth intrusion into rock causing fragmentation can be divided into six stages: deformation stage, crack source emergence stage, pressure-bearing core emergence stage, pressure-bearing core energy storage stage, radial cracking and powder splitting stage, and unloading stage, as shown in Figure 9.
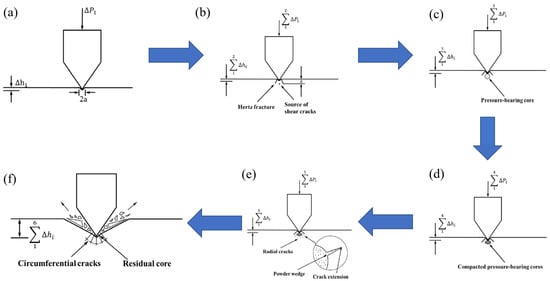
Figure 9.
Model of the intrusion damage mechanism (after Yu [26]): (a) deformation stage (b) crack source emergence stage (c) pressure-bearing core emergence stage (d) pressure-bearing core energy storage stage (e) radial cracking and powder splitting stage (f) unloading stage.
As the shear indenter intrudes into the interior of the rock, the source of the crack will be created at a distance a below the action surface, which will further develop into a spherical rock powder, and a pressure-bearing nucleus is formed. During the pressure-bearing nucleus storage stage, the pressure-bearing nucleus increases in density and changes shape to an ellipsoid but does not produce a new surface, becoming a bulk body with a high pressure transfer effect. In the radial cracking and powder splitting stage, the continued expansion of the bearing core causes rock powder to enter the radial crack, gradually leading to crack development at very high rates and forming leapfrog crushing. In the unloading stage, tensile stresses exceeding the tensile strength lead to the development of annular cracks, with most of the deformation energy being converted into kinetic energy to throw the crushed body out, and the rock body being completely destroyed.
4.2. Press-In Grooves Analysis
Different shear indenters cause different degrees of damage to the surface of the specimen, mainly in terms of the angle of the grooves and the size of the damaged area between the two teeth, as shown in Figure 10. To facilitate the observation of the angular range of the grooves after indentation, only the x and z coordinates are retained for the specimen surface damage area point data, and a front view of the specimen surface damage area can be obtained.
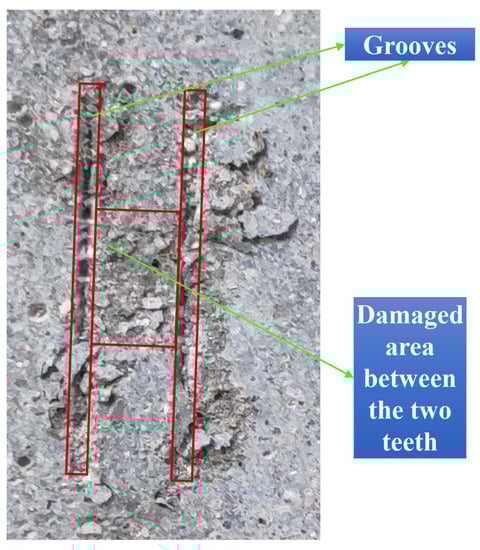
Figure 10.
Grooves and damaged area between the two teeth.
In Figure 11, the extent of the distribution of points between the two grooves indicates the extent of damage in the area between the two grooves. A comparison of Figure 11a–c shows that the damage area between the two grooves increases significantly when the height of the shear indenter is increased. Comparing Figure 11a,d,e as the spacing of the two grooves decreases, the damage area decreases. Comparing Figure 11a,f,g the change in tooth angle has little effect on the damage area between the two grooves. The results of the damage angle corresponding to each shear indenter are shown in Table 4.
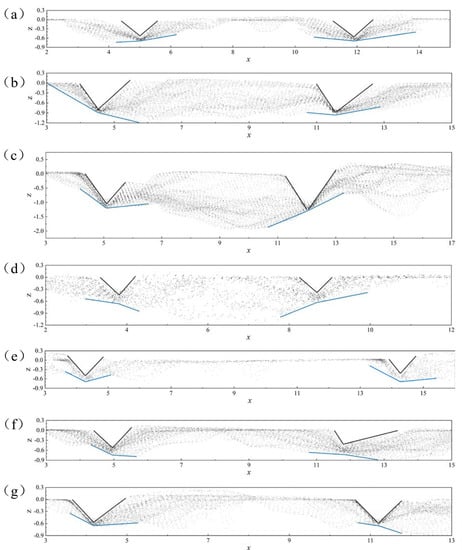
Figure 11.
Front view of the specimen pressed into damage with different shear indenters. (a) Shear indenter 1 (b) Shear indenter 2 (c) Shear indenter 3 (d) Shear indenter 4 (e) Shear indenter 5 (f) Shear indenter 6 (g) Shear indenter 7.
Table 4.
Angle of tooth mark statistics.
The two main components of the dent angle are considered: the minimum damage angle (βmin), which is the angle on the inside of the data area on both sides of the dent, as shown by the black line in Figure 11; and the maximum damage angle (βmax), which is the angle on the outermost side of the data area on both sides of the dent, as shown by the blue line in Figure 11.
Figure 12a shows that there is a strong linear relationship between the minimum damage angle and tooth height, with both the left and right minimum damage angles decreasing as the height increases. Figure 12b shows that there is a strong linear relationship between the maximum damage angle and tooth spacing, with the maximum damage angle decreasing with increasing spacing on both the left and right sides. Figure 12c shows that the minimum damage angle is linearly related to the tooth angle but increases linearly on the left and decreases linearly on the right. The left and right maximum damage angles also have opposite trends, with the left side having an inverted V-shaped trend.
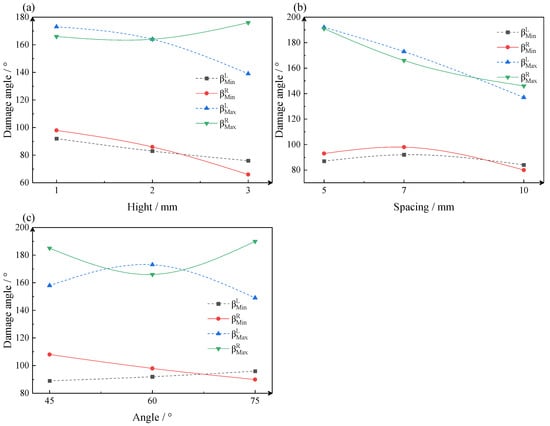
Figure 12.
Analysis of damage angles: (a) heights (b) spacing (c) angles.
5. Analysis of the Surface Morphology of Specimens Subject to Compression-Shear Loading
5.1. Processing of Morphological Data
Three-dimensional scanning technology can obtain high-precision point cloud data of the shear surface morphology of the specimens [41], and the processing of the scanned data includes cutting the image, transforming the coordinates, and extracting the point cloud data.
The 3D scan results in an STL format file, which translates the surface morphology into a large number of triangular faces that consist of three vertices and a normal vector. First, the STL format file is imported into 3dsMax software to extract the shear damage surface of the specimen. Then, the coordinate system is adjusted and imported into AutoCAD to convert the triangular surface into a 3D wireframe to obtain the 3D coordinate data of the shear damage surface of the specimen. Finally, it was imported into Origin software, and the 3D color mapped surfaces were drawn, as shown in Figure 13.
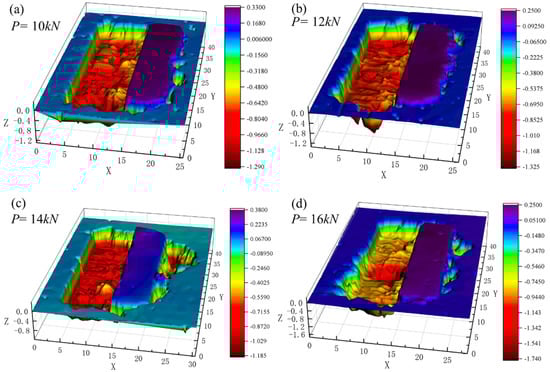
Figure 13.
Scan of the shear surface of shear indenter 3: (a) P =1 0 kN (b) P = 12 kN (c) P = 14 kN (d) P = 16 kN.
5.2. Parametric Analysis of Damage Surface Characteristics
To further analyze the damage characteristics of the postshear surface, point cloud data are now intercepted for the surface within the pressed-in postshear area, as shown in Figure 14.
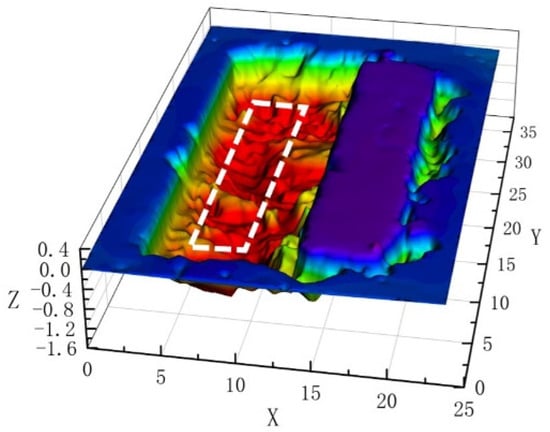
Figure 14.
Point cloud data area selection.
The YOZ plane is intercepted at 0.25 mm intervals on the x-axis, with the y-coordinate as the independent variable and the z-coordinate of the damaged surface on that YOZ plane as the dependent variable to establish a functional relationship.
For each curve, the characteristic parameters, such as the maximum value Zmax, minimum value Zmin, maximum-minimum difference Zpk, mean value Zmean, variance Zv, standard deviation Zs, kurtosis Zk, skewness ZSk, root mean square difference Z2 and JRC value were obtained, and the average value of each characteristic parameter of the encapsulated curve in the pressed-in area was taken as follows.
As shown in Figure 15, Zmax, Zmin and Zmean follow the same trend as the shear indenter and the normal force, both becoming smaller as the shear indenter tooth height increases (shear indenter 1, 2, and 3) and larger as the shear indenter tooth spacing increases, while the tooth angle and normal force have little effect. In terms of Zpk, shear indenters 2 and 3 are relatively small, while shear indenters 5 and 6 are relatively large and increase with increasing normal force.
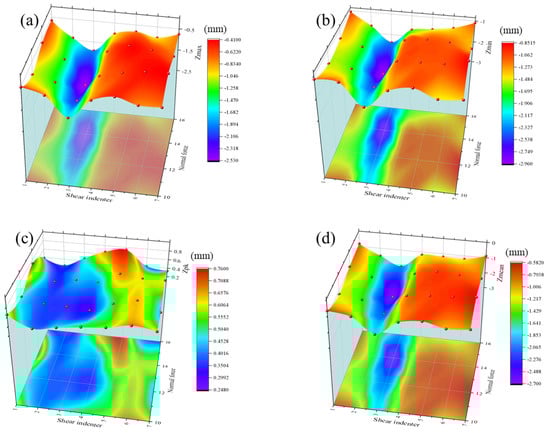
Figure 15.
3D clouds of characteristic parameters in the pressed-in area for different shear indenters and normal forces: (a) Zmax (b) Zmin, (c) Zpk (d) Zmean.
As shown in Figure 16, the trends of Zv, Zs and Z2 square are approximately the same, with shear indenters 2, 3, and 4 deviating less from the mean, indicating a less undulating damage surface, while shear indenters 5 and 6 have a more undulating damage surface.
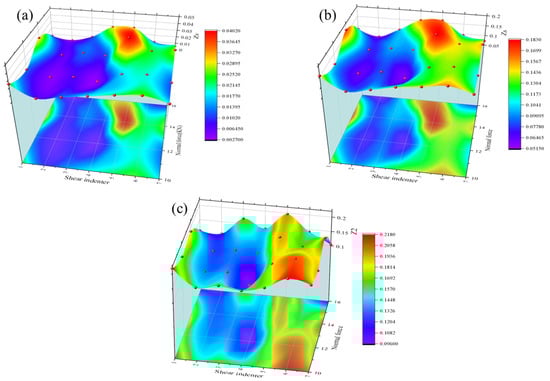
Figure 16.
3D clouds of characteristic parameters in the pressed-in area for different shear indenters and normal forces: (a) Zv (b) Zs (c) Z2.
As shown in Figure 17, Zk and ZSk are relatively random and have opposite relationships to each other, with the skewness being a valley where the kurtosis is a peak in the cloud plot. The kurtosis is approximately 3 in most of the pressed-in areas, and the distribution of Z values of the points in the damage surface is basically normal. However, when the positive stress is approximately 12 KN, the kurtosis of some of the shear heads (1, 2, 4, 5) after damage is significantly greater than 3, indicating that the Z value distribution of the points is very concentrated and that the damage surface is relatively flat. Shear head 5 is at a kurtosis less than 3, with a greater dispersion of Z values and a poorer flatness of the damage surface. The skewness represents the direction and degree of skewness of the Z value distribution of each point, which can be seen in the cloud plot as basically negative, i.e., negative deviation, indicating that the points within the shear plane are located in the depressed region and do not present a normal distribution as much as the top and bottom.
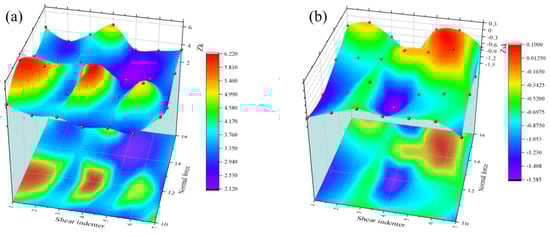
Figure 17.
3D clouds of characteristic parameters in the pressed-in area for different shear indenters and normal forces: (a) Zk (b) ZSk.
The JRC values are shown in Figure 18. Overall, as the normal stress increases, the JRC value of the damaged surface gradually decreases. Comparing curves 1, 2, and 3, the JRC value increases and then decreases as the shear indenter tooth height increases. Comparing curves 6, 1, and 7, the JRC value increases and then decreases as the shear indenter tooth angle increases. And comparing curves 4, 1, and 5, as the tooth spacing increases, there is no obvious pattern in the change of JRC value.
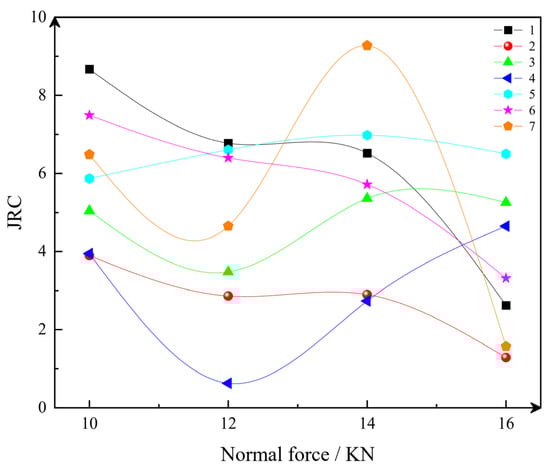
Figure 18.
JRC value of the damage surface.
The smaller JRC values for the damage surfaces of shear heads 2, 3, and 4 are consistent with the results of the statistical analysis. The test results for shear heads 2 and 3 are closer to those of the compression shear test and the conventional triaxial test, indicating that the flatter the shear surface during the test is, the closer the measured results are to those of the indoor test.
6. Conclusions
This paper introduces the rock borehole shear tester system composition, operation procedures, and test principles and designs an indoor testing device based on its principles to facilitate indoor research tests. It was used to conduct press-in tests and shear tests for three tooth heights, three kinds of tooth spacing, and three tooth angles, concluding that when using the RBST in rock engineering, the parameters of the shear indenter can be adjusted according to the actual lithology and other conditions. In the test, shear indenter 2 (height 2 mm, angle 60°, spacing 7 mm) and 3 (height 3 mm, angle 60°, spacing 7 mm) were the closest to the results of the compression shear test. The extent of damage to the surface of the sheared specimen and the surface of the pressed-in specimen was analyzed using three-dimensional scanning technology, and the following conclusions were drawn.
- (1)
- In connection with the trend of damage angle change, press-in surface statistical analysis, comparing the test results and the results of two indoor experiments, we found that as the tooth height increases, the flatness of the press-in damage surface increases, and the measured results will be closer to the compression shear test. When the tooth height is 2 mm and 3 mm, the measured shear strength index is close to the result of the compression shear test, which is more reliable.
- (2)
- As the spacing increases, the maximum damage angle and the damage surface between the grooves gradually decrease. The minimum damage angle first increases and then decreases, and the trend is consistent with the statistical analysis of the pressed-in surface. The trend of the minimum damage angle is consistent with the trend of the cohesion but opposite to the friction angle. At a spacing of 7 mm, both the cohesion and the friction angle are close to the results of the compression shear experiment and the reliability is relatively higher. However, the difference between the spacing variation group and the conventional triaxial test is large.
- (3)
- As the tooth angle increases, the left and right damage angles show an opposite trend. The minimum angle of destruction increases linearly on the left side and decreases linearly on the right side, but the damage area between the grooves remains essentially the same. Variations in tooth angle have little effect on the friction angle, but cohesion decreases significantly when the tooth angle exceeds 60°. When the angle is 60°, the measured shear strength index is closer to the indoor test results, and the reliability is relatively higher.
Author Contributions
Conceptualization, R.X.; data curation, J.H., G.W. and L.P.; formal analysis, S.M.; methodology, L.P.; validation, G.W.; writing—original draft, R.X.; writing—review & editing, J.H. and S.M.; funding acquisition, J.H. All authors have read and agreed to the published version of the manuscript.
Funding
This work was financially supported by the National Natural Science Foundation of China (grant number 41672298) and the National Key Research and Development Program of China (grant number 2017YFC0602901).
Data Availability Statement
The source data can be obtained in the article.
Acknowledgments
The authors gratefully acknowledge the support of National Natural Science Foundation of China (grant number 41672298) and the National Key Research and Development Program of China (grant number 2017YFC0602901).
Conflicts of Interest
The authors declare no conflict of interest.
References
- Handy, R.L.; Fox, N.S. A soil borehole direct shear test device. Highw. Res. News 1967, 27, 42–51. [Google Scholar]
- Handy, R.L. Borehole shear test and slope stability. In Proceedings of the In-Situ ‘86 Geotechnical Division, Blacksburg, VA, USA, 23–25 June 1986; pp. 161–175. [Google Scholar]
- Wineland, J.D. Borehole shear device. In Proceedings of the Conference on In-Situ Measurement of Soil Properties, Raleigh, NC, USA, 1–4 June 1975; pp. 511–522. [Google Scholar]
- Pan, Y.-W.; Liao, J.-J.; Huang, A.-B.; Chang, J.-C.; Liao, H.-J. Improved design and data interpretation of a multi-purpose borehole testing device for soft rock. Int. J. Rock Mech. Min. Sci. 2006, 43, 562–571. [Google Scholar] [CrossRef]
- Jia, Z.X.; Wang, X.G.; Zhao, Y.F.; Wang, Y.J. Application and improvement of rock borehole in-situ test technology. Chin. J. Rock Mech. Eng. 2013, 32, 1264–1269. (In Chinese) [Google Scholar]
- Ding, Y.; Yang, Q.; Xia, Z.Y.; Xu, W.N. In-situ shear tests on base material soil-rock interface in ecological slope protection system. Rock Soil Mech. 2015, 36, 383–388. [Google Scholar] [CrossRef]
- Higgins, J.D.; Rockaway, J.D. Use of the rock borehole shear tester in soft strata. In Proceedings of the Program and Abstracts: 22nd Annual Meeting of Association of Engineering Geologists, Chicago, IL, USA, October 1979. [Google Scholar]
- Higgins, J.D.; Rockaway, J.D. Application of the rock borehole shear test to soft strata. In Proceedings of the 18th Annual Engineering Geology and Soils Engineering Symposium, Boise, ID, USA, April 1980; pp. 179–186. [Google Scholar]
- Pitt, J.M.; Rohde, J.R. Rapid assessment of shear strength and its variability. In Proceedings of the 25th Symposium on Rock Mechanics: Rock Mechanics in Productivity and Protection, Evanston, IL, USA, 25–27 June 1984; pp. 428–436. [Google Scholar]
- Oyanguren, P.R.; Nicieza, C.G.; Fernández, M.; Palacio, C.G. Stability analysis of Llerin Rockfill Dam: An in situ direct shear test. Eng. Geol. 2008, 100, 120–130. [Google Scholar] [CrossRef]
- Wang, Y.J.; Zhao, Y.F.; Zeng, X.X.; Xu, J.C.; Liu, L.P. An in-situ method for determining shear strength parameters of rock masses and its applications. Rock Soil Mech. 2011, 32, 779–786. [Google Scholar]
- Li, Z.M.; Chen, L.L.; Wu, F.; Wan, L. In Situ Test Study on Shear Strength Properties of Weathered Silty Mudstone. Adv. Mater. Res. 2011, 146–147, 10–13. [Google Scholar] [CrossRef]
- Zhao, Y.; Wang, X.; Zhang, X.; Jia, Z.; Zeng, X.; Zhang, H. Rock borehole shear tests in dam foundation of Xiangjiaba hydropower station. J. Rock Mech. Geotech. Eng. 2012, 4, 360–366. [Google Scholar] [CrossRef]
- Li, B.; Jiang, Y.; Mizokami, T.; Ikusada, K.; Mitani, Y. Anisotropic shear behavior of closely jointed rock masses. Int. J. Rock Mech. Min. Sci. 2014, 71, 258–271. [Google Scholar] [CrossRef] [Green Version]
- Nizametdinov, F.K.; Nagibin, A.A.; Levashov, V.V.; Nizametdinov, R.F.; Kasymzhanova, A.E.; Nizametdinov, N.F. Methods of in situ strength testing of rocks and joints. J. Min. Sci. 2016, 52, 226–232. [Google Scholar] [CrossRef]
- Lv, X.; Zhou, H. Soil–rock mixture shear strength measurement based onin situborehole pressure-shear tests. J. Geophys. Eng. 2018, 15, 2221–2234. [Google Scholar] [CrossRef] [Green Version]
- Han, G.; Meng, B.; Jing, H.; Wu, J. Field Experimental Study on the Broken Rock Zone of Surrounding Rock and the Rock Borehole Shear Tests of the Large Deformation Tunnel. Adv. Mater. Sci. Eng. 2019, 2019, 1753518. [Google Scholar] [CrossRef] [Green Version]
- Tan, X.; Ren, Y.-K.; Li, T.-L.; Zhou, S.-H.; Zhang, J.-C.; Zhou, S.-K. In-situ direct shear test and numerical simulation of slate structural planes with thick muddy interlayer along bedding slope. Int. J. Rock Mech. Min. Sci. 2021, 143, 104791. [Google Scholar] [CrossRef]
- Ishida, T.; Kanagawa, T.; Kanaori, Y. Source distribution of acoustic emissions during an in-situ direct shear test: Implications for an analog model of seismogenic faulting in an inhomogeneous rock mass. Eng. Geol. 2010, 110, 66–76. [Google Scholar] [CrossRef] [Green Version]
- Sanei, M.; Faramarzi, L.; Fahimifar, A.; Goli, S.; Mehinrad, A.; Rahmati, A. Shear strength of discontinuities in sedimentary rock masses based on direct shear tests. Int. J. Rock Mech. Min. Sci. 2015, 75, 119–131. [Google Scholar] [CrossRef]
- Rahimi, R.; Nygaard, R. Comparison of rock failure criteria in predicting borehole shear failure. Int. J. Rock Mech. Min. Sci. 2015, 79, 29–40. [Google Scholar] [CrossRef]
- Rahimi, R.; Nygaard, R. Effect of rock strength variation on the estimated borehole breakout using shear failure criteria. Géoméch. Geophys. Geo-Energy Geo-Resour. 2018, 4, 369–382. [Google Scholar] [CrossRef]
- André, D.; Jebahi, M.; Iordanoff, I.; Charles, J.-L.; Néauport, J. Using the discrete element method to simulate brittle fracture in the indentation of a silica glass with a blunt indenter. Comput. Methods Appl. Mech. Eng. 2013, 265, 136–147. [Google Scholar] [CrossRef] [Green Version]
- Yang, D.; Hu, J.; Ma, S.; Zeng, P. Analysis of dynamic fracture of granite after uniaxial recompression predamaged by high confining pressure cyclic loading based on acoustic emission. Eng. Fract. Mech. 2022, 266, 108414. [Google Scholar] [CrossRef]
- Cook, R.F. Fracture sequences during elastic–plastic indentation of brittle materials. J. Mater. Res. 2019, 34, 1633–1644. [Google Scholar] [CrossRef]
- Yu, J. Rules of rock fragmentation with mechanical methods and model of rock failure mechanism. J. Chin. Coal Soc. 1982, 3, 10–18. (In Chinese) [Google Scholar]
- Sun, W.; Zhang, X.; Zhao, K.S. Multi-Stage Force Prediction Model of Single Disc Cutter Based on the Dense Nuclear Theory. Machin. Design Manufact. 2015, 6, 9–12. (In Chinese) [Google Scholar]
- Zhou, Z.L.; Liu, Y.L.; Zhao, Y.L.; Wu, Z.B.; Chen, L. Numerical Analysis on Breaking Rock by Pick-shaped Cutter at Different Confining Pressure and Invasion Angle. World Sci. Tech. R D 2016, 38, 598–603. (In Chinese) [Google Scholar]
- Tian, T.Y.; He, B.; Wang, S.J.; Xie, X.B.; Tang, J.Y. Microscomic Numerical Study for Mechanism of Sequential Fragmentation by Concial Picks and Corresponding Cutter Spacing Optimization. Min. Metallurg. Eng. 2018, 38, 30–34. [Google Scholar]
- Hu, J.H.; Wen, G.P.; Pang, L.; Yang, D.J.; Qin, Y.G.; Ma, S.W. A Device and Method for Testing the Cohesion and Friction Angle of Rocks. Chinese Patent Application CN111781058B, 15 June 2021. [Google Scholar]
- Yang, M.; Yang, Y.; Zhao, B. Study on the Proportion of Conglomerate Similar Materials Based on the Orthogonal Test. Shock Vib. 2021, 2021, 6657323. [Google Scholar] [CrossRef]
- Song, Y.; Liu, B.; Liu, H.; Shi, X.; Ren, D.; Yu, M. A method to obtain artificial sandstone joint specimens for the description of permeability anisotropy-based joint shear deformation. Géoméch. Geophys. Geo Energ Geo Res. 2021, 7, 43. [Google Scholar] [CrossRef]
- Hong, C.; Li, X.; Zhao, G.; Jiang, F.; Li, M.; Zhang, S.; Wang, H.; Liu, K. Preparation and multi-properties determination of radium-containing rocklike material. IOP Conf. Ser. Earth Environ. Sci. 2018, 121, 052018. [Google Scholar] [CrossRef] [Green Version]
- Hu, J.; Wen, G.; Lin, Q.; Cao, P.; Li, S. Mechanical properties and crack evolution of double-layer composite rock-like specimens with two parallel fissures under uniaxial compression. Theor. Appl. Fract. Mech. 2020, 108, 102610. [Google Scholar] [CrossRef]
- Jiang, Q.; Yang, B.; Yan, F.; Xu, D.; Feng, G.; Li, S. Morphological features and fractography analysis for in situ spalling in the China Jinping underground laboratory with a 2400 m burial depth. Tunn. Undergr. Space Technol. 2021, 118, 104194. [Google Scholar] [CrossRef]
- Chen, F.; Yu, H.; Yang, Y.; Wu, D. Influences of Roughness Sampling Interval and Anisotropy on Shear Failure Mechanism of Rock Joint Surface. Energies 2021, 14, 6902. [Google Scholar] [CrossRef]
- Battulwar, R.; Zare-Naghadehi, M.; Emami, E.; Sattarvand, J. A state-of-the-art review of automated extraction of rock mass discontinuity characteristics using three-dimensional surface models. J. Rock Mech. Geotech. 2021, 13, 920–936. [Google Scholar] [CrossRef]
- Barton, N.R. A relationship between joint roughness and joint shear strength. Rock Fracture. In Proceedings of the International Symposium of Rock Mechanics, Nancy, France, 4–6 October 1971. [Google Scholar]
- Barton, N.; Choubey, V. The shear strength of rock joints in theory and practice. Rock Mech. Rock Eng. 1977, 10, 1–54. [Google Scholar] [CrossRef]
- Zhang, G.; Karakus, M.; Tang, H.; Ge, Y.; Zhang, L. A new method estimating the 2D Joint Roughness Coefficient for discontinuity surfaces in rock masses. Int. J. Rock Mech. Min. Sci. 2014, 72, 191–198. [Google Scholar] [CrossRef]
- Mo, P.; Li, Y. Estimating the three-dimensional joint roughness coefficient value of rock fractures. Bull. Eng. Geol. Environ. 2019, 78, 857–866. [Google Scholar] [CrossRef] [Green Version]
- Yu, X.B.; Vayssade, B. Joint profiles and their roughness parameters. Int. J. Rock Mech. Min. Sci. Geomech. Abstr. 1991, 28, 333–336. [Google Scholar] [CrossRef]
Publisher’s Note: MDPI stays neutral with regard to jurisdictional claims in published maps and institutional affiliations. |
© 2022 by the authors. Licensee MDPI, Basel, Switzerland. This article is an open access article distributed under the terms and conditions of the Creative Commons Attribution (CC BY) license (https://creativecommons.org/licenses/by/4.0/).