Abstract
The Arctic region of Russia is rich with natural water resources. Some residents of this area prefer to use water from spring sources instead of tap water. However, the elemental composition for most of the springs is unknown, making it very important to regularly update water quality data. In this paper, the chemical composition of 24 natural springs near large cities of the Murmansk region were identified via titration, potentiometry, and mass spectrometry analysis with the low detection limits. The concentrations of a considerable number of micro-components have been determined for the first time. Concentrations of some hazardous pollutants have been found in spring water that exceed Russian hygienic limits by 2.5 times. In terms of chemical indicators, it was shown that in accordance with European and national water standards, only half of the tested natural water sources in the Murmansk region can be used for drinking water. The preferential spring was recommended near each major city in the region according to a set of chemical parameters. The results of chemical composition of the spring waters were disseminated publicly by placing the tags with QR codes with the link to the cloud storage near each studied spring.
1. Introduction
According to the World Health Organization (WHO), the main factors that affect human health are living conditions and habits (52–53%), genetic factors (20%), state of the environment (20%), and medical support (7–8%). Human health is closely related to drinking water quality [1,2,3,4]. Concentrations of chemical elements contained in drinking water must meet hygienic standards to maintain a water and salt balance for body homeostasis and prevent possible toxic effects [5]. Excessive concentrations of chemical elements in water can cause health problems due to both acute and chronic (months and years) toxic effects. For example, nitrates are constantly present in the human body in small amounts, but problems associated with the formation of methemoglobin, which is unable to carry oxygen, may develop with an increase in the concentration of nitrates, which leads to oxygen starvation [6,7,8,9]. This is extremely dangerous when experiencing symptoms from diseases such as COVID-19 [10,11,12]. A particular danger occurs when high quantities of potentially toxic elements, the effects of which do not appear immediately, are contained in water, because the diseases they cause are chronic [2,13,14,15,16].
Most trace elements are potentially toxic to the human body [17] in high concentrations, whereas some of them are essential for humans in small amounts as microelements (Table 1).

Table 1.
The physiological functions of certain chemical elements on the human body.
The growing pollution of freshwater systems through emissions from industrial enterprises is one of the key environmental problems facing humanity around the world [31,32]. Even though most pollutants are present in low concentrations, they can accumulate in the body and cause serious toxicological problems [33,34,35]. About 884 million people worldwide do not have basic access to sanitary drinking water sources [36]. Four billion people experience severe water shortages for at least one month per year [37]. Back in 2010, the journal Nature showed that almost 80% of the world’s population is threatened by water pollution [38]. There is a growing distrust of tap water, so people in cities increasingly choose bottled or spring water for drinking [17,39].
People living in the extreme natural conditions of the Arctic regions experience constant high stress on their health due to factors such as the polar night and polar day, the unstable geomagnetic field, the long winter period, and the small number of sunny days throughout the year [40]. In this regard, issues related to the health of the population in such regions are extremely relevant.
The city of Murmansk, with a population of over 280,000 people, is the largest city in the world above the Arctic Circle [41]. It is located on the Kola Peninsula along the coast of the Barents Sea, which is part of the Arctic Ocean. The intensive development of the region, which has a population of more than 700,000 people, refused from the discovery of numerous deposits of mineral resources, which have been actively developed since the first half of the 20th century. Their extraction, processing, and transportation has a constant negative impact on the environment, including pollution of both soils [42,43] and water bodies [4,44,45,46,47,48,49,50,51,52]. At the same time, the territory of the peninsula is marked on the map “Global geography of incident threat to human water security and biodiversity” as an area with a low risk of possible pollution. However, the groundwaters of the region are characterized by low protection and can be easily polluted [50]. Therefore, using this groundwater for drinking purposes, without proper controls, can be dangerous to human health. The population is only fragmentarily informed about the quality of spring waters The purpose of this work was to study and make public the chemical composition of the most popular spring waters in the Murmansk region, Russia (Kola peninsula, Russian Arctic zone). The study included the following steps: (i) to sample spring water and to determine the content of both macro-components and previously obscure micro-components, including potentially toxic elements with a low detection limit; (ii) to determine the water quality by comparison the results with international [9,53,54] and Russian national standards [55,56]; (iii) to make the results publicly available by placing the tags with QR codes (with the link to the cloud storage with data set) near each studied spring.
2. Materials and Methods
2.1. Study Area and Sampling
The Murmansk Region is in the northwest of the Russian Federation. It borders Finland and Norway in the west and northwest and is washed by the White and Barents Seas. The Murmansk region’s total area is 144,900 km2. The greatest length from west to east is about 550 km, from north to south, 400 km. Almost the entire territory lies north of the Arctic Circle and is located on the Kola Peninsula. Only the western and southwestern parts of the region connect to the mainland. The Murmansk region is one of the most lacustrine and riverine areas in Russia. The density of the river network is significant; some rivers have lengths of over 200 km. The climate of the Murmansk region is arctic-temperate and maritime, but it is influenced by the warm North Atlantic current, making it relatively mild. In the north of the peninsula the average temperature in winter is −14 °C, in summer, +14 °C. In the center and south of the peninsula during the winter months, frosts reach −40 to −50 °C. The average annual rainfall is about 400 mm [57].
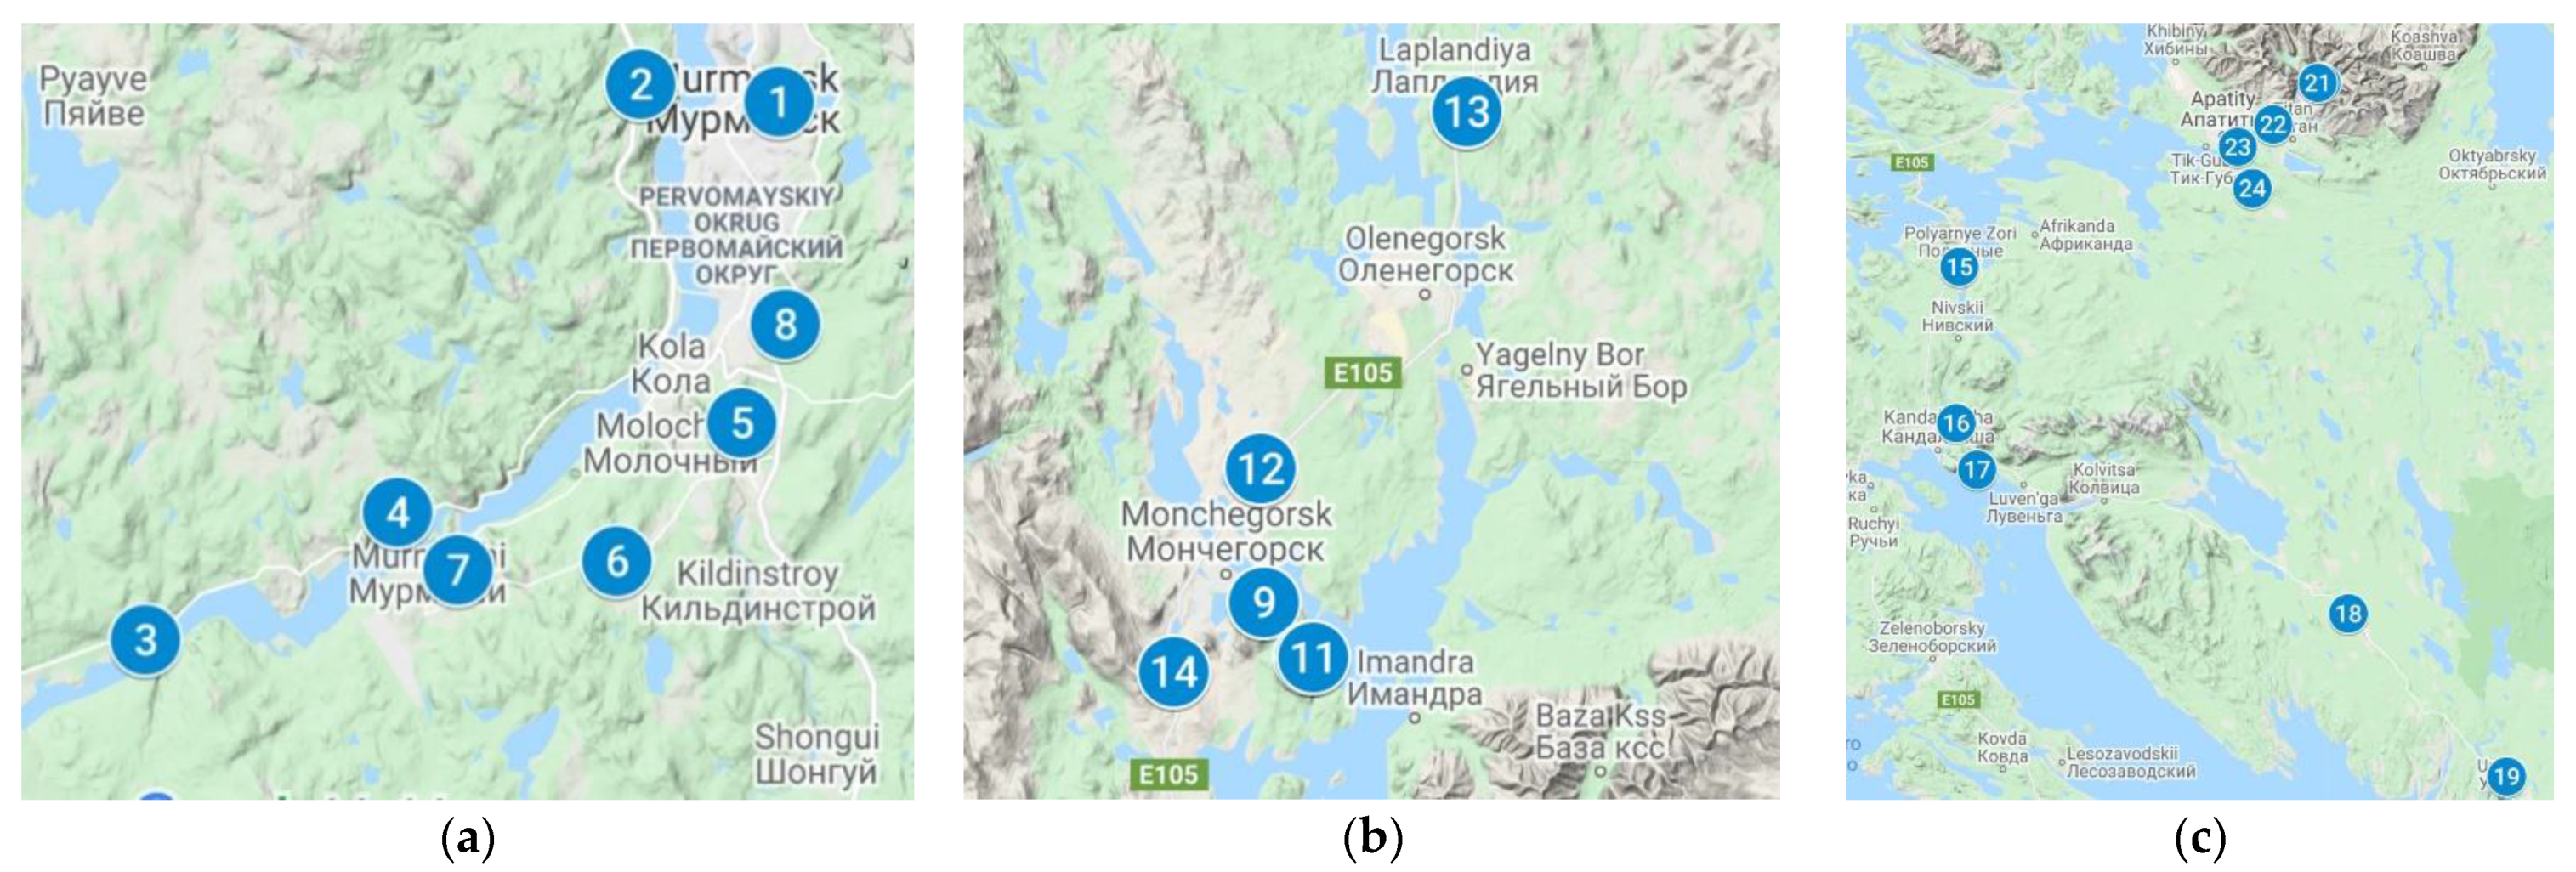
The Murmansk region is one of the most urbanized regions of Russia; the population as of 1 January 2021, was 732,000 people. The largest cities in the region are Murmansk (282,851), Apatity (53,847), Monchegorsk (40,675), Kandalaksha (29,750), Kirovsk (25,944), and Olenegorsk (19,887) [39]. In this study, the elemental composition in the water of the most popular springs near or within the territory of large cities in the region was studied (Figure 1). All springs are easily accessible and used daily by the local citizens. The spring map is available by link [58] or by QR code (Figure 1c).
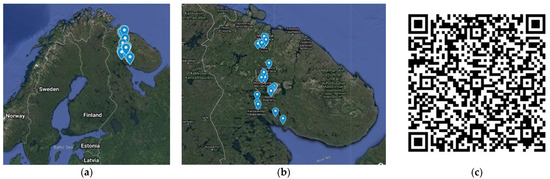
Figure 1.
(a,b) Sampling points within the Murmansk region, Russia; (c) QR code for access to google map with marked selection points.
Overall, 24 springs were examined from 19 September to 4 October 2021 (Table 2).
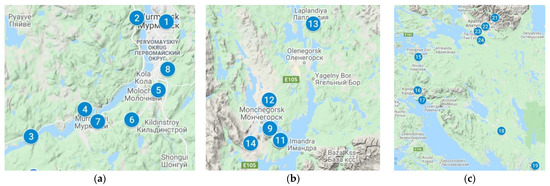
Table 2.
Coordinates, type and location of the investigated springs, air and water temperature, pH and flow rate at the time of sampling.
Figure 2.
Sampling points. (a) Murmansk and Kola district; (b) Monchegorsk district; (c) Kandalaksha district and Apatity-Kirovsk district.
Table 2.
Coordinates, type and location of the investigated springs, air and water temperature, pH and flow rate at the time of sampling.
| № | Type | Location | Coordinates | T Air, °C | T Water, °C | Yield of Water, L/s |
|---|---|---|---|---|---|---|
| Murmansk and Kola district (Figure 2a) | ||||||
| 1 | Descending | On the city outskirts, 50 m east of the Chapel | 68°58′19.2″ N 33°07′10.7″ E | 9.0 | 5.6 | * |
| 2 | Descending | 200 m west of the roads’ junction to Abram-Mys, Murmansk and Nikel | 68°58′42.4″ N 32°59′10.9″ E | 7.0 | 6.1 | 0.04 |
| 3 | Descending | Between 24 and 25 km of the Murmansk-Verkhnetulomsky highway, on the right, 15 m north of the road | 68°47′18.6″ N 32°31′01.3″ E | 8.7 | 2.9 | 0.27 |
| 4 | Ascending | On the village outskirts, 150 m north of the Murmansk-Verkhnetulomsky highway | 68°49′53.3″ N 32°45′15.7″ E | 6.8 | 3.1 | 0.65 |
| 5 | Descending | Between 2 and 3 km of the Kola-Zverosovkhoz highway, 50 m west of the road | 68°51′43.4″ N 33°05′01.0″ E | 5.0 | 4.3 | 0.10 |
| 6 | Descending | Between 7 and 8 km of the upper airport street, 10 m north of the road | 68°48′55.4″ N 32°57′53.2″ E | 4.2 | 3.3 | 0.11 |
| 7 | Descending | In the lowland, 40 m east of residential buildings | 68°48′43.4″ N 32°48′50.9″ E | 3.9 | 3.0 | 0.21 |
| 8 | Descending | Between 7 and 8 km of the ring road around Murmansk, 50 m west of the road bridge | 68°53′46.0″ N 33°07′23.5″ E | 2.2 | 4.9 | 0.05 |
| Monchegorsk district (Figure 2b) | ||||||
| 9 | Descending | Southeastern city outskirts, 150 m southeast of the sports school building | 67°55′20.9″ N 32°57′28.6″ E | 6.9 | 5.0 | 0.33 |
| 10 | Self-flowing well | 8 km of the Monchegorsk-Rizh-Guba highway, 200 m north-east of the bus stop | 67°52′59.8″ N 33°02′53.8″ E | 7.6 | 5.1 | 0.40 |
| 11 | Self-flowing well | 8 km of the Monchegorsk-Rizh-Guba highway, 250 m north-east of the bus stop | 67°53′01.3″ N 33°02′59.5″ E | 8.2 | 2.9 | 0.35 |
| 12 | Ascending | Between 1271 and 1272 km of the E105 highway, 50 m southeast of the highway | 68°01′02.7″ N 32°57′19.1″ E | 7.4 | 2.6 | ** |
| 13 | Self-flowing exploration well | 250 m east of the roads’ junction to the Laplandia station along the E105 highway | 68°16′09.4″ N 33°20′28.8″ E | 9.2 | 3.6 | 0.20 |
| 14 | Ascending | Near 1253 km of the E105 highway, 120 m south-west of the highway | 67°52′22.7″ N 32°47′13.4″ E | 6.3 | 3.8 | ** |
| Kandalaksha district (Figure 2c) | ||||||
| 15 | Descending | Between 1179 and 1180 km of the E105 highway, 5 m north-west of the highway | 67°23′42.8″ N 32°28′54.8″ E | 12.2 | 4.1 | 0.018 |
| 16 | Descending | The near-channel part of the left bank of the Niva River, 100 m downstream of the bridge | 67°11′15.2″ N 32°28′11.8″ E | 11.1 | 4.4 | 0.020 |
| 17 | Descending | Between 6 and 7 km of the Kandalaksha-Umba highway, 5 m north of the highway | 67°07′28.6″ N 32°32′36.6″ E | 13.2 | 4.0 | 0.14 |
| 18 | Ascending | Between 71 and 72 km of the Kandalaksha-Umba highway, 15 m east of the highway | 66°55′58.0″ N 33°49′02.4″ E | 12.5 | 5.4 | ** |
| 19 | Descending | The territory of the farm fellowship | 66°42′38.4″ N 34°21′26.8″ E | 11.7 | 3.8 | 0.26 |
| Apatity-Kirovsk district (Figure 2c) | ||||||
| 20 | Self-flowing exploration well | 150 m south-west of the nunnery in the foothills of the Khibiny mountains | 67°38′11.1″ N 33°43′20.8″ E | 12.3 | 3.4 | ** |
| 21 | Self-flowing exploration well | 25 m west of the road in the foothills of the Khibiny mountains | 67°38′10.2″ N 33°42′45.3″ E | 11.5 | 3.4 | ** |
| 22 | Mixed | Between 8 and 9 km of the Apatity-Kirovsk highway, 30 m south of the highway | 67°34′56.4″ N 33°33′26.9″ E | 11.8 | 3.3 | ** |
| 23 | Self-flowing well | The eastern outskirts of Apatity, in the area of a garage cooperative | 67°33′12.5″ N 33°26′09.9″ E | 11.1 | 3.7 | 0.27 |
| 24 | Ascending | Southeast of the city of Apatity, between 7 and 8 km of the Apatity-Khibiny airport highway, 1.5 km to the left of the road | 67°29′55.6″ N 33°29′17.3″ E | 10.0 | 8.4 | ** |
* it was impossible to determine the flow rate, water accumulates in the well; ** it was impossible to determine the flow rate, too large a head or several flows.
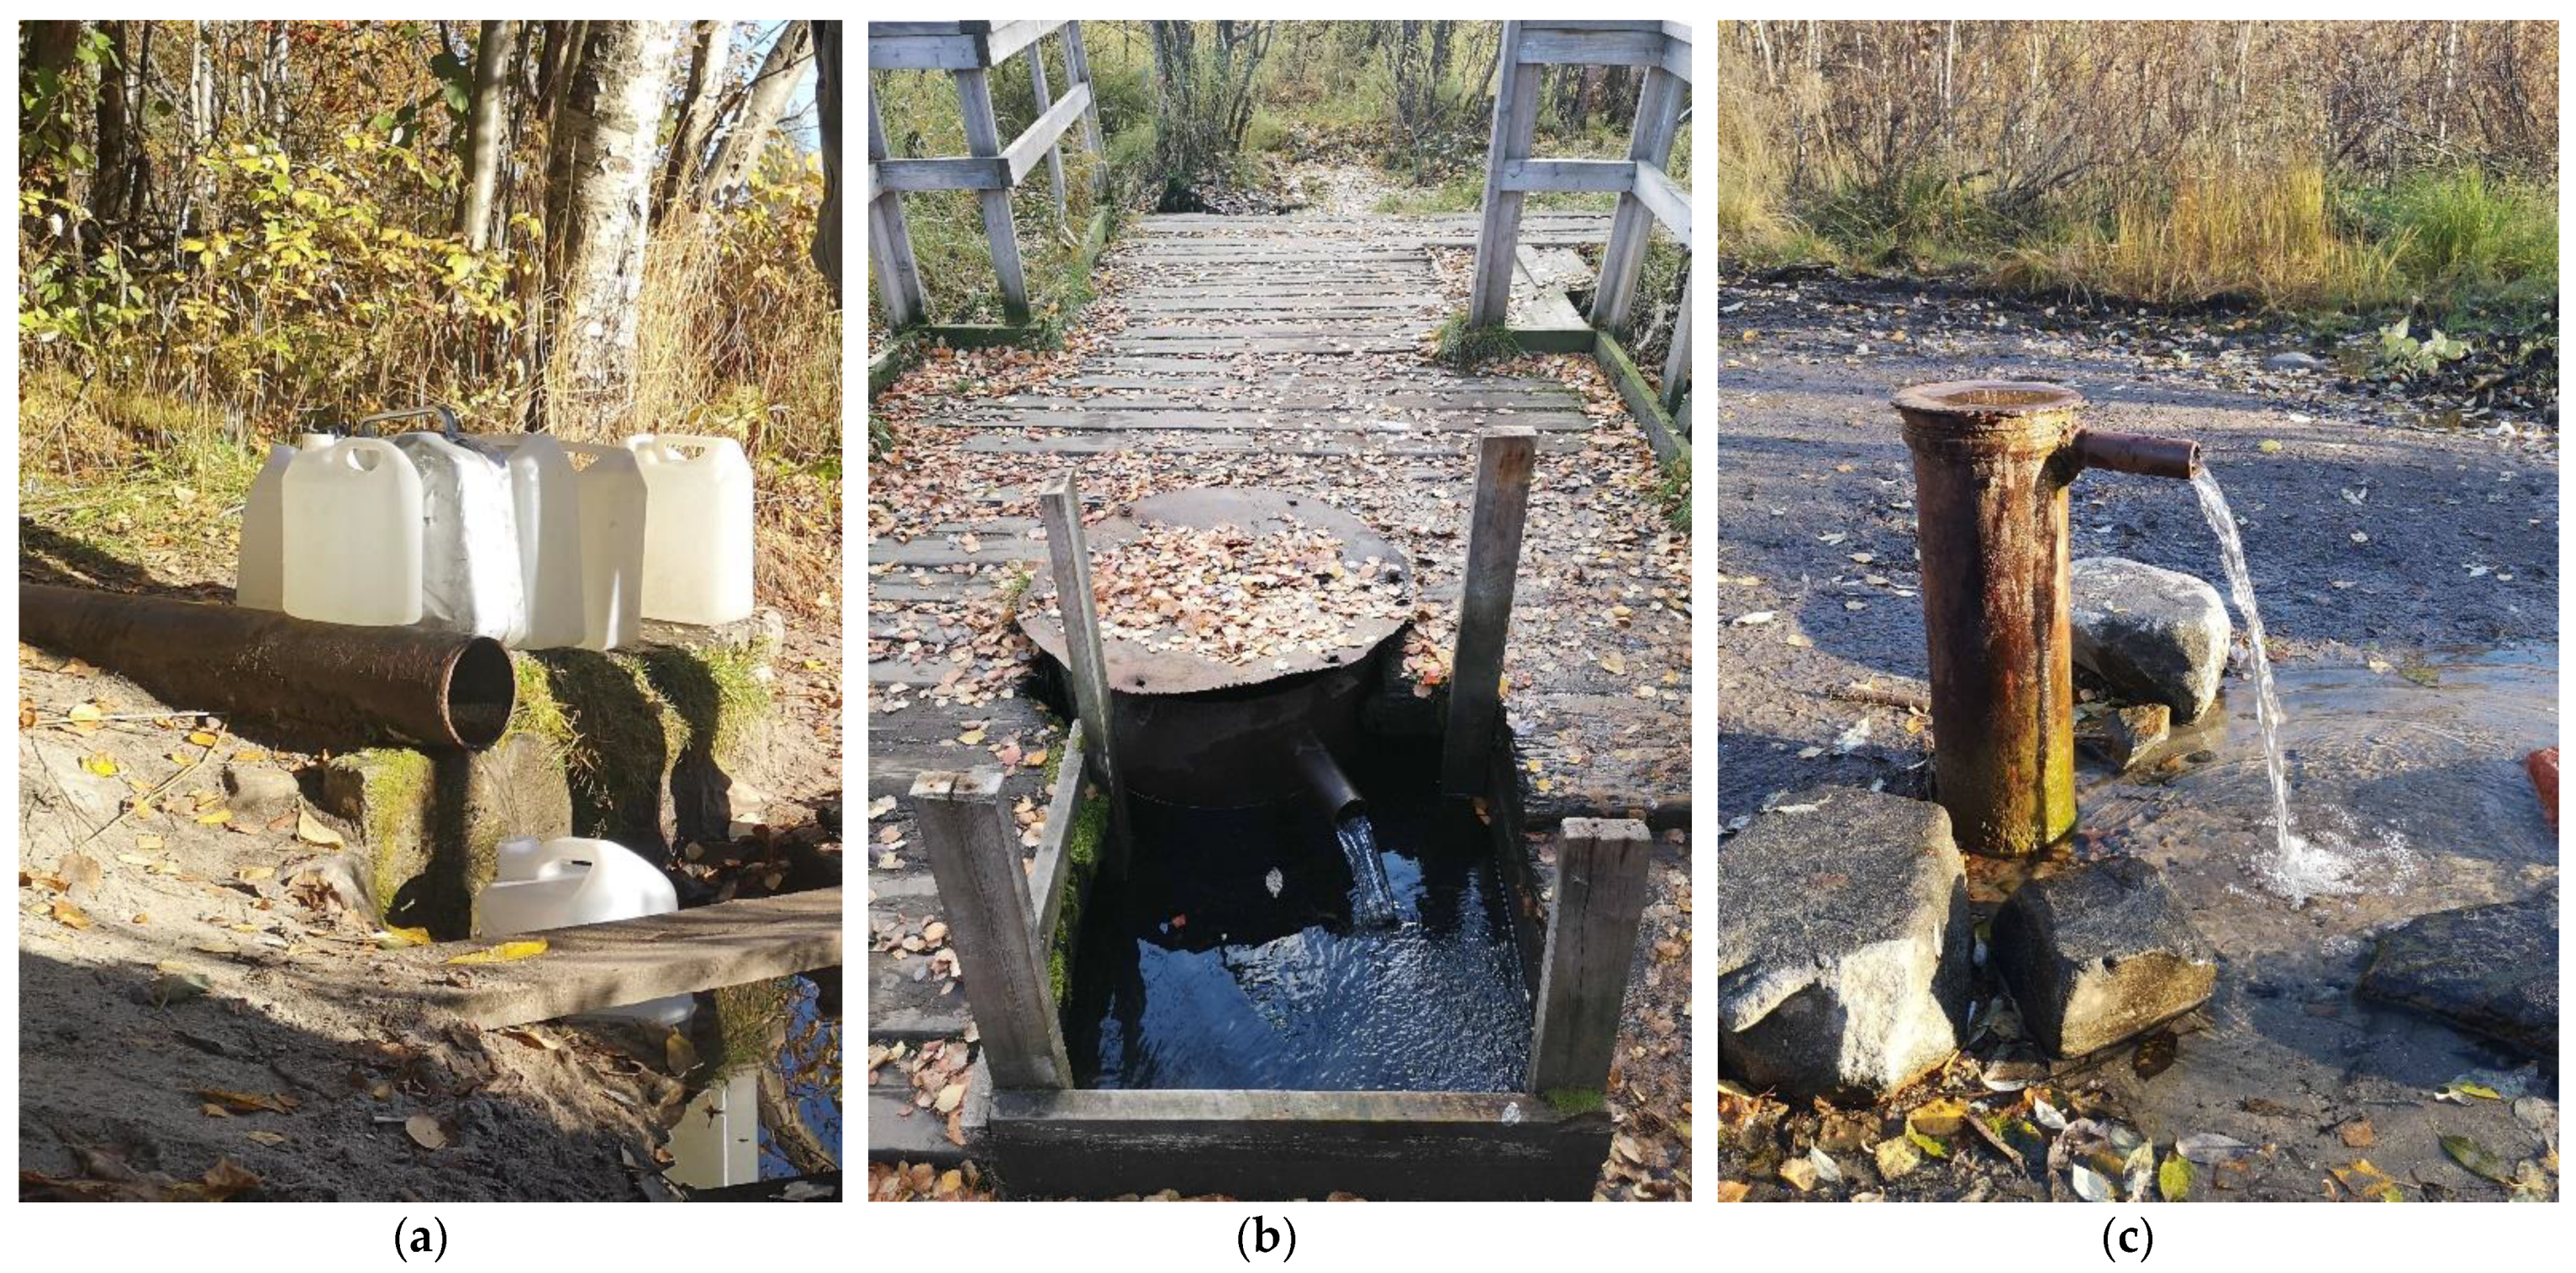
The appearance of various types of springs is shown in Figure 3.
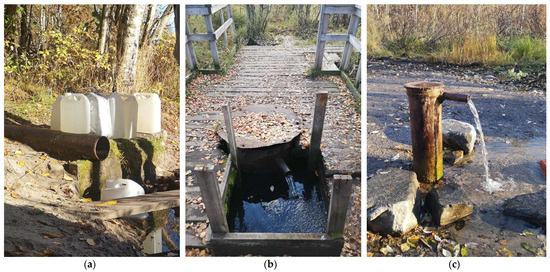
Figure 3.
Types of springs: descending (a), ascending (b) and self-flowing well (c).
2.2. Sample Collection and Analysis
Water samples for the element analysis were collected into disposable plastic test-tubes with a volume of 50 mL (n = 2) and preserved with 0.5 mL nitric acid (puriss. spec. 27-5, Russian government standard GOST 11125-84). For the determination of the ionic compositions, the probes were collected and loaded into pre-prepared disposable plastic bottles with a volume of 1 L (n = 2). All collected samples were stored in a portable refrigerator and transported in an automobile at a constant temperature of 5 °C.
The waters were analyzed by a mass spectrometer, with inductively coupled plasma (Perkin Elmer ELAN 9000 DRC-e, Waltham, MA, USA). Multielement calibration solutions from Inorganic Ventures (Christiansburg, VA, USA) (IV-STOCK-29, IV-STOCK-21, IV-STOCK-28) were used for instrument calibration. Standard reference materials were used for quality control: V-STOCK-1643 Trace Elements in Fresh Water (High Purity Standards, Charleston, SC, USA). The pH values of the solutions and the concentration of chloride- and nitrate-ions were determined by the potentiometric method using the ionomer EXPERT-001 (Econix-Expert, Moscow, Russia), which was equipped with two ion-selective electrodes—a nitrate-selective electrode (ELIT-021, Nico Analit, Moscow, Russia) and a chloride-selective electrode (ECOM-Cl, Econix, Moscow, Russia)—in combination with the reference electrode ESr-10101 (Izmeritelnaya tekhnika, Moscow, Russia). As a buffer solution for the determination of nitrate-ions, a potassium alum of 1% and a phosphate buffered saline was used; for the determination of chloride-ions, a 1 M solution of KNO3 was used. To control the quality of the measurements, a standard sample of nitrate ions GSO 6696-93, chloride ions GSO 6687-93, and GSO composition of water 7886-2001 were used. The hydrocarbonate content in the water was determined by the titrimetric method, and a standard sample GSO 8403-2003 of the hydrocarbonate solution was used for checking the measurement quality. Water and air temperature was measured using a HI 145 thermometer (Hanna Instruments, Woonsocket, RA, USA). The pH was determined directly during sample collecting using a TDS-3 temperature sensor to consider the thermal compensation effect.
3. Results and Discussion
Table 3 and Table 4 summarize the results of the analysis of 24 samples collected for the determination of macro- and micro-components, respectively. The standards of the World Health Organization (WHO) [9], United States Environmental Protection Agency (USEPA) [54], European Commission (EC) [53], and Russian Sanitary and Epidemiological Rules and Norms (SanPiN) 1.2.3685-21 (Hygienic standards and requirements for ensuring the safety and (or) harmlessness to humans of environmental factors) [56] and 2.1.4.1116-02 (Drinking water. Hygienic requirements for the quality of bottled water. Quality control) [55] are provided for comparison. It should be noted that SanPiN 2.1.4.1116-02 establishes a higher standard for maximum permissible concentration (MPC) for drinking bottled water of the first and highest categories.
Table 3.
Content of macro components, anions, pH, and total hardness in spring water.
Table 4.
Content of microelements in spring water.
The pH values for most of the studied samples were in the 6–8 range; however, both more acidic and more alkaline waters were also observed in the 5.28–9.26 pH range (Table 3). Some of the samples with low pH values (samples 1, 2, 5, and 15) had a yellowish tint, which is typical for water with a high concentration of humic acids [17]. Water from samples 1–3, 5, 6, 8, 13, 15, 17, 19, and 20 did not follow the standards of the WHO, USEPA, EC, and the requirements of SanPiN 2.1.4.1116-02 for water pH values. The value of total water hardness varied from 0.15 to 1.5 mmol/L (i.e., waters were mainly of the soft type). All samples met the requirements for drinking water, but only water from samples 10, 11, 15, 19, and 23 corresponded to the highest category. Hydrocarbonates were found in all samples except samples 1 and 14, but only samples 4, 7, 9–12, 15, 16, and 18–24 met the requirements of the WHO and SanPiN 2.1.4.1074-01 for water of the highest category. In terms of nitrate content, all samples corresponded to MPC standards, but samples 7, 20, 21, and 23 did not correspond to the highest category. In terms of chloride ion content, only sample 15 did not correspond to the highest category.
In principle, the cationic composition of the studied samples met the requirements of the WHO and SanPiN 2.1.4.1116-02. However, for samples 1 and 20, concentrations of Al were detected that were 2.5 and 1.5 times higher, respectively, than the MPC. In sample 15, the concentration of Mn was 3 times higher than the MPC and slightly exceeded the MPC of Ba (Table 4). Moreover, samples 8, 15, and 19–20 did not meet the requirements for drinking water of the highest category because they exceeded the MPC of Na, whereas samples 7 and 15 exceeded the MPC of Al and Ni, respectively. Water of the highest category was characterized by a minimum content of Mg, K, and Ca cations [55]. Samples 10, 15, and 19 matched this with their Mg content; samples 4, 7, 10, 15, and 19–23 matched with their K content; and samples 10, 11, 15, and 23 matched with their Ca content.
The concentration of Ag, As, Be, Cd, Co, Cr, Re, Sb, and Tl did not exceed the detection limit (LOD) in all analyzed samples. The LOD of these elements and maximal permissible concentrations according to various standards are shown in Table 5. The exceptions were samples 1 and 8, where the Co concentrations were 4.0 and 0.30 μg/L, respectively. All water samples met the most stringent requirements of SanPiN 2.1.4.1116-02 for these parameters.
Table 5.
The detection limits of chemical elements.
The results of chemical composition of spring waters are in good agreement with respect to the content of macro-components both with the previously obtained data [59] and with the chemical composition of springs located at the same latitude and similar relief [60,61,62].
In general, most of the studied springs of the Kola Peninsula are sources of ultra-fresh waters with a salinity of less than 0.2 g/L. Table 6 shows the number of springs that correspond to the MPC standards for the analyzed parameters and meet the requirements for drinking water of the first and highest categories according to this classification [55].
Table 6.
Springs’ compliance with the standards.
The chemical composition of the spring waters showed that some sources did not meet the requirements for the MPCs in SanPiN 1.2.3685-21 but are in demand among the population, which is extremely dangerous and can negatively affect their health. Springs 1, 15 and 20 should be noted as especially hazardous, since a significant excess of MPC for Al, Mn and Al, respectively, was found in their waters. However, at least one or several springs can be recommended near each large settlement. Based on the data set obtained, and given the low waters salinity, the most preferred for drinking are spring 4 for the Murmansk and Kola district, spring 11 for the Monchegorsk district, spring 16 for the Kandalaksha district, and spring 24 for the Apatity-Kirovsk district.
In general, springs are better protected from the urban and industry negative effect in comparison with surface waters. Nevertheless, seasonal pollution by surface waters in the Arctic region is possible, which is most pronounced during the period of snow melting [63]. Therefore, regular monitoring of all springs used as the source of drinking water is required.
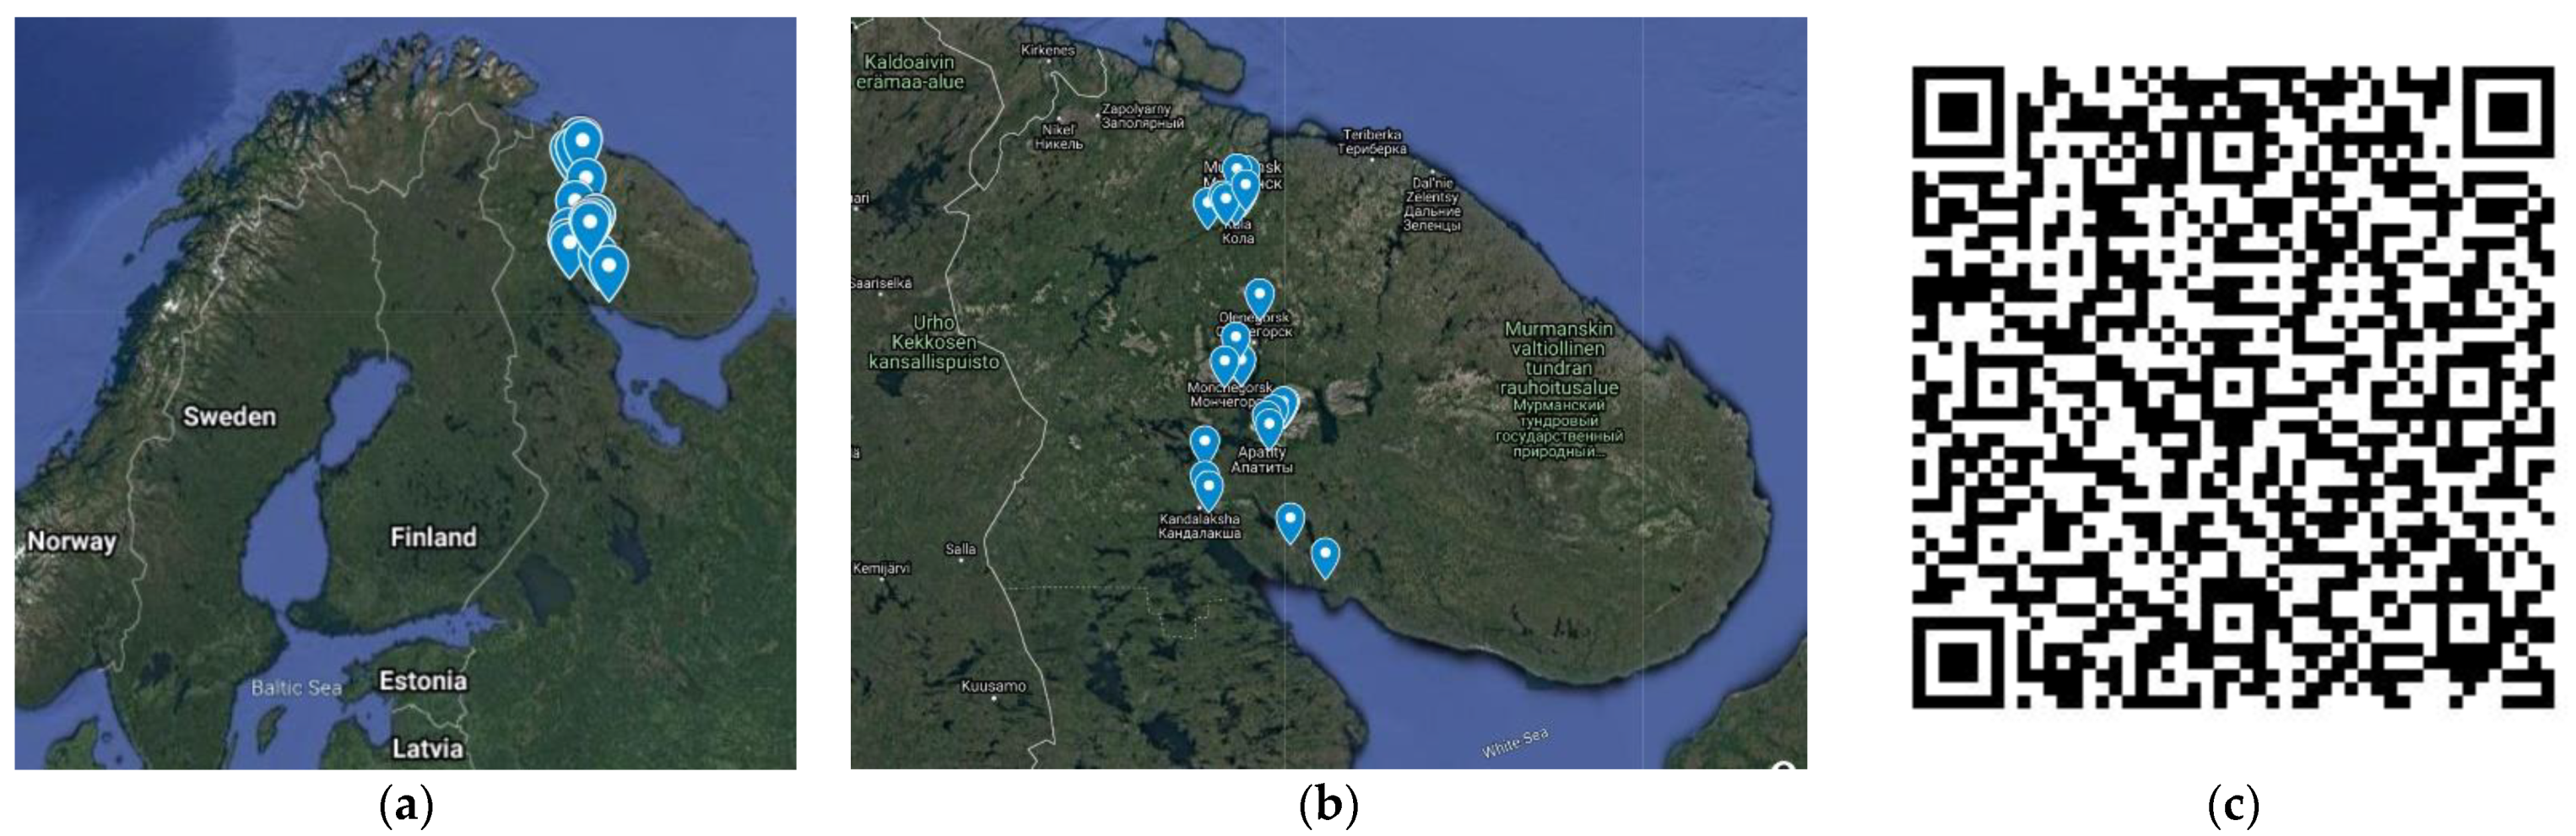
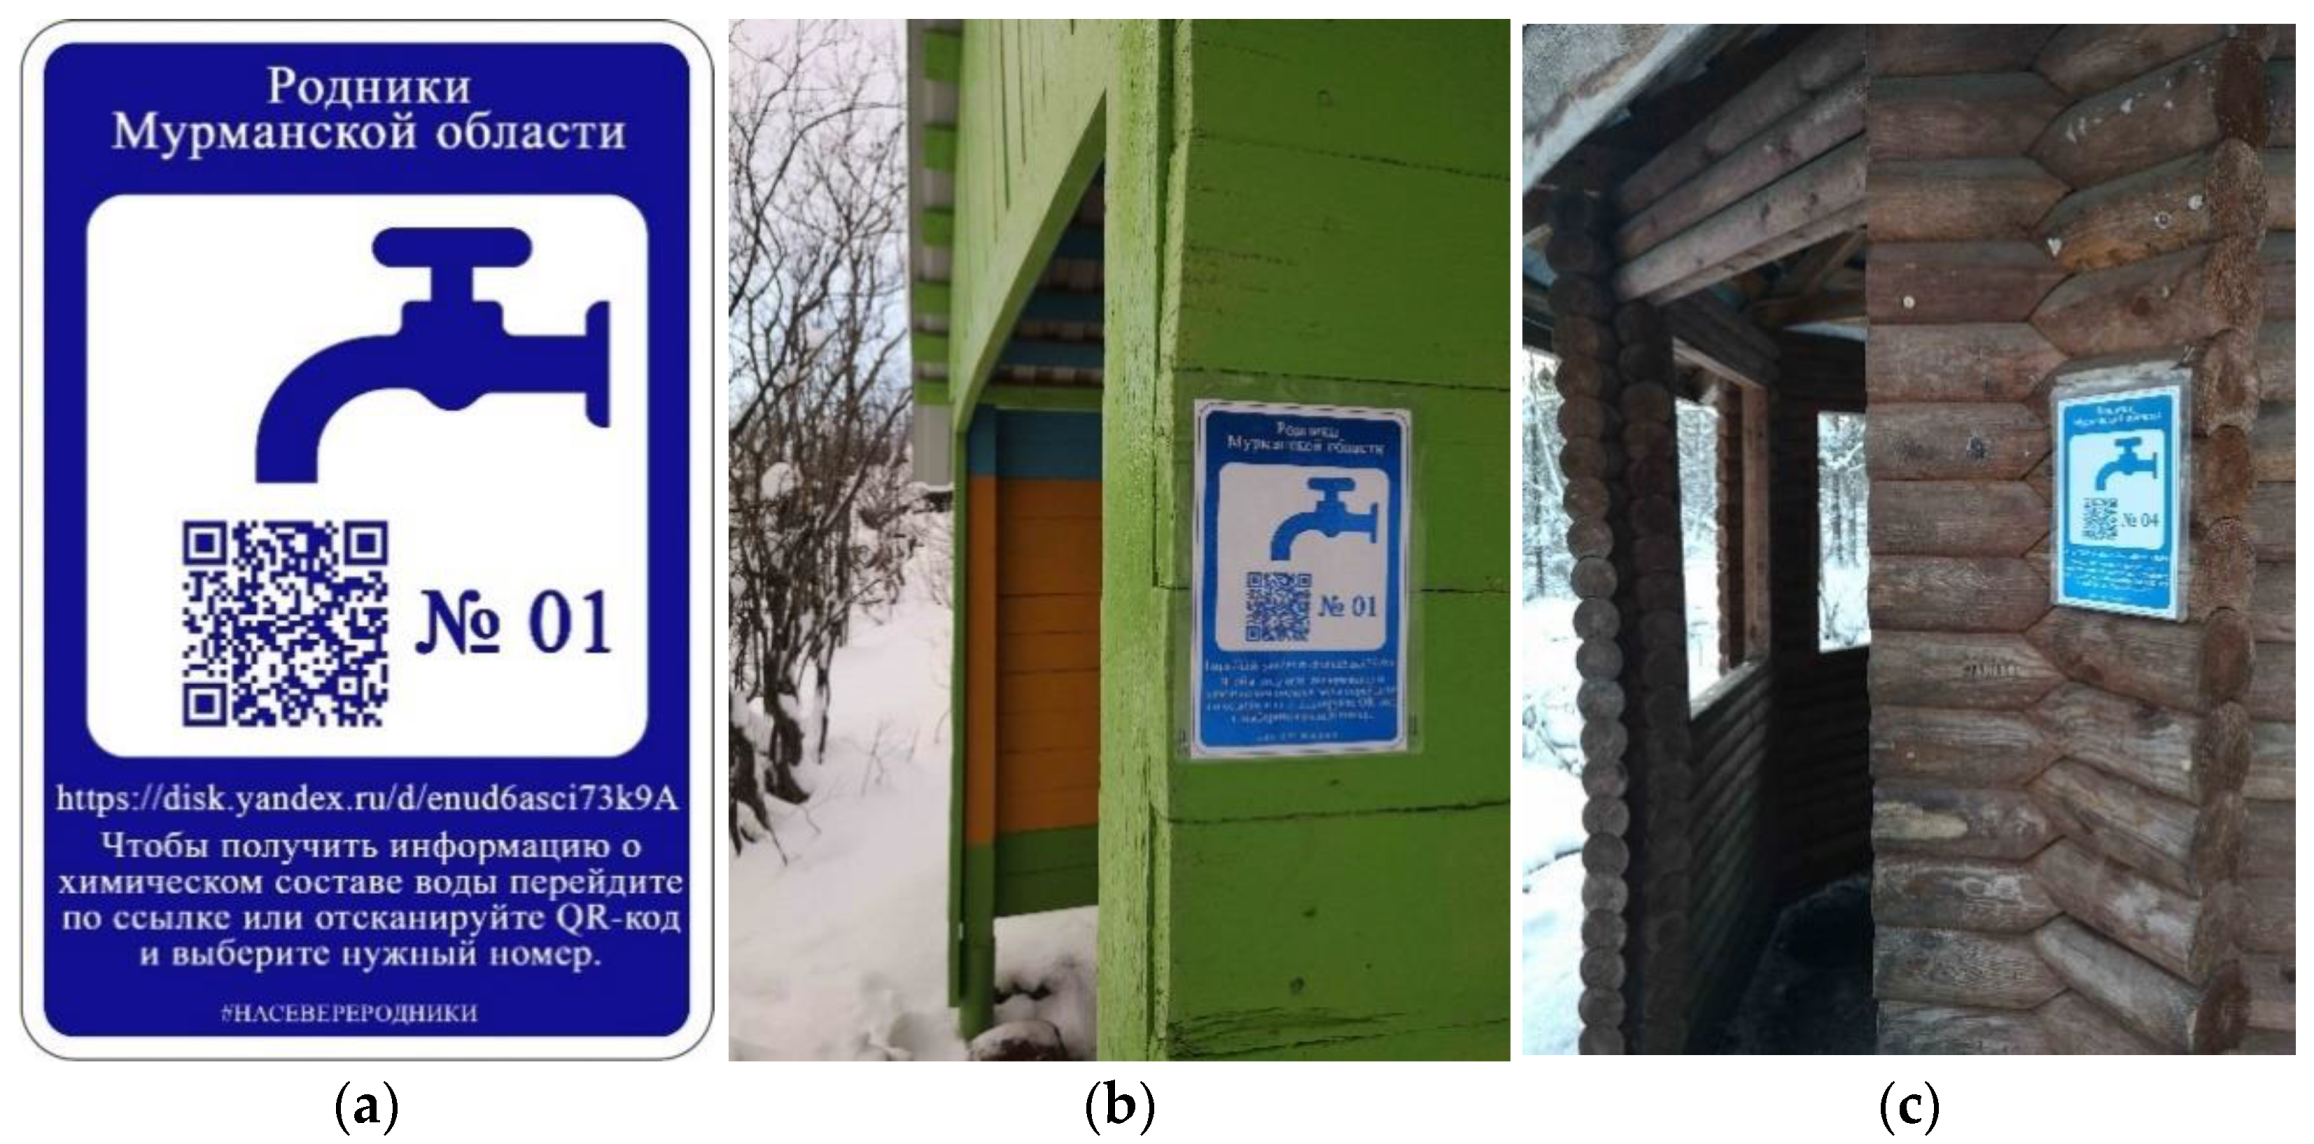
The results and conclusions of this study will be posted on Yandex.Disk, which will be available via the link and QR code placed near each spring (Figure 4). By selecting the folder with the corresponding spring number, people will be able to find information on the chemical composition of the water of each studied spring.

Figure 4.
Plates with the link to information on the chemical composition of the spring water: (a) an example of a plate (in Russian) with a QR code; (b,c) examples of plate placement.
4. Conclusions
The water chemical composition of 24 of the most popular springs near the largest cities of the Murmansk region in Russia were analyzed. Almost half of them did not meet the requirements of drinking water for the determined parameters. Basically, the waters of the region did not correspond to the Russian, European, and US standards in terms of pH, but also, in some springs, significant excess in the concentrations of aluminum and manganese were recorded. The results of the chemical analysis showed that 13 out of 24 investigated springs were potable and corresponded to water of the first category, according to Russian hygienic standards. Finally, the water from one of the sources even met the requirements for water of the highest category. Nevertheless, the regular monitoring of springs used by the population as the source of drinking water, especially for the content of potentially toxic and hazardous microelements, is needed due to the change in groundwater chemical composition after snow melting and the anthropogenic pressure in the industrialized Arctic region.
Author Contributions
Conceptualization, A.I.N., A.A.S. and M.V.S.; methodology, A.I.N. and A.A.S.; software, A.I.N.; validation, A.I.N., A.A.S. and M.V.S.; formal analysis, A.I.N. and A.A.S.; investigation, A.I.N. and A.A.S.; resources, A.I.N. and A.A.S.; data curation, A.I.N.; writing—original draft preparation, A.I.N. and A.A.S.; writing—review and editing, A.I.N., A.A.S. and M.V.S.; visualization, A.I.N. and A.A.S.; supervision, A.I.N. and A.A.S.; project administration, A.I.N.; funding acquisition, A.I.N. All authors have read and agreed to the published version of the manuscript.
Funding
This research was funded by Department of Education and Science of the Murmansk Region, agreement number 224 and the Russian Academy of Sciences theme № AAAA-A18-118030590098-0.
Data Availability Statement
Data set available on request to corresponding authors.
Acknowledgments
The authors thank Dauvalter Vladimir for counseling.
Conflicts of Interest
The authors declare have no conflict of interest. The funders had no role in the design of the study; in the collection, analyses, or interpretation of data; in the writing of the manuscript, or in the decision to publish the results.
References
- Elpiner, L.I.; Bear, S.A.; Zektser, I.S.; Klige, R.K.; Shapovalov, A.E. The effect of water abundance in a territory on the population health. Water Resour. 2007, 34, 340–349. [Google Scholar] [CrossRef]
- Schwarzenbach, R.P.; Egli, T.; Hofstetter, T.B.; Von Gunten, U.; Wehrli, B. Global Water Pollution and Human Health. Annu. Rev. Environ. Resour. 2010, 35, 109–136. [Google Scholar] [CrossRef]
- Halder, J.; Islam, N. Water Pollution and its Impact on the Human Health. J. Environ. Hum. 2015, 2, 36–46. [Google Scholar] [CrossRef]
- Moiseenko, T.I.; Megorskii, V.V.; Gashkina, N.A.; Kudryavtseva, L.P. Water pollution effect on population health in an industrial northern region. Water Resour. 2010, 37, 194–203. [Google Scholar] [CrossRef]
- Trofimovich, E.M.; Aizman, R.I. System of metabolism of drinking water as a methodological basis for the estimation of its mineral composition. Hyg. Sanit. 2019, 98, 555–562. [Google Scholar] [CrossRef]
- Zhang, Y.; Wu, J.; Xu, B. Human health risk assessment of groundwater nitrogen pollution in Jinghui canal irrigation area of the loess region, northwest China. Environ. Earth Sci. 2018, 77, 273. [Google Scholar] [CrossRef]
- Khan, A.F.; Srinivasamoorthy, K.; Prakash, R.; Gopinath, S.; Saravanan, K.; Vinnarasi, F.; Babu, C.; Rabina, C. Human health risk assessment for fluoride and nitrate contamination in the groundwater: A case study from the east coast of Tamil Nadu and Puducherry, India. Environ. Earth Sci. 2021, 80, 724. [Google Scholar] [CrossRef]
- Chen, J.; Wu, H.; Qian, H.; Gao, Y. Assessing Nitrate and Fluoride Contaminants in Drinking Water and Their Health Risk of Rural Residents Living in a Semiarid Region of Northwest China. Expo. Health 2017, 9, 183–195. [Google Scholar] [CrossRef]
- World Health Organization. Guidelines for Drinking—Water Quality, 4th ed.; WHO: Geneva, Switzerland, 2017. [Google Scholar]
- Mejía, F.; Medina, C.; Cornejo, E.; Morello, E.; Vásquez, S.; Alave, J.; Schwalb, A.; Málaga, G. Oxygen saturation as a predictor of mortality in hospitalized adult patients with COVID-19 in a public hospital in Lima, Peru. PLoS ONE 2020, 15, e0244171. [Google Scholar] [CrossRef]
- Akhavan, A.R.; Habboushe, J.P.; Gulati, R.; Iheagwara, O.; Watterson, J.; Thomas, S.; Swartz, J.L.; Koziatek, C.A.; Lee, D.C. Risk Stratification of COVID-19 Patients Using Ambulatory Oxygen Saturation in the Emergency Department. West. J. Emerg. Med. 2020, 21, 5–14. [Google Scholar] [CrossRef]
- Rubin, S.J.S.; Falkson, S.R.; Degner, N.R.; Blish, C. Clinical characteristics associated with COVID-19 severity in California. J. Clin. Transl. Sci. 2021, 5, 1–4. [Google Scholar] [CrossRef] [PubMed] [Green Version]
- Rappaport, S.M.; Smith, M.T. Environment and Disease Risks. Science 2010, 330, 460–461. [Google Scholar] [CrossRef] [Green Version]
- Yokel, R.A. The toxicology of aluminum in the brain: A review. Neurotoxicology 2000, 21, 813–828. [Google Scholar]
- Seiler, H.; Sigel, A.; Sigel, H. (Eds.) Handbook on Metals in Clinical and Analytical Chemistry; Marcel Dekker: New York, NY, USA, 1994. [Google Scholar]
- Kolubaeva, Y.V. Chemical Composition of Underground Water Sources of Non-Centralized Water Supply in the Tomsk Region of the Tomsk Oblast and Its Possible Impact on Human Health. In Water-Rock Interaction: Geological Evolution; Buryat Scientific Center SB RAS: Ulan-Ude, Russian, 2020; pp. 159–162. [Google Scholar]
- Boyd, C.E. Water Quality; Springer International Publishing: Cham, Swizerlands, 2020; ISBN 978-3-030-23334-1. [Google Scholar]
- Vannucci, L.; Fossi, C.; Quattrini, S.; Guasti, L.; Pampaloni, B.; Gronchi, G.; Giusti, F.; Romagnoli, C.; Cianferotti, L.; Marcucci, G.; et al. Calcium Intake in Bone Health: A Focus on Calcium-Rich Mineral Waters. Nutrients 2018, 10, 1930. [Google Scholar] [CrossRef] [Green Version]
- Cormick, G.; Belizán, J.M. Calcium Intake and Health. Nutrients 2019, 11, 1606. [Google Scholar] [CrossRef] [Green Version]
- Anderson, R.A. Chromium as an Essential Nutrient for Humans. Regul. Toxicol. Pharmacol. 1997, 26, S35–S41. [Google Scholar] [CrossRef] [PubMed] [Green Version]
- Iskra, R.; Antonyak, H. Chromium in Health and Longevity; Springer: Cham, Swizerlands, 2018; pp. 133–162. [Google Scholar]
- Aschner, J.L.; Aschner, M. Nutritional aspects of manganese homeostasis. Mol. Asp. Med. 2005, 26, 353–362. [Google Scholar] [CrossRef] [PubMed]
- Abbaspour, N.; Hurrell, R.; Kelishadi, R. Review on iron and its importance for human health. J. Res. Med. Sci. 2014, 19, 164–174. [Google Scholar]
- Yamada, K. Cobalt: Its Role in Health and Disease. Met. Ions Life Sci. 2013, 13, 295–320. [Google Scholar] [CrossRef]
- Spears, J.W. Nickel as a “Newer Trace Element” in the Nutrition of Domestic Animals. J. Anim. Sci. 1984, 59, 823–835. [Google Scholar] [CrossRef] [PubMed]
- Roohani, N.; Hurrell, R.; Kelishadi, R.; Schulin, R. Zinc and its importance for human health: An integrative review. J. Res. Med. Sci. 2013, 18, 144–157. [Google Scholar] [PubMed]
- Araya, M.; Pizarro, F.; Olivares, M.; Arredondo, M.; González, M.; Méndez, M. Understanding copper homeostasis in humans and copper effects on health. Biol. Res. 2006, 39, 183–187. [Google Scholar] [CrossRef] [PubMed] [Green Version]
- Hamilton, S.J. Review of selenium toxicity in the aquatic food chain. Sci. Total Environ. 2004, 326, 1–31. [Google Scholar] [CrossRef] [PubMed]
- Schwarz, G.; Belaidi, A.A. Molybdenum in Human Health and Disease. Met. Ions Life Sci. 2013, 13, 415–450. [Google Scholar] [CrossRef]
- Byrne, C.; Divekar, S.D.; Storchan, G.B.; Parodi, D.A.; Martin, M.B. Cadmium—A metallohormone? Toxicol. Appl. Pharmacol. 2009, 238, 266–271. [Google Scholar] [CrossRef] [Green Version]
- Adewoyin, O.O.; Kayode, O.T.; Omeje, O.; Odetunmibi, O.A. Risk assessment of heavy metal and trace elements contamination in groundwater in some parts of Ogun state. Cogent Eng. 2019, 6, 1632555. [Google Scholar] [CrossRef]
- Kurt, M.A.; Yıldırım, Ü.; Güler, C.; Güven, O. Antimony and arsenic contamination in water from antimonite mineralization: A case study from Turhal (Tokat, Northern Turkey). Environ. Forensics 2021, 1–13. [Google Scholar] [CrossRef]
- Schwarzenbach, R.P.; Escher, B.I.; Fenner, K.; Hofstetter, T.B.; Johnson, C.A.; von Gunten, U.; Wehrli, B. The Challenge of Micropollutants in Aquatic Systems. Science 2006, 313, 1072–1077. [Google Scholar] [CrossRef]
- Verma, R.; Dwivedi, P. Heavy Metal Water Pollution-A Case Study. Sci. Technol. 2013, 5, 98–99. [Google Scholar]
- Belkhiri, L.; Tiri, A.; Mouni, L. Assessment of Heavy Metals Contamination in Groundwater: A Case Study of the South of Setif Area, East Algeria. In Achievements and Challenges of Integrated River Basin Management; IntechOpen: London, UK, 2018. [Google Scholar] [CrossRef] [Green Version]
- United Nations Children’s Fund (UNICEF); World Health Organization (WHO). Progress on Drinking Water, Sanitation and Hygiene: 2017 Update and SDG Baselines; United Nations Children’s Fund (UNICEF); World Health Organization (WHO): Geneva, Switzerland, 2017; ISBN 9789241512893. [Google Scholar]
- Mekonnen, M.M.; Hoekstra, A.Y. Sustainability: Four billion people facing severe water scarcity. Sci. Adv. 2016, 2, e1500323. [Google Scholar] [CrossRef] [Green Version]
- Vörösmarty, C.J.; McIntyre, P.B.; Gessner, M.O.; Dudgeon, D.; Prusevich, A.; Green, P.; Glidden, S.; Bunn, S.E.; Sullivan, C.A.; Liermann, C.R.; et al. Global threats to human water security and river biodiversity. Nature 2010, 467, 555–561. [Google Scholar] [CrossRef]
- Rosinger, A.Y.; Patel, A.I.; Weaks, F. Examining recent trends in the racial disparity gap in tap water consumption: NHANES 2011–2018. Public Health Nutr. 2021, 1–7. [Google Scholar] [CrossRef]
- Rozhkov, V.P.; Belisheva, N.K.; Martynova, A.A.; Soroko, S.I. Psychophysiological and cardiohemodynamic effects of solar, geomagnetic, and meteorological factors in humans under the conditions of the arctic region. Hum. Physiol. 2014, 40, 397–409. [Google Scholar] [CrossRef]
- Statdata. Ru—Site about Countries and Cities. Available online: http://www.statdata.ru/naselenie/murmanskoj-oblasti (accessed on 30 November 2021).
- Slukovskaya, M.V.; Vasenev, V.I.; Ivashchenko, K.V.; Dolgikh, A.V.; Novikov, A.I.; Kremenetskaya, I.P.; Ivanova, L.A.; Gubin, S.V. Organic matter accumulation by alkaline-constructed soils in heavily metal-polluted area of Subarctic zone. J. Soils Sediments 2021, 21, 2071–2088. [Google Scholar] [CrossRef]
- Saltan, N.; Slukovskaya, M.; Mikhaylova, I.; Zarov, E.; Skripnikov, P.; Gorbov, S.; Khvostova, A.; Drogobuzhskaya, S.; Shirokaya, A.; Kremenetskaya, I. Assessment of Soil Heavy Metal Pollution by Land Use Zones in Small Towns of the Industrialized Arctic Region, Russia; Springer: Singapore, 2021; pp. 100–110. [Google Scholar] [CrossRef]
- Mosendz, I.A.; Kremenetskaya, I.P.; Novikov, A.I.; Tereshchenko, S.V. Removing copper and nickel from contaminated water with vermiculite-sungulite materials. Tsvetnye Met. 2021, 2021, 36–41. [Google Scholar] [CrossRef]
- Postevaya, M.A.; Slukovskii, Z.I. Assessment of the Concentration of Heavy Metals in the Water of the Lakes of the City of Murmansk. In Geography: Development of Science and Education; Herzen, A.I., Ed.; Russian State Pedagogical University: Saint Petersburg, Russian, 2021; pp. 111–115. (In Russian) [Google Scholar]
- Guzeva, A.; Slukovskii, Z.; Dauvalter, V.; Denisov, D. Trace element fractions in sediments of urbanised lakes of the arctic zone of Russia. Environ. Monit. Assess. 2021, 193, 378. [Google Scholar] [CrossRef]
- Dauvalter, V.A.; Kashulin, N.A. Assessment of the Ecological State of the Arctic Freshwater System Based on Concentrations of Heavy Metals in the Bottom Sediments. Geochem. Int. 2018, 56, 842–856. [Google Scholar] [CrossRef]
- Slukovskii, Z.; Medvedev, M.; Mitsukov, A.; Dauvalter, V.; Grigoriev, V.; Kudryavtzeva, L.; Elizarova, I. Recent sediments of Arctic small lakes (Russia): Geochemistry features and age. Environ. Earth Sci. 2021, 80, 302. [Google Scholar] [CrossRef]
- Slukovskii, Z.; Dauvalter, V.; Guzeva, A.; Denisov, D.; Cherepanov, A.; Siroezhko, E. The Hydrochemistry and Recent Sediment Geochemistry of Small Lakes of Murmansk, Arctic Zone of Russia. Water 2020, 12, 1130. [Google Scholar] [CrossRef] [Green Version]
- Dauvalter, V.A.; Dauvalter, M.V. Groundwater Condition in Monchegorsk Region; Bulletin of the Kola Science Center RAS, KSC RAS: Apatity, Russian, 2010; pp. 26–33. (In Russian) [Google Scholar]
- Ayras, M.; de Caritat, P.; Chekushin, V.A.; Niskavaara, H.; Reimann, C. Ecogeochemical investigation, kola peninsula: Sulphur and trace element content in snow. Water Air Soil Pollut. 1995, 85, 749–754. [Google Scholar] [CrossRef]
- Gregurek, D.; Melcher, E.; Pavlov, V.A.; Reimann, C.; Stumpfl, E.F. Mineralogy and Petrology Mineralogy and Mineral Chemistry of Snow Filter Residues in the Vicinity of the Nickel-Copper Processing Industry, Kola Peninsula, NW Russia. Mineral. Petrol. 1999, 65, 87–111. [Google Scholar] [CrossRef]
- Council of the European Union. [Internet]. Council Directive 98/83/EC of 3 November 1998 on the Quality of Water Intended for Human Consumption. Off. J. Eur. Communities 1998. Available online: https://agris.fao.org/agris-search/search.do?recordID=CS2005000008 (accessed on 23 November 2021).
- National Primary Drinking Water Regulations|US EPA. Available online: https://www.epa.gov/ground-water-and-drinking-water/national-primary-drinking-water-regulations#Inorganic (accessed on 23 November 2021).
- SanPiN 2.1.4.1116-02 Drinking Water. Hygienic Requirements for the Quality of Water Packaged in Containers. Quality Control. Available online: https://docs.cntd.ru/document/902225826 (accessed on 28 November 2021). (In Russian).
- SanPiN 1.2.3685-21 Hygienic Standards and Requirements to Ensure Safety and (or) Harmful for Human Environmental Factors. Available online: https://docs.cntd.ru/document/573500115 (accessed on 28 November 2021). (In Russian).
- Department of Natural Resources, Ecology and Fisheries of the Murmansk Region Report on the State and Protection of the Environment of the Murmansk Region in 2020. Murmansk 2021. Available online: https://Gov-Murman.Ru/Bitrix/Components/B1team/Govmurman.Element.File/Download.Php?ID=409632&FID=573553 (accessed on 23 November 2021). (In Rassian).
- Selection Map. Available online: https://www.google.com/mymaps/viewer?mid=10ubQEJJWf2SghqpQMtgcljh6YI8t5hso&hl=en (accessed on 21 December 2021). (In Russian).
- Springs of the Kola Land. Available online: https://helion-ltd.ru/springs-kola-earth/ (accessed on 25 November 2021). (In Russian).
- Gunnarsdóttir, M.J.; Gardarsson, S.M.; Jonsson, G.S.; Ármannsson, H.; Bartram, J. Natural background levels for chemicals in Icelandic aquifers. Hydrol. Res. 2014, 46, 647–660. [Google Scholar] [CrossRef]
- Kousa, A.; Komulainen, H.; Hatakka, T.; Backman, B.; Hartikainen, S. Variation in groundwater manganese in Finland. Environ. Geochem. Health 2021, 43, 1193–1211. [Google Scholar] [CrossRef]
- Gunnarsdottir, M.J.; Gardarsson, S.M.; Jonsson, G.S.; Bartram, J. Chemical quality and regulatory compliance of drinking water in Iceland. Int. J. Hyg. Environ. Health 2016, 219, 724–733. [Google Scholar] [CrossRef] [PubMed] [Green Version]
- Scheuer, C.; Boot, E.; Carse, N.; Clardy, A.; Gallagher, J.; Heck, S.; Marron, S.; Martinez-Alvarez, L.; Masarykova, D.; Mcmillan, P.; et al. Physical/Geographical Characteristics of the Artic. In AMAP Assessment Report: Arctic Pollution Issues; Arctic Monitoring and Assessment Programme (AMAP), AMAP: Oslo, Norway, 1998; pp. 9–24. [Google Scholar]
Publisher’s Note: MDPI stays neutral with regard to jurisdictional claims in published maps and institutional affiliations. |
© 2021 by the authors. Licensee MDPI, Basel, Switzerland. This article is an open access article distributed under the terms and conditions of the Creative Commons Attribution (CC BY) license (https://creativecommons.org/licenses/by/4.0/).