
Elucidating Pathfinding Elements from the Kubi Gold Mine in Ghana


Abstract
:1. Introduction
2. Experimental Details
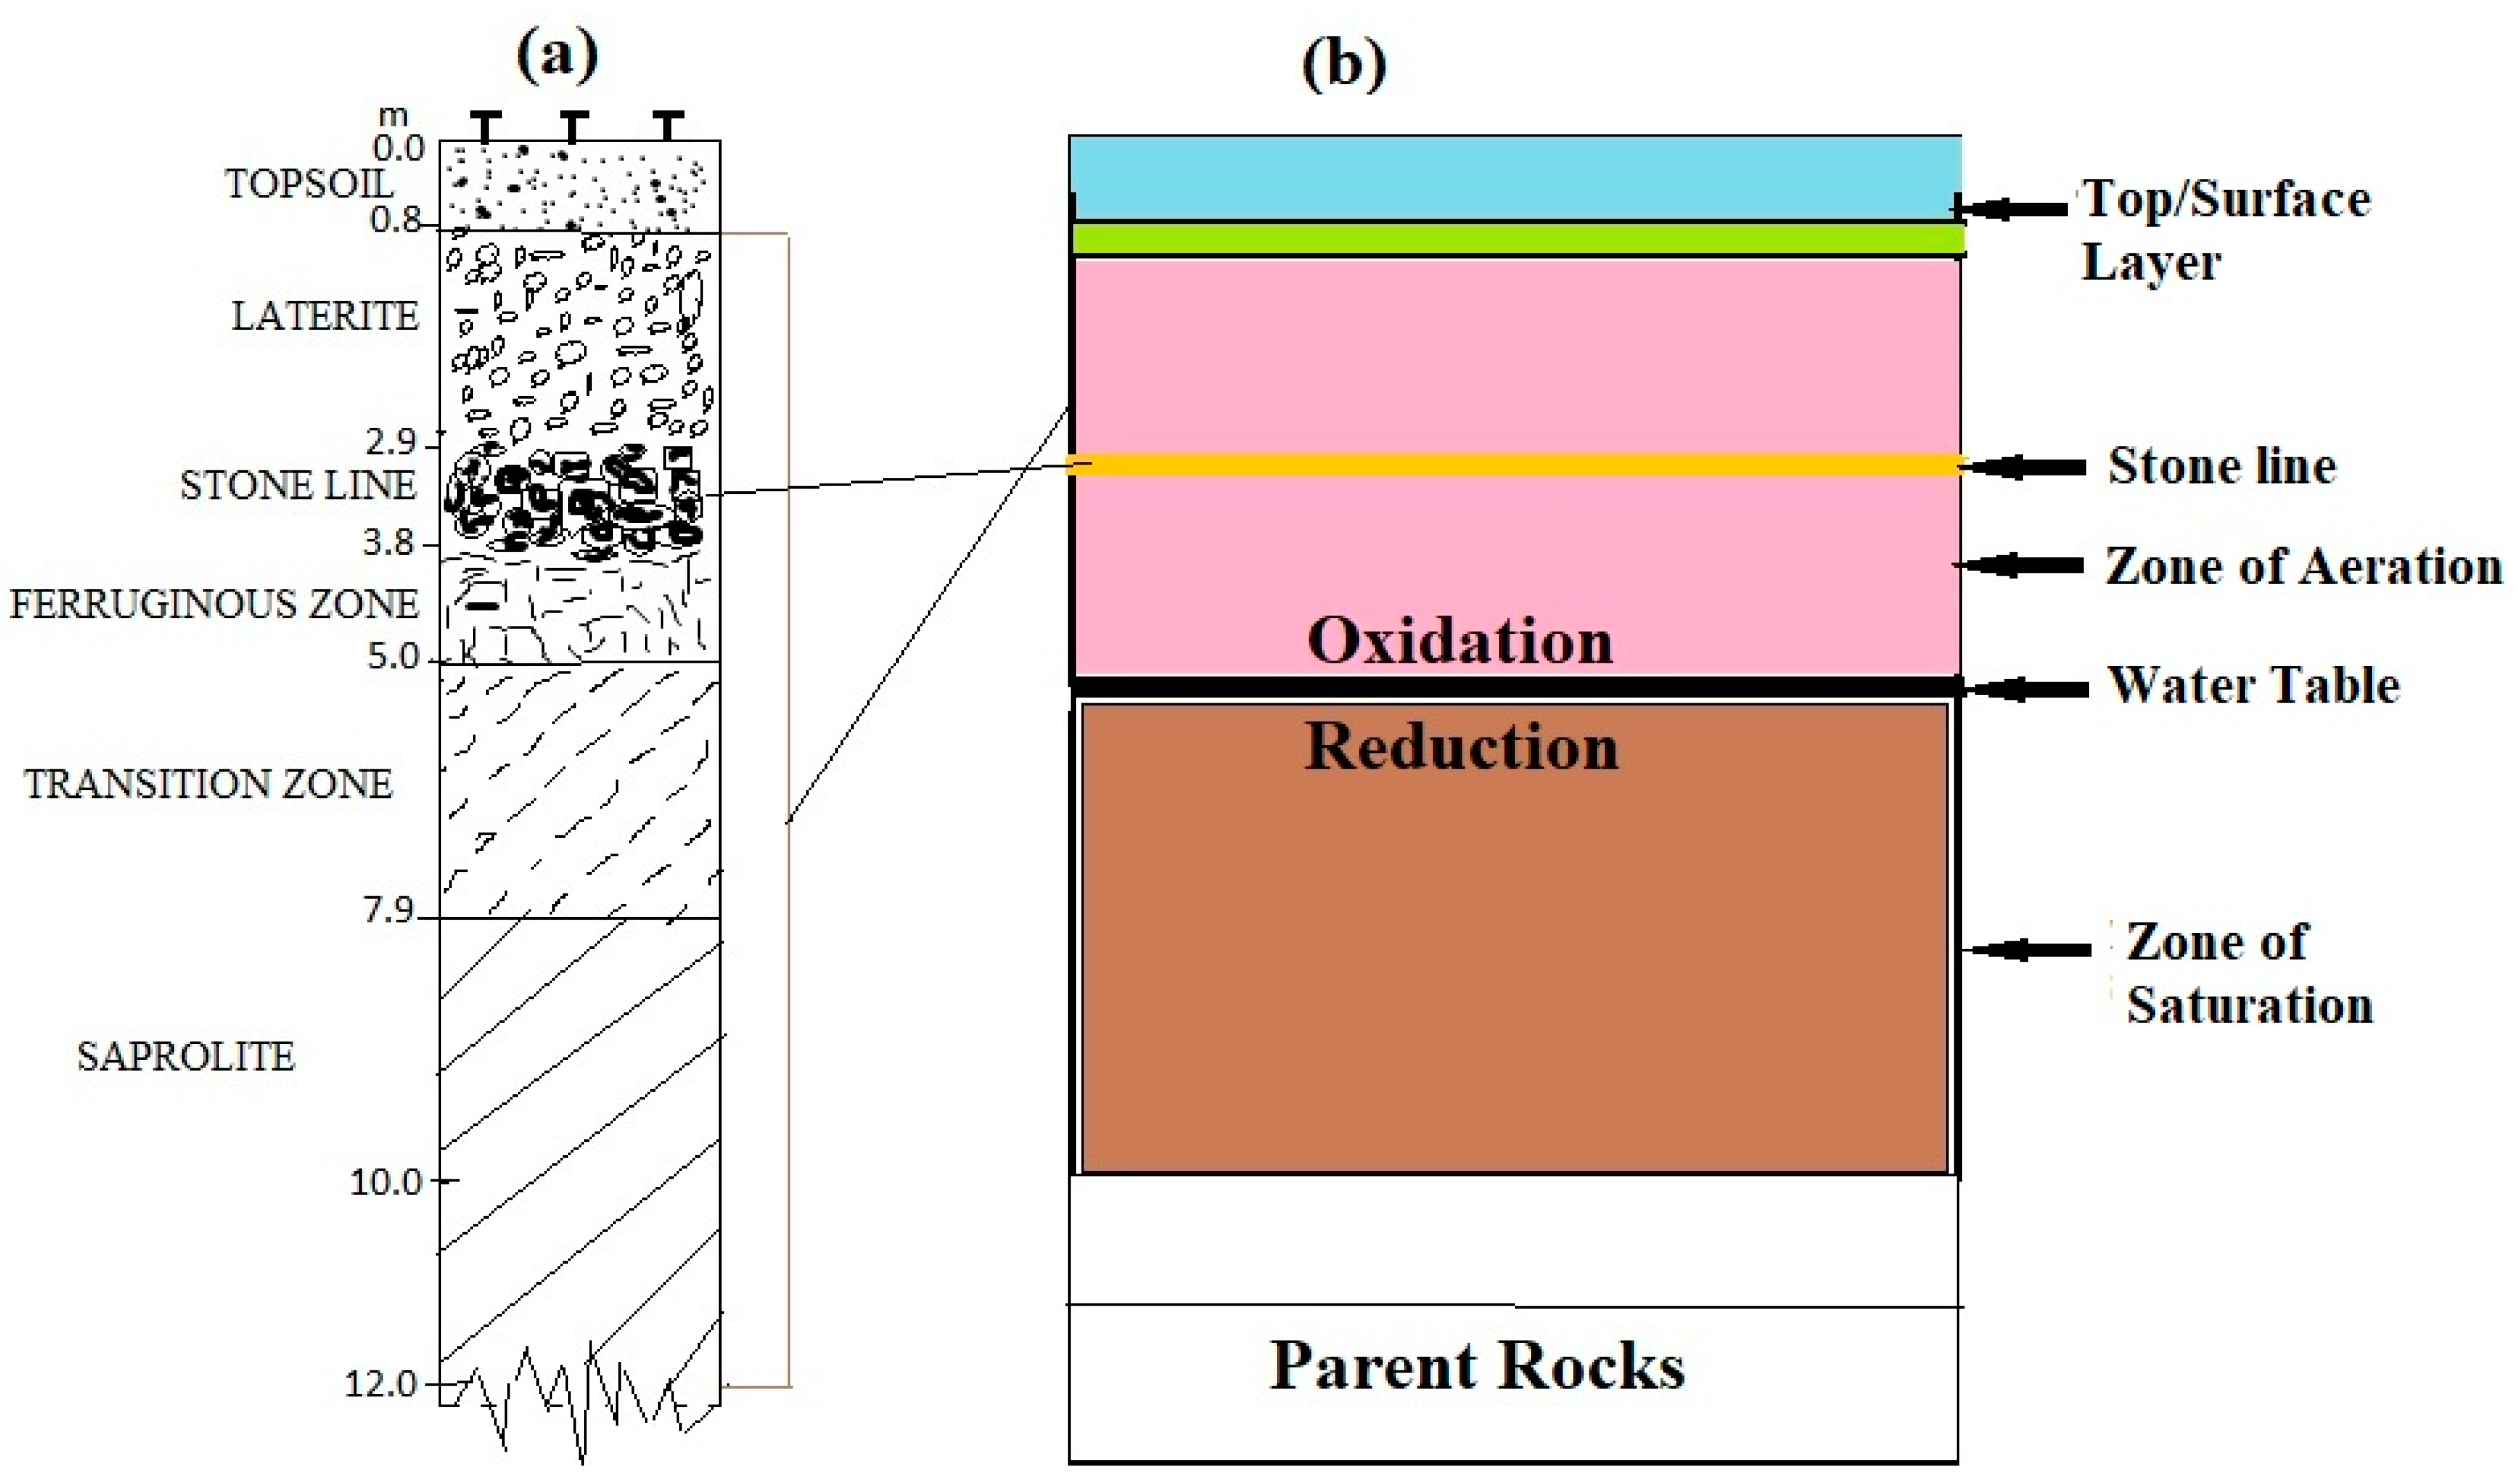
2.1. Description of Study Area
2.2. Behavior of Gold in Hydrothermal Systems
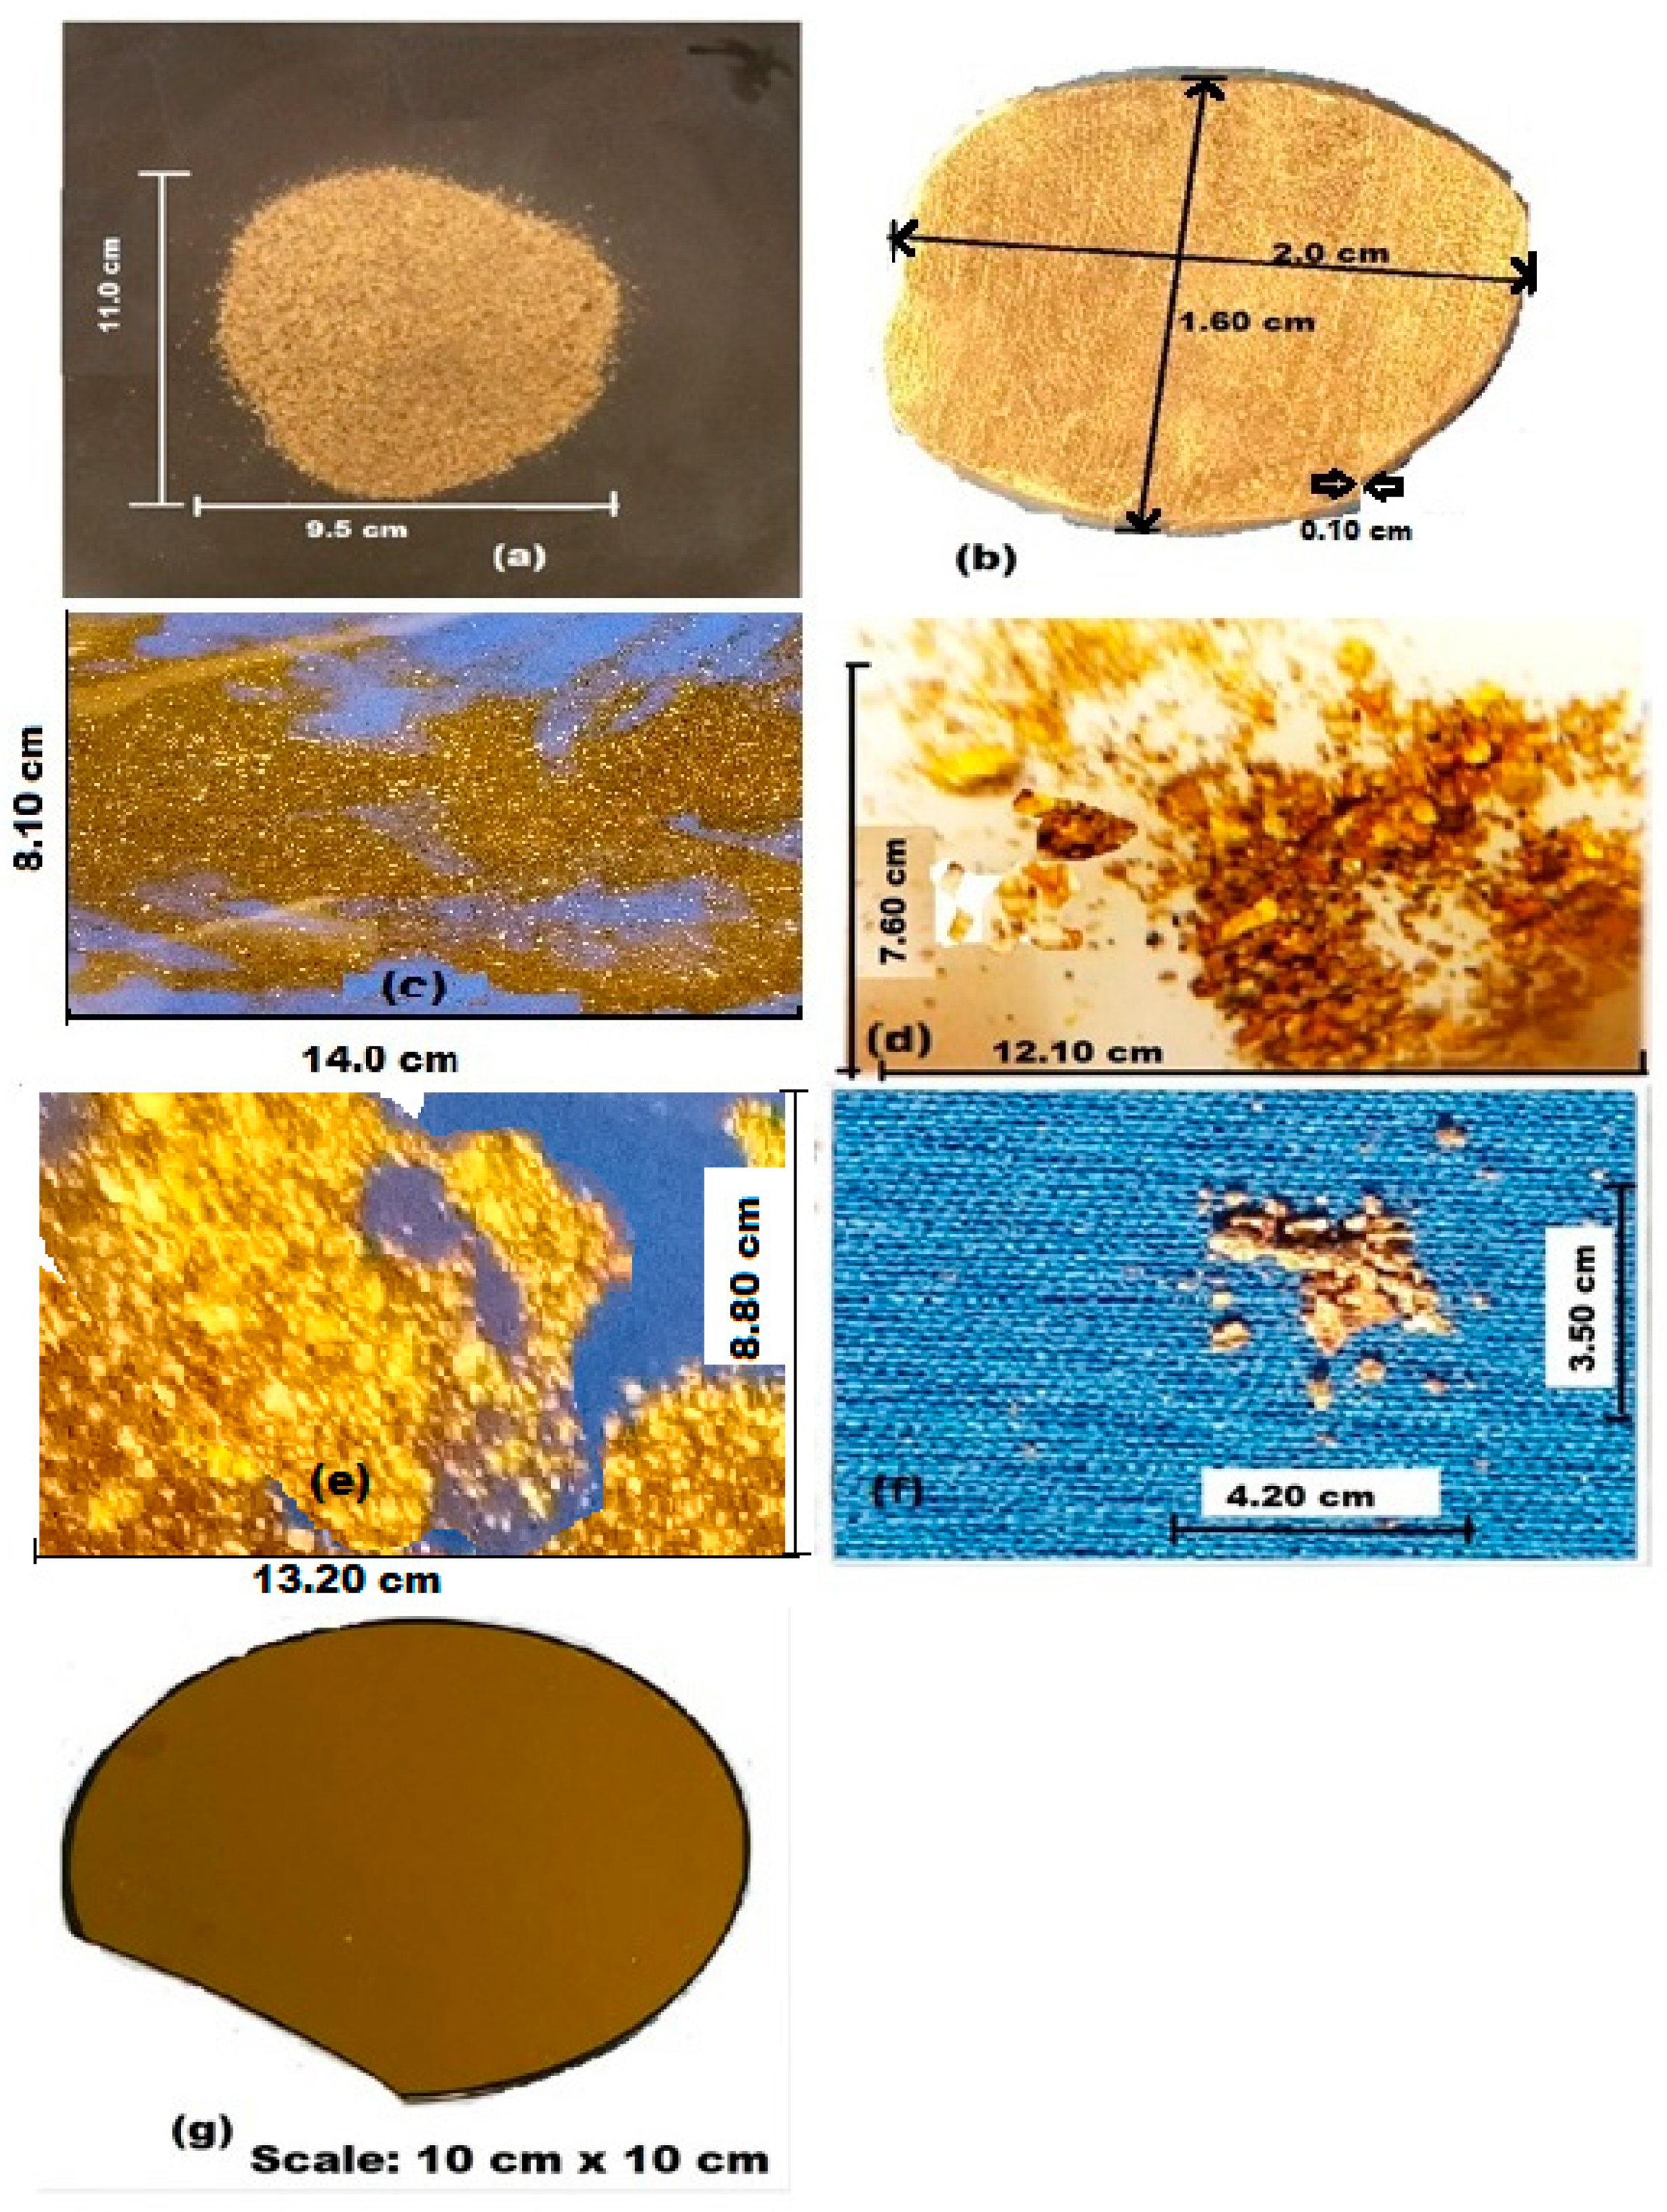
2.3. Sample Preparation
2.4. XPS Measurements
2.5. EDX Measurements
3. Results and Discussion
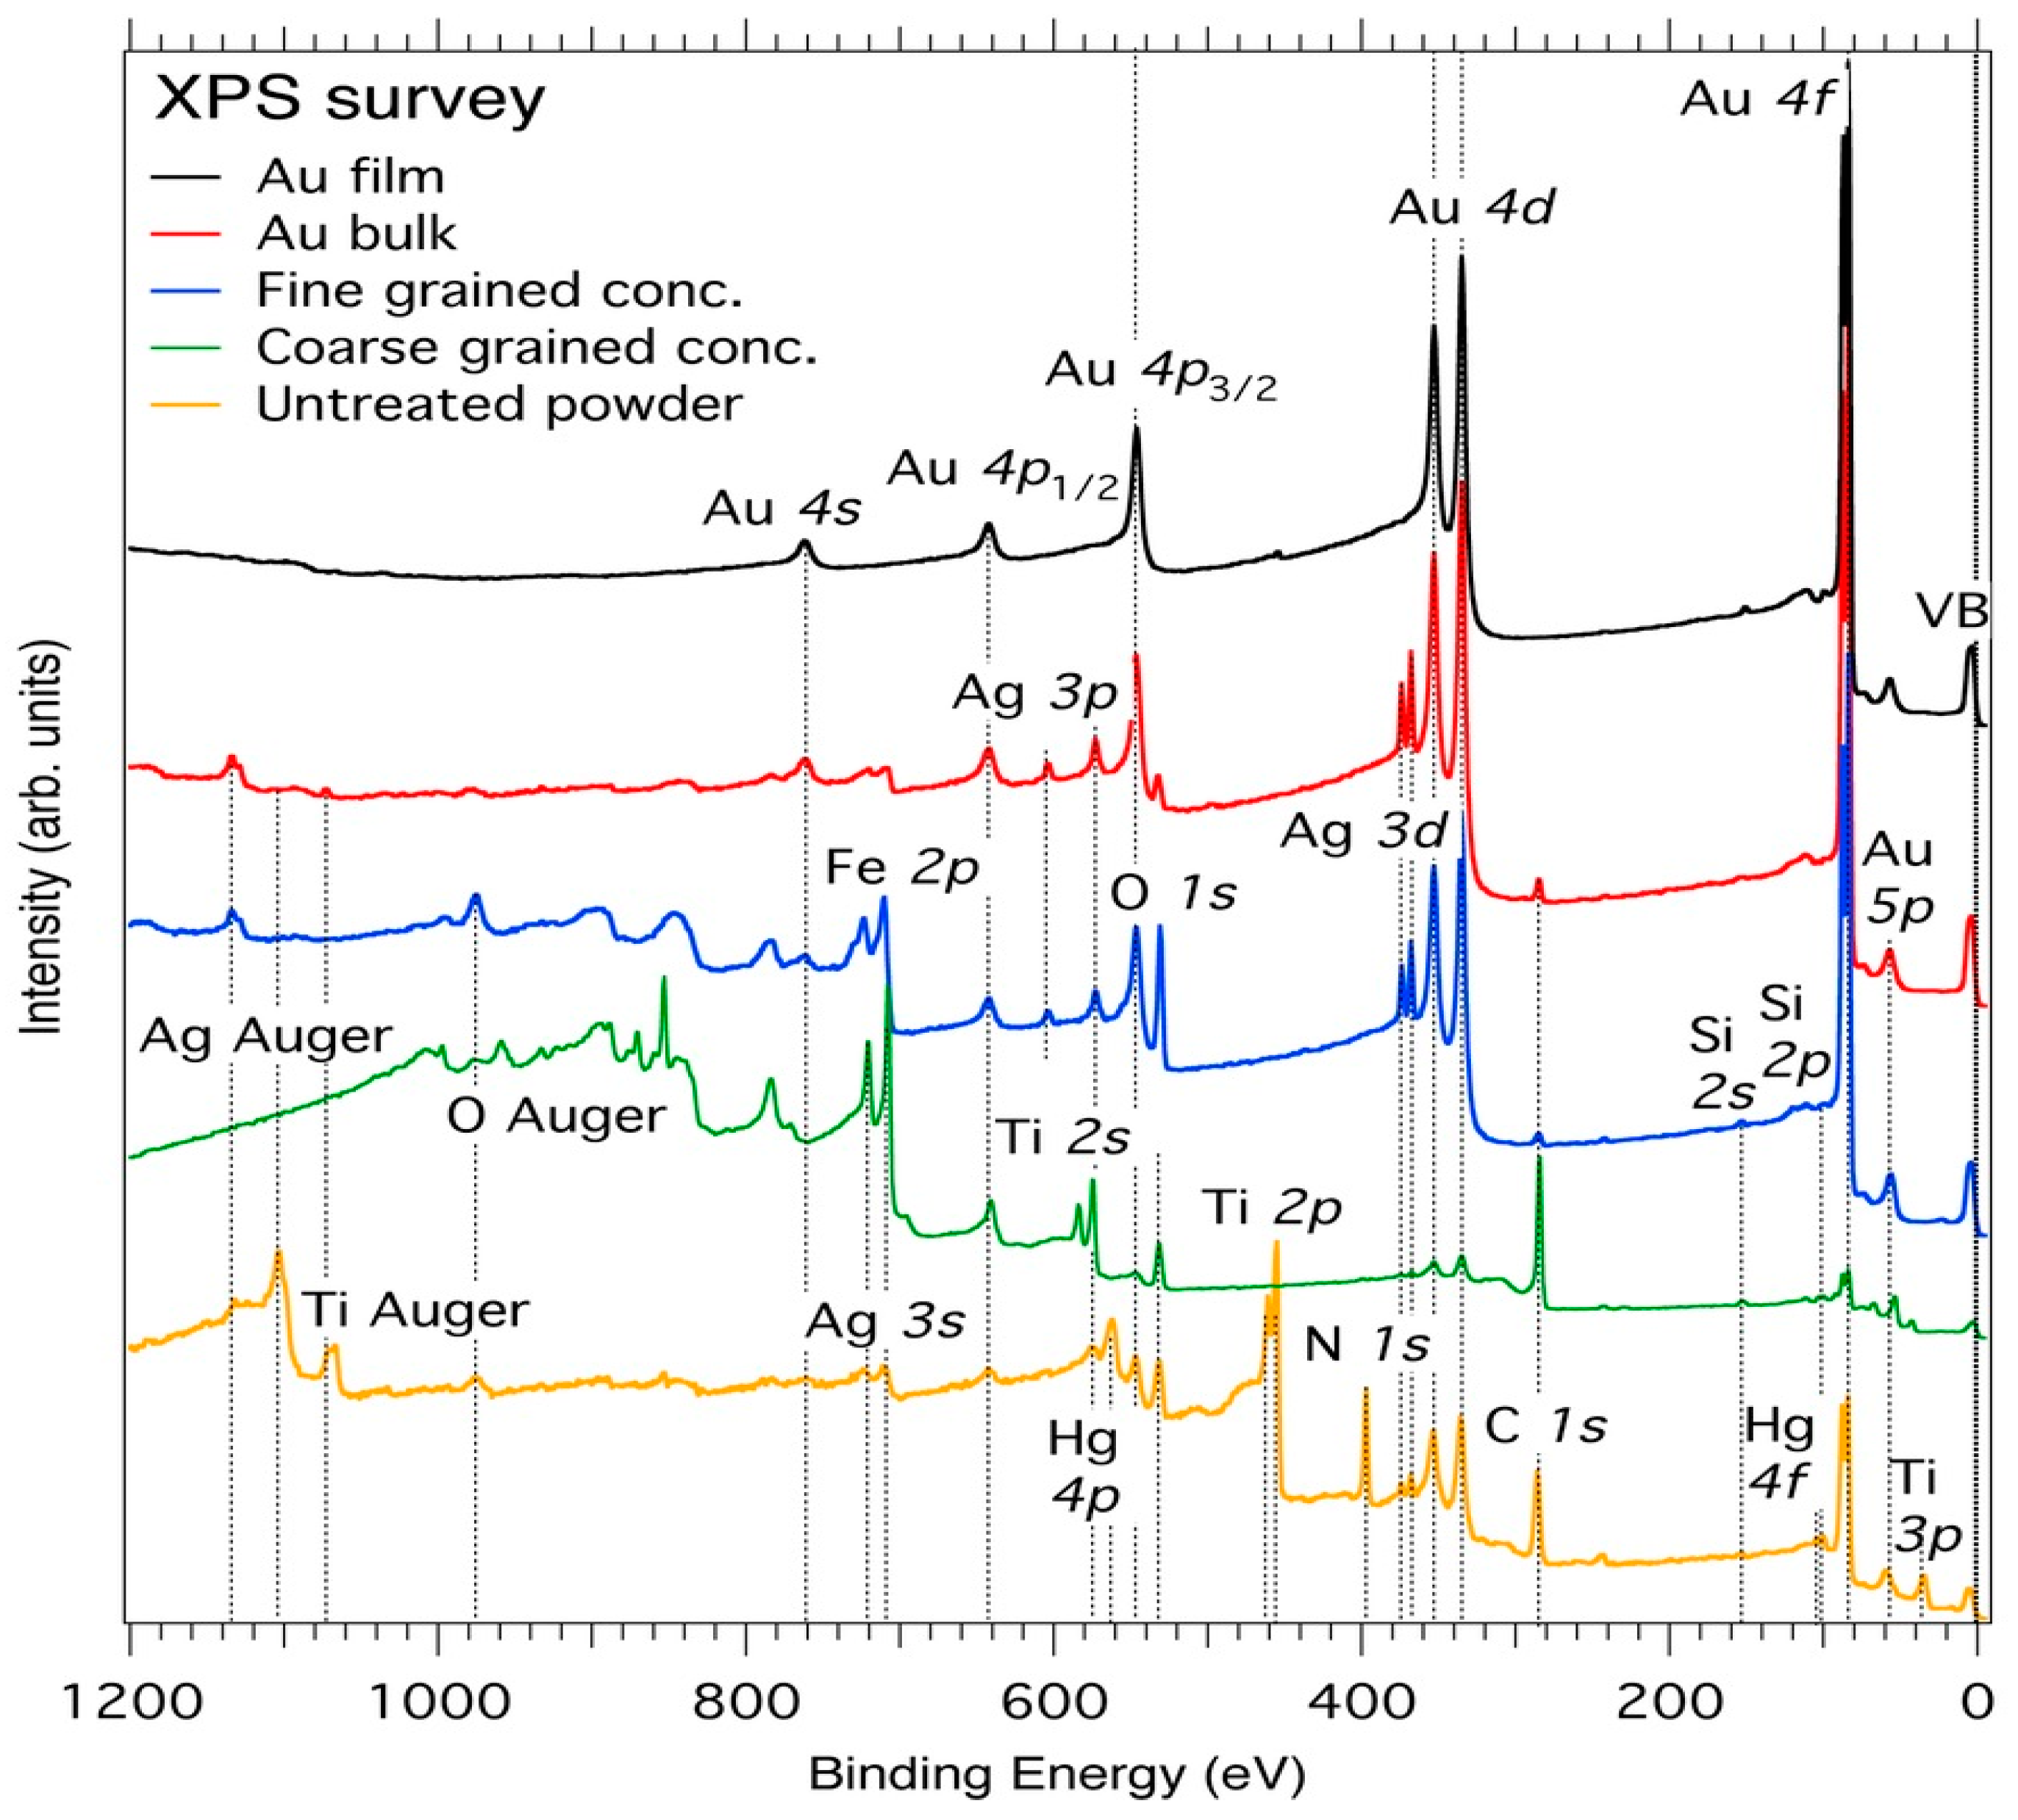
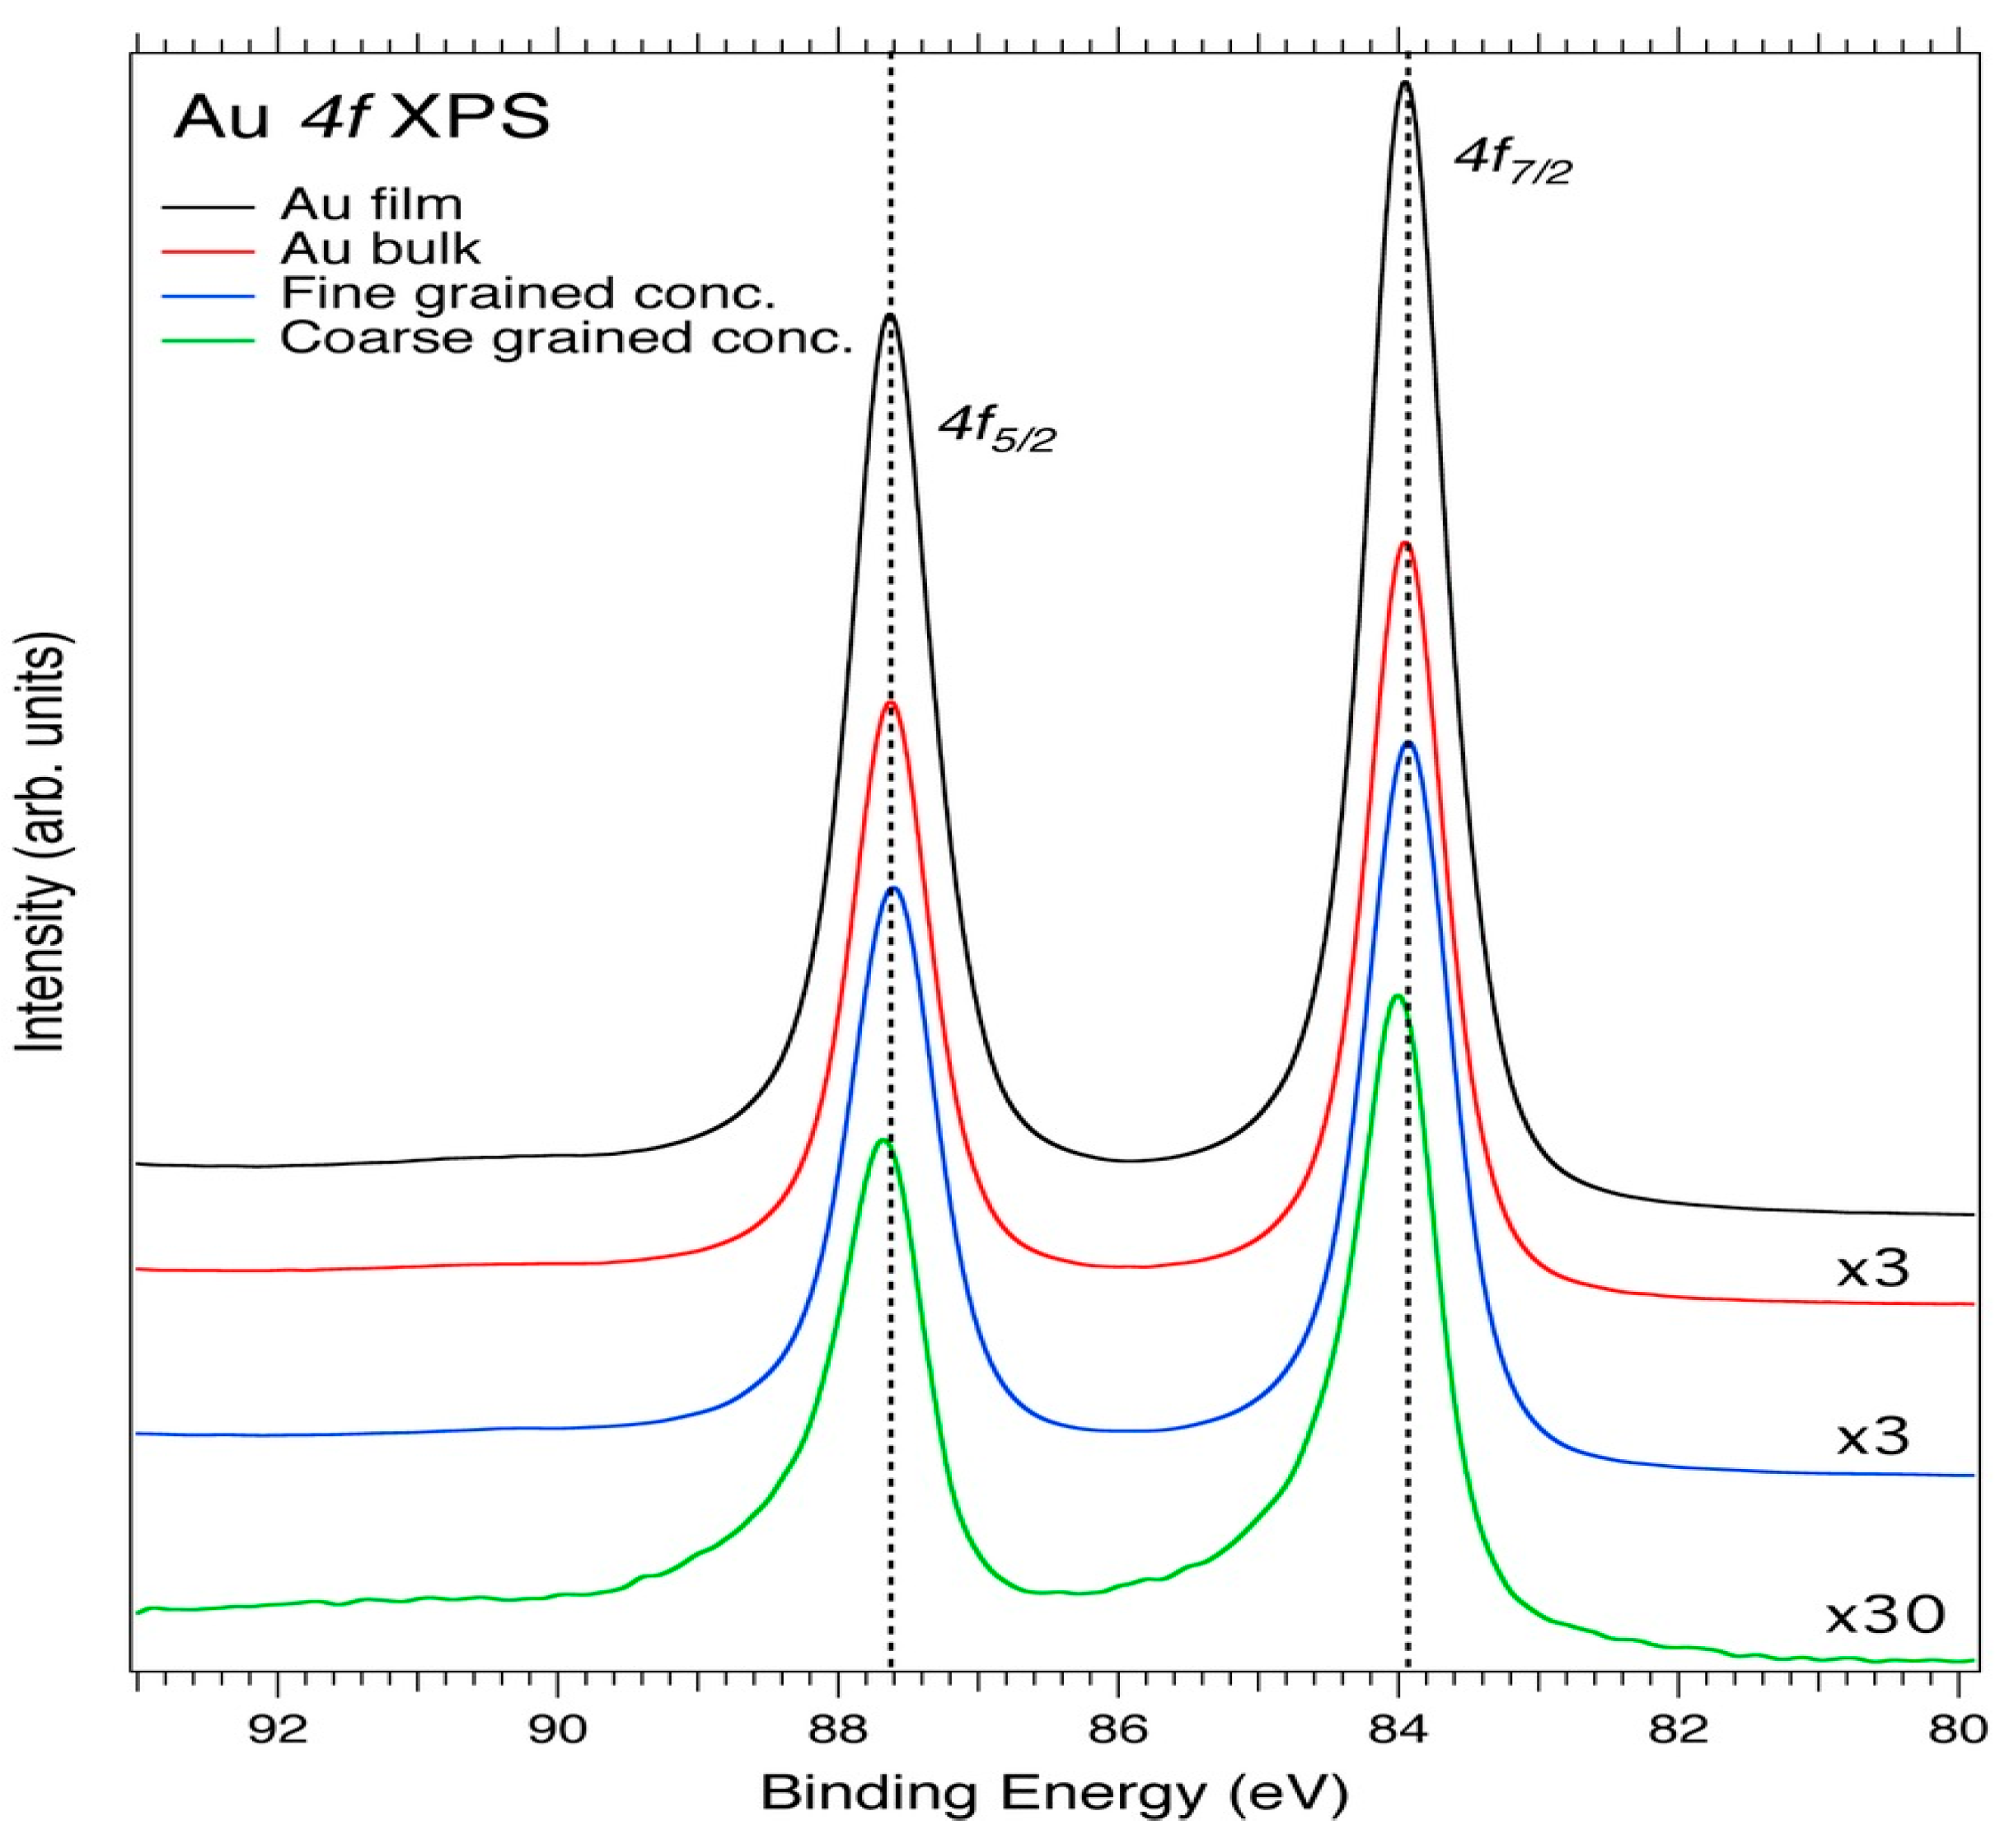
3.1. Core-Level XPS
3.2. Chemical Bonding
3.3. EDX Results
4. Conclusions
Author Contributions
Funding
Data Availability Statement
Acknowledgments
Conflicts of Interest
References
- Smyth, J. “Mineral Structure Data”. Garnet; University of Colorado: Colardo, CO, USA, 2007. [Google Scholar]
- Klein, C.; Hurlbut, C.S., Jr. Manual of Mineralogy: (after James D. Dana), 21st ed.; Wiley: New York, NY, USA, 1993; pp. 451–454. [Google Scholar]
- Reducing mercury use in artisanal and small-scale gold mining, A practical guide. In A UNEP Global Mercury Partnership Document Produced in Conjunction with Artisanal Gold Council; Commision for Geoscience on Environmental Management: Nairobi, Kenya, 2012; Volume 68.
- McClenaghan, M.B.; Parkhill, M.A.; Pronk, A.G.; Seaman, A.A.; McCurdy, M.W.; Laybourne, M.I. Indicator mineral and geochemical signatures associated with the Sisson W–Mo deposit, New Brunswick, Canada. Geochem. Explor. Environ. Anal. 2017, 17, 297–313. [Google Scholar] [CrossRef]
- Noble, R.R.P.; Gray, D.J.; Gill, A.J. Field Guide for Mineral Exploration Using Hydrogeochemical Analysis; CSIRO Earth Science and Resource Engineering: Clayton, Australia, 2011. [Google Scholar]
- Tauson, V.L.; Pastushkova, T.M.; Bessarabova, O.I. On limit concentration and manner of incorporation of gold in hydrothermal pyrite. Russ. Geol. Geophys. 1998, 39, 932–940. [Google Scholar]
- Tauson, V.L. Gold solubility in the common gold-bearing minerals: Experimental evaluation and application to pyrite. Eur. J. Min. 1999, 11, 937–947. [Google Scholar] [CrossRef]
- Mycroft, J.R.; Bancroft, G.M.; McIntyre, N.S.; Lorimer, J.W. Spontaneous deposition of gold on pyrite from solution containing Au (III) and Au(I) chlorides: Part I, a surface study. Geochim. Cosmochim. Acta 1995, 59, 3351–3365. [Google Scholar] [CrossRef]
- Tauson, V.L.; Mironov, A.G.; Smagunov, N.V.; Bugaeva, N.G.; Akimov, V.V. Gold in sulfides: State of the art of occurrence and horizons of experimental studies. Russ. Geol. Geophys. 1996, 37, 1–11. [Google Scholar]
- Simon, G.; Huang, H.; Penner, H.J.E.; Kesler, S.E.; Kao, L.S. Oxidation state of gold and arsenic in gold-bearing arsenian pyrite. Am. Miner. 1999, 84, 1071–1079. [Google Scholar] [CrossRef]
- Simon, G.; Kesler, S.E.; Chryssoulis, S.L. Geochemistry and textures of gold-bearing arsenian pyrite, Twin Creeks Carlin type gold deposit, Nevada. Implications for gold deposition. Econ. Geol. 1996, 94, 405–422. [Google Scholar] [CrossRef]
- Scaini, M.J.; Bancroft, G.M.; Knipe, S.W. An XPS, AES, and SEM study of the interactions of gold and silver chloride species with PbS and FeS2: Comparison to natural samples. Geochim. Cosmochim. Acta 1997, 61, 1223–1231. [Google Scholar] [CrossRef]
- Widler, A.M.; Seward, T.M. The adsorption of gold (I) hydrosulphide complexes by iron sulphide surfaces. Geochim. Cosmochim. Acta 2002, 66, 383–402. [Google Scholar] [CrossRef]
- Cook, N.J.; Chryssoulis, S.L. Concentrations of “invisible gold” in the common sulfides. Can. Mineral. 1990, 28, 1–16. [Google Scholar]
- Fleet, M.E.; Mumin, A.H. Gold-bearing arsenian pyrite and marcasite and arsenopyrite from Carlin Trend gold deposits and laboratory synthesis. Am. Miner. 1997, 82, 182–193. [Google Scholar] [CrossRef]
- Friedl, J.; Wagner, F.E.; Wang, N. On the chemical state of combined gold in sulfidic ores: Conclusions from Mo¨ssbauer source experiments. Neues Jahrb Miner. Abh 1995, 169, 279–290. [Google Scholar]
- Genkin, A.D.; Bortnikov, N.S.; Cabri, L.J.; Wagner, F.E.; Stanley, C.J.; Safonov, Y.G.; McMahon, G.; Friedl, J.; Kerzin, A.L.; Gamyanin, G.N. A multidisciplinary study of invisible gold in arsenopyrite from four mesothermal gold deposits in Siberia, Russian Federation. Econ. Geol. 1998, 93, 463–487. [Google Scholar] [CrossRef]
- Cabri, L.J.; Newville, M.; Gordon, R.A.; Crozier, E.D.; Sutton, S.R.; McMahon, G.; Jiang, D.-T. Chemical speciation of gold in arsenopyrite. Can. Miner. 2000, 38, 1265–1281. [Google Scholar] [CrossRef] [Green Version]
- Velasquez, P.; Leinen, D.; Pascual, J.; Ramos-Barrado, J.R.; Grez, P.; Gomez, H.; Schrebler, R.; Del Rio, R.; Cordova, R. A Chemical, Morphological, and Electrochemical (XPS, SEM/EDX, CV, and EIS) Analysis of Electrochemically Modified Electrode Surfaces of Natural Chalcopyrite (CuFeS2) and Pyrite (FeS2) in Alkaline Solutions. J. Phys. Chem. B 2005, 109, 4977–4988. [Google Scholar] [CrossRef]
- Harmer, S.L.; Thomas, J.E.; Fornasiero, D.; Gerson, A.R. The evolution of surface layers formed during chalcopyrite leaching. Geochem. Cosmochim. Acta 2006, 70, 4392–4402. [Google Scholar] [CrossRef]
- Harmer, S.L.; Pratt, A.R.; Nesbitt, W.H.; Fleet, M.E. Sulfur species at chalcopyrite (CuFeS2) fracture surfaces. Am. Mineral. 2004, 89, 1026–1032. [Google Scholar] [CrossRef]
- Harmer, S.L.; Pratt, A.R.; Nesbitt, H.W.; Fleet, M.E. Reconstruction of fracture surfaces on bornite. Can. Mineral. Can. Miner. 2005, 43, 1619–1630. [Google Scholar] [CrossRef] [Green Version]
- Harmer, S.L.; Skinner, W.M.; Buckley, A.N.; Fan, L.-J. Species formed at Cuprite fracture surfaces; observations of O 1s core level shift. Surf. Sci. 2009, 603, 537–545. [Google Scholar] [CrossRef]
- Wang, N.; Liu, G.; Dai, H.; Ma, H.; Lin, M. Spectroscopic evidence for electrochemical effect of mercury ions on gold nanoparticles. Anal. Chim. Acta 2009, 1062, 140–146. [Google Scholar] [CrossRef]
- Brion, D. Etude par spectroscopy de photoelectrons de la degradation superficielle de FeS2, CuFeS2, ZnS et PbS a l’air et dans l’eau. Appl. Surf. Sci. 1980, 5, 133–152. [Google Scholar] [CrossRef]
- Buckley, A.N.; Hamilton, I.C.; Woods, R. Investigation of the surface oxidation of bornite by linear potential sweep voltammetry and X-ray photoelectron spectroscopy. J. Appl. Electrochem. 1980, 14, 63–74. [Google Scholar] [CrossRef]
- Buckley, A.N. The application of X-ray photoelectron spectroscopy to flotation research. Colloids Surf. 1994, 93, 159–172. [Google Scholar] [CrossRef]
- Buckley, A.N.; Skinner, W.M.; Harmer, S.L.; Pring, A.; Lamb, R.N.; Fan, L.-J.; Yang, Y.-W. Examination of the proposition that Cu (II) can be required for charge neutrality in a sulfide lattice-Cu in tetrahedrites and sphalerite. Can. J. Chem. 2007, 85, 767–781. [Google Scholar] [CrossRef]
- Pratt, A. Photoelectron core levels for enargite, Cu3AsS4. Surf. Interface Anal. 2004, 36, 654–657. [Google Scholar] [CrossRef]
- Smart, R.S.C.; Amarantidis, J.; Skinner, W.M.; Vanier, L.L.; Grano, S.R. Topics in Applied Physics, Solid–Liquid Interfaces; Wandelt, K., Thurgate, S., Eds.; Springer: New York, NY, USA, 2003; Volume 85, pp. 3–60. [Google Scholar]
- Smart, R.S.C.; Amarantidis, J.; Skinner, W.; Prestidge, C.A.; La Vanier, L.; Grano, S. Surface analytical studies of oxidation and collector adsorption in sulphide mineral flotation. Scanning Microsc. 1998, 12, 553–583. [Google Scholar]
- Buckley, A.N.; Hamilton, I.C.; Woods, R. Proceedings of the International Symposium on Electrochemistry in Mineral and Metal Processing II; The Electrochemistry Society: Atlanta, GA, USA, 15–20 May 1998; pp. 234–246. [Google Scholar]
- Mikhlin, Y.; Romanchenko, A.; Asanov, I. Oxidation of arsenopyrite and deposition of gold on the oxidized surfaces: A scanning probe microscopy, tunneling spectroscopy, and XPS study. Geochim. Cosmochim. Acta 2006, 70, 4874–4888. [Google Scholar] [CrossRef]
- Murphy, R.; Strongin, D.R. Surface reactivity of pyrite and related sulfides. Surf. Sci. Rep. 2009, 64, 1–45. [Google Scholar] [CrossRef]
- Sanchez-Arenilla, M.; Mateo-Marti, E. Pyrite surface environment drives molecular adsorption: Cystine on pyrite (100) investigated by X-ray photoemission spectroscopy and low energy electron diffraction. Phys. Chem. Chem. Phys. 2016, 18, 27219–27225. [Google Scholar] [CrossRef] [PubMed]
- Okazawa, T.; Fujiwara, M.; Nishimura, T.; Akita, T.; Kohyama, M.; Kido, Y. Growth mode and electronic structure of Au nano-clusters on NiO (001) and TiO2(110). Surf. Sci. 2006, 600, 1331–1338. [Google Scholar] [CrossRef]
- Chen, M.; Cai, Y.; Yan, Z.; Goodman, D.W. On the origin of the unique properties of supported Au nanoparticles. J. Am. Chem. Soc. 2006, 128, 6341–6346. [Google Scholar] [CrossRef]
- Okazawa, T.; Kohyama, M.; Kido, Y. Electronic properties of Au nano-particles supported on stoichiometric and reduced TiO2 (110) substrates. Surf. Sci. 2006, 600, 4430–4437. [Google Scholar] [CrossRef]
- Acres, R.G.; Harmer, S.L.; Beattie, D.A. Synchrotron XPS, NEXAFS, and ToF-SIMS studies of solution exposed chalcopyrite and heterogeneous chalcopyrite with pyrite. Miner. Eng. 2010, 23, 928–936. [Google Scholar] [CrossRef]
- Luo, M.F.; Wang, C.C.; Hu, G.-R.; Lin, W.R.; Ho, C.Y.; Lin, Y.C.; Hsu, Y.J. Active alloying of Au with Pt in nanoclusters supported on a thin film of Al(2)O(3)/NiAl (100). J. Phys. Chem. C 2009, 113, 21054–21062. [Google Scholar] [CrossRef]
- Boyen, H.G.; Herzog, T.; Kastle, G.; Weigl, F.; Ziemann, P.; Spatz, J.P.; Moller, M.; Wahrenberg, R.; Garnier, M.G.; Oelhafen, P. X-ray photoelectron spectroscopy study on gold nanoparticles supported on diamond. Phys. Rev. B 2002, 65, 075412. [Google Scholar] [CrossRef]
- Boyen, H.G.; Kastle, G.; Weigl, F.; Ziemann, P.; Schmid, G.; Garnier, M.G.; Oelhafen, P. Chemically induced metal-to-insulator transition in Au55 clusters: Effect of stabilizing ligands on the electronic properties of nanoparticles. Phys. Rev. Lett. 2001, 87, 276401. [Google Scholar] [CrossRef]
- Buttner, M.; Oelhafen, P. XPS study on the evaporation of gold sub-monolayers on carbon surfaces. Surf. Sci. 2006, 600, 1170. [Google Scholar] [CrossRef]
- Wertheim, G.K.; Dicenzo, S.B.; Youngquist, S.E. Unit charge on supported gold clusters in photoemission final-state. Phys. Rev. Lett. 1983, 51, 2310–2313. [Google Scholar] [CrossRef]
- Hofstra, A.H.; Cline, J.S. Characteristics and Models for Carlin-Type Gold Deposit. SEG Rev. 2000, 13, 163–220. [Google Scholar]
- Bayari, E.E.; Foli, G.; Gawu, S.K.Y. Geochemical and pathfinder elements assessment in some mineralized regolith profiles in Bole-Nangodi gold belt in north-eastern. Ghana. Environ. Earth Sci. 2019, 78, 268. [Google Scholar] [CrossRef]
- Nude, P.M.; Asigri, J.M.; Yidana, S.M.; Arhin, E.; Foli, G.; Kutu, J.M. Identifying Pathfinder Elements for Gold in Multi-Element Soil Geochemical Data from the Wa -Lawra Belt, Northwest Ghana: A Multivariate Statistical Approach. Int. J. Geosci. 2012, 3, 62–70. [Google Scholar] [CrossRef] [Green Version]
- Marfo, E.; Darko, E.; Faanu, A.; Mayin, S. Study of the radiological parameters associated with small-scale mining activities at Dunkwa-on-Offin in the central region of Ghana. Radiat. Prot. Environ. 2016, 39, 83. [Google Scholar]
- Wright, J.B.; Hastings, D.A.; Jones, W.B.; Williams, H.R.; Wright, J.B. (Eds.) Geology and Mineral Resources of West Africa; George Allen & UNWIN: London, UK, 1985; pp. 45–47. [Google Scholar]
- Kesse, G.O.; Foster, R.P. The Occurrence of Gold in Ghana. In Gold ‘82: The Geology, Geochemistry and Genesis of Gold Deposits; Balkema, A.A., Ed.; Geological Society of Zimbabwe: Rotterdam, The Netherlands, 1984; pp. 648–650. [Google Scholar]
- Kim, B.J.; Cho, K.H.; Lee, S.G.; Park, C.-Y.; Choi, N.C.; Lee, S. Effective Gold Recovery from Near-Surface Oxide Zone Using Reductive Microwave Roasting and Magnetic Separation. Metals 2018, 8, 957. [Google Scholar] [CrossRef] [Green Version]
- Craw, D.; Lilly, K. Gold nugget morphology and geochemical environments of nugget formation, southern New Zealand. Ore Geol. Rev. 2016, 79, 301–315. [Google Scholar] [CrossRef]
- Craw, D.; MacKenzie, D.J.; Grieve, P. Supergene gold mobility in orogenic gold deposits, Otago Schist, New Zealand. N. Z. J. Geol. Geophys. 2015, 58, 123–136. [Google Scholar] [CrossRef]
- Webster, J.G. The solubility of Au and Ag in the system Au–Ag–S–O2–H2O at 25 C and 1 atm. Geochim. Cosmochim. Acta 1986, 50, 245–255. [Google Scholar] [CrossRef]
- Kratos Analytical Ltd.: Library Filename: “casaXPS_KratosAxis-F1s.lib”. Available online: https://www.kratos.com/ (accessed on 15 June 2021).
- Nzulu, G.; Eklund, P.; Magnusson, M. Characterization and Identification of Au Pathfinder Minerals from an Artisanal Mine Site using X-ray Diffraction. J. Mater. Sci. 2021, 56, 7659–7669. [Google Scholar] [CrossRef]
- Fuggle, J.C.; Mårtensson, N. Core-Level Binding Energies in Metals. J. Electron Spectrosc. Relat. Phenom. 1980, 21, 275–281. [Google Scholar] [CrossRef]
- Kishi, K.; Nishioka, J. Interaction of Fe/Cu (100), Fe-Ni/Cu (100) and Ni/Fe/Cu (100) surfaces with O2 studied by XPS. Surf. Sci. 1990, 227, 97–106. [Google Scholar] [CrossRef]
- Lozzi, L.; Passacantando, M.; Picozzi, P.; Santucci, S.; Den Haas, H. Oxidation of the Fe/Cu (100) interface. Surf. Sci. 1995, 331, 703–709. [Google Scholar] [CrossRef]
- Mirsaleh-Kohan, N.; Bass, A.D.; Sanche, L. X-ray Photoelectron Spectroscopy Analysis of Gold Surfaces after Removal of Thiolated DNA Oligomers by Ultraviolet/Ozone Treatment. PMC 2001, 26, 6508–6514. [Google Scholar] [CrossRef] [PubMed] [Green Version]
- Dochartaigh, B.É.Ó.; Smedley, P.L.; MacDonald, A.M.; Darling, W.G.; Homoncik, S. Groundwater Chemistry of the Carboniferous Sedimentary Aquifers of the Midland Valley; British Geological Survey, Groundwater Program: Scotland, UK, 2011. [Google Scholar]
- Casaletto, M.P.; Longo, A.; Martorana, A.; Prestianni, A.; Venezia, A.M. XPS study of supported gold catalysts: The role of Au0 and Au+d species as active sites. Surf. Interface Anal. 2006, 38, 215–218. [Google Scholar] [CrossRef]
- Kaushik, V.K. XPS core level spectra and Auger parameters for some silver compounds. J. Electron Spectrosc. Relät. Phenom. 1991, 56, 273–277. [Google Scholar] [CrossRef]
- Liu, Y.; Jordan, R.G.; Qui, S.L. Electronic structures of ordered Ag-Mg alloys. Phys. Rev. 1994, 49, 4478. [Google Scholar] [CrossRef] [PubMed]
- XPS Interpretation of Silver. Available online: https://xpssimplified.com/elements/silver.php (accessed on 15 June 2021).
- Gaarenstroom, W.; Winograd, N. X-ray photoemission studies of atom implanted matrices: Cu, Ag, and Au in SiO2. J. Chem. Phys. 1979, 70, 5714–5721. [Google Scholar]
- Bzowski, A.; Sham, T.K.; Watson, R.E.; Weinert, M. Electronic structure of Au and Ag overlayers on Ru (001): The behavior of the noble-metal d bands. Phys. Rev. B 1995, 51, 9980–9984. [Google Scholar] [CrossRef]
- Biesinger, M.C.; Payne, B.P.; Andrew, P.; Grosvenor, A.P.; Laua, L.W.M.; Gerson, A.R.; Smart, R.S.C. Resolving surface chemical states in XPS analysis of first row transition metals, oxides and hydroxides: Cr, Mn, Fe, Co and Ni. Appl. Surf. Sci. 2011, 257, 2717–2730. [Google Scholar] [CrossRef]
- Uhlig, I.; Szargan, R.; Nesbitt, H.W.; Laajalehto, K. Surface states and reactivity of pyrite and marcasite. Appl. Surf. Sci. 2001, 179, 222–229. [Google Scholar] [CrossRef]
- Van Der Heide, H.; Hemmel, R.; Van Bruggen, C.F.; Haas, C. X-ray photoelectron spectra of 3 d transition metal pyrites. J. Solid State Chem. 1980, 33, 17–25. [Google Scholar] [CrossRef]
- Riga, J.; Tenret-Noel, C.; Pireaux, J.J.; Caudano, R.; Verbist, J.J.; Gbillon, Y. Electronic structure of rutile oxides TiO2, RuO2, IrO2, studied by X-ray photoelectron spectroscopy. Phys. Scr. 1977, 16, 351–354. [Google Scholar] [CrossRef]
- Lebugle, A.; Axelsson, U.; Nyholm, R.; Mårtensson, N. Experimental L and M Core Level Binding Energies for the Metals 22Ti to 30Zn. Phys. Scr. 1981, 23, 825. [Google Scholar] [CrossRef]
- Castillo, R.; Koch, B.; Ruiz, P.; Delmon, B. Influence of the Amount of Titania on the Texture and Structureof Titania Supported on Silica. J. Catal. 1996, 161, 524–529. [Google Scholar] [CrossRef]
- Sanjines, R.; Tang, H.; Berger, H.; Gozzo, F.; Margaritondo, G.; Levy, F. Electronic structure of anatase TiO2 oxide. J. Appl. Phys. 1994, 75, 2945–2951. [Google Scholar] [CrossRef]
- Baker, G. Detrital heavy minerals in natural accumulates: Australasian Inst. Mining and Metallurgy. Mon. Ser. 1962, 1, 146. [Google Scholar]
- Temple, A.K. Alteration of ilmenite. Econ. Ueol. 1966, 61, 695–714. [Google Scholar] [CrossRef]
- Deer, W.A.; Howie, R.A.; Zussman, J. Rock-Forming Minerals, v. 1, Ortho- and Ring Silicates; John Wiley and Sons: New York, NY, USA, 1962; 333p. [Google Scholar]
- Behner, H.; Wecker, J.; Matthee, T.; Samwer, K. XPS study of the interface reactions between buffer layers for HTSC thin films and silicon. Surf. Interface Anal. 1992, 18, 685–690. [Google Scholar] [CrossRef]
- Anpo, M.; Nakaya, H.; Kodama, S.; Kubokawa, Y.; Domen, K.; Onishi, T. photocatalysis over binary metal oxides. Enhancement of photocatalytic activities of titanium dioxide in titanium-silicon oxides. J. Phys. Chem. 1986, 90, 1633–1636. [Google Scholar] [CrossRef]
- Rogers, J.D.; Sundaram, V.S.; Kleiman, G.G.; Castro, C.G.C.; Douglas, R.A.; Peterlevitz, A.C. High resolution study of the M45N67N67 and M45N45N67 Auger transitions in the 5d series. J. Phys. F. 1982, 12, 2097–2102. [Google Scholar] [CrossRef]
- Humbert, P. An XPS and UPS photoemission study of HgO. Solid State Common. 1986, 60, 21–24. [Google Scholar] [CrossRef]
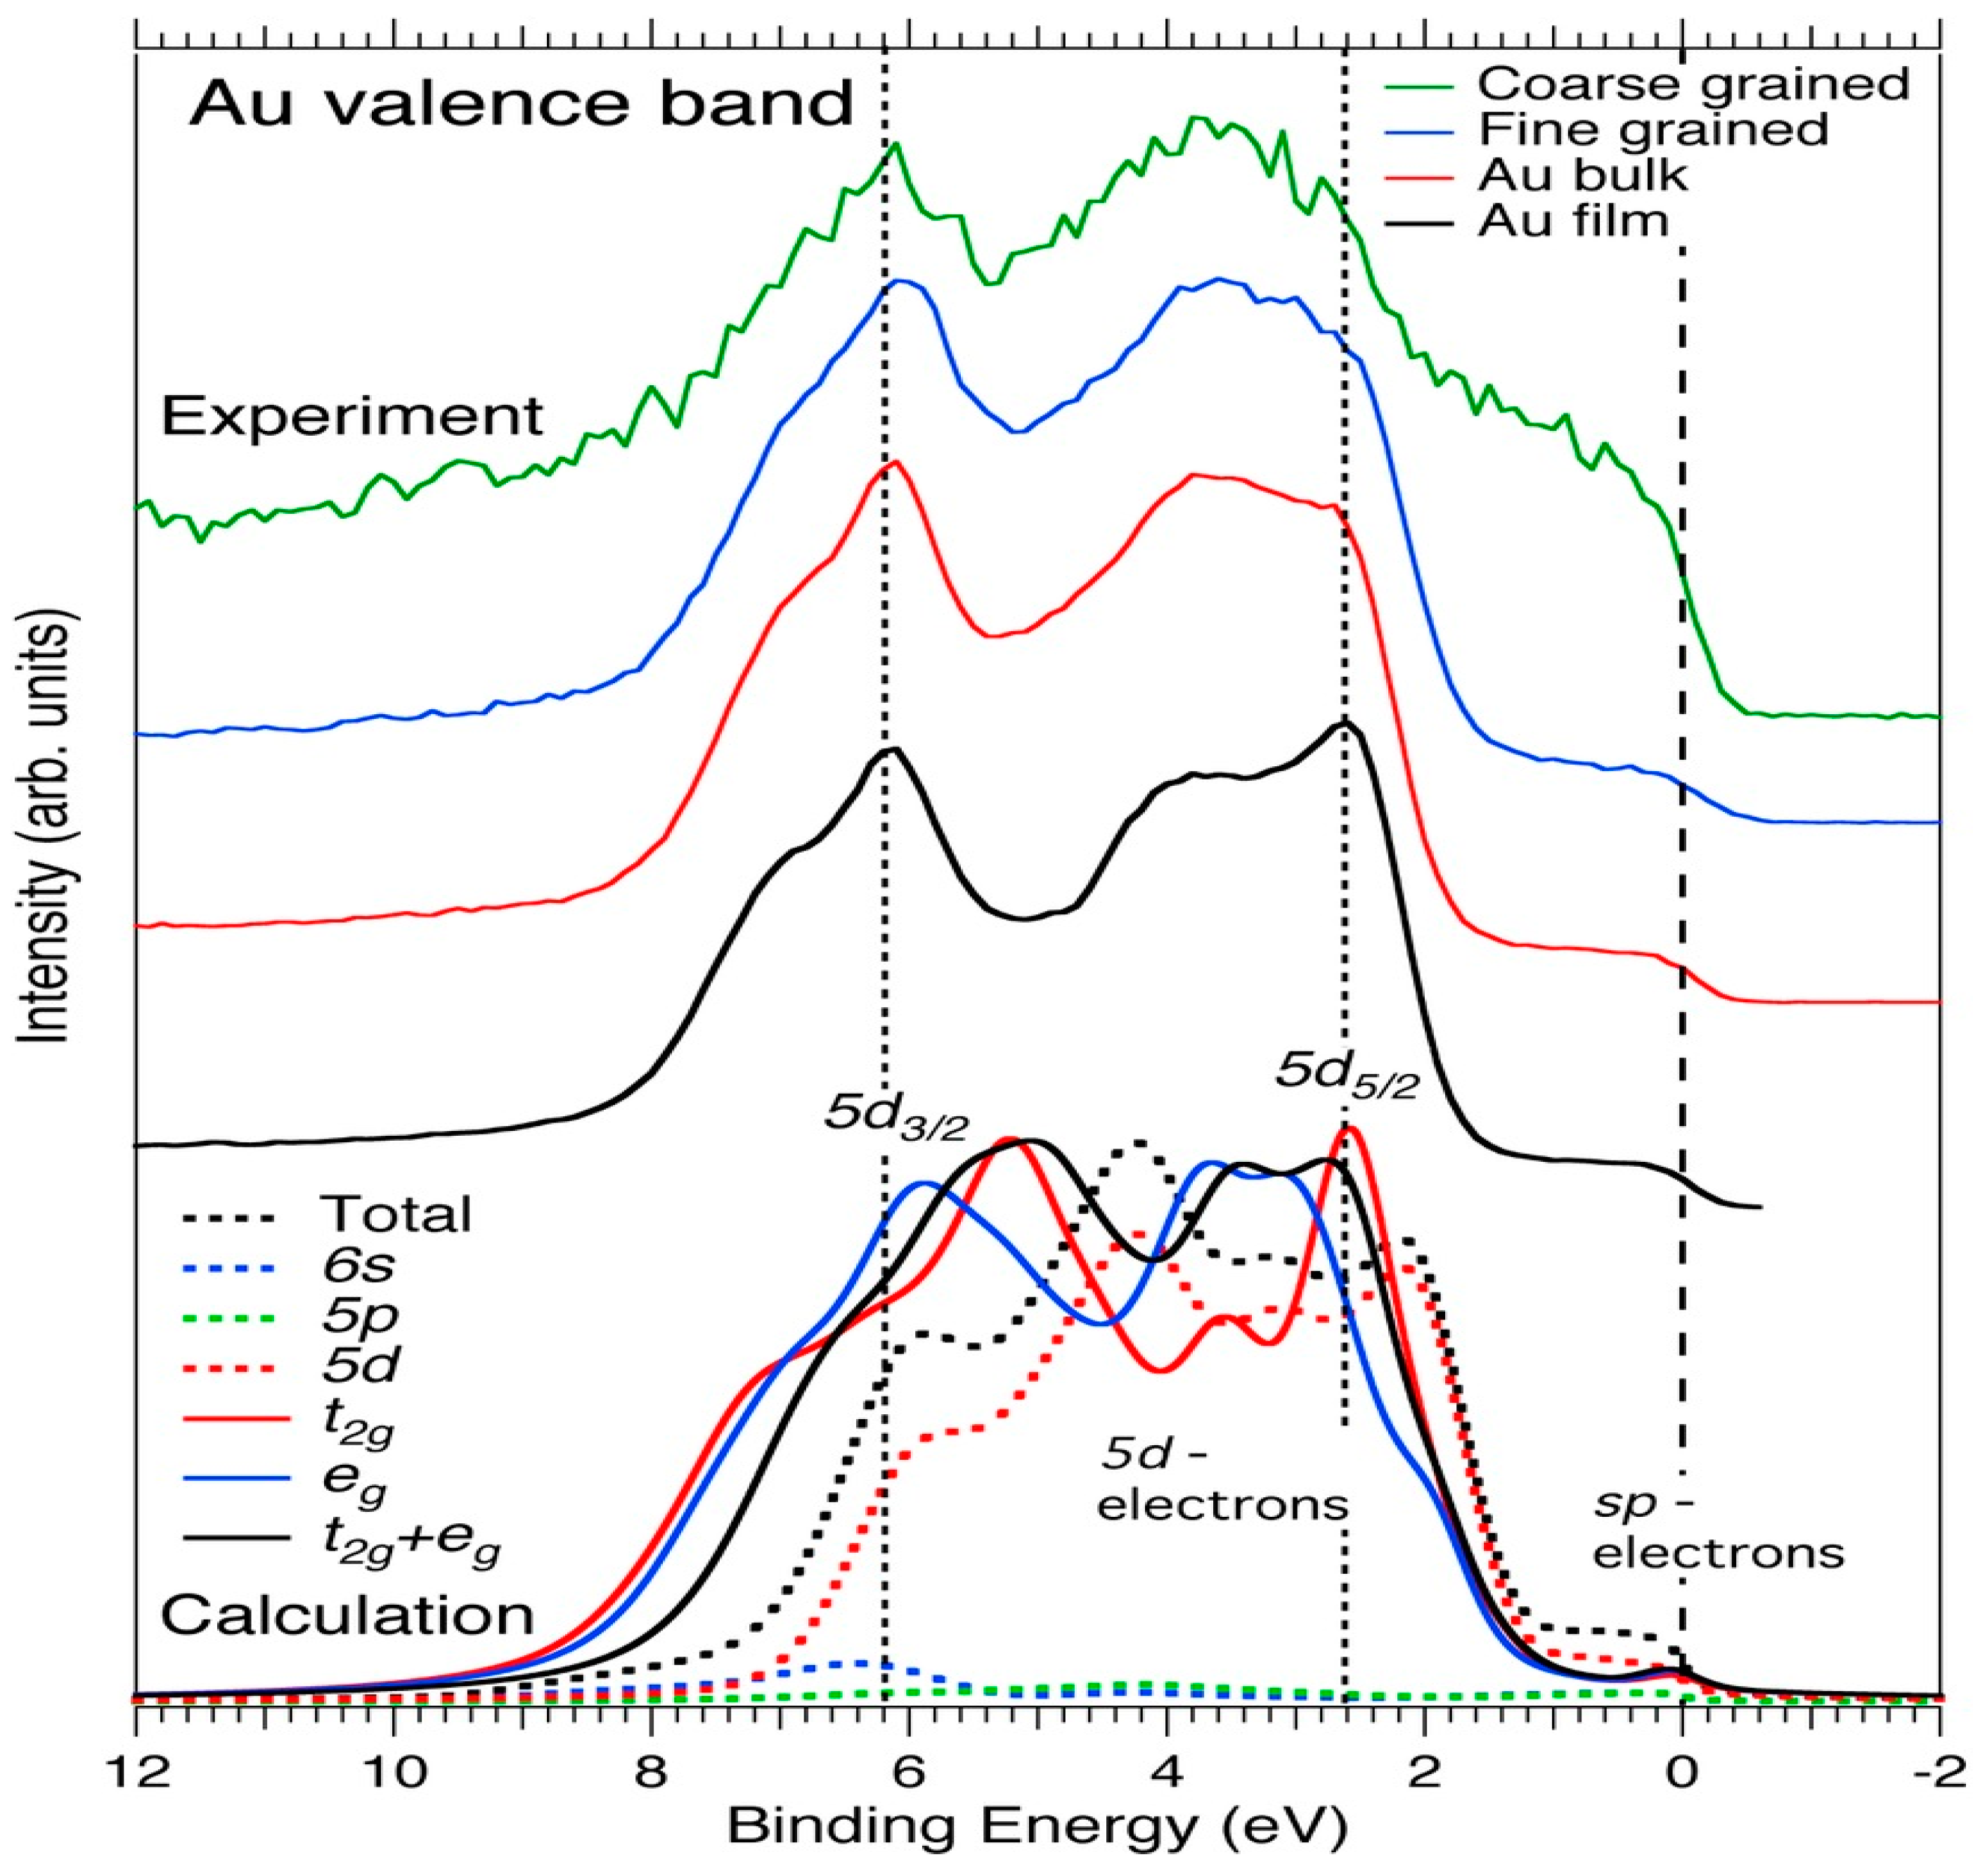
- Sekiyama, A.; Yamaguchi, J.; Higashiya, A.; Obara, M.; Sugiyama, H.; Kimura, M.Y.; Suga, S.; Imada, S.; Nekrasov, I.A.; Yabashi, M.; et al. Prominent 5d-orbital contribution to the conduction electrons in gold. New J. Phys. 2010, 12, 043045. [Google Scholar] [CrossRef]
- Zhang, J.-X.; Sheong, F.K.; Zhenyang, L. Superatomic Ligand-Field Splitting in Ligated Gold Nanoclusters. Inorg. Chem. 2020, 59, 8864–8870. [Google Scholar] [CrossRef] [PubMed]
- Howard, A.; Clark, D.N.S.; Mitchell, C.E.J.; Egdell, R.G.; Dhanak, V.R. Initial and final state effects in photoemission from Au nanoclusters on TiO2 (110). Surf. Sci. 2002, 518, 210–224. [Google Scholar] [CrossRef]
- Zhang, P.; Sham, T.K. X-ray Studies of the Structure and Electronic behaviour of Akanethiolate-Capped Gold Nanoparticles: The Interplay of size and Surface Effects. Phys. Rev. Lett. 2003, 90, 245502. [Google Scholar] [CrossRef] [Green Version]
- Zafeiratos, S.; Kennou, S. A study of gold ultrathin film growth on yttria-stabilized ZrO2(100). Surf. Sci. 1999, 443, 238–244. [Google Scholar] [CrossRef]
- DiCenzo, S.B.; Berry, S.D.; Hartford, E.H. Photoelectron spectroscopy of single-size Au clusters collected on a substrate. J. Phys. Rev. B Condens. Matter Mater. Phys. 1988, 38, 8465–8468. [Google Scholar] [CrossRef] [PubMed]
- Roulet, H.; Mariot, J.-M.; Dufour, G.; Hague, C.F. Size dependence of the valence bands in gold clusters. J. Phys. F Met. Phys. 1980, 10, 1025–1030. [Google Scholar] [CrossRef]
- Mason, M.G. Electronic structure of supported small metal clusters. Phys. Rev. B Condens. Matter Mater. Phys. 1983, 27, 748–762. [Google Scholar] [CrossRef]
- Peters, S.; Peredkov, S.; Neeb, M.; Eberhardt, W.; Al-Hada, M. Size-dependent XPS spectra of small supported Au-clusters. Surf. Sci. 2013, 608, 129–134. [Google Scholar] [CrossRef]
- Takahiro, K.; Oizumi, S.; Morimoto, K.; Kawatsura, K.; Isshiki, T.; Nishio, K.; Nagata, S.; Yamamoto, S.; Narumi, K.; Naramoto, H. Application of X-ray photoelectron spectroscopy to characterization of Au nanoparticles formed by ion implantation into SiO2. Appl. Surf. Sci. 2009, 256, 1061–1064. [Google Scholar] [CrossRef]
- Chenakinab, S.P.; Kruse, N. Au 4f spin–orbit coupling effects in supported gold nanoparticles. Phys. Chem. Chem. Phys. 2016, 18, 22778–22782. [Google Scholar] [CrossRef] [PubMed]
- Moslemia, H.; Gharabaghi, M. A review on electrochemical behavior of pyrite in the froth flotation process. J. Ind. Eng. Chem. 2017, 47, 1–18. [Google Scholar] [CrossRef]
- Corkhill, C.L.; Vaughan, D.J. Arsenopyrite oxidation—A review. Appl. Geochem. 2009, 24, 2342–2361. [Google Scholar] [CrossRef]


| Element | Spectral Line | Formula | Energy (eV) | Parent Mineral |
|---|---|---|---|---|
| Au | 4s | Au | 762.0 | Gold |
| Au | 4p3/2,1/2 | Au | 546.0/642.0 | Gold |
| Au | 4d | Au | 335.0 | Gold |
| Au | 5p3/2 | Au | 57.20 | Gold |
| Au | 4f | Au | 84.0/87.0 | Gold |
| Ti | 3p | TiO2 | 37.50 | Hematite, garnet, and other silicate minerals |
| Ti | 2s | TiO2 | 561.00 | Hematite, garnet, and other silicate minerals |
| Ti | 2p3/2, 1/2 | TiO2 | 458.0/464.19 | Hematite, garnet, and other silicate minerals |
| Si | 2p | SiO2 | 102 | Quartz |
| Si | 2s | SiO2 | 153.0 | Quartz |
| S | 2p | S | 163 | Au-S/FeS2 |
| S | 2s | S | 231 | Au-S/FeS2 |
| Ag | 3p1/2, 3/2 | Ag | 604.0–573.0 | Silver |
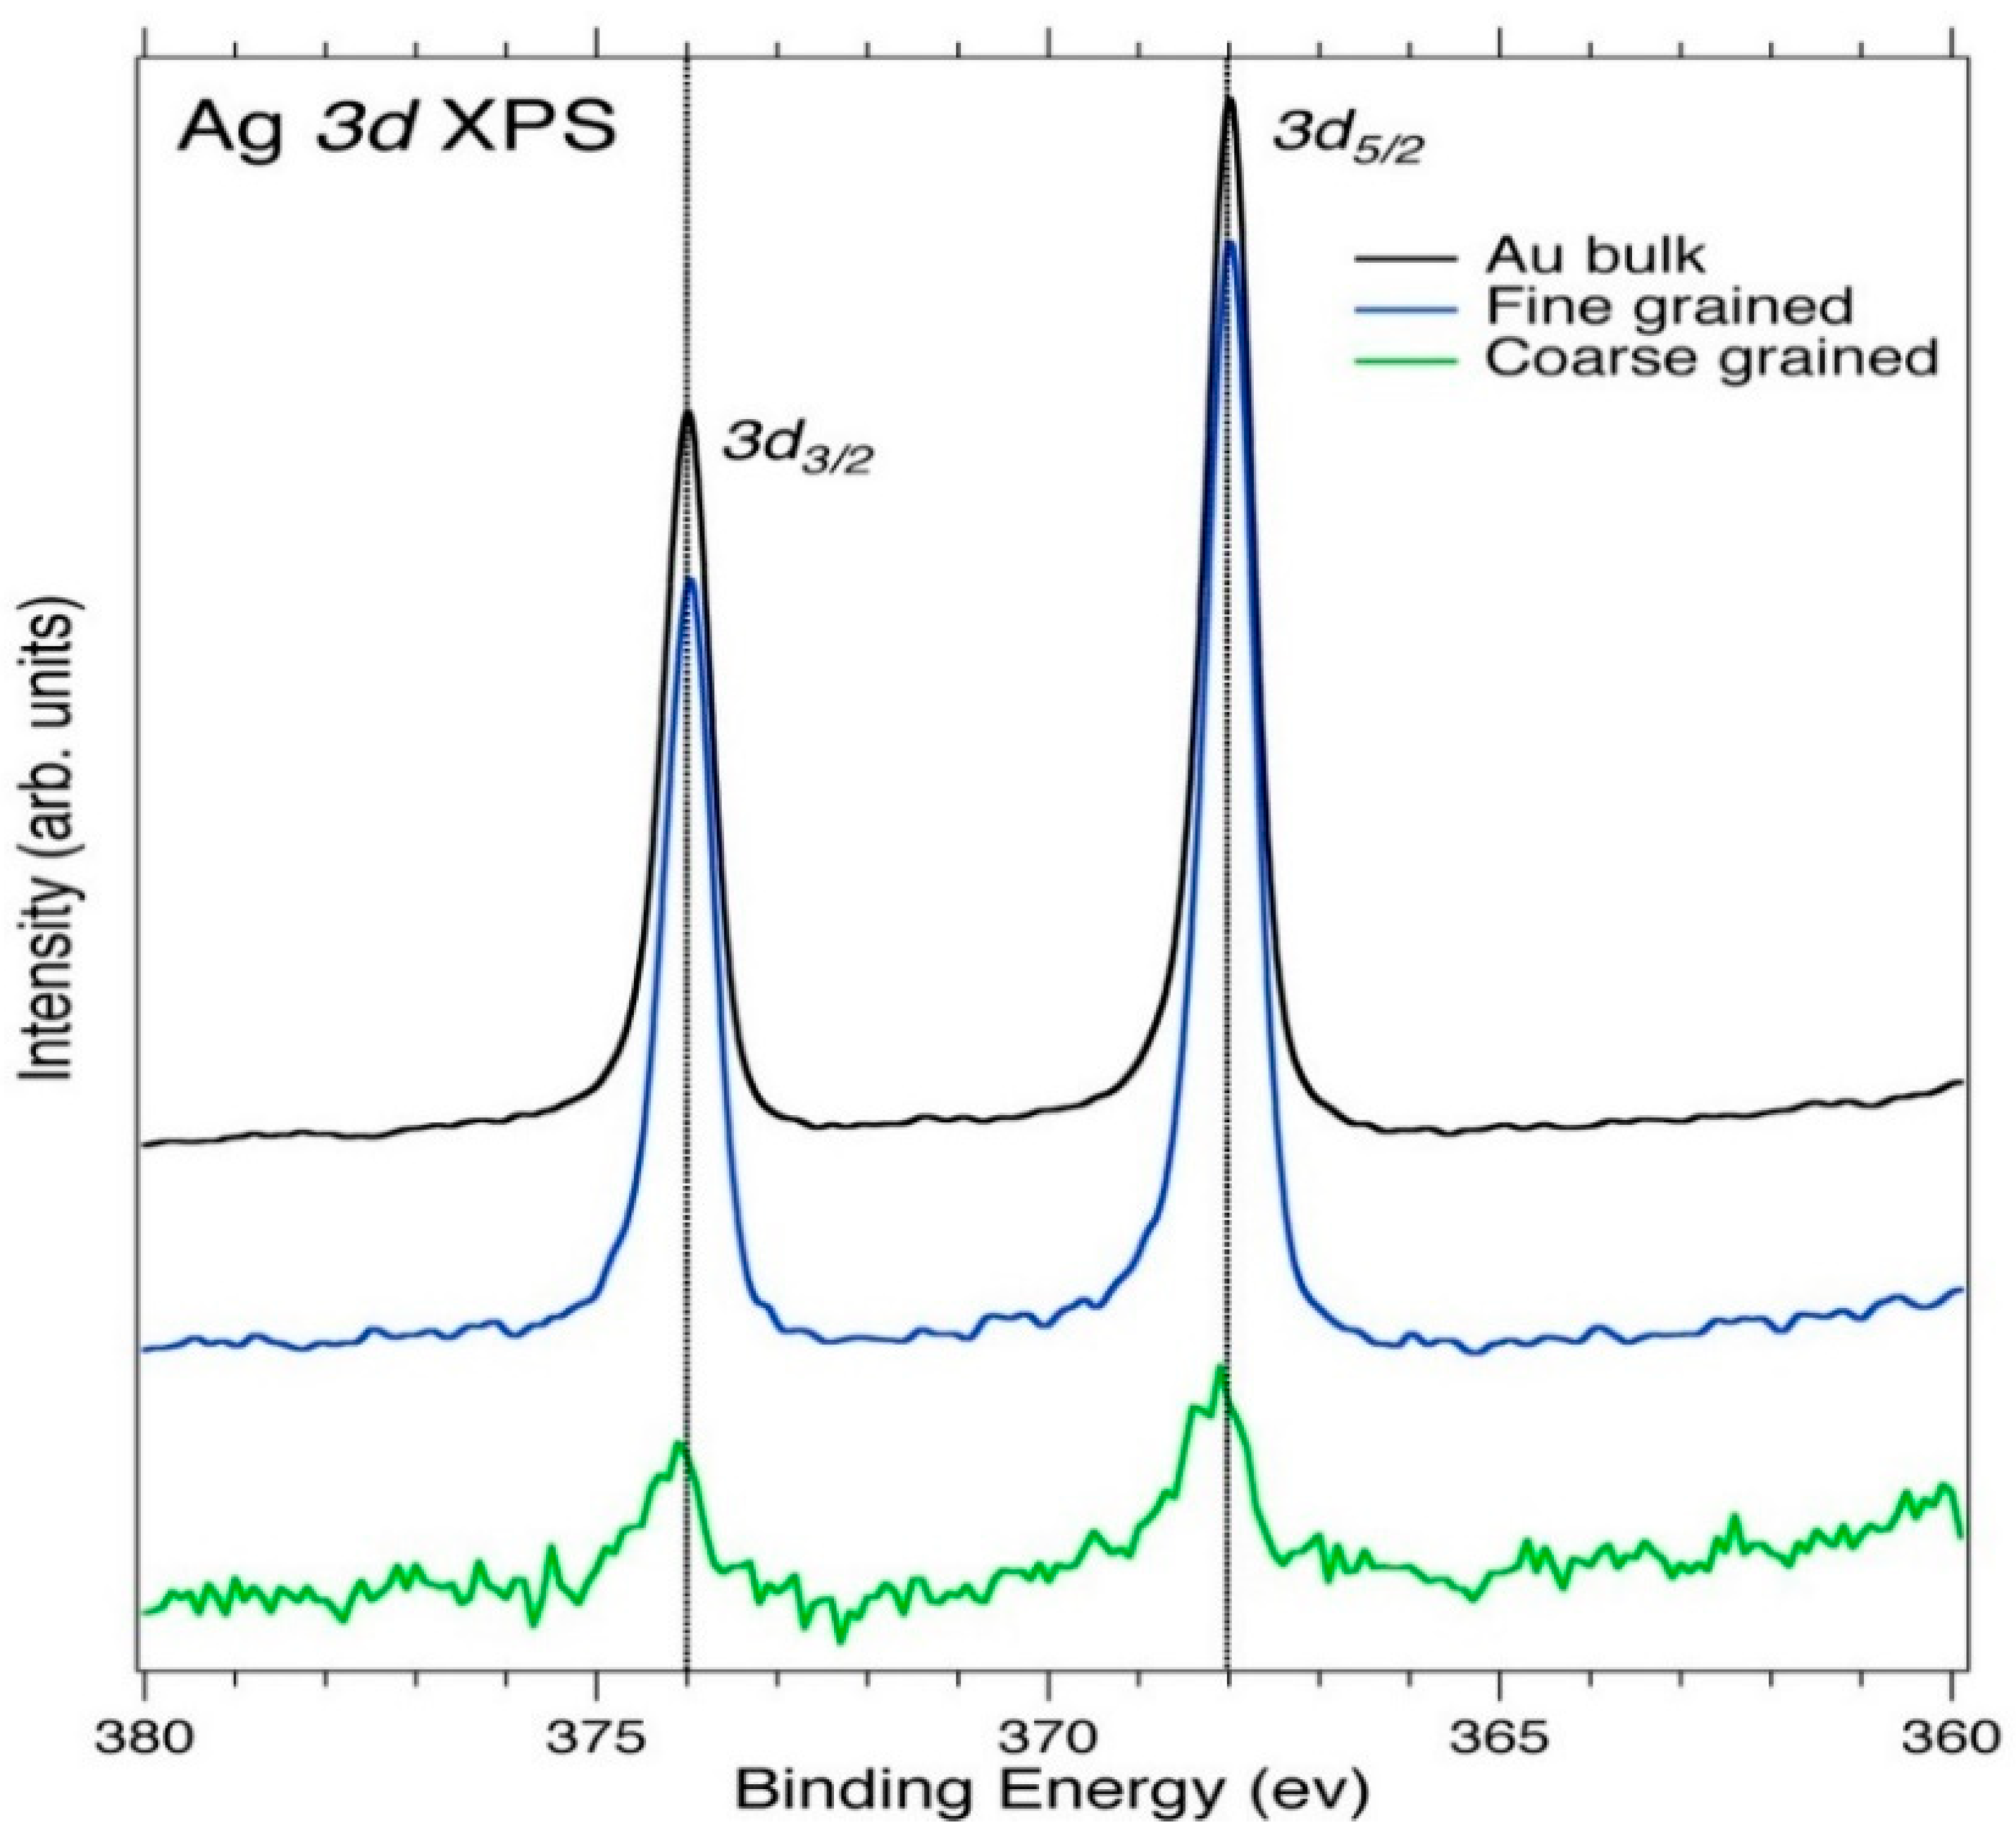
| Ag | 3d3/2, 5/2 | Ag | 368.0–374.0 | Silver |
| Ag | 3s | Ag | 719.0 | Silver |
| N | 1s | N | 397.0 | Nitrogen |
| O | 1s | O | 532.0 | Oxides |
| C | 1s | C | 285.0 | Carbon/graphite |
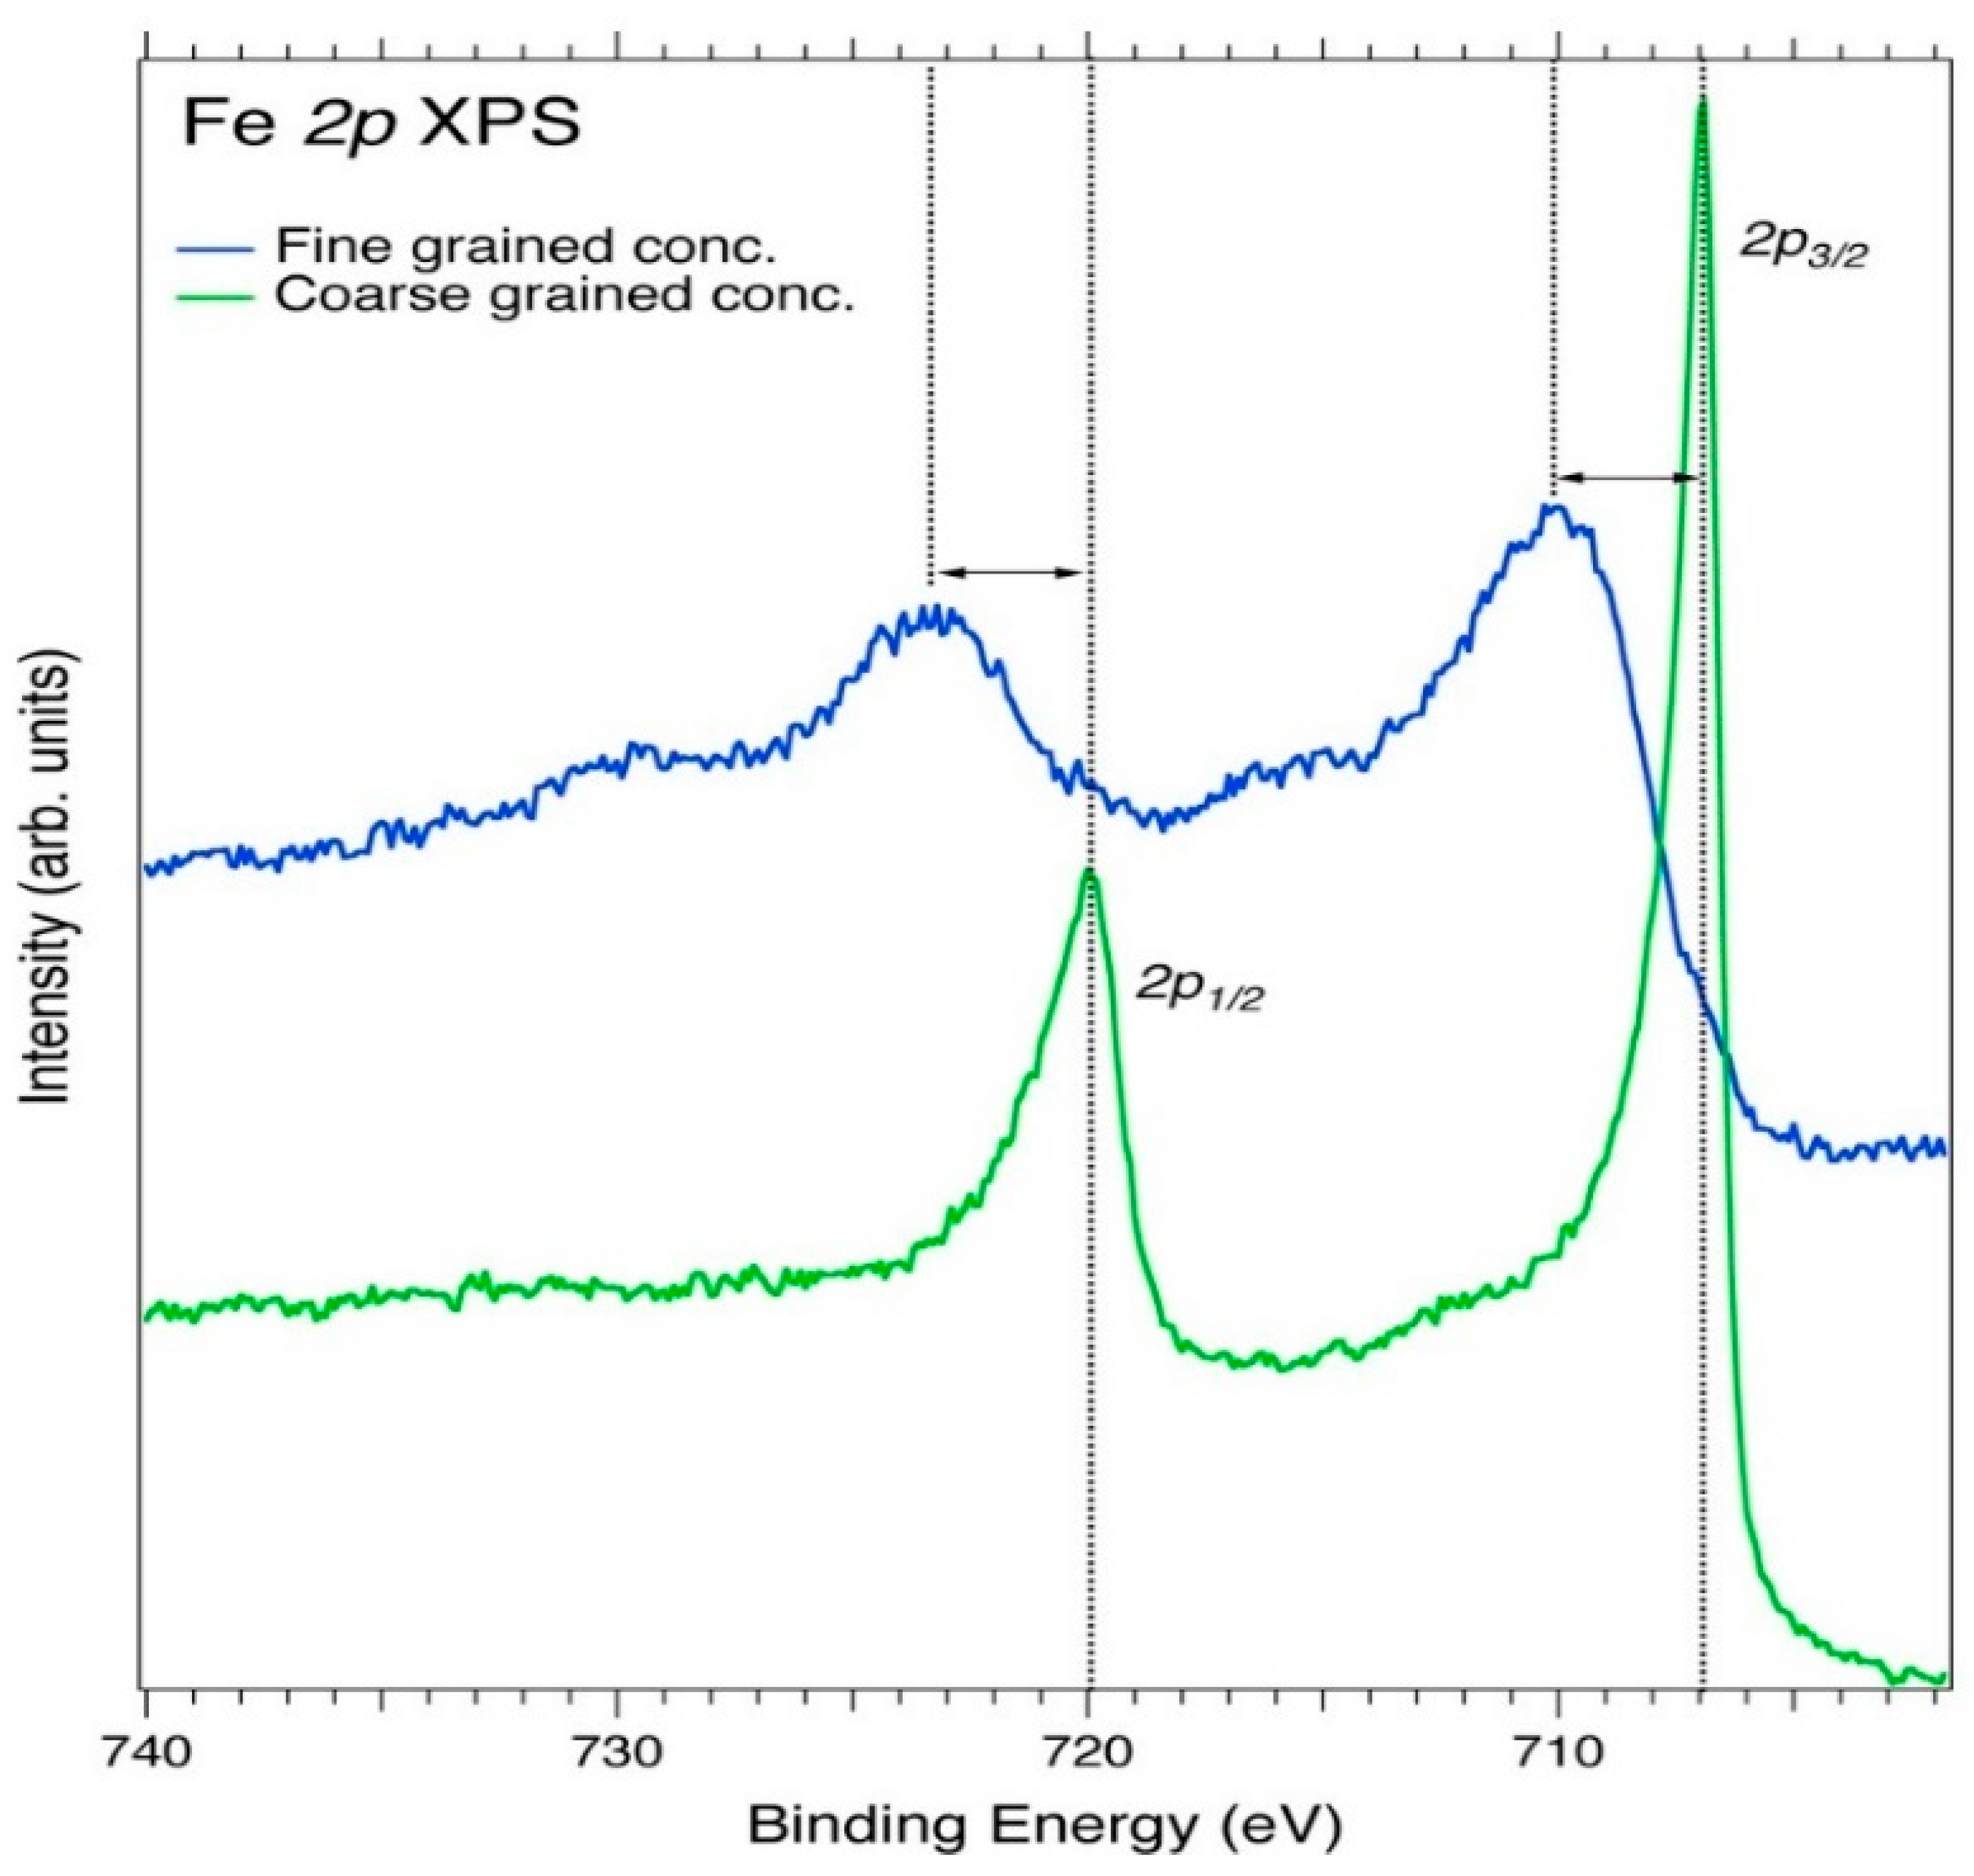
| Fe | 2p3/2 | Fe/Cu | 706.90 | Iron/FeS2 |
| Fe | 2p1/2 | Fe/Cu | 720.0 | Iron/FeS2 |
| Hg | 2p | Hg | 104 | Hg |
| Hg | 4p3/2 | Hg | 577 | Hg |
| System | Au4f (at.%) | Ag3d (at.%) | C1s (at.%) | O1s (at.%) | Fe2p (at.%) | Mn (at.%) |
|---|---|---|---|---|---|---|
| Au bulk | 88 | 6 | 3 | 2 | 1 | - |
| Fine-grained Au | 32 | 4 | 7 | 32 | 24 | 3 |
| Coarse-grained Au | 6 | 1 | 27 | 34 | 26 | 6 |
| Sample | Bulk Au (at%) | Powder Fine-Grained (at.%) | Powder Coarse-Grained (at.%) |
|---|---|---|---|
| Element | |||
| C | 11.7 | 9.50 | 23.3 |
| O | 7.44 | 14.4 | 22.1 |
| Si | 1.17 | 0.58 | 2.55 |
| Fe | 1.82 | 4.39 | 3.40 |
| Ag | 6.39 | 6.40 | 4.58 |
| Au | 71.2 | 64.2 | 42.6 |
| Al | 0.38 | 0.57 | - |
| Hg | - | - | 1.55 |
Publisher’s Note: MDPI stays neutral with regard to jurisdictional claims in published maps and institutional affiliations. |
© 2021 by the authors. Licensee MDPI, Basel, Switzerland. This article is an open access article distributed under the terms and conditions of the Creative Commons Attribution (CC BY) license (https://creativecommons.org/licenses/by/4.0/).
Share and Cite
Nzulu, G.K.; Bakhit, B.; Högberg, H.; Hultman, L.; Magnuson, M. Elucidating Pathfinding Elements from the Kubi Gold Mine in Ghana. Minerals 2021, 11, 912. https://doi.org/10.3390/min11090912
Nzulu GK, Bakhit B, Högberg H, Hultman L, Magnuson M. Elucidating Pathfinding Elements from the Kubi Gold Mine in Ghana. Minerals. 2021; 11(9):912. https://doi.org/10.3390/min11090912
Chicago/Turabian StyleNzulu, Gabriel K., Babak Bakhit, Hans Högberg, Lars Hultman, and Martin Magnuson. 2021. "Elucidating Pathfinding Elements from the Kubi Gold Mine in Ghana" Minerals 11, no. 9: 912. https://doi.org/10.3390/min11090912
APA StyleNzulu, G. K., Bakhit, B., Högberg, H., Hultman, L., & Magnuson, M. (2021). Elucidating Pathfinding Elements from the Kubi Gold Mine in Ghana. Minerals, 11(9), 912. https://doi.org/10.3390/min11090912