Abstract
Vibrating flip-flow screens (VFFS) are widely used to separate high-viscosity and fine materials. The most remarkable characteristic is that the vibration intensity of the screen frame is only 2–3 g (g represents the gravitational acceleration), while the vibration intensity of the screen surface can reach 30–50 g. This effectively solves the problem of the blocking screen aperture in the screening process of moist particles. In this paper, the approximate state of motion of the sieve mat is realized by setting the discrete rigid motion at multiple points on the elastic sieve mat of the VFFS. The effects of surface energy levels between particles separated via screening performance were compared and analyzed. The results show that the flow characteristics of particles have a great influence on the separation performance. For 8 mm particle screening, the particle’s velocity dominates its movement and screening behavior in the range of 0–8 J/m2 surface energy. In the feeding end region (Sections 1 and 2), with the increase in the surface energy, the particle’s velocity decreases, and the contact time between the particles and the screen surface increases, and so the passage increases. When the surface energy level continues to increase, the particles agglomerate together due to the effect of the cohesive force, and the effect of the particle’s agglomeration is greater than the particle velocity. Due to the agglomeration of particles, the difficulty of particles passing through the screen increases, and the yields of various size fractions in the feeding end decrease to some extent. In the transporting process, the agglomerated particles need to travel a certain distance before depolymerization, and the stronger the adhesive force between particles, the larger the depolymerization distance. Therefore, for the case of higher surface energy, the screening percentage near the discharging end (Sections 3 and 4) is greater. The above research is helpful to better understand and optimize the screening process of VFFS.
1. Introduction
Flip-flow screening technology is a new concept of screening technology that has been widely used and promoted in recent years. The VFFS has a wide range of applications in many fields, such as the fine coal screening process, cyclic screening of ore grinding products by high-pressure roller mill, and resource utilization of building solid waste [1,2]. Compared to traditional vibrating screens, such as linear vibrating screens and circular vibrating screens, the VFFS has the following advantage: small vibration intensity of main screen frame (2–3 g), therefore the dynamic load on the foundation is small; high vibration intensity of the sieve mat (up to 30–50 g). Furthermore, the VFFS is extremely friendly to the screening of viscous and wet fine-grained material, and it is not easy to block apertures on the screen surface while ensuring high screening efficiency and processing capacity. Due to the existence of water content between viscous and wet particles, there is a liquid bridge force between particles; particles will gather into clusters when the cohesion between particles is strong enough. When using traditional vibrating screens to process the wet and fine particles, the vibration intensity is not enough to make the agglomerated particles depolymerized, and the screens are extremely prone to blockage, adhesion, and compaction, which deteriorates the screening process [3]. The vibration frequency of VFFS is generally lower than a traditional screen, but through the large deformation of the elastic sieve mat, the peak acceleration is easy to produce. The vibration response of the sieve mat agitates the particle bed to deagglomerate the agglomerated particles. This drives the fine particles to flow down the bed and then pass through the screen to become the undersized product. The elastic sieve mat agitates the bed to depolymerize the agglomerated particles.
Standish constructed a single-particle model to investigate particle motion base on the reaction kinetics and probability theory. However, the collision between particles is not considered [4,5]. Soldinger developed a semi-mechanical phenomenological model of a linear vibrating screen, taking into account the stratification and passage [6]. Soldinger further extended the model after considering the material loading effect and the screening efficiency of different size particles [7]. The actual screening process is very complicated, and particle movement is affected by many conditions. At present, the discrete element method (DEM) simulation is an effective method for the simulation of granular systems, which has been used in various industrial processes. Cleary et al. quantitatively investigated the particle flow and screening performance of an industrial double-deck banana screen with different accelerations based on DEM simulation [8,9]. Davoodi et al. reported the effect of the aperture shape and the material on the particle flow and sieving performance [10]. Dong et al. simulated the screening process with the discrete element method and studied the influence of rectangular aperture shapes, with different aspect ratios, on material movement and screening efficiency [11]. Zhao et al. studied the influence of the motion parameters of the linear and circular vibration screens on the screening performance [12]. Wang et al. used the discrete element and the finite element methods to study the influence of vibration parameters on the screening efficiency of the vibrating screen. In addition, the distribution of stress and deformation on the screen surface under different vibration conditions has also been reported [13].
The above studies are mostly focusing on dry particulate systems, which are based on the Hertz–Mindlin model. In the actual screening process, due to the small particle size, large specific surface area, and external moisture, the fine particles easily agglomerate with each other to form large-size particles. The particles agglomerate together and move as a whole, making the screening process difficult. Limtrakul et al. reported that fine particles in a fluidized bed have particle agglomeration and stagnation regions due to high cohesion and confirmed the influence of vibration on improving fluidization through experiments [14]. Yang et al. investigated the influence of surface energy on the transition behavior of Geldart A-type particles from a fixed bed to a bubbling bed through a two-dimensional DEM-CFD simulation [15]. Cleary et al. reported the effect of cohesion between particles on particle flow over a double-deck banana screen [16]. At present, there are few numerical simulation studies on the movement and separation of viscous and wet material on VFFS.
In this study, the elastic sieve mat of the VFFS is discretized into multiple units by testing the movement of each unit body. According to the phase relationship of the unit body, it can describe the kinematics of the entire elastic sieve mat. The motion of each point on the sieve mat can be transformed into a function form by the Fourier series, which is used as the basis for setting the motion of the VFFS model. The effects of different adhesion levels on particle flow and screening performance on VFFS were compared and analyzed, which is helpful to better understand and optimize the screening process of the VFFS.
2. Simulation Methods
2.1. Contact Model of Particles
Due to clay and water present on the particle surface, there is a cohesive force between particles. The commonly used Hertz–Mindlin contact model struggles to comprehensively analyze the mechanical behavior between wet particles and between particles and the screen surface. The Hertz–Mindlin with JKR contact model, which considers the cohesive force, can better simulate the behavior of viscous and wet particles. Taking into account the effect of the surface energy (adhesion force) between the particles on the movement and screen penetration, the calculation of the normal elastic contact force is based on the Johnson–Kendall–Roberts theory [17,18].
Figure 1 shows the contact process of two cohesive particles. and represent the radius of Particle 1 and 2, respectively (mm). stands for the contact radius between the particles (mm), and is the radius of the contact surface considering the adhesion (mm). is the amount of normal overlap (mm). Due to the cohesive force on the contact surface, the contact radius of these two particles extends from to .
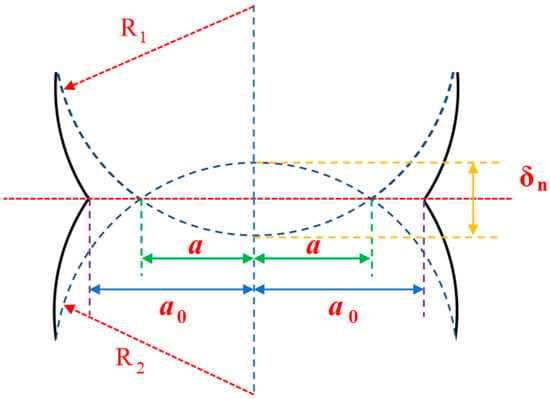
Figure 1.
Deformation surface (rough line) considering cohesive force.
The cohesive force between the wet and viscous particles is set as (J/m2), which can be obtained by Equation (1).
where is the surface energy of Particle 1 (J/m2); is the surface energy of Particle 2 (J/m2); stands for the interface energy between Particles 1 and 2 (J/m2). When the material of the particles is the same, the interface energy is 0 J/m2, that is, , , therefore, .
Here is the surface energy between wet particles (J/m2); is the equivalent contact radius (mm); is the equivalent elastic modulus (N/m2); , represent the elastic modulus of Particle 1 and 2, respectively (N/m2); are the Poisson’s ratio of these two particles, respectively (-).
Then, the normal elastic contact force (N) between the wet particles can be calculated by Equation (6):
When the surface energy of the viscous particle is 0 J/m2, the model is simplified to the contact force .
2.2. The DEM Model Setting of VFFS
The structures of the VFFS and elastic sieve mat are presented in Figure 2. Different from the traditional vibrating screens, the VFFS consists of two vibrating frames, including the main screen frame and the floating screen frame. The beams of the two frames are arranged in a staggered layout. When the exciter mounted on the main screen frame is operated, both the screen frames move relative to each other through the effect of rubber shear springs. The elastic sieve mats are periodically stretched and slackened to generate peak acceleration, typically 30–50 times gravity.
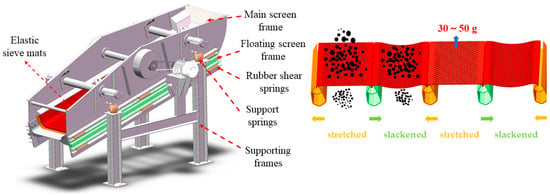
Figure 2.
Structures of the VFFS and elastic sieve mat.
For traditional screening equipment such as circular vibrating screens and linear vibrating screens, the vibration parameters of the screen surface are consistent with the vibration response of the screen frame. Therefore, it is relatively easy to set the model of the traditional vibrating screen in the discrete element simulation. Many scholars have already done many in-depth studies in these fields [19,20,21]. For the VFFS, the vibration response of each position on the elastic sieve mat is different. The accelerometer is used to test the amplitude response at different positions on the elastic sieve mat. Figure 3 shows the measuring displacement of the midpoint of the sieve mat.
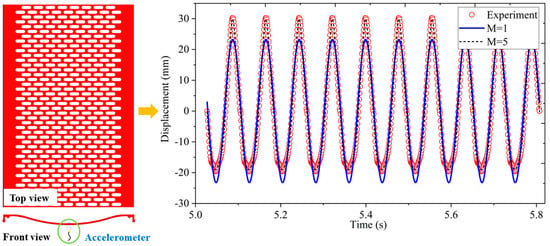
Figure 3.
Fourier series analysis of amplitude at the midpoint of the sieve mat.
The displacement signal of the measuring point on the screen surface is not a regular simple harmonic function but periodic. Fortunately, any periodic function of time can be represented by the Fourier series as an infinite sum of sine and cosine terms [22]. Its Fourier series representation is given by Equation (7).
where is called the fundamental frequency (rad/s) and ,,,…,,,… are constant coefficients (-). The M (intercepted order of Fourier series) has a direct impact on the accuracy of the calculation results. The larger the M, the closer the analysis result is to the accurate value [23], but it will also affect the solution efficiency. Then, we take the amplitude of the midpoint as an example for the Fourier analysis. Within a motion cycle, the peak value of the amplitude is 30.27 mm. In contrast to the signals analyzed by the Fourier series with the measured values, the results are shown in Figure 3. The mean square error (MSE) of a period and the relative error (RE) of maximum amplitude in the time domain are used to evaluate the change between the measured amplitude and the Fourier series analysis result. The results are shown in Table 1.

Table 1.
Measured amplitude and analyzed amplitude by Fourier series on the midpoint.
When the M is equal to one, the MSE is 13.06. When the M is equal to five, the MSE reduces to 0.2. Meanwhile, the RE is only 1.1%. Therefore, in this paper, the intercepted order of all amplitudes analyzed by the Fourier series is taken as five. The testing vibration amplitudes of each point on the elastic sieve mat are shown in Figure 4. It can be seen that the vibration amplitudes on the elastic sieve mat are symmetrically distributed, the midpoint has a large amplitude, and the edge measuring point has a relatively small amplitude. The movement of each point can be transformed into a function by the above-mentioned Fourier analysis method.
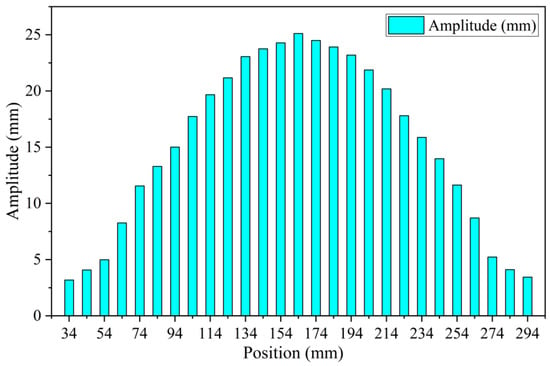
Figure 4.
Vibration amplitude of each measuring point of the elastic sieve mat.
Further, the sieve mat is discretized into multiple units, and the simulation of the approximate continuous flexible motion is realized through the setting of multi-point rigid motion, as shown in Figure 5.
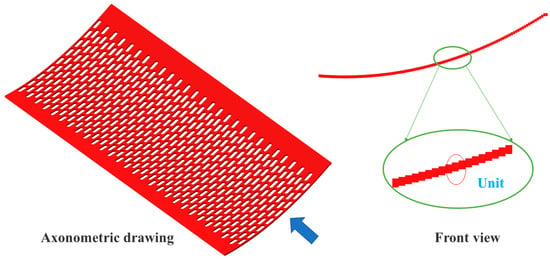
Figure 5.
DEM model of the elastic sieve mat.
2.3. Simulation Conditions
Figure 6a shows the DEM modeling schematic of the VFFS system. The VFFS used in the simulation process is specifically composed of eight elastic sieve mats, each with a size of 328 mm × 650 mm. The screen aperture is 8 mm × 25 mm, and the inclination angle of the screen is 15°. In the simulation, the undersized product is divided into four parts equally by using 633.6 mm as the length interval unit, namely Sections 1–4. Section 5 is used to collect the oversized product. The feeding system is composed of a silo and a vibrating feeder. The material properties are shown in Figure 6b, and the simulation parameters in the DEM are shown in Table 2 [24,25]. It is worth noting that the impact of particle shape on the screening process is not considered in this study. The particles used in this simulation are all homogeneous spherical particles.
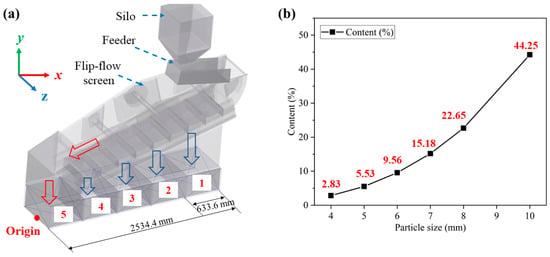
Figure 6.
(a) Schematic of the DEM model of the VFFS system; (b) material properties of the sample.

Table 2.
Modeling condition in EDEM.
3. Effect of Surface Energy Level on Separation Performance
During the screening process, there are always some fine particles existing in the oversized products and some coarse particles in the undersized products. The screening efficiency and total misplaced material were used to assess the screening performance in this paper. The calculation formulas are as follows [26,27]:
where the is the screening efficiency (%), and stand for the effective placement efficiency of the coarse particles (%) and the effective placement efficiency of fine particles (%), respectively. The is the total misplaced material (%), and are the misplaced material of coarse particles (%) and the misplaced material of fine particles (%), respectively. The represents the yield of oversized product (%), is the yield of undersized product (%), is the ratio of fine particles in the oversized product (%), is the ratio of coarse particles in the oversized product (%), is the ratio of coarse particles in the feeding (%), and is the ratio of fine particles in the feeding (%).
Figure 7 shows the flow characteristics of material on VFFS with three surface energy levels (4, 20, and 36 J/m2). In the case of the surface energy of 4 J/m2, when the particles enter the screen, the vibration of the sieve mat quickly enables the material to spread on the screen surface. A larger amount of material pass through the screen in Section 1. As the screening process progresses along the direction of material flow, the amount of penetration in other sections gradually decreases. When the surface energy is 20 J/m2, compared to the case of 4 J/m2, the yield of material in Section 1 is reduced. This section mainly promotes the depolymerization of agglomerated particles. Meanwhile, the yield of material in Section 2 is increased. When the surface energy is 36 J/m2, there is a great cohesion force between the particles, and the agglomerated particles need a longer movement distance to complete the depolymerization process. In Sections 1 and 2, which near the feeding end, the yield of the undersized product is low, and more particles are concentrated in Sections 3 and 4, near the discharging end. To further deepen the understanding of the screening process of VFFS, quantitative analysis was carried out on the products of each section.
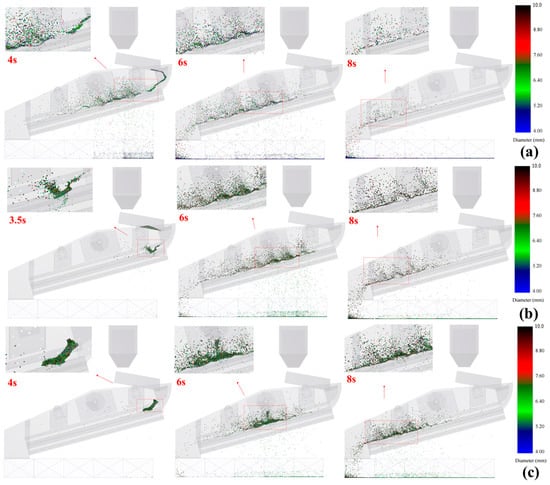
Figure 7.
The flow behavior of material on VFFS with different surface energy levels. (a) 4, (b) 20, and (c) 36 J/m2.
3.1. The Yield of Each Section of VFFS
Figure 8a shows the distribution of product yields between undersized and oversized products with different surface energy levels, where the distribution is related to the surface energy between particles. With the increase in the surface energy level between particles, the yield of the undersized product first increased and then decreased, and at the same time, the yield of oversized products decreased and then increased. This means that for each surface energy level, the sum of the undersized and oversized product is 100%. In the case of the surface energy level of 0–8 J/m2, the particle movement speed dominates the movement and separation behavior of the particles. With the increase in the surface energy level within the range of 0–8 J/m2, the particle movement speed decreases, increasing the contact time between the particle and the screen surface. Therefore, the amount of material passing through the screen increases. When the cohesive force continues to increase to a certain level, the particles agglomerate together, and the impact of particle agglomeration is greater than the particle movement speed. As more fine particles agglomerate together, their size increases to greater than the aperture size, and the material screening percentages decreases. The stronger the surface energy between the particles, the longer the distance the agglomerated particles need to deagglomerate. More fine particles finally enter the oversized products, so the yield of undersized products drops again. When the surface energy level is 36 J/m2, around 70% of the material enters the oversized product.
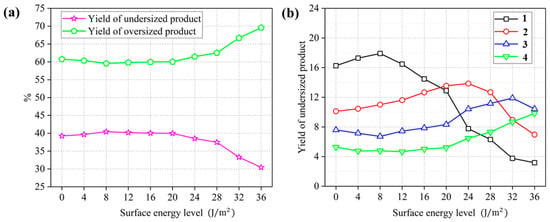
Figure 8.
(a) Distribution of the yields between the undersized and oversized product with different surface energy levels; (b) The undersized product yields of each section with different surface energy levels.
The yield of each section of the undersized product is further analyzed, and the results are shown in Figure 8b. It can be seen that with the increase of the surface energy level, the yield of the undersized product in Section 1 shows a trend of increasing and then decreasing. When the surface energy is 8 J/m2, the yield in Section 1 is the largest, which is 17.91%. When the surface energy of particles continues to increase, the yield of Section 1 will gradually decrease. For the yield of Section 2, with the increase of the surface energy, it also shows the law of first increasing and then decreasing. However, the maximum yield appears at the surface energy of 24 J/m2. With the increase of the surface energy, the yield in Section 3 first decreases and then increases to a maximum value when the surface energy is 32 J/m2 and then decreases again. The yield in Section 4 first decreases and then increases. For the surface energy levels of 0, 4, 8, 12 and 16 J/m2, the undersized product yield of each section gradually decreases along the direction of the material flow, and Section 1 accounts for the largest proportion. When the surface energy is 20 J/m2, the yield in Section 2 is greater than the yield of Section 1. When the surface energy level continues to increase to 32 J/m2, the yield of Section 3 is greater than the products of Sections 1 and 2. In Section 1, less than 4% of the particles pass through the screen. As the surface energy increases, the section with the maximum yield moves toward the discharging end. That is, the higher the adhesion, the longer the distance required for the depolymerization of the agglomerated particles.
3.2. The Yield Accounted for Size Fraction in Different Sections
Figure 9 shows the yield accounted for different size fractions in different sections, during the screening process of the VFFS. For 8 mm particle screening and different surface energy levels, the 10 mm particles are the oversized product and are all concentrated in Section 5. When the surface energy is 0, 4, and 8 J/m2, the 4 and 5 mm particles are mainly concentrated in Section 1, accounting for about 50% of this size fraction. With the increase of particle size, the yield accounts for this size fraction in Section 1 gradually decreases. For the 8 mm particles, the yields of this size fraction are 16.59%, 18.41%, and 19.80%, respectively. In addition, for the case of these surface energy levels, as the surface energy between particles increases, the yield of each size fraction also increases. This is because the increase in the level of adhesion reduces the speed of particle movement. The contact time between the particles and the screen surface is increased, increasing the yield of the particles of each size fraction. For the cases of the surface energy of 12, 16, and 20 J/m2, the yield of each size fraction in Section 1 gradually decreased, and the yield of 4 and 5 mm particles decreased to 51.93%, 44.50%, 36.63% and 47.98%, 38.87%, 35.40%, respectively. For the case of the surface energy levels of 24, 28, and 32 J/m2, in the product of Section 1, the yield accounted for the size fraction of each sized particle further decreases. Meanwhile, it is worth noting that the yield of 4 mm particles in Section 1 is slightly smaller than that of 5 mm particles, which is due to the surface energy of particles having a greater influence on fine ones.
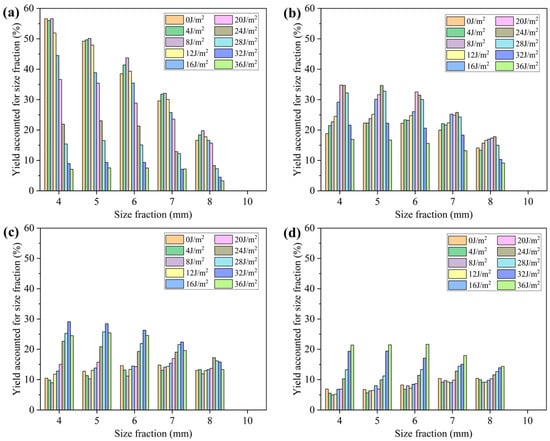
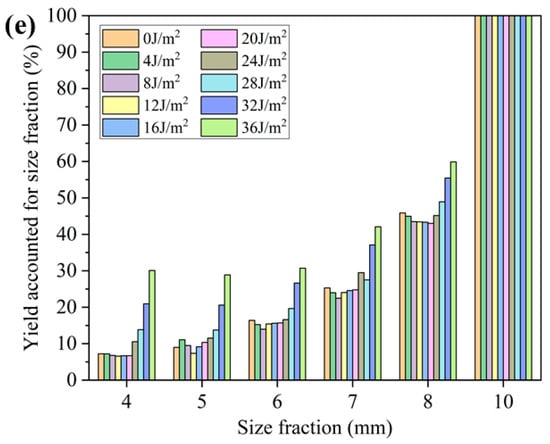
Figure 9.
Comparison of the particle size distributions captured into Sections 1 (a), 2 (b), 3 (c), 4 (d), and 5 (e) with different surface energy levels.
The yield of each sized particle in Section 2 was observed. For the case of 0, 4, and 8 J/m2 surface energy, the yield of the undersized product in Section 2 was significantly lower than Section 1. Within the range of 0–8 J/m2, as the surface energy increased, the yield of fine particles increased, and this phenomenon was more obvious when the adhesion level was higher. When the surface energy was 24 J/m2, the yields of each size fraction in Section 2 begin to exceed those in Section 1. The yields of large-sized materials in Sections 3 and 4 are generally higher than in small-sized materials. As the surface energy increases, more fine particles are deagglomerated under the movement of the sieve mat in Sections 3 and 4, and the yield of fine particles in the product begins to exceed that of coarse particles, becoming the dominant product in Sections 3 and 4. For particles with a higher level of adhesion, a longer movement distance, that is, a higher external energy supplement, is required to complete the depolymerization of agglomerated particles. The higher the adhesive force level, the closer the maximum yield section in the undersized product is to the discharging end. Moreover, the smaller the particle size, the more obvious this phenomenon.
3.3. The Screening Percentage of Different Size Fractions of Different Sections
The screening percentages of various size fractions in different Sections of VFFS with different surface energy levels are shown in Figure 10. In the products of Section 1, for the particles at the surface energy of 24, 28, 32 J/m2, and 36 J/m2, it can be seen that the screening percentages of various size fractions are significantly lower than that of other surface energy levels. Taking 4 mm particles as an example, the screening percentages of 4 mm particles are 21.93%, 15.41%, 9.00%, and 7.10%, respectively. The main effect of Section 1 is to promote the depolymerization of agglomerated particles. The longer the transporting distance of agglomerated particles, the better the depolymerization effect. It can be observed that for 4 mm particles under the case of the surface energy level of 20 J/m2, the screening percentage in Section 1 is 36.63%, in Section 2 increases to 54.89%, and the screening percentages in Sections 3 and 4 are 52.45% and 50.74%, respectively. When the cohesive force level continues to increase to 28 J/m2, the screening percentage in Section 1 is 15.41%, in Section 2 it is 38.08%, and increases to 48.23% and 48.89% in Sections 3 and 4, respectively. When the surface energy is 36 J/m2, the screening percentage in Section 1 is only 7.10%, and further increases to 18.19%, 32.24%, and 41.55%, respectively. Compared with the coarse particles, the surface energy level has a more significant effect on fine particles. After the depolymerization of fine particles, the screening percentage of fine particles will be significantly improved.
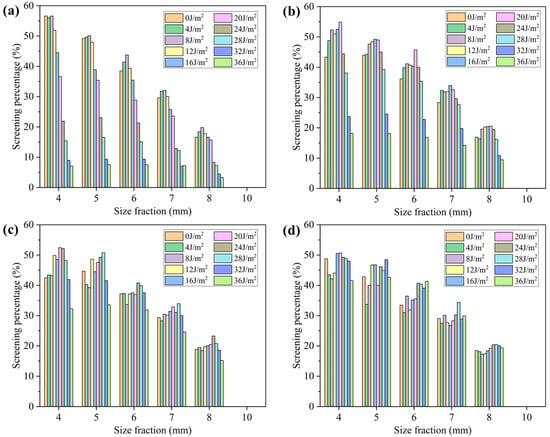
Figure 10.
Comparison of the screening percentages of various size fractions in Sections 1 (a), 2 (b), 3 (c), and 4 (d) of VFFS with different surface energy levels.
3.4. The Screening Performance of Various Size Fractions in Different Sections and Screen Length
Figure 11 and Figure 12 show the screening efficiency and misplaced material of various size fractions in different sections and screen lengths of the VFFS with different surface energy levels. The particles shape in the simulation are spherical, so in the actual simulation process, no coarse particles enter the undersized products. The effective placement efficiency of the coarse particles is 100%, and the misplaced material of coarse particles is 0%. Therefore, the screening efficiency is equal to the effective placement efficiency of fine particles, and the total misplaced material is equal to the misplaced material of fine particles. For 8 mm particle screening, when the surface energy between particles is 0 J/m2, the screening efficiency in Section 1 reaches the maximum of 29.15%, and the total misplaced material is 39.50%. With the flow of material, the screening efficiency in Sections 1–4 decreases gradually. When the surface energy increases to 5 and 8 J/m2, the screening efficiency increases in Sections 1 and 2, and the total misplaced material decreases, which is mainly due to the surface energy between particles reducing the movement speed of particles and increasing the residence time of particles on the screen surface, thus increasing the screening efficiency. After the surface energy of 16 J/m2, the influence of particle agglomeration begins to be greater than particle velocity, and the screening efficiency starts to decrease. The screening efficiency of Section 2 begins to be greater than that of Section 1. In addition, the screening efficiency of Sections 3 and 4 are higher than those of the levels 0, 5, 8, and 12 J/m2. For the case of 24 J/m2, the maximum screening efficiency appears in Section 3, which is 30.54%. When the surface energy increases to 32 J/m2, the screening efficiency of Section 4 is the highest, which is 27.88%. For different surface energy levels, the screening efficiency of particles increased with the increase in screening length. When the surface energy is 8 J/m2, the screening efficiency of VFFS is the highest, which is 72.52%, and the total misplaced material is 23.81%.
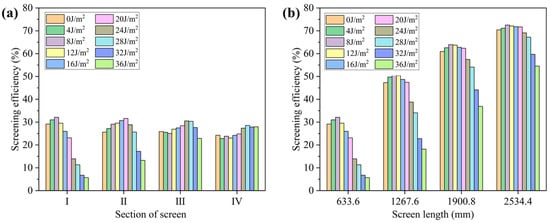
Figure 11.
(a) Screening efficiency of different sections of the screen with different surface energy levels, (b) screening efficiency of different screen lengths with different surface energy levels.
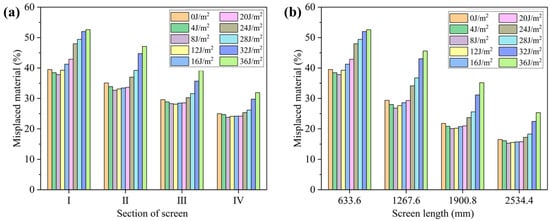
Figure 12.
(a) Misplaced material of the different sections of the screen with different surface energy levels, (b) misplaced material of different screen lengths with different surface energy levels.
4. Conclusions
The following conclusions can be drawn from the above research.
(1) Due to the amplitude at each point on the sieve mat changing periodically, the motion can be transformed into a function form by the Fourier series. The DEM simulation of VFFS is realized by setting the multi-point rigid motion of the sieve mat.
(2) When the surface energy level is in the range of 0 to 8 J/m2, the particle velocity in the feeding end region (Sections 1 and 2) dominates the movement behavior of particles passing through the screen. In Sections 1 and 2, the particle movement speed decreases, which increases the contact time between the particles and the screen surface, increasing the screening percentages. When the level of surface energy continues to increase, more fine particles are agglomerated together, which increases the screening difficulty. The effect of particle agglomeration in the feeding end is greater than its movement speed, and the screening percentages of each particle size in the feeding end have been reduced. Agglomerated particles need a certain transporting distance to deagglomerate. The stronger the surface energy between particles, the greater the distance the particles need to deagglomerate. Therefore, for the case of a higher surface energy level, close to the discharging end (Sections 3 and 4), the screening percentages of the material are greater.
(3) The screening efficiency increases with the increase in screen length for different surface energy levels. When the surface energy is 8 J/m2, the screening performance of VFFS is better, with a screening efficiency of 72.52% and a total misplaced material of 23.81%.
Since the shape of the screen apertures of the elastic sieve mat is a straight slot, in the actual screening process, there is a situation that the strip particles pass through the screen. In future work, the influence of the shape characteristics of the particles on their movement and screening performance should be considered. Furthermore, we still need to carry out some full-scale screening experiments of wet particles based on the experimental VFFS.
Author Contributions
Conceptualization, C.Y. and X.W.; methodology, C.Y. and X.W.; software, C.Y.; validation, C.Y., R.G. and X.W.; formal analysis, C.Y.; investigation, C.Y.; resources, X.W.; data curation, C.Y.; writing—original draft preparation, C.Y. and R.G.; writing—review and editing, X.W.; visualization, X.W.; supervision, X.W.; project administration, X.W.; funding acquisition, X.W. All authors have read and agreed to the published version of the manuscript.
Funding
This research was funded by “the Fundamental Research Funds for the Central Universities” (No. 2020YJSHH17) (No. 2021YJSHH32).
Data Availability Statement
All data and models generated or used during the study appear in the submitted article.
Acknowledgments
The authors would like to thank the company of TianGong technology for its support in enabling this research.
Conflicts of Interest
The authors declare no conflict of interest.
References
- Zhai, H.X. Determination of the operation range for flip-flow screen in industrial scale based on amplitude-frequency response. J. China Coal Soc. 2007, 7, 753–756. [Google Scholar]
- Gong, S.; Oberst, S.; Wang, X. An experimentally validated rubber shear spring model for vibrating flip-flow screens. Mech. Syst. Signal Process. 2020, 139, 106619. [Google Scholar] [CrossRef]
- Xiong, X.; Niu, L.; Gu, C.; Wang, Y. Vibration characteristics of an inclined flip-flow screen panel in banana flip-flow screens. J. Sound Vib. 2017, 411, 108–128. [Google Scholar] [CrossRef]
- Standish, N. The kinetics of batch sieving. Powder Technol. 1985, 41, 57–67. [Google Scholar] [CrossRef]
- Standish, N.; Bharadwaj, A.; Hariri-Akbari, G. A study of the effect of operating variables on the efficiency of a vibrating screen. Powder Technol. 1986, 48, 161–172. [Google Scholar] [CrossRef]
- Soldinger, M. Interrelation of stratification and passage in the screening process. Miner. Eng. 1999, 12, 497–516. [Google Scholar] [CrossRef]
- Soldinger, M. Influence of particle size and bed thickness on the screening process. Miner. Eng. 2000, 13, 297–312. [Google Scholar] [CrossRef]
- Cleary, P.W.; Sinnott, M.D.; Morrison, R.D. Separation performance of double deck banana screens—Part 1: Flow and separation for different amplitudes. Miner. Eng. 2009, 22, 1218–1229. [Google Scholar] [CrossRef]
- Cleary, P.; Sinnott, M.D.; Morrison, R.D. Separation performance of double deck banana screens—Part 2: Quantitative predictions. Miner. Eng. 2009, 22, 1230–1244. [Google Scholar] [CrossRef]
- Davoodi, A.; Bengtsson, M.; Hulthén, E.; Evertsson, C. Effects of screen decks’ aperture shapes and materials on screening efficiency. Miner. Eng. 2019, 139, 105699. [Google Scholar] [CrossRef]
- Dong, K.; Esfandiary, A.H.; Yu, A. Discrete particle simulation of particle flow and separation on a vibrating screen: Effect of aperture shape. Powder Technol. 2017, 314, 195–202. [Google Scholar] [CrossRef]
- Zhao, L.L.; Liu, C.S.; Yan, J.X.; Jiang, X.W.; Zhu, Y. Numerical simulation of particle segregation behavior in different vibration modes. Acta Phys. Sin Ch. Ed. 2010, 59, 2582–2588. [Google Scholar]
- Wang, Z.; Liu, C.; Wu, J.; Jiang, H.; Zhao, Y. Impact of screening coals on screen surface and multi-index optimization for coal cleaning production. J. Clean. Prod. 2018, 187, 562–575. [Google Scholar] [CrossRef]
- Limtrakul, S.; Rotjanavijit, W.; Vatanatham, T. Lagrangian modeling and simulation of effect of vibration on cohesive particle movement in a fluidized bed. Chem. Eng. Sci. 2007, 62, 232–245. [Google Scholar] [CrossRef]
- Yang, F.; Thornton, C.; Seville, J. Effect of surface energy on the transition from fixed to bubbling gas-fluidised beds. Chem. Eng. Sci. 2013, 90, 119–129. [Google Scholar] [CrossRef]
- Cleary, P.W.; Wilson, P.; Sinnott, M.D. Effect of particle cohesion on flow and separation in industrial vibrating screens. Miner. Eng. 2018, 119, 191–204. [Google Scholar] [CrossRef]
- Cao, B.; Li, W.H.; Wang, N.; Bai, X.Y.; Wang, C.W. Calibration of Discrete Element Parameters of the Wet Barrel Finishing Abrasive Based on JKR Model. Surf. Technol. 2019, 48, 249–256. [Google Scholar]
- Feng, X.; Liu, T.; Wang, L.; Yu, Y.; Zhang, S.; Song, L. Investigation on JKR surface energy of high-humidity maize grains. Powder Technol. 2021, 382, 406–419. [Google Scholar] [CrossRef]
- Delaney, G.W.; Cleary, P.; Hilden, M.; Morrison, R.D. Testing the validity of the spherical DEM model in simulating real granular screening processes. Chem. Eng. Sci. 2012, 68, 215–226. [Google Scholar] [CrossRef]
- Davoodi, A.; Asbjörnsson, G.; Hulthén, E.; Evertsson, M. Application of the Discrete Element Method to Study the Effects of Stream Characteristics on Screening Performance. Minerals 2019, 9, 788. [Google Scholar] [CrossRef]
- Harzanagh, A.A.; Orhan, E.C.; Ergun, S.L. Discrete element modelling of vibrating screens. Miner. Eng. 2018, 121, 107–121. [Google Scholar] [CrossRef]
- Singiresu, S.R. Mechanical Vibrations, 5th ed.; Prentice Hall: Upper Saddle, NJ, USA, 2011; pp. 72–80. [Google Scholar]
- Zhang, Y.; Shi, D.; He, D.; Shao, D. Free Vibration Analysis of Laminated Composite Double-Plate Structure System with Elastic Constraints Based on Improved Fourier Series Method. Shock. Vib. 2021, 2021, 8811747. [Google Scholar] [CrossRef]
- Li, Y.; Xu, Y.; Thornton, C. A comparison of discrete element simulations and experiments for ‘sandpiles’ composed of spherical particles. Powder Technol. 2005, 160, 219–228. [Google Scholar] [CrossRef]
- Wu, B.; Zhang, X.; Niu, L.; Xiong, X.; Dong, Z.; Tang, J. Research on Sieving Performance of Flip-Flow Screen Using Two-Way Particles-Screen Panels Coupling Strategy. IEEE Access 2019, 7, 124461–124473. [Google Scholar] [CrossRef]
- Jiang, H.; Wang, W.; Zhou, Z.; Jun, H.; Wen, P.; Zhao, Y.; Duan, C.; Zhao, L.; Luo, Z.; Liu, C. Simultaneous multiple parameter optimization of variable-amplitude equal-thickness elastic screening of moist coal. Powder Technol. 2019, 346, 217–227. [Google Scholar] [CrossRef]
- Jiang, H.; Zhao, Y.; Duan, C.; Zhang, C.; Diao, H.; Wang, Z.; Fan, X. Properties of technological factors on screening performance of coal in an equal-thickness screen with variable amplitude. Fuel 2017, 188, 511–521. [Google Scholar] [CrossRef]
Publisher’s Note: MDPI stays neutral with regard to jurisdictional claims in published maps and institutional affiliations. |
© 2021 by the authors. Licensee MDPI, Basel, Switzerland. This article is an open access article distributed under the terms and conditions of the Creative Commons Attribution (CC BY) license (https://creativecommons.org/licenses/by/4.0/).