Abstract
We investigated hellandite-group mineral phases from the Roman Region, alkali syenite ejecta, by multimethod analyses. They show a complex crystallisation history including co-precipitation of hellandite-(Ce) with brockite, resorption, sub-solidus substitution with mottanaite-(Ce), exsolution of perthite-like ferri-mottanaite-(Ce), overgrowth of an oscillatory-zoned euhedral shell of ferri-mottanaite-(Ce) and late, secondary precipitation of pyrochlore in the cribrose hellandite-(Ce) core. LREE/HREE crossover and a negative Eu anomaly in hellandite-group minerals follows fO2 increase during magma cooling. The distinction among the hellandite-group minerals is based on the element distribution in the M1, M2, M3, M4 and T sites. Additional information on miscibility relationship among the hellandite sensu strictu, tadzhikite, mottanaite, ferri-mottanaite and ciprianiite endmembers derives from molar fraction calculation. We observed that change in composition of hellandite-group minerals mimic the ligands activity in carbothermal-hydrothermal fluids related to carbonatitic magmatism.
1. Introduction
The hellandite group comprises rare and notably complex REE-rich borosilicate minerals. The authors of [1] provided a first determination of the crystal structure by single-crystal diffraction. They described the silicoborate chain [Si4B4O20(OH)2]−14 and the arrangements of all crystallographic sites, obtaining the final formula [Ca5.5(Y, RE)5.0□1.5] (Al1.1Fe3+0.9) (OH)4[Si8B8O40(OH)4]. The authors of [2] reported the crystal structure of a Th-rich hellandite-(Ce) occurring in sub-volcanic ejecta from Capranica, describing a tetrahedral distorted site, which can be occupied not only by H, as typically found for hellandite, but also by Be and Li. The authors of [3] provided the crystal chemistry of mottanaite-(Ce) and ciprianiite, both monoclinic, with the distorted tetrahedral site occupied mainly by Be and Li in mottanaite and by H in ciprianiite and hellandite. The proposed ideal formulas for the new endmembers were XCa4Y(CeCa)ZAlTBe2(Si4B4O22)WO2 for mottanaite-(Ce) and XCa4Y[(Th, U)(REE)]ZAlT□2(Si4B4O22)WO2 for ciprianiite. The authors of [4] provided a review of the nomenclature, the crystal chemistry and the crystal structure of the minerals of the hellandite group, defining the four endmembers based on various data from the literature. They provided a new general formula for the minerals of the hellandite group as follows: X4Y2ZT2[B4Si4O22]W2, where X = Na, Ca, Y, LREE3+ at the eightfold-coordinated M3 and M4 sites; Y = Ca, Y, HREE3+, Th4+, U4+ at the eightfold-coordinated M2 site; Z = Al, Mn3+, Fe3+, Ti4+ at the octahedral M1 site; T = □ (vacancy), Li, Be at the new tetrahedrally coordinated site; and W = OHH, F, O2− at the O5 site. The authors of [5] described Mn-bearing hellandite-(Y) from an Sc-rich granite pegmatite at Heftetjern, Tørdal, Telemark, Norway. A new endmember ferri-mottanaite-(Ce), the first Fe3+ dominant species of the hellandite group, was described by [6]. However, the crystal structure and chemistry need more investigation, owing to the limited observation available, and there remain many questions still open about hellandite group members. Hellandite-group minerals require a considerable analytical effort due to their complex crystal chemistry, which readily responds to any change in the crystallising liquid/fluids. We analysed several hellandite crystals from the Vico Volcanic Complex, which offer an insight into a complex history of intergrowth-overgrowth and zoning of hellandite-(Ce), mottanaite-(Ce) and ferri-mottanaite-(Ce), accompanied by brockite and pyrochlore crystallisation. We present a new structural refinement of hellandite-(Ce) and the first Raman spectrum of ferri-mottanaite-(Ce), several representative new analyses and a new molar-fraction recalculation scheme. This paper poses new questions about hellandite-group endmember meaning, miscibility and REE speciation as a function of proto-hellandite, temperature and fO2. REE distribution in hellandite may help to reconstruct the concentration of LREE and HREE in different rock portions and different magmatic/hydrothermal stages.
2. Geological Setting
The Roman Region in Central Italy (RR hereinafter, [7]) consists of four main volcanic complexes and gigantic calderas (Bolsena, Vico, Bracciano and Artemisia), which erupted, with a climax at about 300 ka, a large volume of leucite phonolites and leucitites, rare melilitites plus carbonatites and their intrusive equivalents [8]. A vast range of Rare Earth minerals in the RR is mainly associated with a network of fluorcarbonatite and alkali syenites dikes and stocks, plus carbothermal deposits of fluorine-ore [9,10,11]. Alkali syenites represent the most frequent ejecta of igneous subvolcanic rocks with some fine-grained, mineralised peripheral zones with Th-, U-, Zr-, Nb-, V- and LREE-bearing phosphates and silicates. These are equigranular to inequigranular rock-types with colour index, which represents the volume percentage occupied by mafic minerals in the rock according to the IUGS recommendation, varying from 10 to 12. They are composed mainly of Ba-Sr-rich K-feldspars and scarce haüyne and nepheline, Mg-hastingsite, phlogopite and rare diopside and aegirine. Garnet, sphene, apatite, Ti-magnetite, fluorite and baryte are typical accessory phases. Microphases occurs as disseminated grains among K-feldspar phenocrysts or cavity-lining druses. Notably, common Zr-Th-U-Nb-V-REE-micro-phases are silicate (thorite, stillwellite-(Ce), vicanite, hellandite, perrierite-(Ce), gadolinite, allanite, zircon), phosphates (monazite, britholite, apatite, brockite), vanadates (wakefieldite), oxides (pyrochlore, baddeleyite) and carbonates (bastnasite). The paragenesis of this complex mineral association deserves a specific study aimed at understanding the specific sequence of genetic conditions, magma evolution and fluid and physical parameters required to form it. Generalised observations of the paragenetic evolution of alkali syenites are far from this paper’s aim and need a separate description and discussions.
3. Methods
BSE images were obtained using a Phenom XL SEM hosted at the Center for Advanced Studies and Technology “G. d’Annunzio” University of Chieti-Pescara. The phase map and associated BSE image were acquired using a TESCAN integrated Mineral Analyser SEM (TIMA) at the Natural History Museum, London (London, UK). Hellandite-group minerals were analysed by a JEOL 8200 Super-probe at Earth Science Department of Milan University (Milano, Italy). The accuracy of these analyses in analysing REE is ~1.3%, based on the detection limit. The detection limit is two magnitude order lower than the hellandite group members’ REE concentration. Trace element concentrations were acquired using an ESI 213 nm Laser Ablation system and Agilent 7700 ICP-MS system at the Natural History Museum, London. Raman measurements were carried out using a Thermo Scientific™ DXR™ Raman Microscope using a 532-nm laser as an excitation source at the Department of Chemical Sciences, University of Padova. The analyses were performed using a 50× working distance objective with ~2.5 cm−1 spectral resolution and 1.1 μm spatial resolution at 10 mW of power. Spectra were recorded in the range extending from 100 to 1100 cm−1. Raman spectra were collected using an exposure time of 15 s and 20 accumulations to maximise the signal-to-noise ratio. Spectra data reduction was performed using the Thermo Scientific™ OMNIC™ 9.2.0 Spectral Software at Padua University, Padua, Italy.
Single-crystal XRD data were collected using an XcaliburE four-circle diffractometer (Agilent Technologies, Santa Clara, CA, USA) equipped with an EoS CCD area detector. The diffractometer was operated with Mo Kα radiation at X-ray tube conditions of 50 kV and 40 mA. A whole sphere of data was collected to 30° Theta using omega scans, a scan width of 1°, and a counting time of 30 s per frame. Intensity data were corrected for Lorentz-polarisation effects and absorption (empirical multi-scan) using the CrysAlis software (Rigaku Oxford Diffraction, Tokio, Japan). The crystal structure was determined using SHELX within the WinGX software (University of Glasgow, Glasgow, UK). Powder XRD was carried out using the X-ray diffractometer Rigaku Miniflex II, located at the DiSPUTer (Chieti, Italy). The acquisition parameters that have been used in the Xrd_Di.S.Pu.Ter.-Uda laboratory at “G. d’Annunzio” University (Chieti, Italy) are Cu-Kα (1.540598 Å) radiation generated at 30 kV and 15 mA, in an exploratory interval between 3 and 70° 2θ, 0.1 steps, and a scan rate of 0.15°/s. Once the diffractogram was obtained, background subtraction and indexing of peaks with semi-quantitative analysis were performed. The mineral identification was performed using the software Match 3.
For the discrimination among the different hellandite endmembers, we used a method based on the Ca content at M2, M3 and M4 sites on the dominant metal at M1 site and the content of Be and Li at T site basing on the criteria of literature and on the analysis of different chemical compositions of hellandite-group mineral endmembers [2,3,4,6]. The Ca content at site M2, M3 and M4 allows to discriminate the two main groups: hellandite sensu strictu and tadzhikite, with a Ca content at site M3, M4 less than 4 apfu and with no Ca present at site M2. Mottanaite, ciprianiite and ferri-mottanaite are distinguished from hellandite sensu strictu and tadzhikite having Ca greater than 4 apfu at sites M3 and M4, and excess of Ca at site M2. Owing the dominant metal at site M1, we distinguished tadzhikite (Ti4+ > Al3+ and Ti4+ > Fe3+) and ferri-mottanaite (Fe3+ > Al3+ and Fe3+ > Ti4+). Ciprianiite is specified by the dominance of Th and U at site M2 compared to REEs. Finally, hellandite and mottanaite, which have dominant REEs at the M2 site, are specified by the Be and Li content at the T site. Hellandite has the T site with large vacancies, while mottanaite has an ideal Be and Li content of 1.5 apfu.
4. Results
4.1. Hellandite-Group Mineral Phases
We have analysed four crystals of hellandite-group minerals.
Crystal n. 1. Tre Croci, Vetralla (42°19′58″ N 12°05′11″ E). The crystal has a remarkable size (up to 7 mm) and is quite inhomogeneous at a microscale. The general structure of the crystal suggests corrosion and resorbing showing a cribrose and chessboard-like texture with vugs sometimes hosting secondary pyrochlore. A phase map of the crystal on the BSE and TIMA comparison shows microscale sub-domains with different compositions (Figure 1). Light grey domains, corresponding to the darker green in the TIMA image, are hellandite-(Ce), which make up the bulk of the crystal. Dark grey domains, corresponding to the lighter green in the TIMA image, are mottanaite-(Ce). This texture suggests an intergrowth/implication structure between two co-precipitating phases that can be interpreted in terms of diffusion-reaction processes or dissolution-repackaging. Mottanaite-(Ce) grows parallel to hellandite cleavage, according to {001} and {100}.
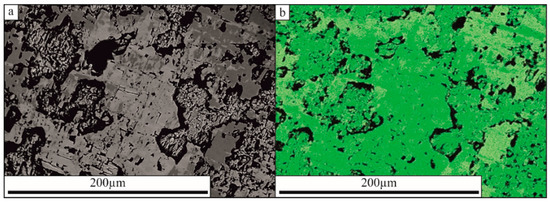
Figure 1.
(a) BSE image and (b) TIMA phase map of hellandite-(Ce)-mottanaite (Ce) domains of crystal 1. Light grey domains in the BSE image, corresponding to the darker green in the TIMA phase map, are hellandite-(Ce). Dark grey domains in the BSE image, corresponding to the lighter green in the TIMA phase map, are mottanaite-(Ce).
Hellandite-(Ce) has an average stochiometric formula: M3,4 Ca3.97, M2 (La0.28, Ce0.48, Y0.09, Pr0.03, Nd0.08, Sm0.01, Gd0.01, Th0.39, U0.09, □0.61)2 Z (Ti0.16, Fe0.37, Al0.33, Mn0.08, Mg0.05)0.98 (Be0.73, Li0.03, □1.24)2 [Si3.79, B4.32, O22] (OH1.7, F0.13, O2−0.17)2. Mottanaite-(Ce) has an average stochiometric formula: M3,4 Ca4.00, M2 (Ca0.19, La0.49, Ce0.64, Y0.05, Pr0.04, Nd0.08, Sm0.01, Gd0.01, Th0.24, U0.07, □0.18)2 Z (Ti0.24, Fe0.39, Al0.30, Mn0.09, Mg0.07)1.10□2 [Si4.09, B3.91, O22] (F0.41, □1.59)2. Average chemical compositions of hellandite-(Ce) and mottanaite-(Ce) are reported in Table 1.

Table 1.
Chemical composition of crystal 1 of hellandite-(Ce) (avg. of 6 EMPA-LA-ICP-MS analyses) and mottanaite-(Ce) (avg. of 3 EMPA analyses) from RR.
Chemical analysis was validated by single-crystal structure refinement of crystal 1. Diffraction data of a fragment from crystal 1 (0.03 0.08 0.14 mm) were collected in ϑ range (°) 2.1–31.7. It is monoclinic with a space group P2/a; with a = 18.948(6) Å, b = 4.75495(8) Å, c = 10.2060(3) Å, β = 110.828(3) Å, V = 859.44(4) Å3 (Figure 2). The a:b:c ratio calculated from unit cell parameters is 3.985:1:2.146. The crystal structure is similar to hellandite described by [4] but the unit cell parameter c is slightly smaller than that of the previous study. More remarkable, but comparable to other studies, is the mean bond length <M2-O> (M2 = Ca, Y, REE, Th, U), demonstrating that incorporation of a bit more Th and U has not much effect on the size of the M2 polyhedron (Table 2 and Table 3; Figure 3a,b).
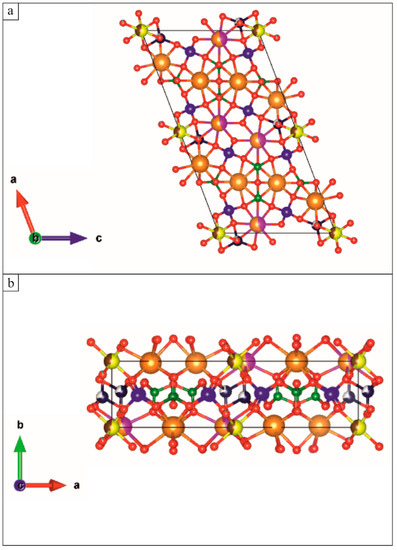
Figure 2.
VESTA illustration [12] of the crystal structure of Hellandite-(Ce). (a) View along the b axis; (b) View along the c axis. Colours indicate atoms: green for B, blue for Si, yellow for Al, brown for Fe, pink for Th, orange for Ca, blue navy for Be, red for O and light blue for F.
Table 2.
(a) Data from single-crystal structure refinement for hellandite-(Ce); (b) selected mean bond lengths (Å) for hellandite-(Ce). The numbers in brackets correspond to the uncertainties.
Table 3.
Atom fractional coordinates (x/a, y/b, z/c) and displacement parameters U (Å2) for hellandite-(Ce) (ss is refined site scattering). The numbers in brackets correspond to the uncertainties.
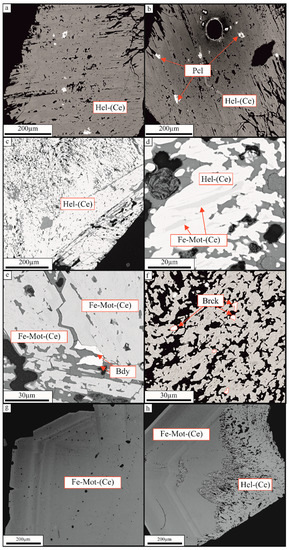
Figure 3.
BSE images of hellandite-(Ce) (Hel-(Ce)) and ferri-mottanaite-(Ce) (Fe-mot-(Ce)). (a) Crystal n.1 of hellandite-(Ce); (b) Crystal n.1 of hellandite-(Ce) with pyrochlore (Pcl) group members inclusion; (c) Cribrose core of crystal n.2 of hellandite-(Ce); (d) Hellandite-(Ce)-ferri-mottanaite-(Ce) exsolution in crystal n.2. The light bands represent hellandite-(Ce), the darker ferri-mottanaite-(Ce); (e) Ferri-mottanaite-(Ce) in close association with baddeleyite (Bdy) in crystal 2; (f) Brockite (Brck) disseminated in hellandite-(Ce)-ferri-mottanaite-(Ce) exsolution; (g) Crystal n.3 of ferri-mottanaite-(Ce); (h) Crystal n. 4 showing the cribrose core of hellandite-(Ce) and rim of ferri-mottanaite-(Ce).
Crystal 2. Campagnano, Monte Cavalluccio (42°08′N 12°23′E). Hellandite-(Ce) shows darker ferri-mottanaite-(Ce) vermiculation and a cribrose structure with the vugs spotted by brockite (Figure 3c–f). Vermiculations are similar to structures suggestive of immiscibility, such as perthite. Substitution of REE for Ca should increase the average atomic number of hellandite-(Ce), and the coinciding substitution of Ca would probably bring down the average atomic number to produce the darker BSE colour in ferri-mottanaite. Due to the small size of unmixed vermiculations, it was impossible to analyse them for Be and Li. EMPA and LA-ICP-MS confirm hellandite-(Ce) and ferri-mottanaite-(Ce), this last one having Ca > 4 in (M3-M4 sites) and Fe dominant in M1 site. The EMPA analyses show that hellandite-(Ce) has a formula M3,4 Ca3.99, M2 (La0.21, Ce0.71, Y0.01, Pr0.09, Nd0.27, Sm0.03, Th0.41, U0.03, □0.15)2 Z (Ti0.11, Fe0.36, Al0.61)1.7 (□2) [Si4.17, B3.83, O22] (OH, F, O2−)2 and ferri-mottanaite-(Ce) has a formula M3,4 Ca4, M2 (Ca0.3, La0.19, Ce0.61, Pr0.09, Nd0.19, Sm0.02, Th0.32, U0.03, □0.26)2 Z (Ti0.13, Fe0.49, Al0.46)1.07 (□2) [Si4.19, B3.81, O22] (OH, F, O2−)2. Average chemical compositions of hellandite-(Ce) and ferri-mottanaite-(Ce) are reported in Table 4.
Table 4.
Chemical composition of crystal 2 rim and core of hellandite-(Ce) (average of 3 EMPA analyses) and ferri-mottanaite-(Ce) from RR.
Crystal 3–4. Campagnano, Monte Cavalluccio (42°08′ N 12°23′ E). These crystals show an irregularly shaped cribrose core of hellandite-(Ce) and a euhedral zoned rim of ferri-mottanaite-(Ce) (Figure 3h). The average ferri-mottanaite-(Ce) composition of crystal 4 (avg. 5) is M3,4 Ca4, M2 (Ca0.59, La0.16, Ce0.49, Pr0.05, Nd0.14, Sm0.01, Y0.01, Th0.24, U0.03, □0.27)2 Z (Ti0.12, Fe0.50, Al0.38, Mn0.11, Mg0.03)1.07 (Be, Li0.03, □)2 [Si4.13, B3.87, O22] (OH, F0.65, O2−)2. The average chemical composition of crystal 3 of ferri-mottanaite-(Ce) is reported in Table 5.
Table 5.
Chemical composition of crystal 4 of ferri-mottanaite-(Ce) (average of 5 EMPA analyses) from RR. (B2O3 recalculated).
Zoning in crystal 3 has been analysed using BSE images. The variation in colour from the lighter zones to the darker zones corresponds to Ca, Ce and Th (Figure 4).
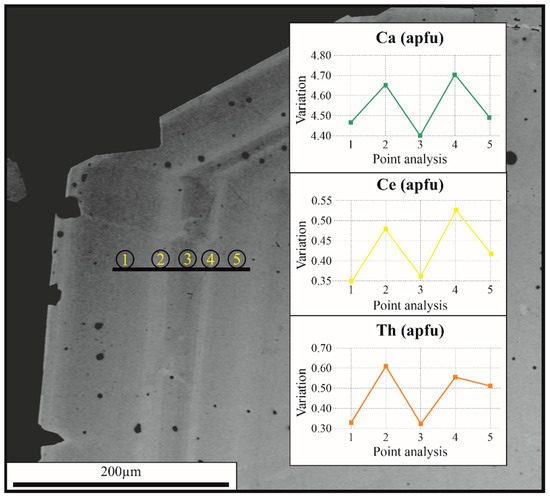
Figure 4.
Back scattered (BSE)images of ferri-mottanaite-(Ce) rim zonation in crystal 3. The lighter bands correspond to enrichment in Ca, Ce and Th.
Micro-Raman spectra were measured on crystals 3 and 4 in the range of 100 to 1100 cm−1. The two spectra are shown in Figure 5. The five most prominent peaks (from the strongest to the weakest) are at ~880, 515, 336, 950 and 170 cm−1. Several additional minor Raman peaks occur in the spectra. The measured Raman spectra are comparable to that of an hellandite-(Ce) from Campo Pefella (erratum for Padella), near Capranica, Viterbo, reported by RRUFF Raman database (ID R061013, [13]). After an extensive literature search, we did not find any published Raman spectra of minerals belonging to the hellandite group, and therefore our Raman spectra should represent the first published spectra for ferri-mottanaite-(Ce).
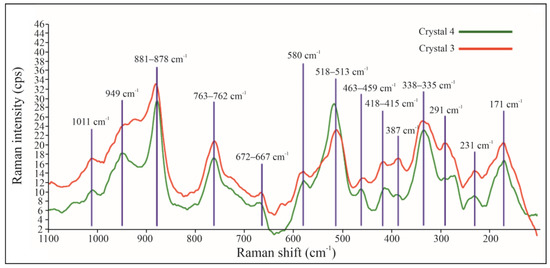
Figure 5.
Raman spectra of crystal 3 and crystal 4 of ferri-mottanaite-(Ce).
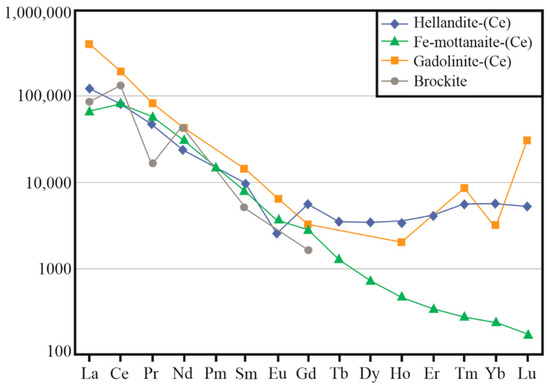
Chondrite-normalised REE patterns for hellandite-(Ce), ferri-mottanaite-(Ce), gadolinite-(Ce) and brockite are shown in Figure 6. Chondrite-normalised REE patterns for hellandite-(Ce) and ferri-mottanaite-(Ce) show a marked crossover at the Eu-Gd level. Profiles of hellandite-(Ce) show an HREE and Y-enrichment relative to adjacent ferri-mottanaite-(Ce). Brockite shows an enrichment in LREE compared to the associated hellandite-(Ce) and ferri-mottanaite-(Ce). The REE pattern of gadolinite, compared with hellandite-(Ce) and ferri-mottanaite-(Ce), shows a high content of HREE like that of hellandite-(Ce).
4.2. Other Associated Mineral Phases
Four mineral phases seem texturally related to the described hellandite occurrence: brockite, britholite, gadolinite and pyrochlore (Table 6, Table 7, Table 8 and Table 9). Brockite and pyrochlore were found as inclusion in hellandite (in crystal 2 and in crystal 1 respectively), while britholite and gadolinite are hitherto characteristically associated with the hellandite paragenesis in syenite ejecta. We found gadolinite in association with crystal 1 and britholite in association with crystal 2. Gadolinite-like minerals have been found by [14] in association with hellandite-(Ce) from Vico Vulcano, confirming our finding.
Table 6.
Chemical composition by EMPA analysis of selected crystal of brockite included in crystal 2.
Table 7.
Chemical composition by EMPA analysis of selected crystal of fluorbritholite-(Ce) in association with crystal 2.
Table 8.
Chemical composition by EMPA analysis of selected crystal of gadolinite-(Ce) in association with crystal 1.
Table 9.
Chemical composition by EMPA analysis of selected crystal of pyrochlore included in crystal 1.
5. Discussion
The nomenclature of the hellandite group is essentially based on the dominance of a specific cation in one of the sites of the complex but flexible structure of the mineral [4]. We observed two different main types of hellandite-group phases according to conventional chemical classification, as follows. Type-a crystal: discrete crystal of hellandite-(Ce) intergrowth with mottanaite-(Ce) (Figure 1); Type-b crystal: composite crystal with a core of hellandite-(Ce) exsolving vermiculations of ferri-mottanaite-(Ce) and having a euhedral shell of oscillatory zoned ferri-mottanaite-(Ce) (Figure 3d,g,h).
Hellandite mineral textures in the rocks testify for a sharp passage from hellandite-(Ce) to ferri-mottanaite-(Ce). However, hellandite shows, before the transition, specific textures, which may be linked to sub-solidus exsolution immiscibility and intergrowth, including mottanaite-(Ce) and ferri-mottanaite-(Ce).
Type-a crystal displays chessboard-like discrete domains of hellandite-(Ce) and mottanaite-(Ce) plus crystal corrosion. These features suggest dissolution-repackaging in sub-solidus condition and disequilibrium with the initial crystallising liquid.
Type-b crystal displays a core having a perthite-like structure of ferri-mottanaite-(Ce) in hellandite-(Ce). This kind of structure is likely due to intracrystalline diffusion, which, owing to a temperature drop, creates compositional segregations in crystalline solids by exsolution. In theory, this suggests the presence of an immiscibility gap between hellandite-(Ce) and ferri-mottanaite-(Ce) at a lower temperature. It follows liquid/crystal disequilibrium with core corrosion. Instead, the next crystallisation step shows compositional equilibrium with the crystallising liquid, which is testified by the overgrowth of a euhedral shell of ferri-mottanaite-(Ce). This phase responds to compositional variation of the liquid (Ca, Ce, Th) with oscillatory zoning, according to crystallisation of other phases but preserves the ferri-mottanaite-(Ce) distinctive composition (Figure 4). This corroborates the hypothesis of an immiscible gap between hellandite-(Ce), mottanaite and ferri-mottanaite. These observation leads us to pose the challenge of calculating the molar solution among the different hellandite chemical species.
There is no experimental evidence for a sizeable solid solution among various hellandite-group endmembers at magmatic temperatures, but we consider it a viable hypothesis based on crystal and structural chemistry relationships. In the literature, there is no information about the presence of immiscibility gaps among hellandite endmembers. The boundaries between one species and another are still somewhat uncertain, owing to the various molar fractions that can form a continuum in the chemical space (Figure 7 and Figure 8). In addition, the determination of the molar species content is highly puzzling. To resolve this issue, we attempted an empirical approach based on several assumptions used to discriminate the different chemical species of the hellandite group.
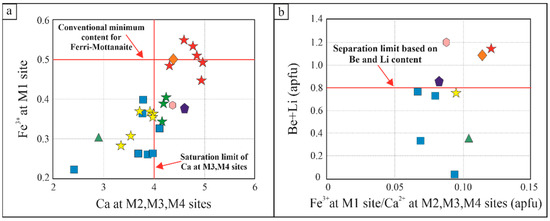
Figure 7.
Chemical characteristics of hellandite-group minerals. (a) Fe3+ content at M1 site (apfu) associated with Ca content at M2, M3 and M4 sites (apfu) with the conventional minimum content for ferri-mottanaite and the saturation limit of Ca at M3, M4 sites; (b) Be + Li content (apfu) associated with Fe3+ at M1 site/Ca2+ at M2, M3 and M4 sites (apfu), with the separation limits based on Be and Li content. Key symbols: red stars are ferri-mottanaite from this study; orange diamonds are ferri-mottanaite from literature; yellow stars are hellandite ss from this paper; blue squares are hellandite sensu strictu from literature; green stars are mottanaite from this study; green triangles are tadzhikite from literature; violet pentagons are ciprianiite from literature; and pink hexagons are mottanaite from literature.
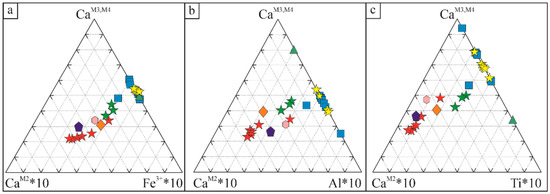
Figure 8.
Ternary diagram plotting the content of Ca at M3 and M4 sites, Ca at M2 site and the dominant metal at M1 site. (a) Ca at M3 and M4 sites, Ca at M2 site and Fe3+ as dominant cation at M1 site; (b) Ca at M3 and M4 sites, Ca at M2 site and Al as dominant cation at M1 site; (c) Ca at M3 and M4 sites, Ca at M2 site and Ti4+ as dominant cation at M1 site. Key symbols are the same as in Figure 7.
Our immiscibility hypothesis must be tested by investigating the endmembers distribution in each specimen. The first step is to verify if the molar abundances reflect the actual chemical distribution using the ideal stoichiometric formulas. Without this calculation, it is impossible to reach any coherent thesis between observed and expected chemical features. The calculation procedure is described in the electronic excel sheet in the appendix and explained in the next paragraph.
5.1. Mineral Chemistry
There is a general agreement in the literature that the endmember classification of hellandite group is based on the occupancy of Ca at M2, M3 and M4 sites, the dominant metal at the M1 site (Fe3+, Al3+ and Ti4+) and T site (Be and Li). In Figure 7, conventional separation limits are highlighted by red lines. M2 site Ca saturation marked by Ca in M3–M4 sites accompanied by Fe3+ increase in M1 site, produces a progressive trend where hellandite sensu strictu and tadzhikite have Fe3+ < 0.5 apfu and CaM2,M3,M4 ≤ 4 apfu. In contrast, mottanaite and ciprianiite have CaM2,M3,M4 > 4 apfu and Fe3+ <0.5 apfu and, finally, ferri-mottanaite has Fe3+ > 0.5 apfu and Ca M2,M3,M4 > 4 apfu.
Data plotting suggests that these limits are not an insurmountable barrier and that a particular uncertainty is associated with the recalculation of the various chemical species in a.p.f.u. In fact, in Figure 7a, the hellandite ss sample from [2] does not plot neatly on the left of the Ca saturation limit. In addition, three samples of ferri-mottanaite from this study plot on beneath the conventional minimum content of Fe3+ for ferri-mottanaite (Figure 7a) despite the samples having all the other chemical features to be a ferri-mottanaite (i.e., high Be). Another discriminant factor is provided by the T site’s occupancy (Be + Li) (Figure 7b).
This paper and literature data about hellandite-group minerals suggest that a limit of Be + Li 0.8 apfu marks the divide between hellandite ss and tadzhikite vs. ciprianiite, mottanaite and ferri-mottanaite. Tadzhikite is then distinguished from hellandite ss by the content of Ti4+, representing the dominant element in the M1 site. Although, the schemes work in a general sense they require further reflection and detailed understanding.
Ternary diagrams in Figure 8 confirm the ability of the M1 and M2 sites to define different hellandite endmembers in the frame of a generalised chemical variation trend. Ca in M2 coupled with Fe3+, Ti4+ and Al3+ in M1 defines the mottanaite, ferri-mottanaite and ciprianiite trend in contrast with hellandite ss and tadzhikite. From this point of view, we have just two completely separated hellandite subgroups. Over time, the number of hellandite chemical species has grown based on this criterion, generating a nomenclature that could be overabundant.
We calculated the molar solution calculation, estimating the proportion of Ti and Fe/Fe + Al + Ti at the M1 site, respectively. The proportion of Ce + Y, Th + U, REE/REE + Th + U at M2 site, respectively. The values obtained are proportioned to Al/3 and proportional assigned to Fe + Al + Ti. These values are normalised to 1. Be + Li is used to calculate ferri-mottanaite, mottanaite and ciprianiite, assuming an ideal content of Be + Li of 1.5, 1.5 and 0.5, respectively. The T-site vacancies are proportioned after dividing by 2 to hellandite and tadhzikite. This complex calculation was empirically confirmed by a correspondence of the dominant molar fraction in the solid hellandite-group molar solution with the chemical classification. A limit of this calculation, which is the best we have imagined, is underestimating ciprianiite. Owing to the theoretical lower content of Be + Li in ciprianiite for mottanaite and ferri-mottanaite samples, which may be chemically classified as ciprianiite, these show a low molar fraction of ciprianiite. Results of this calculation are shown in Table 10.
Table 10.
Hellandite-group endmembers recalculation results, following the scheme described in the text.
Molar fractions are helpful to investigate the presence of immiscibility gaps, which are relevant to explain the observed textural features of immiscibility among hellandite, mottanaite and ferri-mottanaite. In Figure 1, we note that hellandite and mottanaite form discrete adjacent domains, which indicate probably a sub-solidus substitution, and, in Figure 3d, vermicular exsolution of ferri-mottanaite in hellandite-(Ce). This seems confirmed in Figure 9, which shows a large, molar solid solution gap among hel sensu strictu/Σothers and Σothers/hel sensu strictu ratios ranging from 58 to 100 and from 42 to 0, respectively. Our discussions about the different molar fractions are strongly related to the observed textural data. For this reason, they are not extended to literature data for which we do not know the textural occurrence. In our case, we observe that the first crystallising hellandite contains up to 73% of other endmembers, up to 24% of mottanaite and up to 23% of ferri-mottanaite, still classifying as hellandite ss. Mottanaite contains up to 34–36% of ferri-mottanaite and up to 9% of hellandite. Ferri-mottanaite contains 37% of mottanaite and 11–12% of hellandite. Complete molar proportions are shown in Figure 10.
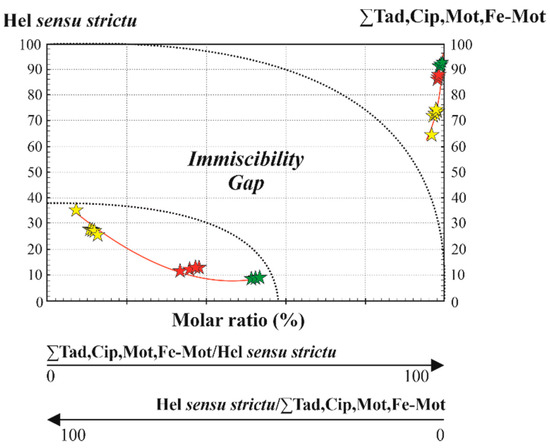
Figure 9.
Molar solution of hellandite ss vs. the sum of the other hellandite-group endmembers. Key symbols are the same as in Figure 7.

Figure 10.
Molar solution of hellandite ss vs. the other hellandite-group endmembers. (a) Hellandite ss–thadzhikite molar solution; (b) Hellandite ss–mottanaite molar solution; (c) Hellandite ss–ferri-mottanaite molar solution; (d) Hellandite ss–cipriianite molar solution. Key symbols are the same as in Figure 7.
5.2. Crystal Chemical Structure
B4Si4 dominates the hellandite structure, which is not easily influenced by the occupancy of the other sites. This study confirms that for hellandite sensu strictu, the cell parameters a, b, c and V positively correlate with the increase of CaO wt% [2,4]. Ciprianiite, mottanaite and ferri-mottanaite do not show a clear trend and show cell parameters variation despite a similar CaO wt% content (Figure 11).
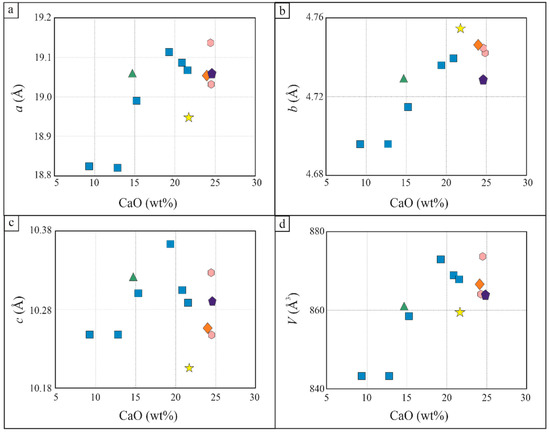
Figure 11.
Structural parameters variation with CaO wt% content, following [2]. Key symbols are the same as in Figure 7. (a) Cell parameter a (Å) vs CaO content (wt%); (b) Cell parameter b (Å) vs CaO content (wt%); (c) Cell parameter c (Å) vs CaO content (wt%); (d) Volume (V) (Å3) vs CaO content (wt%). Key symbols are the same as in Figure 7.
The authors of [4] observed that plotting the mean bond length <T-O> (Å) vs. site scattering (ss) at the T site have a strong correlation predictive of Be + Li abundance in the T site. Figure 12a shows that our hellandite-(Ce) has a very high ss at the T site (epfu). We refined a <T-O> of 1.74 Å compared to 1.633 Å, which is the mean bond distance of <Be-O> [15], suggesting that a larger cation, such as Li, occupies the T site as well. The radius of Li+ is larger than Be2+ (r Li = 0.59 Å, r Be = 0.27 Å in tetrahedral coordination, [16]). Assuming Be and Li on T, we may then conclude that the crystal has a higher Be/Li ratio than crystals from other studies. However, these T site considerations are subtle because Be and Li are weak scatterers. Cautious discussion is needed, and there is still a discrepancy between ss at the T site of XRD and chemical analysis. Furthermore, this conclusion is not satisfactory as the higher Be/Li ratio is not confirmed by comparing our data with those of the literature. In fact, to satisfy the correlation between T site features and Be content, more than double of Be would be necessary to explain very high ss at the T site (epfu) (Figure 12a–c). This is unrealistic as the uncertainties of the chemical analysis of Be (based on five analyses) are small and do not indicate higher Be concentration. We conclude that there is another possible explanation for this structural peculiarity of crystal 1.
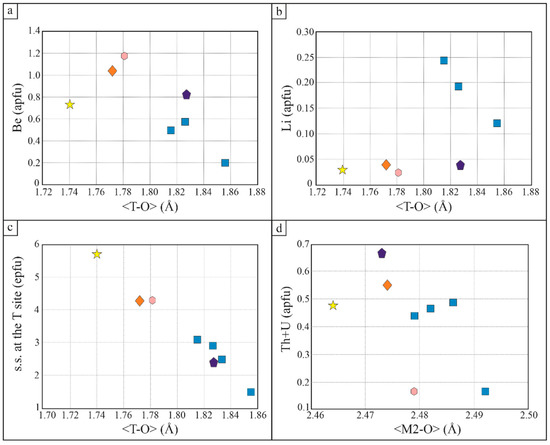
Figure 12.
(a) Be content (apfu) vs. the mean bond length <T-O> (Å); (b) Li content (apfu) vs. Table 2. site (apfu) vs. the mean bond length <M2-O> (Å); (c) s.s. at the T site (epfu) vs. the mean bond length <T-O> (Å); (d) Th + U content (apfu) vs. the mean bond length <M2-O> (Å).
According to Figure 12d, there is a slight inverse correlation between the Th-U content and the mean bond length <M2-O> (Å). Hellandite-(Ce) has a Th + U content similar to the other hellandites [4] but a bit shorter bond <M2-O> (Å). However, ciprianiite and ferri-mottanaite, despite having a higher content of Th + U compared to hellandites, have a slightly shorter <M2-O> (Å). We deduce that the Th + U content does not affect the <M2-O> (Å) site parameters very much.
5.3. Genetic Conditions
Crystal texture and crystallisation hierarchy indicate a complex evolution and crystal composition variation during the late stage of syenite crystallisation and a possible contribution of REE-rich carbothermal/hydrothermal fluids. There is a strict link between late stage carbonatitic fluids and secondary mineralisation in syenites [11]. At sub-magmatic temperatures, the progressively oxidising conditions and the increasing activity of P2O42− and SiO42− ligands favour the precipitation of brockite with hellandite ss (crystal n.2 in Figure 3c–f).
A hypothesis given in the literature [17,18] considers that hellandite crystal as a substitution product of britholite. This type of substitution is possible by introducing B in the system at a late magmatic stage. Alkali syenites contain several minerals that could be precursors of hellandite, and other B- and Be-bearing minerals (e.g., vicanite, gadolinite) such as silicates (thorite, stillwellite, perrierite, allanite) and phosphates (monazite, britholite, brockite). Boro-silicates genesis was likely controlled by introducing exogenous boron in the original mineral composition leading to the replacement associations. We suggest that britholite is not suitable to explain some of the feature of hellandite-(Ce) crystal 1. From a chemical point of view, we observe a peculiar behaviour of REE. Figure 6 displays an intense concentration of HREE in hellandite-(Ce). In our opinion, the best candidate to explain the structural and chemical features of hellandite is gadolinite. It is monoclinic, has high HREE and a large ss at T site. This explains the extreme value of ss at T site and HREE content compared to the hellandites in literature. It is possible to write a simple equation to pass from gadolinite-(Ce) to hellandite-(Ce):
(Ce,REE,Th,U)2 Fe2+ (Be,Li)2 Si2O10 + 4CaO + 2B2O3 + 2SiO2 = Ca4(REE,Th,U)2 (Al,Fe3+,Ti) (Be, Li, □)2Si4B4O22 + 4O2.
Brockite may derive from britholite (Figure 13) through the equation:
(Ca, Th, LREE)(Si,P)O4(OH)3F +2H2O = (Ca, Th, LREE)PO4 × H2O + SiO2 + 3HF
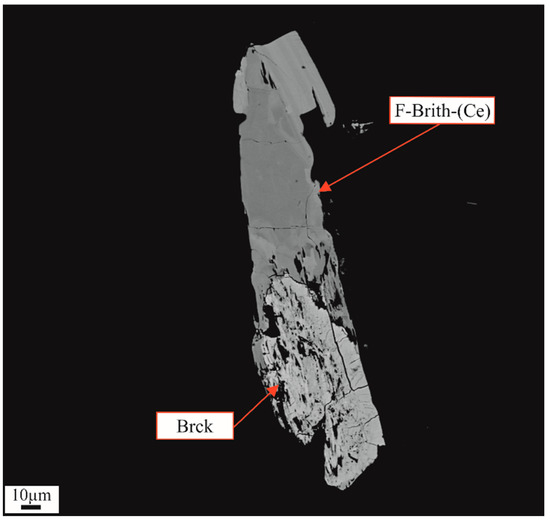
Figure 13.
Brockite (Brck) in close association with F-britholite-(Ce) (F-Brith-(Ce)).
Our observations suggest that hellandite-(Ce) and brockite may become unstable at lower temperature and higher fO2, which explains the resorption of hellandite-(Ce) and dissolution of brockite.
REE patterns comparison among minerals may be complex due to crystallisation conditions and co-precipitating phases with propensity to select specific REE. Average REE content does not change notably in ferri-mottanaite-(Ce) compared to hellandite-(Ce), but LREE/HREE ratio increases dramatically. Brockite is a potent scavenger of LREE. Average LREE ratios among brockite, hellandite and ferri-mottanaite are Labrck/Lahel = 0.48 (σ = 0.10); Labrck/Lafemot = 0.96 (σ = 0.21); Cebrck/Cehel = 0.42 (σ = 0.13); Cebrck/Cefemot = 0.46 (σ = 0.14); Prbrck/Prhel = 0.50 (σ = 0.21); Prbrck/Prfemot = 0.40 (σ = 0.17); Ndbrck/Ndhel = 0.60 (σ = 0.20); Ndbrck/Ndfemot = 0.41 (σ = 0.14); Smbrck/Smhel = 0.48 (σ = 0.06); Smbrck/Smfemot = 0.53 (σ = 0.07). Especially Ce anomaly is related to oxidation condition, whereas Pr anomaly could be due to a third crystallising phase which preferentially incorporates Pr (i.e., zircon). The breakdown of brockite could provide a source of LREE to produce an LREE-enriched ferri-mottanaite (LREE/HREE = 76). In general, the high LREE/HREE supports a link to LREE-rich fluorocalciocarbonatite (LREE/HREE = 156), although significant fractionation of the REEs is required [11].
We suggest that this allows the formation of our calculated structure between neo-formed hellandite and mottanaite domains due to REE redistribution and Eu and Fe oxidation to 3+ in sub-solidus condition. Progressive oxidation processes explain the transition from gadolinite to hellandite (e.g., Fe2+ to Fe3+) and from hellandite-(Ce) to mottanaite/ferri-mottanaite (e.g., Eu2+ to Eu3+). Due to the decrease of HREE passing from hellandite-(Ce) to ferri-mottanaite-(Ce), we assume that the solubility of HREEs in crystallising fluids decreases with decreasing temperature. At oxidising condition, ferri-mottanaite-(Ce) becomes more and more stable, as apparent by the growth of a thick euhedral shell around hellandite-(Ce) core in crystal 3 (Figure 3g). Furthermore, we suggest that the concentration of LREEs in a residual fluid may be the result of fractional crystallisation and selective removal of HREEs in hellandite-(Ce) (and garnet) within a carbothermal/hydrothermal system [11,19].
Transition to lower temperature and water entering the hydrothermal system influences the oxidation state of Ce4+, where it preferentially enters pyrochlore and titanates. Mixed Nb-hydroxyfluoride complexes may permit Nb transport in more typical hydrothermal fluids [20,21]. Pyrochlore and baddeleyite crystallise as late-stage mineral [15] in hellandite vugs, and their precipitation may explain the variation of the elements in ferri-mottanaite zoning. However, we do not exclude the presence of other titanates and REE phases as a crystallising liquid composition modifier.
A robust link between REE-Nb-enriched alkali syenites with carbonatites has been established in many recent publications indicating that metasomatic fluids migrating away from carbonatites can produce mineralisation in associated syenites e.g., [11,22].
6. Conclusions
- On four composite crystals of hellandite-group minerals, we observed a chemical transition from hellandite sensu strictu to mottanaite to ferri-mottanaite.
- Hellandite-(Ce) shows immiscibility features both with mottanaite (chessboard like domains) and ferri-mottanaite (perthite-like vermiculation). Data analysis and molar endmember calculations testify complex behaviour to form a molar mixture with an immiscibility gap.
- According to point 2, in our composite crystals, the presence of different compositional domains and immiscible features may be due to disequilibrium upon sub-solidus conditions and quench, respectively. These textures can be interpreted in terms of growth stories and diffusion-reaction processes or dissolution-repackaging.
- Crystal n.1 of hellandite sensu strictu shows a peculiar high ss at the T site (epfu) and the shortest <T-O> bond concerning literature data. Be-Li content is not sufficient to explain this structural feature. We guess that T-site distortion is inherited by a hellandite precursor mineral such as gadolinite-(Ce). This would be confirmed by high HREE content (Figure 6).
- Crystallisation sequence and changes in composition, especially concerning LREE/HREE ratio and Eu anomaly, suggest that the observed variations are linked to drop in temperature and increase in the availability of oxygen during the late hydrothermal stage.
- Ferri-mottanaite concentric zoning is due to variation in Ca, Th, Ce content, probably related to late-stage crystallisation of other REE-silicates such as pyrochlore and other titanates.
- We suggest that the hellandite + brockite assemblage precipitated from highly fractionated, F-rich carbothermal fluids temporally related to carbonatite emplacement. Low-temperature hydrothermal conditions are supported by the presence of fine-grained fluorite and zeolites and hydration of REE-phosphate and vanadate minerals [11]. Fluid interaction with syenite may initiate fluorite crystallisation, which may cause destabilisation of (HREE, Ti, Nb)-complexes and precipitation of LREE + Th-silicate and phosphates and, finally, pyrochlore, a model valuable to the exploration for economic concentrations of REEs, Ti and Nb.
Author Contributions
Conceptualisation, F.S.; methodology, M.G.P. and F.S.; validation, M.G.P., D.Z., G.R., F.S.S., E.C., J.S., E.H.-W., J.N., W.B., F.N. and F.S.; formal analysis M.G.P., D.Z., J.S., E.H.-W., J.N., W.B., F.N. and F.S.; investigation, M.G.P., D.Z., J.S., E.H.-W., J.N., W.B., F.N. and F.S.; resources, F.S.S. and E.C.; data curation, M.G.P.; writing—original draft preparation, M.G.P., G.R. and F.S.; writing—review and editing, M.G.P., D.Z., G.R., F.S.S., E.C., J.S., E.H.-W., J.N., W.B., F.N. and F.S.; visualisation, M.G.P. and F.S.; supervision, F.S.; project administration, F.S.; funding acquisition, F.S. All authors have read and agreed to the published version of the manuscript.
Funding
The HiTech AlkCarb European Union Horizon 2020 project grant-agreement number 689909 supported this research.
Data Availability Statement
Not appliable.
Acknowledgments
We thank Marcello Mellini for suggestions during the paper preparation and are deeply grateful for the constructive criticism of two anonymous referees whose comments helped improve the paper. SEM EDS analysis were performed at SEM EDAX Facility of CAST.
Conflicts of Interest
The authors declare no conflict of interest.
References
- Mellini, M.; Merlino, S. Hellandite; A new type of silicoborate chain. Am. Mineral. 1997, 62, 89–99. [Google Scholar]
- Oberti, R.; Ottolini, L.; Camara, F.; Della Ventura, G. Crystal structure of non-metamict Th-rich hellandite-(Ce) from Latium (Italy) and crystal chemistry of the hellandite-group minerals. Am. Mineral. 1999, 84, 913–921. [Google Scholar] [CrossRef]
- Della Ventura, G.; Bonazzi, P.; Oberti, R.; Ottolini, L. Ciprianiite and mottanaite-(Ce), two new minerals of the hellandite group from Latium (Italy). Am. Mineral. 2002, 87, 739–744. [Google Scholar] [CrossRef]
- Oberti, R.; Della Ventura, G.; Ottolini, L.; Hawthorne, F.C.; Bonazzi, P. Re-definition, nomenclature and crystal-chemistry of the hellandite group. Am. Mineral. 2002, 87, 745–752. [Google Scholar] [CrossRef]
- Miyawaki, R.; Momma, K.; Yokoyama, K.; Shigeoka, M.; Matsubara, S.; Ito, M.; Nakai, I.; Kristiansen, R. Mn-bearing Hellandite-(Y) from the Heftetjern pegmatite, Tørdal, Norway. Can. Mineral. 2015, 53, 345–346. [Google Scholar] [CrossRef]
- Oberti, R.; Langone, A.; Boiocchi, M.; Bernabè, E.; Hawthorne, F.C. News from the hellandite group: The redefinition of mottanaite and ciprianiite and the new mineral description of ferri-mottanaite-(Ce), the first Fe3+-dominant hellandite. Eur. J. Mineral. 2019, 31, 799–806. [Google Scholar] [CrossRef]
- Washington, H.S. The Roman Comagmatic Region; Carnegie Institution for Science: Washington, DC, USA, 1906; Volume 57, p. 199. [Google Scholar]
- Stoppa, F.; Cundari, A.; Rosatelli, G.; Woolley, A.R. Leucite melilitolites in Italy: Genetic aspects and relationships with associated alkaline rocks and carbonatites. Per. Mineral. 2003, 72, 223–251. [Google Scholar]
- Goodenough, K.M.; Schilling, J.; Jonsson, E.; Kalvig, P.; Charles, N.; Tuduri, J.; Deady, E.A.; Sadeghi, M.; Schiellerup, V.; Muller, A.; et al. Europe’s rare earth element resource potential: An overview of REE metallogenetic provinces and theirgeodynamic setting. Ore Geol. Rev. 2016, 72, 838–856. [Google Scholar] [CrossRef]
- Stoppa, F.; Pirajno, F.; Schiazza, M.; Vladykin, N.V. State of the art: Italian carbonatites and their potential for critical-metal deposits. Gondwana Res. 2016, 37, 152–171. [Google Scholar] [CrossRef]
- Stoppa, F.; Schiazza, M.; Rosatelli, G.; Castorina, F.; Sharygin, V.V.; Ambrosio, F.A.; Vicentini, N. Italian carbonatite system: From mantle to ore-deposit. Ore Geol. Rev. 2019, 114, 103041. [Google Scholar] [CrossRef]
- Momma, K.; Izumi, F. VESTA 3 for three-dimensional visualization of crystal, volumetric and morphology data. J. Appl. Crystallogr. 2011, 44, 1272–1276. [Google Scholar] [CrossRef]
- Lafuente, B.; Downs, R.T.; Yang, H.; Stone, N. The power of databases: The RRUFF project. In Highlights in Mineralogical Crystallography; Ambruster, T., Danisi, R.M., Eds.; W. De Gruyter: Berlin, Germany, 2015; pp. 1–30. [Google Scholar] [CrossRef]
- Rossi, P.; Bellatreccia, F.; Caprilli, E.; Parodi, G.C.; della Ventura, G.; Mottana, A. A new occurrence of rare minerals in an ejectum in the pyroclastics of Vico Volcano, Roman Comagmatic Region, Italy. Rend. Lincei 1995, 9, 147–156. [Google Scholar] [CrossRef]
- Hawthorne, F.C.; Huminicki, D.M.C. The crystal chemistry of beryllium. In Beryllium: Mineralogy, Petrology and Geochemistry; Reviews in Mineralogy and Geochemistry; Grew, E.S., Ed.; Mineralogical Society of America: Chantilly, VA, USA, 2002; Volume 50, pp. 333–403. [Google Scholar]
- Shannon, R.D. Revised effective ionic radii and systematic studies of interatomic distances in halides and chalcogenides. Acta Cryst. 1976, A32, 751–767. [Google Scholar] [CrossRef]
- Hogarth, D.D.; Chao, G.Y.; Harris, D.C. New data on hellandite. Can. Mineral. 1972, 11, 760–776. [Google Scholar]
- Della Ventura, G.; Williams, C.T.; Cabella, R.; Oberti, R.; Caprilli, E.; Bellatreccia, F. Britholite-hellandite intergrowths and associated REE-minerals from the alkali-syenitic ejecta of the Vico volcanic complex (Latium, Italy); petrological implications bearing on REE mobility in volcanic systems. Eur. J. Mineral. 1999, 11, 834–854. [Google Scholar] [CrossRef]
- Wood, S.A. The Aqueous Geochemistry of Zirconium, Hafnium, Niobium and Tantalum. In Rare-Element Geochemistry and Mineral Deposits; Linnen, R., Samson, I., Eds.; Geological Association of Canada Short Course Notes: London, UK, 2005; Volume 17, pp. 217–251. [Google Scholar]
- Timofeev, A.; Migdisov, A.A.; Williams-Jones, A.E. An experimental study of the solubility and speciation of niobium in fluoride-bearing aqueous solutions at elevated temperature. Geochim. Cosmochim. Acta 2015, 158, 103–111. [Google Scholar] [CrossRef]
- Guo, D.X.; Liu, Y. Occurrence and geochemistry of bastnasite in carbonatite-related REE deposits, Mianning-Dechang REE belt, Sichuan Province, SW China. Ore Geol. Rev. 2019, 107, 266–282. [Google Scholar] [CrossRef]
- Su, J.H.; Zhao, X.F.; Li, X.C.; Hu, W.; Chen, M.; Xiong, Y.L. Geological and geochemical characteristics of the Miaoya syenite-carbonatite complex, Central China: Implications for the origin of the REE-Nb-enriched carbonatite. Ore Geol. Rev. 2019, 113, 103101. [Google Scholar] [CrossRef]
Publisher’s Note: MDPI stays neutral with regard to jurisdictional claims in published maps and institutional affiliations. |
© 2021 by the authors. Licensee MDPI, Basel, Switzerland. This article is an open access article distributed under the terms and conditions of the Creative Commons Attribution (CC BY) license (https://creativecommons.org/licenses/by/4.0/).