Abstract
Chert samples from different coastal and inland outcrops in the Eastern Asturias (Spain) were mineralogically investigated for the first time for archaeological purposes. X-ray diffraction, X-ray fluorescence, transmission electron microscopy, infrared and Raman spectroscopy and total organic carbon techniques were used. The low content of moganite, since its detection by X-ray diffraction is practically imperceptible, and the crystallite size (over 1000 Å) of the quartz in these cherts would be indicative of its maturity and could potentially be used for dating chert-tools recovered from archaeological sites. Also, this information can constitute essential data to differentiate the cherts and compare them with those used in archaeological tools. However, neither composition nor crystallite size would allow distinguishing between coastal and inland chert outcrops belonging to the same geological formations.
1. Introduction
Chert or flint has extensively been used as raw material for tool production since the Palaeolithic age. From a mineralogical/geological point of view, chert (term used in this paper following Graetsch and Grünberg [1]) is a siliceous rock with, in general, micro and/or cryptocrystalline texture and formed mostly by silica minerals such as quartz, moganite, chalcedony (cryptocrystalline form of silica which contains small amounts of water, both as molecular water and bound in silanol (Si-OH) groups [2]) and other crystalline phases (e.g., carbonates, micas, clays, iron oxides, etc.). Organic matter may be present in chert when silicification is early, with indicative elements as carbon, hydrogen, nitrogen and oxygen [3], and chert with higher organic matter content is darker. Chert may also include bitumen, which can contain sulfur and various heavy metals such as nickel, vanadium, lead, chromium, mercury, as well as arsenic, selenium and other elements. The silica content of the chert originally results from the concentration of the micro-organisms remains such as radiolarians, sponges and diatoms. Chert with more than 20 wt. % of moganite would indicate an evaporitic origin [4]. Chert shows great variability in color and texture across a single geological formation, as noted by Frederick and Ringstaff [5].
Chert is one of the most important lithic resources utilized by people of upper Paleolithic, Mesolithic and Neolithic, besides many other rocks (quartz, quartzite, obsidian, basalt, rhyolite), and other materials such as wood, bone, erc. The abundance of chert in archaeological sites is due to their relative resistance to weathering. Classical studies of chert tools recovered from archaeological sites assign the provenance of the rock based on color and texture properties. As these features are not sufficient, an increasing number of studies based on elemental and phase analysis were reported in the latest two decades [6,7].
This study presents a systematic characterization of chert outcrops in the Cantabrian Zone (Eastern Asturias, Spain), based on the three techniques: X-ray diffraction, X-ray fluorescence and infrared spectroscopy. Additionally, in order to identify the presence of moganite in a chert reference sample, transmission electron microscopy and Raman spectroscopy were used. The aim of the current research is to prove the validity of the the crystallite size and moganite content in chert as mineralogical maturity indicators that could be used for: (1) Dating chert-tools recovered from archaeological sites; (2) obtaining essential data to differentiate the chert and compare them with those used in archaeological tools. For this purpose, coastal and inland outcrops of chert from the Sierra del Cuera in the Cantabrian Zone (Eastern Asturias, Spain) were analyzed. Three formations with chert outcrops are mainly known in this area: Alba (Visean-Tournaisian), Valdeteja (Bashkirian-Middle Muscovian) and Vegamián (Tournaisian) [8]. Interestingly, two settlements of human groups of Mesolithic hunter-gatherers have been recognized in this area: Alloru, near San Antolin beach, and Los Canes, near Arangas. It is worthy to identify the human mobility and lithic procurement strategies of these inhabitants because Los Canes is the only known inland settlement in the Cantabrian area and it is unknown yet whether they had social and exchange relationships with their neighbors in the Alloru or with other more distant groups, if they were able to cross the Sierra del Cuera towards the coast, etc. Our investigations revealed that all studied chert outcrops possess relatively low moganite content (<4%) and large quartz crystallite sizes (>1000 Å). However, neither composition nor crystallite size facilitated distinguishing between coastal and inland chert outcrops that belong to the same geological origin. The distinction would help better defining mobility and lithic procurement strategies of the inhabitants of the Los Canes.
2. Materials and Methods
2.1. Materials
The 10 chert outcrops analyzed, coastal and inland, are located in the Sierra del Cuera area (Eastern Asturias, Spain). The formations to which they belong, their age, coordinates, codes of the investigated samples and color are presented in Table 1. The geological context and locations of the chert outcrops are shown in Figure 1.

Table 1.
Formations, age, color and codes of the chert samples from the outcrops (Note: * Assimilable to the Valdeteja and Picos de Europa Formations).
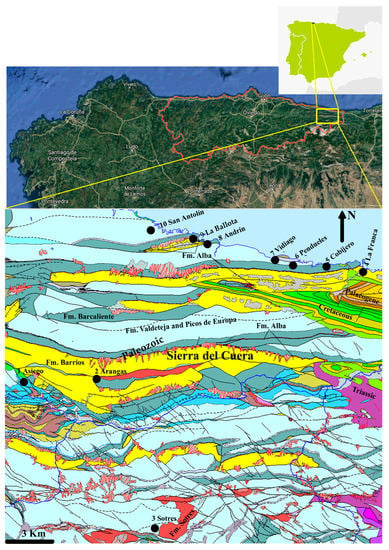
Figure 1.
Geological context of studied zone and locations of the 10 chert outcrops. ©Instituto Geológico y Minero de España (IGME) (2020) https://igme.maps.arcgis.com/home/webmap/viewer.html?webmap=44df600f5c6241b59edb596f54388ae4 (accessed on 10 March 2021) [9].
The geological context of the outcrops studied is that of the Cantabrian Zone (Figure 1), which is mainly formed by two sets of rocks in the study area: A Paleozoic basement with rocks of Lower Ordovician to Upper Carboniferous age and a Permo-Mesozoic cover, of Lower Permian to Lower Cretaceous age. The Paleozoic basement was structured by a tight system of thrusts of E–W to NE–SW trace during the Variscan orogeny, which show a direction of tectonic transport towards the S–SW and that due to the kinematics of their emplacement are inverted in the N part of the study area. These thrusts have very few associated folds due to the massive character of the Paleozoic formations. Subsequent to the emplacement of the variscan thrusts, a series of dextral tears (tardivariscan faults) of NW–ESE direction occur, which are related to the last stages of closure of the Asturian Arc. The Permo-Mesozoic cover is related to the Alpine orogeny.
The formations represented in the map of Figure 1 correspond to the Paleozoic basement of the Cantabrian Zone and are:
- (a)
- The Vegamián Formation (Tournaisian) [10], with a lithological composition characterized by a quartzite band with satiny black shales with layers of black lydites about 10 cm thick.
- (b)
- The Barcaliente Formation (Sepurjovian) [11] is characterized by a black colour and fine-grained waxy lustre limestone with a fetid odour and a characteristic continuous millimetric banding marked by differences in colouring.
- (c)
- The Valdeteja Formation (Bashkirian-Middle Muscovian) [11] is characterized by a coarse-grained grey limestone with high fossiliferous content.
These Formations represent the Mountain Limestone [11], marine sedimentation occurred in the Carboniferous, which constitutes the system of greater extension within the Cantabrian Zone.
- (d)
- The Alba Formation (Visean-Tournaisian) [10] is composed of three levels: nodular red limestones (Griotte Limestone) at the base; clay levels with red chert at the base or alternating, in the middle part; and black tableted limestones with chert in the upper part.
- (e)
- The Sotres Formation (Sakmarian-Asselian) [12], near the village of Sotres, is located in the southern domain of the Picos de Europa Region. It is made up of alternating fine-grained black limestones with algae and black shales with volcanic levels, black shales and coal, conglomerates, and bioclastic limestones with chert.
- (f)
- In the Barrios Formation (Lower Ordovician) [13] there are white or gray fine-grained quartzites with a thickness of 600 m that runs along the southern slope of the Sierra del Cuera and the coast from east to west.
The stratigraphic column of these formations and the Ermita Formation (composed of fluvial sandstones deposited during the Upper Devonian [13]), shown in Figure 2, corresponds to the zone between the beaches of La Ballota and Andrín.

Figure 2.
Stratigraphic column of the formations described in the text, between the beaches of La Ballota and Andrín (adapted from Ana-Cubero [14]). Note: The third level of Alba Formation was omitted because its thickness could not be determined due to deterioration.
Chert outcrops in the area of the Sierra del Cuera are usually quite poorly represented, either because of degradation due to geological features or they are covered by vegetation or they have been destroyed by civil constructions. The prospected coastal outcrops, located on beaches near the coast of Llanes, from east to west, have the following characteristics: La Franca, red chert outcrop situated at the end of one of the few roads that cross the Sierra del Cuera towards the sea. Cobijero, red chert outcrop situated in Buelna in a doline flooded by the sea. Pendueles, flysch outcrop is located in the coastal village of Pendueles. The flysch of Pendueles beach is formed by a succession of turbidites with four fundamental lithological terms: limestones and chert in the basal part; sandstones, calcareous shales; sandstones and sandy shales; all of them of Westphalian A-Westphalian D chronology. The chert has a thickness of about 40 m that decreases laterally. It shows alternations of light and dark bands, often very deformed. Vidiago outcrops are located at La Ballota and Andrín cherts are usually reddish in color, with greenish-gray levels, and variable thickness, from a few meters to approximately 20 m. This unit occurs in centimetric to decimetric strata. This level does not normally outcrop, as it is covered by vegetation. This chert level corresponds to the lower part of the Alba Formation (Lower Carboniferous) [13]. Immediately above the chert, there are medium fine-grained limestones, clear, with pinkish tones, of nodular aspect, characteristic of the griotte facies, with a thickness of about 20 m. It occurs in centrimetric to decimetric banks with clays intercalations. This Griotte facies limestone corresponds to the upper part of the Alba Formation. The San Antolín chert is intercalated within the limestone, which constitutes the host rock of the outcrop, located on the beach of the same name, at the mouth of the river Bedon. This outcrop shows chert with a great variety of colors. The outcrop is quite degraded by marine and wind erosion. The limestones, of Carboniferous age (Serpukhovian-Moscovian), form a succession that shows the different types of deposits that formed a carbonate platform with a flat roof and steep slopes. They form the coastal mountain ranges of the Cuera area and, further south, the Picos de Europa massif. In this platform, there are different sets of strata with their own stratigraphic features: (a) Carbonate basin on which the platform system progressed (advanced), composed of layers of dark and laminated micritic limestones (Barcaliente Formation); (b) platform slope base deposits, constituted by an alternation of intra-formational calcareous breccias (thick layers), calci-turbidites (thin layers) and dark intervals of marly aspect of siliceous sponge spicule accumulation (spiculites); (c) sedimentary slope of the platform, with a lower part consisting of massive calcareous breccias of cobbles from the upper slope of limestones bioconstructed by bacterial communities and calcareous algae, also of massive aspect; and (d) shallow platform or roof of the platform formed by stratified limestones with abundant bioclasts (foraminifera, echinoderms, algae and calcareous sponges, corals and brachiopods mainly) and with several intercalations of siliciclastic rocks [15].
The outcrops of the inland are located near the archaeological sites of Los Canes and Arangas caves in the Sierra del Cuera. In Arangas (Arangas Council) two red chert types of Arangas; one of them is located in one of the two natural ways to cross the Sierra del Cuera in the east direction; and the other is at the intersection of inland roads of Picos de Europa and it consists of small amounts of red chert boulders on the Ribeles river, near Arangas. Outcrops of Asiego chert are located in the Cabrales Council. Sotres outcrop of red chert is located near the village with the same name, on the east side of Las Vegas de Sotres, natural way towards the Leon region, on the other side of the Cantabrian Mountains.
In Figure 3, the photos from chert outcrops investigated are presented.
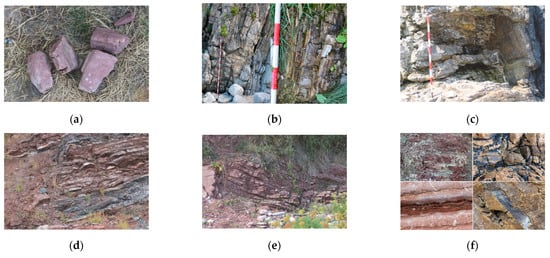
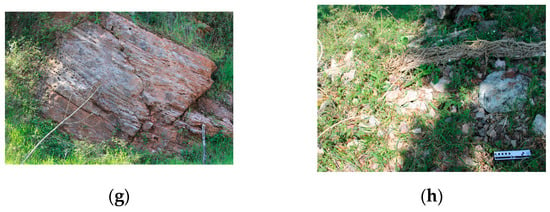
Figure 3.
Photos for the investigated chert outcrops: (a) Cobijero, (b) Pendueles, (c) Vidiago, (d) La Ballota, (e) Andrín, (f) San Antolín, (g) Arangas, (h) Asiego.
It is very difficult to identify the age of the chert because there is not sufficient data available, both at the level of their relationship with the host rock and at the paleontological level. Nevertheless, these cherts are possibly epigenetic because platforms such as the Sierra del Cuera are not associated with hydrothermal processes. However, in the Late Variscan stage (305–290 Ma), during the formation of the Asturian orocline [16], there were magmatic processes that could have developed hydrothermalism causing the formation of deposits with chert [17].
2.2. Methods
The X-ray diffraction technique with the powder method was used for the identification of the crystalline phases and obtaining of the crystallite size and the lattice strain of the quartz for the chert samples investigated. A quantity of 0.5 g from each sample was ground in an agate mortar to obtain their X-ray diffraction patterns using the PANalytical X’pert Pro equipment at 40 mA and 45 kV (Cu-Kα radiation, λ = 1.5418 Å), 2θ range 5–85°, 2θ step scans of 0.007° and a counting time of 1 s per step. The SRM 1878b external standard of α-SiO2, with a maximum particle size of 10,000 Å (as determined by laser scattering) was employed. The PANalytical software (X’Pert HighScore Plus) was used for the identification of the crystalline phases and the obtention of the crystallite size and microstrain of the quartz. To evaluate the microstructural properties of the quartz crystalline domains the full width at half maximum (FWHM) of the (101) reflection was measured.
Generally, two contributions to the reflection broadening can be distinguished by their different dependencies on the diffraction angle: small crystallite size and microstrain [18,19,20,21,22]. The crystallite size determines the degree of crystallinity and the order of the mineral phase, being related to the lattice strain: as FWHM increases the crystallite size decreases and the lattice strain increases. The larger the crystallite size, the greater the crystallinity and the lower the lattice strain. The size of the ordered crystallites (i.e., coherently scattering domains) is limited by the interfaces, the twin boundaries or the stacking faults. The microstrain is due to lattice imperfections such as dislocations and point defects that are associated with a stress field. The broadening caused by small crystallite size varies with 1/cos θ (θ = incidence angle of X-rays) and the one due to lattice deformation varies according to β = 4εtanθ (β = integral reflection breadth, ε = microstrain). The crystallinity index of quartz, Ic, proposed by Murata and Norman [23] has been calculated. The quintet of quartz reflections with values of 2θ between 67 and 69 degrees (Figure 4) have been used to perform the calculations, specifically by the reflection (212), at approximately 67.7 degrees of 2θ. The height of this reflection, a, is divided by its total height, b, that is, considering the background to compensate for minor variations in the total intensity of the pattern. The ratio a/b is multiplied by 10 to convert fractions into numbers generally greater than 1.0.
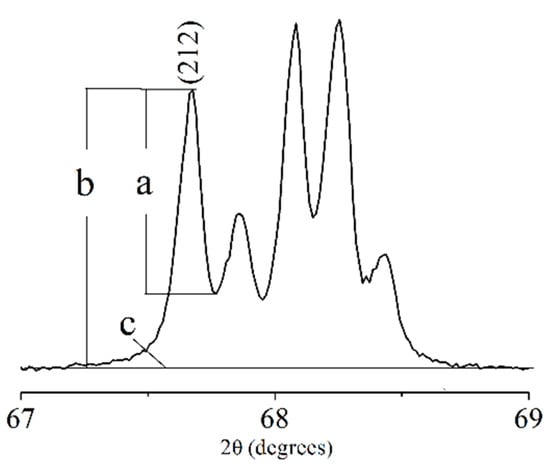
Figure 4.
Quintet of reflections showing the (212) reflection used to calculate the crystallinity index, being “a” the height of the (212) reflection, “b” the height of the (212) reflection + background and “c” is the background.
The chemical composition of the samples was determined using X-ray fluorescence with a Shimadzu EDX-720 energy dispersive X-ray fluorescence spectrometer (XRF-EDX). This model is equipped with five types of filters for reducing and eliminating background, characteristic lines, and other types of scattered radiation; collimator, 10 mm; voltage 50 Kv and current 40 μA; measurement time was 100 s. The optimum calibration curve for the sample is selected automatically from pre-registered calibration curves. The system used in this equipment does not require time-consuming pretreatment and thin sections of chert are used. Measurements were carried out in the air because the attenuation of fluorescent X-rays is small.
Since carbon was detected in practically all the samples in a first elemental analysis with Scanning Electron Microscopy-Energy Dispersive X-ray spectroscopy (SEM-EDX), three of the samples (B3, V3 and AS1) were selected for the measurement of total organic carbon (TOC). It was carried out indirectly by the difference between the result of total carbon (TC) and inorganic carbon (IC) analysis. The TC analysis was performed by combustion in a furnace at 900 °C and the IC analysis by addition of 50% phosphoric acid in the equipment used without prior preparation of the sample received. The equipment used was TOC-V/SSM-5000A from Shimadzu.
Infrared spectra of the chert samples of the coastal and inland outcrops were obtained with a Varian 670-IR equipped with a Golden Gate ATR, in the range of 600 and 4000 cm−1, with a resolution of 4 cm−1 using 16 scans, both for the sample and for the background. The sample was placed in diamond crystal and pressed to ensure contact between the sample and the crystal.
In the chert, quartz is usually accompanied by moganite although by X-ray diffraction it is difficult to detect this last phase. This is because its reflections coincide with those of the quartz, and it is present in a quite low percentage. In addition, moganite detection at low percentages (≤4%) using X’Pert HighScore Plus software could be overlooked and considered as an artifact.
Therefore, Raman spectroscopy and high-resolution electron transmission microscopy (HRTEM) were used to reveal the presence of moganite in sample S2. Raman spectrum was obtained using a JASCO NRS-5100 spectrometer (Jasco Inc. MD, Easton, USA) equipped with a charge-coupled device detector (Andor DU 420) and coupled to an Olympus optical microscope. The Raman spectrum was excited with a diode laser (λ = 785 nm) kept at 500 mW. Spectrum was acquired between 100–800 cm−1 with a resolution of 1 cm−1, exposure time 10 s with 10 accumulations. Spectrum smoothing was performed using SYSTAT version 13 (from Systat Software, Inc., San Jose CA, USA, www.sigmaplot.com (accessed on 29 May 2020).
JEOL JEM-2100F transmission electron high-resolution microscope with a resolution of 1.9 Å between points and 1.0 Å between lines and a 200 keV field emission gun was used to obtain TEM and selected area electron diffraction (SAED) micrographs with its accompanying CCD camera (Gatan).
Statistical analysis was carried out with IBM SPSS version 24. Factor analysis was used for the interpretation of the composition of the samples. The Kaiser–Meyer–Olkin measure of sampling adequacy and Bartlett test of sphericity, anti-image matrix, principal component analysis as the extraction method and Varimax with Kaiser normalisation as a rotation method were used. Hierarchical clustering analysis was applied to crystallite size and the Murata index to group the data having similar properties. For obtaining the groups -clusters- the agglomerative clustering was used. This clustering procedure is iterative until all the data points are brought under one single larger cluster. In addition, the correlation between the crystallite size and the carbon and silicon contents, and the Murata crystallinity index, was analyzed using the Pearson correlation coefficient.
3. Results
X-ray diffraction patterns of some analyzed cherts from the coastal and inland outcrops are displayed as examples in Figure 5 and Figure 6, respectively. Coastal and inland outcrop samples show quartz (JCPDS card no. 46–1045) as the main phase; calcite (JCPDS card no. 46–1045) is present in most samples and is usually the second most abundant phase. Other phases identified and present in almost all samples, in a much lower proportion than calcite, are orthoclase (JCPDS card no. 8–48) (Figure 5b), muscovite (JCPDS card no. 7–25) (Figure 6b) and hematite (JCPDS card no. 24–72) (Figure 6c). In addition, moganite (JCPDS card no. 38–360) was identified in some of the coastal outcrops (Figure 5c) and in practically all the samples from the inland outcrops, and fluorapatite (JCPDS card no. 15–876) in S1 (Figure 5d); barite (JCPDS card no. 24–20) in As4 (Figure 6d). In relation to moganite, although the software identifies it as probable, it is difficult to confirm its presence due to the overlapping of the following reflections ordered by increasing intensity—(022) (3.33 Å), (141) (2.29 Å), (004) (2.13 Å), (200) (2.45 Å)—with those of quartz. Additional reflections in moganite such as (121) (3.39 Å), (110) (4.45 Å), (101) (4.38 Å), (002) (4.26 Å) are very weak and thus difficult to notice, especially if the content of this phase is very low. It was therefore necessary to use other techniques, such as Raman and HRTEM, to confirm its presence in the most representative sample.
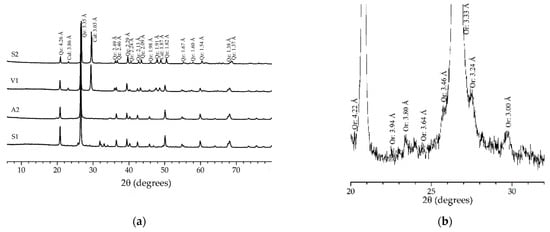
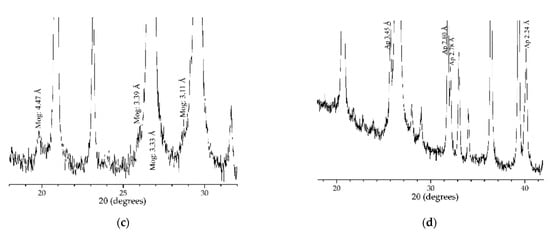
Figure 5.
X-ray diffraction patterns of the chert samples from coastal outcrops showing reflections of quartz, Qz, and calcite, Cal, and calcite (a); orthoclase, Or, (b); moganite, Mog, (c) and fluorapatite, Ap, (d).
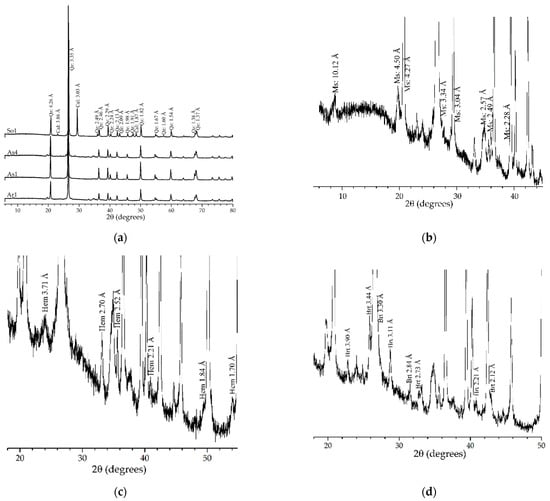
Figure 6.
X-ray diffraction patterns of the chert samples from inland outcrops showing reflections of quartz, Qz, and calcite, Cal, (a); muscovite, Ms, (b); hematites, Hem, (c) and barite, Brt, (d).
In Table 2 are presented the crystallite size values, lattice strain and crystallinity index of Murata for the quartz.

Table 2.
Values of 2θ of the (101) reflection of quartz and FWHM (2θ °) used to obtain the crystallite size and lattice strain, and values of 2θ of the (212) reflection of quartz to obtain the crystallinity index of Murata of the chert samples of the coastal and inland outcrops.
The weight percentages of the element oxides analyzed with ED-XRF of the chert samples with statistical significance are presented in Table 3. The obtained chemical composition with this methodology complements the mineralogical composition of the phases identified with X-ray diffraction. The detection of SiO2 would indicate the presence of a siliceous phase such as quartz and other silicate phases such as mica and feldspar, together with Al2O3 and K2O. The detection of CaO would indicate the presence of calcite; and similarly, the detection of Fe2O3 could correspond to iron oxides, such as hematite; and together SO3, pyrite. Sulfur could also be part of the bitumen, if present in the analyzed cherts. TiO2 could correspond to rutile.

Table 3.
Percentages of the element oxides analyzed with ED-XRF of the outcrops investigated.
The results of TC, IC and TOC are displayed in Table 4. The results of the analyzed carbon indicate that its origin is basically organic, although it is present in the samples analyzed in a very low percentage.

Table 4.
Percentages of analyzed carbon in the chert samples selected.
The infrared spectra of the chert samples of the coastal (Figure 7) and inland outcrops (Figure 8) show the absorption bands of the vibration modes for water, which, due to its low intensity, its content is below 2%. Quartz shows the characteristic doublet between 800 and 780 cm−1 and the absorption at 690–710 cm−1; whereas atmospheric CO2 show bands at 2350 cm−1 and in some samples also of carbonate at 1400 (coastal) or 1420 (inland) and 870 cm−1 (probably associated to calcite) [24,25]. Infrared spectroscopy did not show the bands corresponding to the H2O vibration modes in any of the outcrop samples, indicating the absence of siliceous phases such as chalcedony. The rest of the absorption bands correspond to the vibration modes of the Si-O bonds and carbonate anion when present, supporting the presence of quartz and calcite. The information provided by infrared spectroscopy allows us to corroborate the presence of the detected phases with the previously mentioned characterization methodologies.
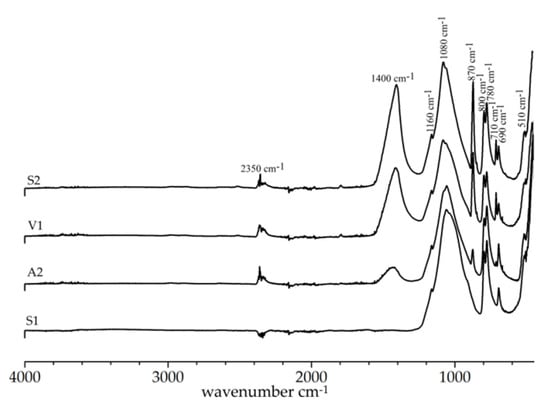
Figure 7.
Infrared spectra of some chert samples from coastal outcrops.
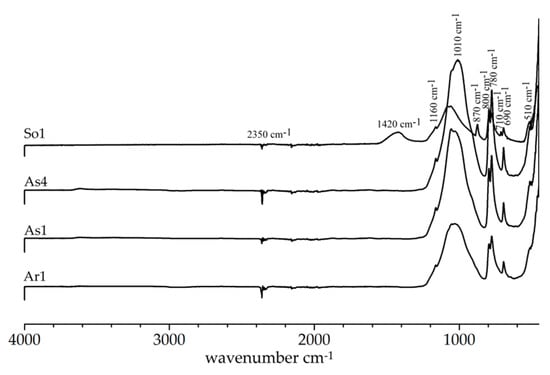
Figure 8.
Infrared spectra of some chert samples from inland outcrops.
The Raman spectrum of S2 chert is shown in Figure 9. The Raman spectrum section selected between 420 and 520 cm−1 with baseline subtracted for spectrometric analysis is shown in the inset. The more intense band at 462 cm−1 is associated with the presence of quartz [26,27], and the band visible around 500 cm−1 is associated with the presence of four-member rings in the moganite structure and it is the analytical band [27,28].
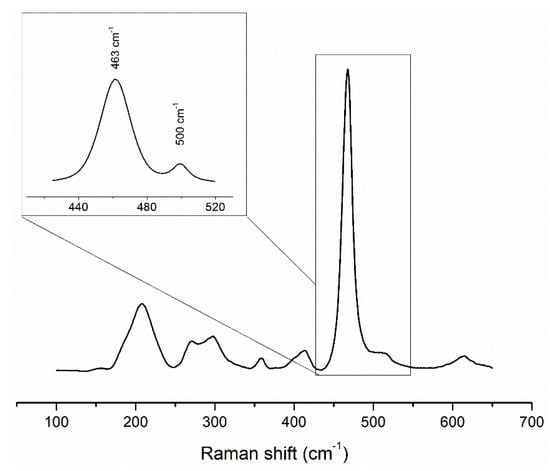
Figure 9.
Raman spectrum of S2 sample. In the inset, the spectrum between 420 and 520 cm−1 showing the band corresponding to moganite (500 cm−1) and quartz (463 cm−1).
In SAED micrographs of S2 sample particles (Figure 10) interplanar distances of 1.28, 1.45, 1.79, 2.44, 3.37 and 4.30 Å can be attributed to moganite [29], since they coincide with the dhkl (604), (600), (006), (020), (202) and (200), respectively.

Figure 10.
HRTEM micrographs of sample S2 showing their crystallinity with visible lattice fringes (a) and their layered structure (c) layered structure; (b,d) their corresponding SAED patterns showing a polycrystalline-like diffraction pattern with interplanar distances corresponding to moganite (JCPDS card no. 38–360).
From the interplanar distances of the (020) plane (Figure 10b), considering the relation d010 = 2d020, the b parameter has been obtained by solving the expression 1/d2010 = k2/b2. The b value of 4.88 Å coincides with that published elsewhere [29]. Similarly, the values of a and c have been obtained from the interplanar distances of the (200) and (006) planes (Figure 10b); in this case, considering that the angle β in the moganite does not reach 91° [29] the values of d100 and d001 would practically correspond to a and c. The calculated values are 8.60 Å and 10.74 Å, respectively, which coincide with that published previously by Heaney [29].
In the factorial analysis, the Kaiser–Meyerz-Olkin (KMO) measure of sampling adequacy is 0.658, indicating a strong correlation between the variables; and Bartlett test of sphericity provided a 0.000 value, so the test is valid. The cumulative variance in the investigated specimens is 80.2% and it can be explained by two principal components. Component 1 (45.7% of total variance) containing the following oxides (factor loading in parentheses): K2O (0.980), TiO2 (0.952), Al2O3 (0.915) and Fe2O3 (0.893); component 2 (34.5% of the total variance) is composed by CaO (0.916), MnO (0.876), SrO (0.838) and SO3 (−0.625). Figure 11 shows the plot of the two components: component 1 is increasing to the right in the figure and component 2 is increasing to the top. The plot does not show a separation between coastal (black) and inland (red) outcrops.
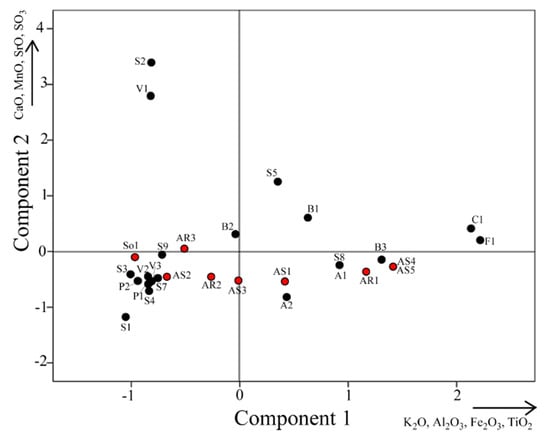
Figure 11.
Plot of components 1 and 2. Black dots represent the coastal outcrops and red dots represent the inland outcrops.
The result of the cluster analysis of crystallite size using the Ward method and the Euclidean distance as measurement range is shown in Figure 12, dendrogram in which the clusters considered as the most appropriate are: (1°) up to ~1000 Å; (2°) up to 2000 Å; (3°) up to 3000 Å; (4°) up to 4000 Å; (5°) >4000 Å.

Figure 12.
Dendrogram of crystallite size of outcrop samples using the Ward method and the Euclidean distance as measurement range.
Coastal outcrops samples show higher variability in the crystallite size of quartz than those of inland outcrops. It should be noted that the red coastal cherts of the Alba formation (A1, C1, F1 and B3) have a larger crystallite size of quartz (2148 Å) than the red cherts analyzed of the Valdeteja and Vegamián formations. The quartz of the inland red cherts, also of the Alba Formation, show values of crystallite size equal to or greater than the coastal ones, as in some analyzed samples of Asiego. Almost all black or very dark cherts as well, as gray or beige cherts present different crystallite size values.
The result of the cluster analysis of the Murata index using the Ward method and the squared Euclidean distance as measurement range is shown in Figure 13. For this index the clusters considered the most appropriate are: (1°) up to 2 Å; (2°) 2 to 3 Å; (3°) 3 to 4 Å; (4°) 4 to 5 Å; (5°) >5 Å.
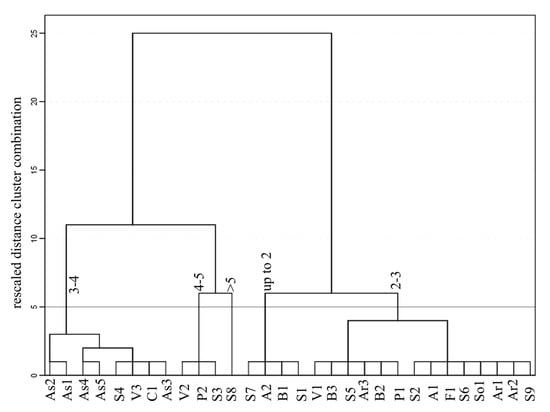
Figure 13.
Dendrogram of Murata index of outcrop samples using the Ward method and the Euclidean distance as measurement range.
The Pearson correlation coefficient between the crystallite size and the Murata index was 0.74, being the correlation significant at the 0.01 level. The Pearson correlation coefficient between the crystallite size and the carbon and silicon contents, respectively, was in both cases <−0.35, being the correlation significant at the 0.05 level.
4. Discussion
Some aspects of the results obtained with the fundamental analytical techniques used to characterize the outcrops cherts are discussed below. In relation to the mineralogical composition of the analyzed cherts, the practical absence of moganite would indicate that the outcrops chert could correspond to the more mature step of silica, since moganite is dissolved and turns into quartz with time, temperature and weathering [4,30,31].
The factorial analysis has not been able to differentiate between inland and coastal outcrops belonging to the same geological formations in terms of composition, so X-ray fluorescence would not be useful to indicate the coastal or inland origin of the archaeological tools in the area investigated.
Similarly, coastal and inland outcrops could not be differentiated on the basis of quartz crystallite size, relying on their crystallographic characteristics. However, as shown in Table 5, the crystallite size of the investigated samples of Carboniferous chert outcrops, above 1000 Å, is much higher than the average of 635 Å, obtained from 21 samples of Cretaceous flint investigated by Graetsch and Grünberg [1], and the average of 431 Å determined from 35 samples of Danish Upper Cretaceous flint by Jensen et al. [32]. The microstructure properties of chert (i.e., crystallite size and microstrain) suggest they are related to the formation mode and subsequent diagenetic processes [33]. In particular, the crystalline microstructure of chert becomes coarser in the later stages of the diagenesis [34] and finally recrystallizes to macroscopic quartz crystals.

Table 5.
Relationship between crystallite size and geological period of cherts.
The intermediate phases as opal or moganite are subjected to changes of structural order and microstructure with time and burial depth, as demonstrated by the investigation on the gradual reduction of stacking faults in opal-CT towards opal-C with increasing diagenesis [23,35]. There is a correlation between the moganite content and the size and microstrain of quartz [1]: the moganite content is low when the crystallite size of quartz is large and the microstrain is low. Thus, the absence of moganite, the crystallite size and the microstrain of the quartz would be indicative of the chert mineralogical maturity and could potentially be used in geochronology. For agates, the moganite content was found to decrease and the crystallite size of chalcedony was observed to increase with age in geological time spans [36,37]. In chert, the moganite content also decreases with aging [1]. Taking into account these considerations, the detected practically absence of moganite in the Carboniferous chert of the eastern Asturian area, as well as the low microstrain and the large crystallite size of the constituent quartz confirms their higher degree of maturity compared to chert from other ages and locations.
To date, it is very rare to use the quartz crystallite size of the chert to define the degree of crystallinity, and for this determining the Murata index is the more foreowned method. Although in this work it has been shown that there is a correlation between both values, it is not as significant as could be expected and it seems more appropriate, therefore, to use the crystallite size considering that, together with the moganite content, it is an indicator of the chert mineralogical maturity.
In the infrared spectra of the cherts, there is an additional band at 560–555 cm−1 [28]. The intensity of this band strongly increases with the increasing content of moganite. This band can be attributed to moganite as the identifying analytical band, but it does not manifest as occurs in the Raman spectrum of the analyzed sample with the band at 500 cm−1, whose presence confirms, without a doubt, the presence of moganite. By comparing the relationship of intensities of the bands associated with moganite and quartz in the Raman spectrum with that published [28,38] it could be concluded that the moganite content is less than 4%. This fact would suggest that the moganite content in the chert outcrops could be even lower than 4%, since its detection by X-ray diffraction is practically imperceptible.
The TOC content analyzed in this work is of the same order of magnitude as that obtained in rocks with carbonate content higher than 50% [39]. The TOC content of the cherts of the present investigation could be related to their maturity. However, it would be necessary to study these Carboniferous cherts from the of Eastern Asturias and others from different locations of this and other geological periods.
5. Conclusions
Cherts from Eastern Asturias were mineralogically investigated. The practical absence of moganite, and the relatively large crystallite size and the microstrain of the quartz indicate the chert mineralogical maturity. These two parameters could constitute essential data to differentiate the cherts and compare them with those used in archaeological tools. Neither composition nor crystallite size allowed distinguishing between coastal and inland chert outcrops belonging to the same geological formations. Interestingly, the Asturian cherts seem to be more mineralogically mature when compared to others reported in previous investigations for cherts from different locations in the European and American continentals. Therefore, further investigations are required to systematically compare these Asturian cherts with others from different locations of this and other geological periods.
Author Contributions
Conceptualization, C.M.; methodology, C.M., M.d.U.-Z., P.A.-L., P.F. and A.A.; software, C.M., P.A.-L. and A.A.; resources, P.F.; data curation, C.M.; writing—original draft preparation, C.M.; review and editing, C.M., P.A.-L., A.A; project administration, P.A.; funding acquisition, P.A. All authors have read and agreed to the published version of the manuscript.
Funding
This research was funded by the Spanish State Plan for R+D, grant number HAR2017–82557-P.
Data Availability Statement
Not applicable.
Acknowledgments
The authors wish to acknowledge Oscar Merino-Tomé and Juan Bahamonde for their valuable comments on the Asturian Carboniferous and the Scientific-Technical Services of University of Oviedo (Spain) for Diffraction and Fluorescence of X-ray, High-Resolution Transmission Electron Microscopy and Total Organic Carbon analyses.
Conflicts of Interest
The authors declare no conflict of interest.
References
- Graetsch, H.A.; Grünberg, J.M. Microestructure of flint and other chert raw materials. Archaeometry 2012, 54, 18–36. [Google Scholar] [CrossRef]
- Frondel, C. Structural hydroxyl in chalcedony (type B quartz). Am. Mineral. 1982, 67, 1248–1257. [Google Scholar]
- Luedtke, B.E. An Archaeologist’s Guide to Chert and Flint. Archaeological Research Tools 7; Institute of Archaeology, University of California: Los Angeles, CA, USA, 1992. [Google Scholar]
- Heaney, P.J. Moganite as an indicator for vanished evaporites: A testament reborn? J. Sediment. Res. 1995, 6, 633–638. [Google Scholar]
- Frederick, C.D.; Ringstaff, C. Lithic resources at Fort Hood: Further investigations. In Archaeological Investigations on 571 Prehistoric Sites at Fort Hood, Bell and Coryell Counties, Texas; Trierweiler, W.N., Ed.; Mariah Associates Inc.: Austin, TX, USA, 1994; pp. 125–182. [Google Scholar]
- Kendall, H.; MacDonald, B.L. Chert artifact-material correlation at Keatley Creek using geochemical techniques. In Toolstone Geography of the Pacific Northwest; Ozbun, T.L., Adams, R.L., Eds.; Archaeology Press, Simon Fraser University: Burnaby, BC, Canada, 2015; pp. 49–61. [Google Scholar]
- de la Torre, M.S.; Le Bourdonnec, F.X.; Gratuze, B.; Domingo, R.; García-Simón, L.M.; Montes, L.; Mazo, C.; Utrilla, P. Applying ED-XRF and LA-ICP-MS to geochemically characterize chert. The case of the Central-Eastern Pre-Pyrenean lacustrine cherts and their presence in the Magdalenian of NE Iberia. J. Archaeol. Sci. Rep. 2017, 13, 88–98. [Google Scholar]
- IGME. Mapa geológico de España. Hoja no 32 (Llanes). Escala 1:50000; IGME: Madrid, Spain, 1984. [Google Scholar]
- IGME; Merino-Tomé, O.A.; Suárez-Rodríguez, A.; Alonso, J.L.; González-Menéndez, L.; Heredia, N.; Marcos-Vallaure, A. Mapa Geológico Digital Continuo, 1:50.000, Asturias (Zonas: 1100–1000-1600); Navas, J., Ed.; IGME: Madrid, Spain, 2011. [Google Scholar]
- Compte, P. Recherches sur les terrains anciens de la Cordillere Cantabrique. Mem. Inst. Geológico Min. España 1959, 60, 1–440. [Google Scholar]
- Wagner, R.H.; Winkler Prins, C.F.; Riding, R.E. Lithostratigraphic units of the lower part of the Carboniferons in Northern León, Spain. The Carboniferons of Northwest Spain. Trabajos Geología 1971, 4, 603–663. [Google Scholar]
- Pieren, A.E.; Aretes, J.L.; Toraño, I.; Martínez García, E. Estratigrafía y estructura de los materiales permotriásicos delsector Gijón-La Callada (Asturias). Cuad. Geol. Ibérica 1995, 19, 309–335. [Google Scholar]
- Martínez García, E. Mapa Geológico de España, Plan MAGNA, Hoja 32 16–04 (Llanes). Escala 1:50.000; Instituto Geológico y Minero de España (IGME): Madrid, Spain, 1980. [Google Scholar]
- Ana-Cubero de, A. Estructura de los materiales paleozóicos entre las localidades de Llanes y Andrín (Unidad del Ponga, Zona Cantábrica). Trabajo Fín de Máster, Máster en Recursos Geológicos e Ingeniería Geológica; Universidad de Oviedo: Oviedo, Spain, July 2015; Available online: https://digibuo.uniovi.es/dspace/bitstream/handle/10651/33215/TFM_Alvaro%20de%20Ana%20Cubero.pdf;jsessionid=46DEA35158217CFB9DB8FAF5A7C092B4?sequence=6 (accessed on 28 April 2021).
- Bahamonde, J.R.; Kenter, J.A.M.; Della Porta, G.; Van Hoeflaken, F. Facies belts of a Carboniferous carbonate platform (San Antolín-La Huelga section, NE Cantabrian Zone, Northern Spain). Trab. Geol. 2008, 28, 69–86. [Google Scholar]
- Gutiérrez-Alonso, G.; Fernández-Suárez, J.; Jeffries, T.E.; Johnston, S.T.; Pastor-Galán, D.; Murphy, J.B.; Franco, M.P.; Gonzalo, J.C. Diachronous post-orogenic magmatism within a developing orocline in Iberia, European Variscides. Tectonics 2011, 30, 1–17. [Google Scholar] [CrossRef]
- Cepedal, A.; Martín-Izard, A.; Reguilón, R.; Rodríguez-Pevida, L.; Spiering, E.; González-Nistal, S. Origin and evolution of the calcic and magnesian skarns hosting the El Valle-Boinás copper-gold deposit, Asturias (Spain). J. Geochem. Explor. 2000, 71, 119–151. [Google Scholar] [CrossRef]
- Klug, H.P.; Alexander, L.E. X-Ray Diffraction Procedures for Polycrystalline and Amorphous Materials, 2nd ed.; John Wiley and Songs: New York, NY, USA, 1974. [Google Scholar]
- Warren, R.E. X-Ray Diffraction; Dover Publications Inc.: New York, NY, USA, 1990. [Google Scholar]
- Snyder, R.; Hala, J. Defect and Microstucture Analysis by Diffraction; Oxford Science Publications: Oxford, UK, 1999. [Google Scholar]
- Mittemeijer, E.J.; Scardi, P. Diffraction Analysis of the Microstructure of Materials; Springer: Berlin/Heidelberg, Germany, 2004. [Google Scholar]
- Ungár, T. Microstructure Parameters from X-ray Diffraction Peak Broadening. Scr. Mater. 2004, 51, 777–781. [Google Scholar] [CrossRef]
- Murata, K.J.; Norman, M.B. An index of crystallinity for quartz. Am. J. Sci. 1976, 276, 1120–1130. [Google Scholar] [CrossRef]
- Farmer, V.C. The Infrared Spectra of Minerals; Mineralogical Society: London, UK, 1974. [Google Scholar]
- Madejová, J.; Pentrak, M.; Palkova, H.; Komadel, P. Near-infrared spectroscopy: A powerful tool in studies of acid-treated clay minerals. Vib. Spectrosc. 2009, 49, 211–218. [Google Scholar] [CrossRef]
- Kingama KJHemley, R.J. Raman spectroscopic study of microcrystalline silica. Am. Mineral. 1994, 79, 269–273. [Google Scholar]
- Sitarz, M.; Wyszomirski, P.; Handke, B.; Jelen, P. Moganite in selected Polish chert samples: The evidence from MIR, Raman and X-ray studies. Spectrochim. Acta A Mol. Biomol. 2014, 122, 55–58. [Google Scholar] [CrossRef] [PubMed]
- Götze, J.; Nasdala, L.; Kleeberg, R. Occurrence and distribution of “moganite” in agate/chalcedony: A combined micro-Raman, Rietveld, and cathodoluminescence study. Contr. Mineral. Petrol. 1998, 133, 96–105. [Google Scholar] [CrossRef]
- Heaney, P.J.; Post, J.E. Evidence for an I2/a to Imab phase transition in the silica. Am. Mineral. 2001, 86, 1358–1366. [Google Scholar] [CrossRef]
- Bustillo, M.A. Occurrence and significance of the moganite in silica rosks: A review. J. Iber. Geol. 2002, 28, 157–166. [Google Scholar]
- Moxon, T.; Nelson, D.R.; Zhang, M. Agate recrystalisation: Evidence from samples found in Achaean and Proterozoic host rocks, Western Australia. Aust. J. Earth Sci. 2006, 53, 235–248. [Google Scholar] [CrossRef]
- Jensen, A.; Tovborg Wøhlk, C.J.; Drenck, K.; Krogh Andersen, E. A Classification of Danish Flints etc. Based on X-Ray Diffraction. Progress Report Ser. D, 1; The Danish National Institute of Building Research: Copenhagen, Denmark, 1957. [Google Scholar]
- von Rad, U.; Riech, V. Silica Diagenesis in Continental Margin Sediments off Northwest Africa. In Initial Reports of the Deep Sea Drilling Project; IGME: Madrid, Spain, 1979; Volume 41, pp. 879–905. [Google Scholar]
- Richter, D.K.; Bruhn, F.; Wigand, R.Z. U.r.höhergradigen Chertreifung in jurassisch/alttertiären Hornsteinplattenkalken der externen Helleniden. Zent. Bl. Geol. Paläontologie 1994, 1, 927–940. [Google Scholar]
- Graetsch, H.; Gies, H.; Topalović, I. NMR, XRD and IR study on microcrystalline opals. Phys. Chem. Mineral. 1994, 21, 166–175. [Google Scholar] [CrossRef]
- Moxon, T.; Ríos, S. Moganite and water content as a function of age in agate: An XRD and thermogravimetric study. Eur. J. Mineral. 2004, 16, 269–278. [Google Scholar] [CrossRef]
- Moxon, T.; Carpenter, M.A. Crystallite growth kinetics in nanocrystalline quartz (agate and chalcedony). Mineral. Mag. 2009, 73, 551–568. [Google Scholar] [CrossRef]
- Schmidt, P.; Bellot-Gurlet, L.; Lea, V.; Sciau, P. Moganite detection in silica rocks using Raman and Infrared spectroscopy. Eur. J. Mineral. 2013, 25, 797–805. [Google Scholar] [CrossRef]
- Huo, Z.; Pang, X.; Chen, J.; Zhang, J.; Song, M.; Guo, K.; Li, P.; Li, W.; Liang, Y. Carbonate source rock with low total organic carbon content and high maturity as effective source rock in China: A review. Asian J. Earth Sci. 2019, 176, 8–26. [Google Scholar] [CrossRef]
Publisher’s Note: MDPI stays neutral with regard to jurisdictional claims in published maps and institutional affiliations. |
© 2021 by the authors. Licensee MDPI, Basel, Switzerland. This article is an open access article distributed under the terms and conditions of the Creative Commons Attribution (CC BY) license (https://creativecommons.org/licenses/by/4.0/).