Article

In Situ High-Temperature X-ray Powder Diffraction and Infrared Spectroscopic Study of Melanterite, FeSO4·7H2O

by
Maria Lacalamita
1,
Gennaro Ventruti
1,*,
Giancarlo Della Ventura
2,3,4,
Francesco Radica
2,3,
Daniela Mauro
5 and
Emanuela Schingaro
1
1
Dipartimento di Scienze della Terra e Geoambientali, Università degli Studi di Bari Aldo Moro, via E. Orabona, 4, I-70125 Bari, Italy
2
Dipartimento Scienze Geologiche, Università di Roma Tre, Largo S. Leonardo Murialdo, 1, I-00146 Roma, Italy
3
Laboratori Nazionali di Frascati-Istituto Nazionale di Fisica Nucleare, via E. Fermi, 54, I-00044 Frascati, Italy
4
Istituto Nazionale di Geofisica e Vulcanologia, via di Vigna Murata, 605, I-00143 Roma, Italy
5
Dipartimento di Scienze della Terra, Università di Pisa, via Santa Maria 53, I-56126 Pisa, Italy
*
Author to whom correspondence should be addressed.
Minerals 2021, 11(4), 392; https://doi.org/10.3390/min11040392
Submission received: 26 February 2021 / Revised: 6 April 2021 / Accepted: 7 April 2021 / Published: 9 April 2021
(This article belongs to the Special Issue Sulfates: Crystal-Chemistry and Their Geological Significance)

Abstract

:
The thermal behavior of melanterite from the Fornovolasco mine (Tuscany, Italy) has been investigated via differential thermal analysis (DTA), thermogravimetry (TG), in situ high-temperature X-ray powder diffraction (XRPD) and Fourier-transform infrared spectroscopy (FTIR). The DTA curve showed endothermic peaks at 70, 100, 260, 500–560 and 660 °C whereas the TG curve evidenced a total mass decrease of ~68%, in keeping with the loss of all H2O and SO4 groups. Rietveld refinements were performed for all the collected patterns in the 25–775 °C range and converged at 1.57 ≤ R (%) ≤ 2.75 and 1.98 ≤ Rwp (%) ≤ 3.74. The decomposition steps FeSO4·7H2O → FeSO4·4H2O (25 ≤ T ≤ 50 °C) → FeSO4·H2O (50 < T ≤ 100 °C) → FeOHSO4 (75 < T ≤ 200 °C) → Fe2(SO4)3 (400 < T ≤ 500 °C) → Fe2O3 (500 < T ≤ 775 °C) were obtained. The high-temperature infrared analysis confirmed that melanterite undergoes a three-step dehydration in the 25–300 °C temperature range. The FeOHSO4 phase is stable over a wide range of temperature and transforms partially to Fe2(SO4)3 without the formation of Fe2O(SO4)2. The findings highlight a different behavior of the studied sample with respect to the synthetic salt.

1. Introduction

Melanterite, ideally Fe(H2O)6SO4·H2O, is a typical product of weathering of sulfide ore minerals, mine waste, or undisturbed low temperature geological settings. Together with other secondary sulfate minerals, it is often associated with acid mining drainage (AMD). Indeed, dissolution of soluble secondary sulfate minerals during spring snowmelt runoff or rainstorms causes acidification of soils, streams, and underground water with short-term, catastrophic effects on ecosystem [1]. Generally, ferrous iron-sulfate minerals may contain significant concentrations of other divalent metals in solid solution. In particular, melanterite has been reported to contain a number of additional metals (e.g., Cu, Mg or Zn) in solid solution beyond ferrous iron [2] and the degree of substitution affects the dehydration pathway of the mineral [3]. For these reasons, ferrous iron-sulfate minerals are important markers of environmental conditions such as pH, relative humidity, sulfate activity, metal sequestration [4]. In addition, synthetic FeSO4·7H2O is known as a waste or by-product which derives from industrial processes such as titanium dioxide production and steel pickling ([5] and references therein).
The increasing scientific attention to the study of the iron sulfates stems also from their identification, by orbital remote sensing or more recent landed missions, as an important constituent of the Martian soil having implications in the hydrologic cycle of the planet surface; its presence finally provides clues in the search for evidence of life on the planet [6].
The crystal structure of melanterite was firstly described based on synthetic analogues [7,8,9,10]. The only comprehensive structural study on a natural melanterite was reported recently by Mauro et al. [11] who analyzed well-crystallized samples from the pyrite + iron oxides ore deposits formerly exploited at the Fornovolasco mine (Apuan Alps, Tuscany, Italy). Melanterite from this locality has a chemical formula (Fe0.95Mg0.06)Σ1.01S1.00O4·7H2O and lattice constants a = 14.0751(8), b = 6.5014(4), c = 11.0426(6) Å, β = 105.632(3)°, V = 973.11(10) Å3 (space group P21/c). The authors accurately defined the hydrogen bond system which plays a fundamental role in the crystal chemistry of this mineral. Indeed, six out of the seven H2O groups coordinate two independent Fe-centered octahedra which alternate, along a, with SO4 tetrahedra to form undulating layers. The seventh H2O group occurs in the interstitial sites of the crystal structure.
The FeSO4·7H2O phase may dehydrate to several compounds, including FeSO4·6H2O, FeSO4·5H2O, FeSO4·4H2O (rozenite) and to FeSO4·H2O (szomolnokite), as a function of temperature and humidity conditions [12]. The thermal evolution of melanterite has not been yet well assessed as a consequence of its low stability and the presence of intermediate decomposition products. In particular, several studies were carried out on synthetic samples through thermogravimetry and kinetic analysis [5,12,13,14,15,16,17,18,19,20]. Different temperatures for the phase transformations and several reaction paths were observed depending on the operating conditions (N2 or O2 or Cl2 + O2 atmosphere; heating rate; etc.). For instance, Kanari et al. [5] found that, under N2 atmosphere, the decomposition of the FeSO4·7H2O occurs through the following steps: FeSO4·7H2O → FeSO4·4H2O (at 70 ≤ T ≤ 98 °C) → FeSO4·H2O (at 86 ≤ T ≤ 159 °C) → FeSO4 (at 227 ≤ T ≤ 283 °C) → Fe2O3 (at 653 ≤ T ≤ 716 °C). On the contrary, under oxidizing atmosphere, it decomposes trough the FeSO4·7H2O → FeSO4·4H2O → FeSO4·H2O → FeOHSO4 steps, where the latter phase appears as a stable product at 300 °C but starts to transform into hematite at T > 500 °C.
A few and not up to date studies run at not ambient conditions on synthetic FeSO4·7H2O samples occur in the literature. Kamel et al. [21] collected ex situ X-ray diffraction data on heated samples and reported that FeSO4·7H2O dehydrates into a mixture of FeSO4 and FeOHSO4, thus suggesting combined hydrolysis and oxidation reactions (FeSO4 + FeSO4·H2O + ½O2 → 2FeOHSO4). These authors also observed that FeSO4 underwent oxidation with the consequent formation of Fe2O(SO4)2. The latter phase, then, decomposed to Fe2(SO4)3, and Fe12O3(SO4)15 before the formation of Fe2O3. The same reaction path, with the exception for the formation of Fe12O3(SO4)15, was also found by Swamy et al. [18]. Similar results were obtained by combining X-ray diffraction and infrared analyses in Safiullin et al. [22]. FeOHSO4 was also observed after X-ray refinement of a synthetic FeSO4·7H2O sample heated at 300 °C for 24 h [23] and at 280 °C for 7 days [24].
More recently, an in situ HT-XRPD study has been carried out by Jani et al. [25] who operated at low temperature (from 20 to 80 °C) and at relative humidity (RH) ranging from 30 to 65% to evaluate the effects of these parameters on the dehydration process. They carried out a qualitative phase analysis and found that the FeSO4·7H2O to FeSO4·4H2O transformation quickly occurs at most of the temperature and humidity conditions (T = 70 °C, RH = 65%; T = 60 °C, RH = 65%; T = 40 °C, RH = 55%; T = 60 °C, RH = 50%; T = 60 °C, RH = 35%) explored. In addition, at a fixed RH, the increase of the temperature causes the FeSO4·7H2O → FeSO4·4H2O → FeSO4·H2O transformation to speed up. At a fixed temperature (i.e., T = 60 °C), instead, low RH values (35%) accelerate the FeSO4·7H2O dehydration.
In the present work, we investigate the thermal behavior of melanterite (the same sample studied by Mauro et al. [11]) by combining in situ high temperature X-ray powder diffraction, differential thermal analysis, thermogravimetry and in situ high temperature Fourier-transform infrared spectroscopy, in order to get insights on all the steps of the thermal evolution of this compound from room temperature (RT) up to the formation of hematite (600 °C). In particular, we provide quantitative phase analysis based on Rietveld refinements, thus contributing to detail the full decomposition process. This work is part of an ongoing research activity focused to the advance in the knowledge on the thermal stability of natural iron-bearing hydrous sulfates of our group [24,26].

2. Materials and Methods

The studied specimen was collected in the Fornovolasco mine, Fabbriche di Vergemoli, Lucca (Tuscany, Italy) where melanterite occurs in sulfate piles as efflorescence and represents the first oxidation and hydration product of pyrite in the old tunnels of the mine [11,27,28].
Differential thermal analysis, thermogravimetric and derivative thermogravimetric (DTA/TG/DTG) measurements were performed by means of a Toshiba STA7200RV analyzer, at the Earth and Geoenvironmental Sciences Department of the University of Bari (Bari, Italy). About 13 mg of melanterite were placed in an alumina crucible and heated from room temperature up to 800 °C at a rate of 10 °C/min in nitrogen flow.
In situ high-temperature X-ray powder diffraction experiments were carried out in air using a Panalytical Empyrean X-ray diffractometer with Bragg-Brentano geometry, at the Earth and Geoenvironmental Sciences Department of the University of Bari. The instrument, operating at 40 kV/40 mA, is equipped with a large Nickel-beta filter, CuKα radiation, PIXcel3D detector (Malvern PANalytical, Almelo, The Netherlands) and an Anton Paar HTK 1200N high-temperature chamber (Anton Paar GmbH, Graz, Austria). The sample was ground in an agate mortar and the powder was then deposited on a corundum sample holder. The powder patterns of melanterite from Fornovolasco were collected in the 2θ range 10–82° (step size 0.0263°, counting time 257 s/step) in the temperature range 25–775 °C with equilibration time of 5 min at every 25 °C in order to monitor quick phase transformations. The PANalytical B.V. software HIGHScore Plus version 4.6a (Malvern PANalytical, Almelo, the Netherlands) was used for the phase identification whereas the GSAS [29] software was employed for the Rietveld refinement and the quantitative phase determination.
In situ transmission HT-FTIR spectra were collected in transmission mode on a KBr pellet prepared by mixing 0.5 mg of powdered melanterite with 150 mg of spectroscopic-grade KBr. A fragment of the pellet was heated in a Linkam T600 HT stage (Linkam Scientific Instruments, Tadworth, Surrey, UK), fitted on a Bruker Hyperion3000 IR microscope (Bruker Scientific, Billerica, MA, USA) attached to a Vertex V70 optical bench at INFN (Istituto Nazionale di Fisica Nucleare, Frascati, Italy). Spectra were collected every 10 °C from RT to 200 °C, and every 20 °C above up to 500 °C, by co-adding 128 scans, with a 4 cm−1 nominal resolution. Temperature was increased with a 20 °C/min rate, and the spectra were collected just after reaching any target T. Two additional experiments were done by using the same conditions and experimental set-up on (1) pure melanterite powders pressed with a metallic die, and (2) by using a very small single crystal. For both latter samples the absorbance in the principal O–H stretching region was strongly out of scale due to detector saturation. The signal in the NIR or in the water bending ranges was however in scale, thus the information from these two spectral ranges will be added in the discussion below.

3. Results

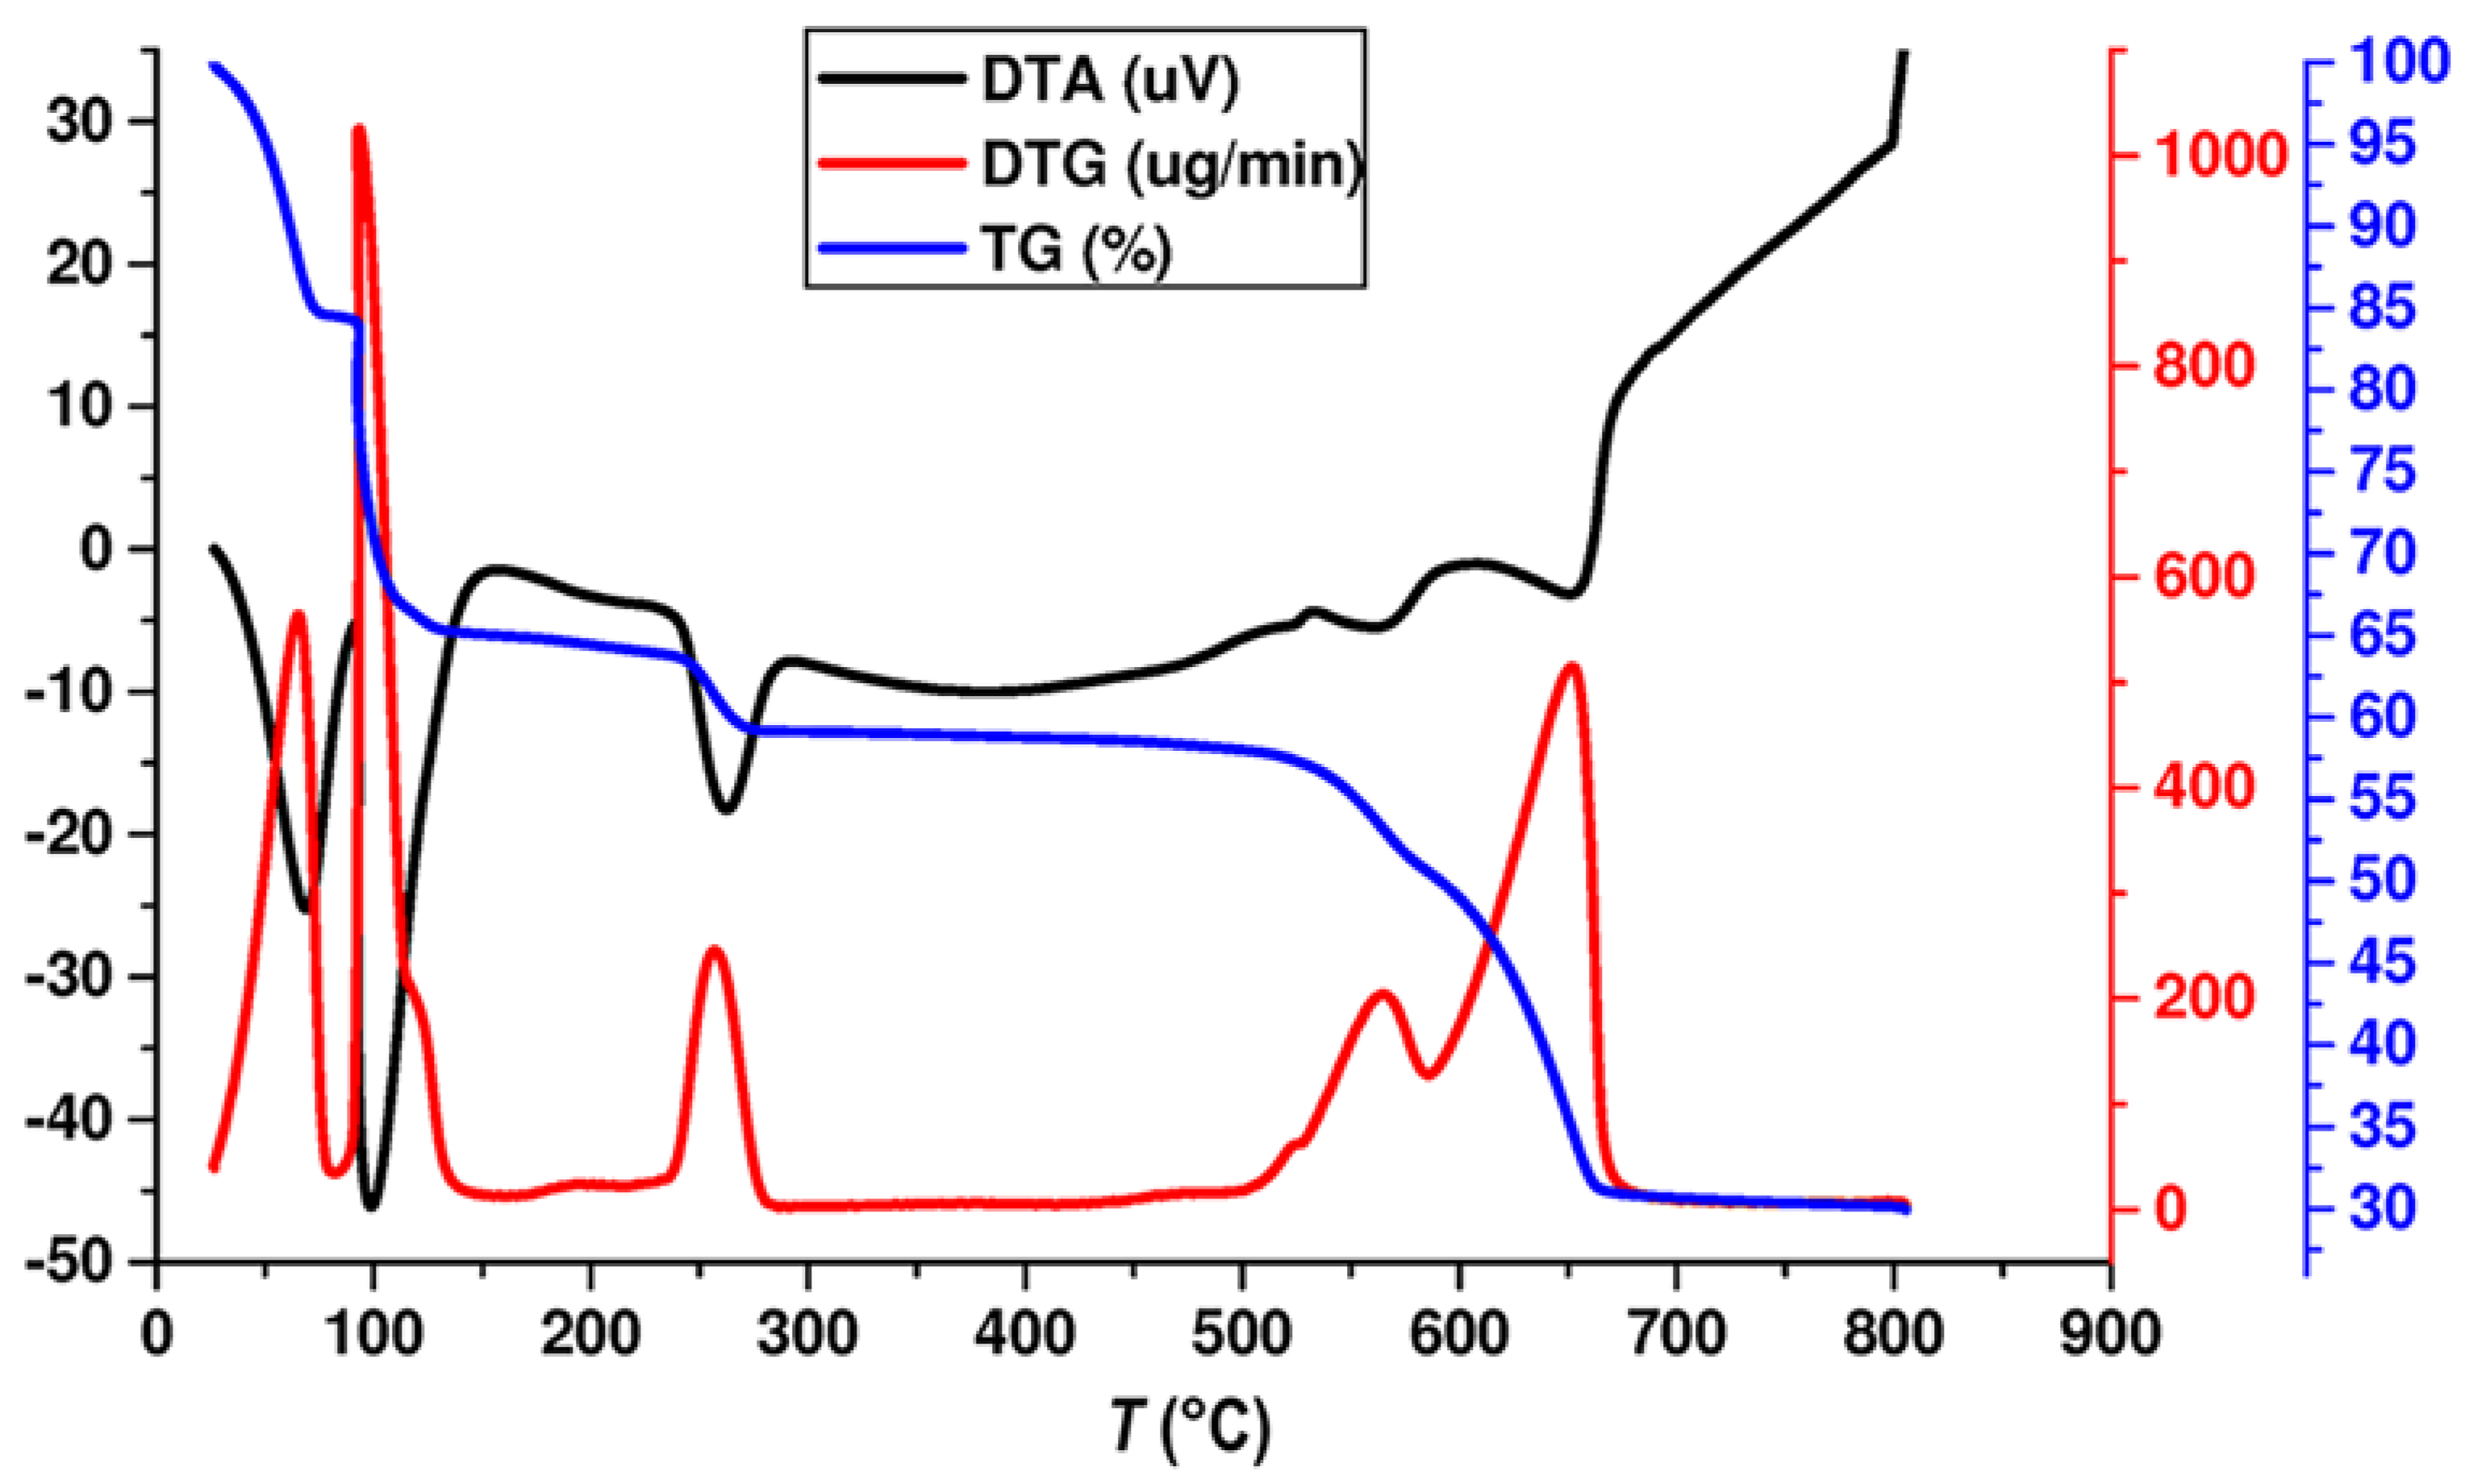
3.1. Thermal Analysis

Figure 1 shows the curves from the TG–DTA–DTG experiments on the studied sample. The DTA pattern exhibits well-defined endothermic peaks centered at about 70, 100 and 260 °C that correspond to the three steps of dehydration as also reported in previous works (see details in Table 1).
These steps are evident in the DTA curve where additional weak and broad peaks at 500–560 °C are present; these account for the formation of ferric sulfates [5,14,30]. The endothermic peak at 660 °C is associated to the complete sulfate decomposition (Figure 1, Table 1). The TG curve indicates a total mass decrease of ~68% which is compatible with the loss of all the H2O groups and of the SO4 group from the starting material. In detail, the weight mass decreases of about 15% (70–90 °C T range), 20% (110–150 °C T range) and 4% (260–300 °C T range); these values are close to the theoretical ones associated to the loss of H2O groups respectively in the 3–3–1/2 molar sequence (see the reaction scheme below). Finally, a continuous weight loss (~29%) is observed in the thermal range 500–700 °C.

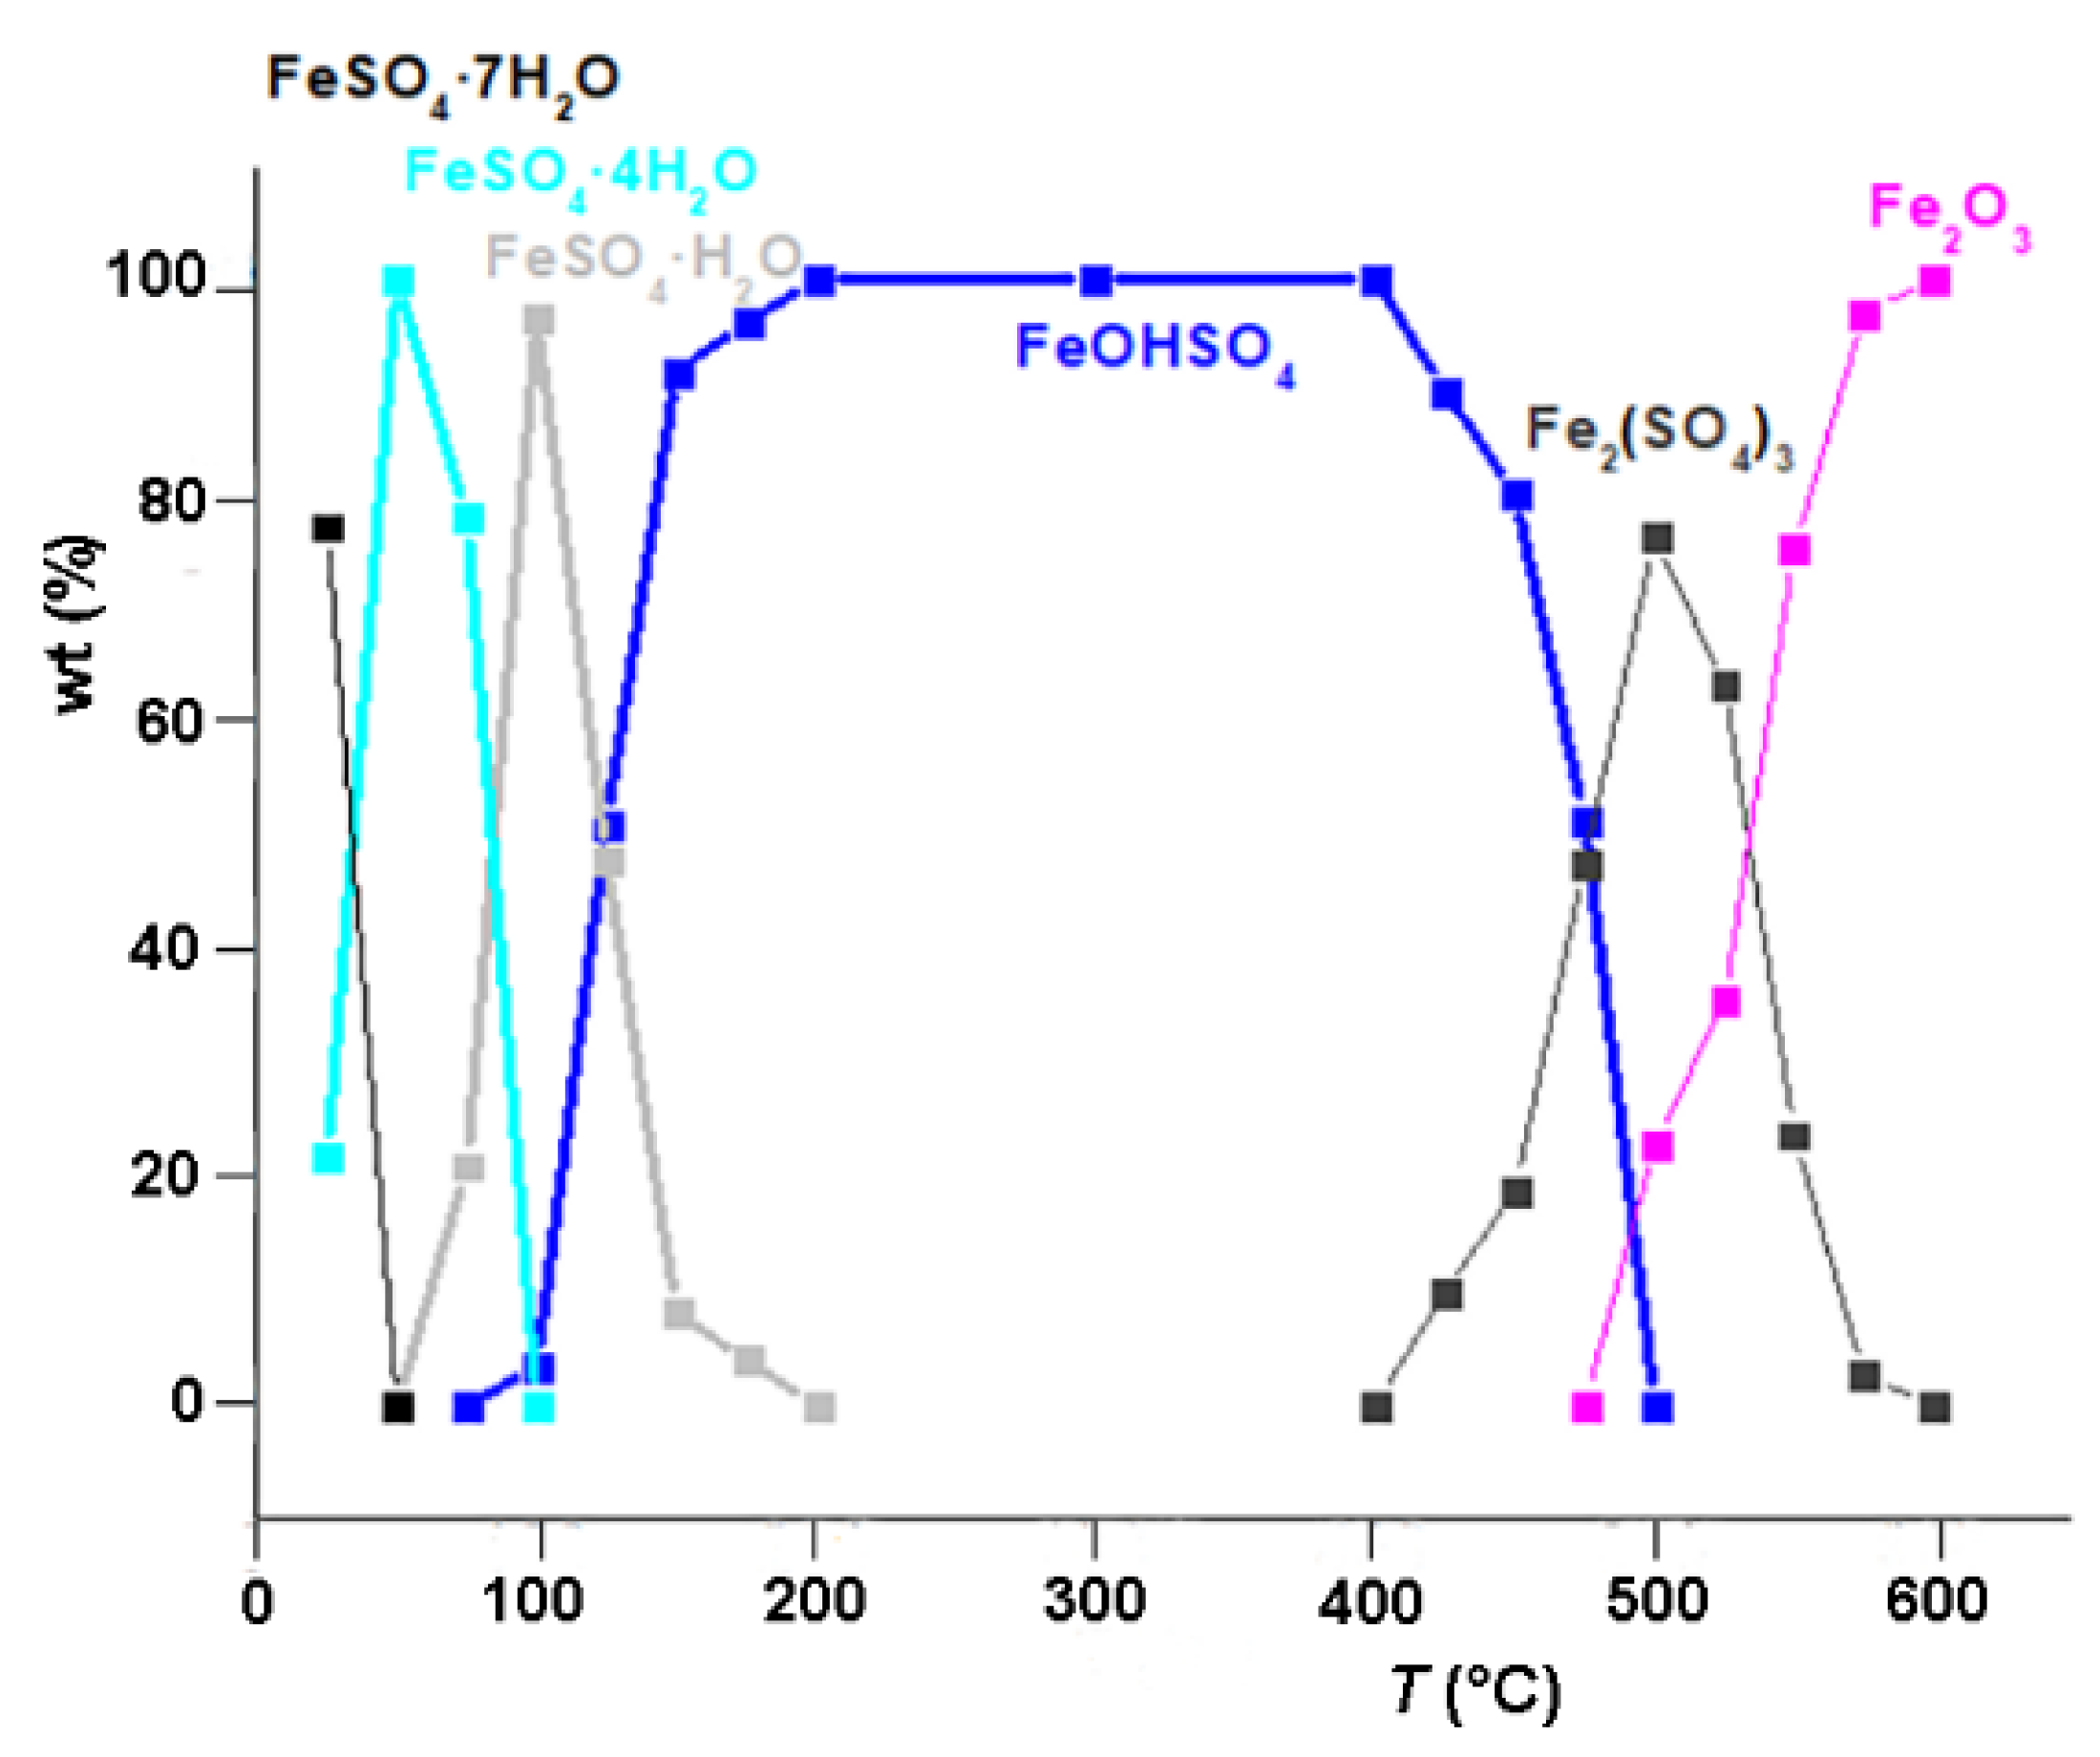
3.2. Quantitative Phase Analysis

Figure 2a,b show the thermal evolution of the XRPD patterns of the studied melanterite from RT to 200 °C and from 200 to 775 °C, respectively.
The room temperature pattern matches that given for melanterite in the ICSD database (no. 98-001-6589), although also peaks from rozenite (no. 98-001-5914) can be identified. Rozenite does not occur in the Fornovolasco mine [11,27,28]. Therefore, the partial replacement of melanterite by rozenite resulted from the room temperature pattern may be ascribed to grinding of the sample. The characteristic peaks of rozenite increase in intensity on heating and remain clearly visible until 75 °C. Starting from 100 °C, the patterns change as a consequence of the appearance of additional phases, specifically szomolnokite and FeOHSO4 (Figure 2a). The latter is the only phase identified in the pattern collected at 200 °C. A slight increase in the peak intensity is observed in the diffraction patterns from 200 to 375 °C (Figure 2b). For T > 400 °C, instead, the characteristic peaks of mikasaite, Fe2(SO4)3, became visible and enhanced their intensity by increasing the temperature until 500 °C. Finally, from 575 °C until the highest experimental temperature (775 °C), the diffraction peaks of hematite, α-Fe2O3, are clearly visible (Figure 2b).
Rietveld analysis of the RT pattern of melanterite from Fornovolasco is shown in Figure 3. It was performed using the structure models obtained by Mauro et al. [11] and by Baur [31] for melanterite and rozenite respectively. Quantitative phase analysis provided 78% of melanterite and 22% of rozenite in the starting material which is coherent with the data from the TG analysis (see above). The Rietveld refinement at room temperature converged to R = 1.83%, Rwp = 2.52%. Rietveld refinements were carried out for all collected patterns, providing agreement factors in the range 1.57 ≤ R (%) ≤ 2.75 and 1.98 ≤ Rwp (%) ≤ 3.74. The crystal structure data for the phases present in the high temperature patterns were taken from: Wildner and Giester [32] for szomolnokite; Ventruti et al. [24] for FeOHSO4; Miura et al. [33] for the mikasaite and Blake et al. [34] for hematite.

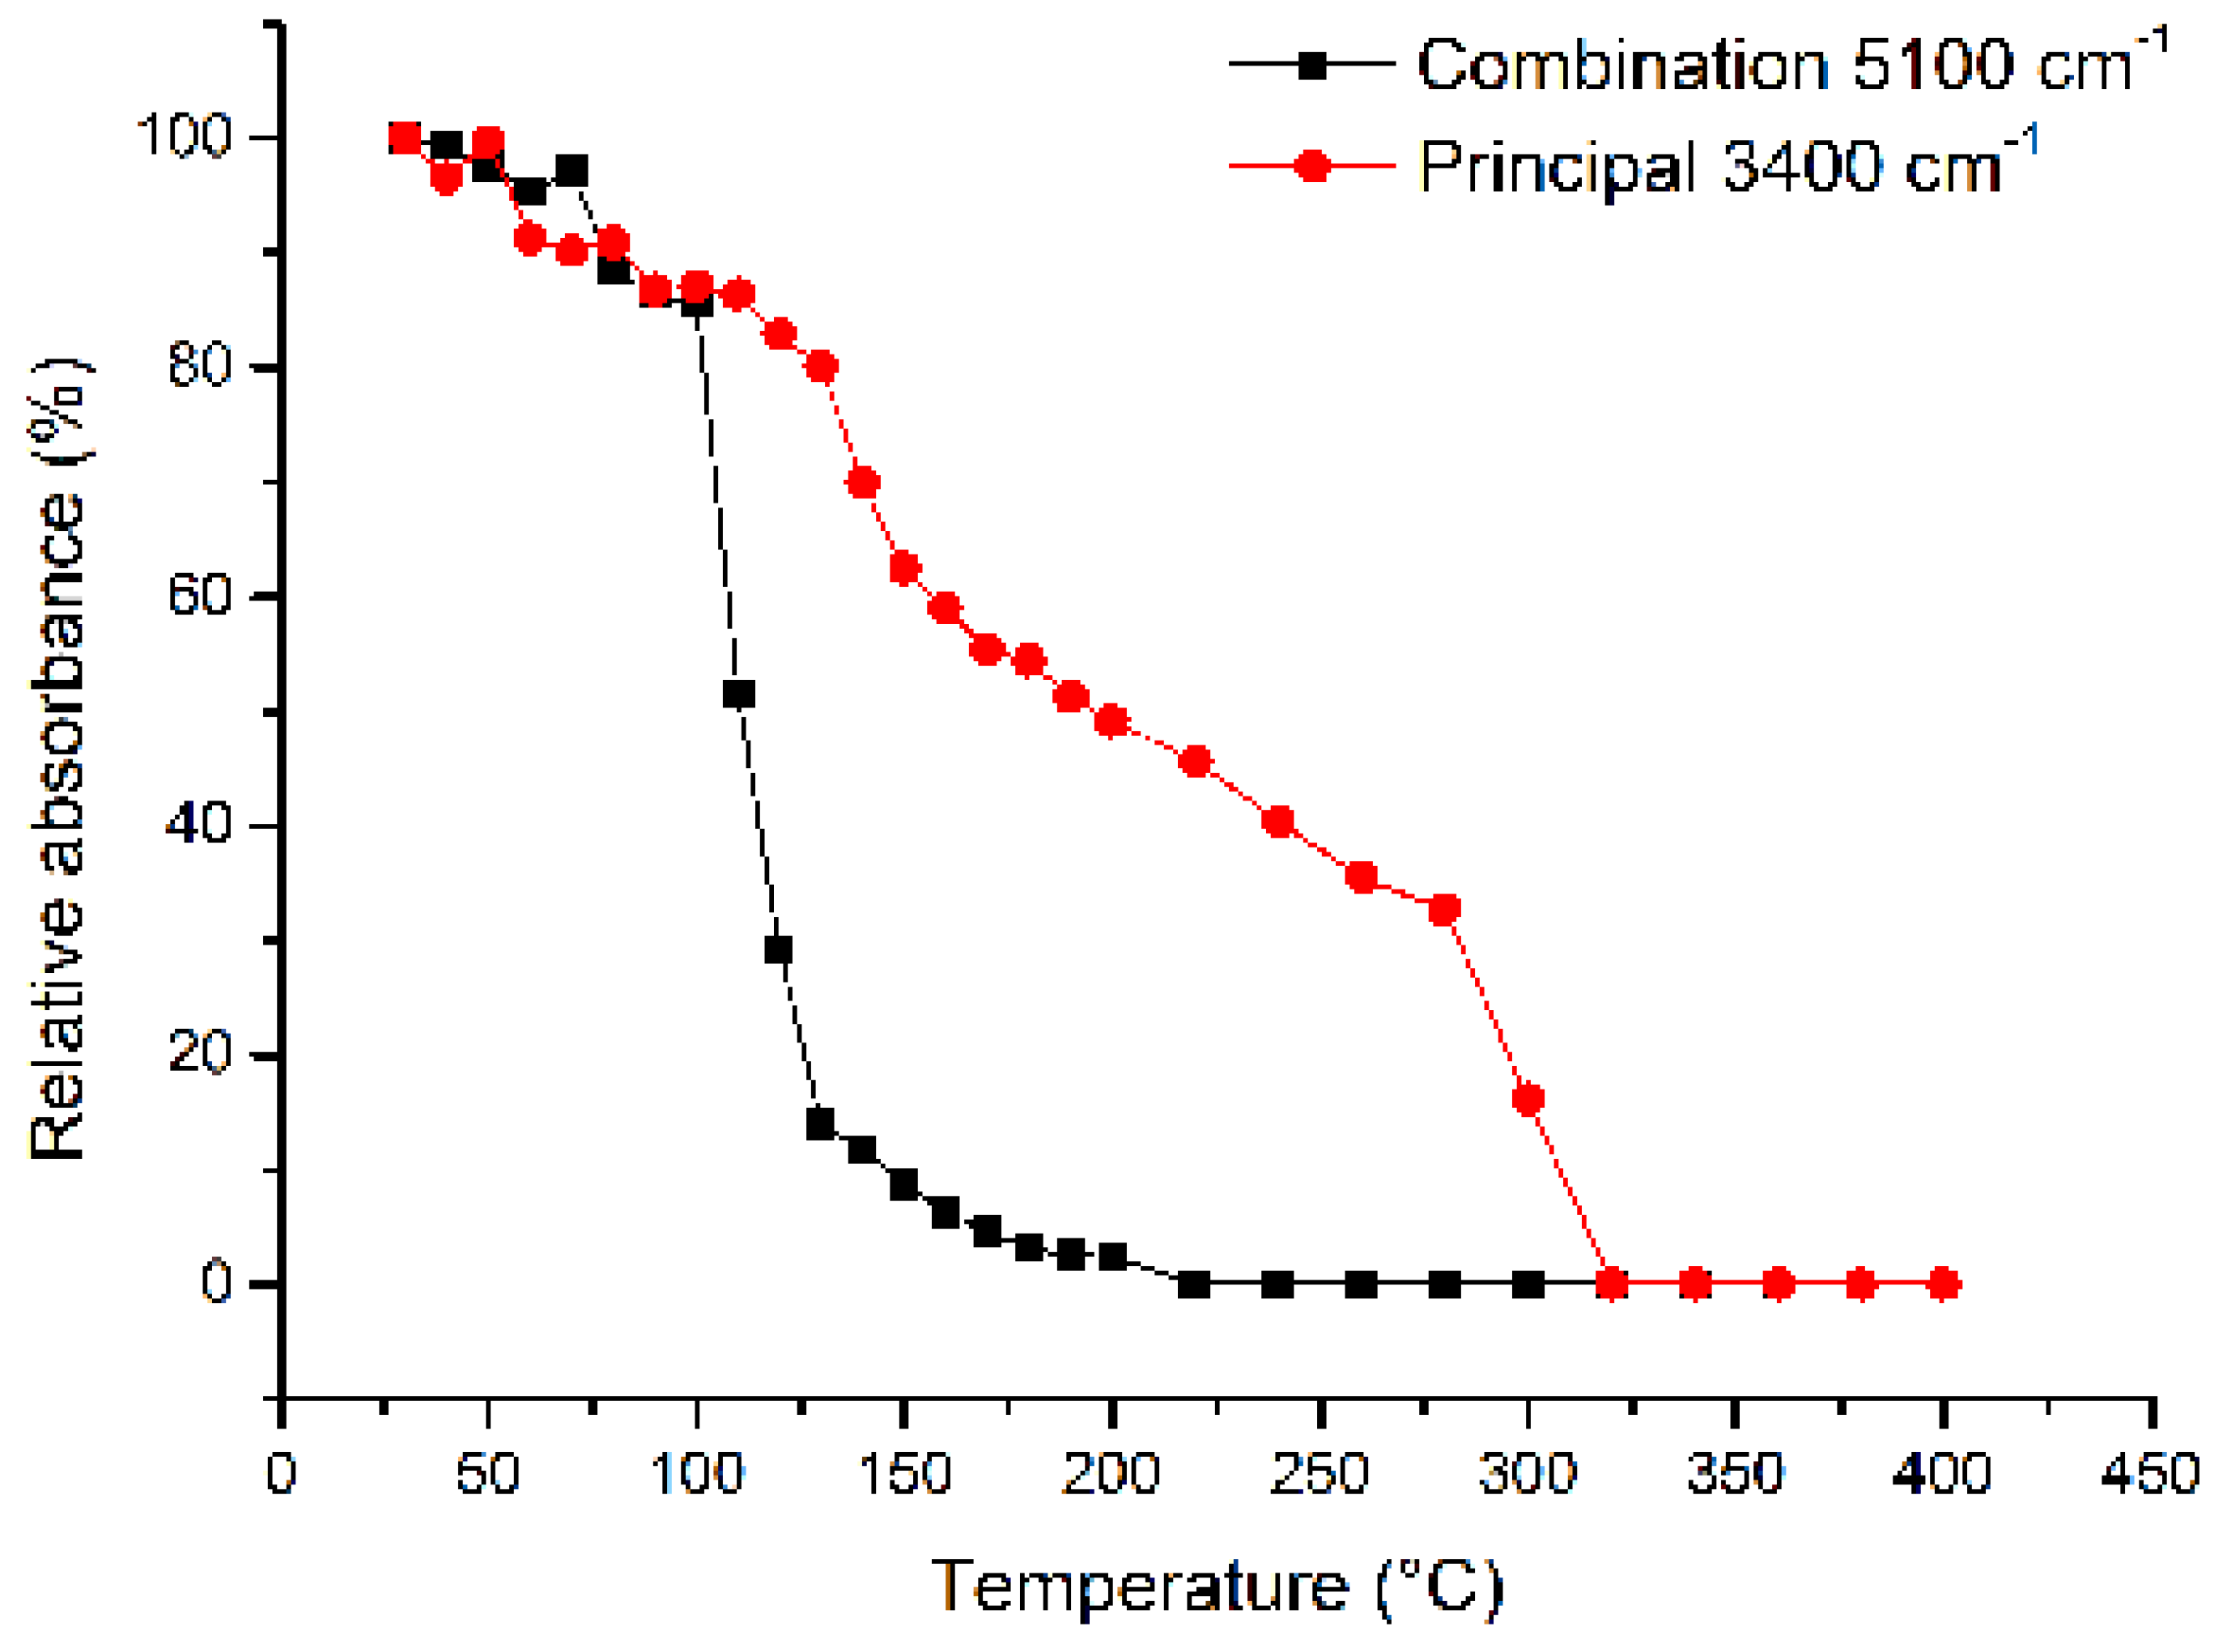
3.3. HT-FTIR Spectroscopy

Figure 4 displays the RT spectrum of the melanterite under study, collected on a KBr pellet. Although there is a strong interest for melanterite in both environmental [9] and remote sensing [35] studies, there is surprisingly a limited number of spectroscopic, in particular infrared, data in the literature for this mineral.
In the main H2O stretching region (4000–2800 cm−1), the FTIR pattern of the studied sample (Figure 4a) shows a very broad and convolute absorption extending from 3700 to 2800 cm−1 that clearly consists of several overlapping components, in agreement with the presence of seven different H2O groups in the structure. Peaks at 3535, 3457, 3385 and 3257 cm−1 can be resolved; according to Mauro et al. [11], donor-acceptor distances in the range 2.723 Å to 3.252 Å are refined for the hydrogen bond system of melanterite. Considering the empirical OA…OD distance–frequency correlation of Libowitzky [36], bands covering a range between 3252 and 3574 cm−1 are expected, in excellent agreement with the spectrum of Figure 4a. The relatively intense 3257 cm−1 component is partially due to an overlapping with the first overtone of the bending mode [26] which is also expected at these wavenumbers. Scatterings at similar wavenumber values, although less resolved, are also present in the OH-stretching Raman spectrum [11]. The spectrum of melanterite presented by Reddy et al. [37] that, to the best of our knowledge is the only precedent published IR spectrum, shows only a very broad and unresolved absorption in this range, with a rounded profile. The H2O bending mode consists of at least two overlapping components at 1650 and 1612 cm−1 (Figure 4a). The non-polarized NIR spectrum collected on a crystal fragment shows a doublet at 5000 and 5100 cm−1, due to the combination mode (ν3 + ν1) of H2O. The same pattern has been observed by Frost et al. [38]. The sulfate mode region (1300–400 cm−1) is displayed in Figure 4b. It is dominated by bands from the SO42− group vibrations. Following existing literature on sulfates [37,39,40,41,42] the most intense peaks at 1146, 1108 and 1087 cm−1 (Figure 4b) can be assigned to the ν3 antisymmetric stretching modes, the medium intense peaks around 1019 cm−1 to the ν1 symmetric stretching, the medium intense peaks at 627–614 cm−1 to the ν4 antisymmetric bending and the group of peaks in the 400–518 cm−1 to the ν2 symmetric bending.
Selected HT-FTIR spectra collected in situ on the KBr pellet in the principal H2O-stretching region (3800–2800 cm−1) and in the bending mode range (1850–1550 cm−1) are displayed in Figure 5a,b, respectively.
At increasing temperatures, a general and quickly decrease in intensity of the H2O-stretching band is observed; at 300 °C a weak absorption is still present in the spectrum, while at 400 °C the H2O signal is lost (Figure 5a). The same kind of trend is observed in the H2O bending and for the combination mode (Figure 5b,c). A plot of the integrated intensities for the different bands (Figure 6) correlates well with the TG and XRPD data. In particular, the combination band at 5200–4800 cm−1, which is solely due to the H2O absorption, disappears for T > 200 °C. Instead, the broad absorption in the principal O–H stretching region (Figure 5a), that combines the contribution of both H2O and OH groups, is resolved up to 300–350° (Figure 6), in agreement with the persistence of the FeOHSO4 compound at higher temperatures.

4. Discussion

Figure 7 illustrates the thermal evolution of the sample under study in terms of variation of the Rietveld refined weight fractions of the occurring phases as a function of temperature.
Figure 7 shows that melanterite readily transforms into rozenite in a narrow temperature range of RT-50 °C, at about 50% relative humidity (RH). The melanterite-rozenite transition is facilitated by the structural similarity between these two phases: both consist of SO4 tetrahedra and Fe(O, H2O)6 octahedra and differ just by their H2O content (Table 1) and their tetrahedral-octahedral linking. In particular, the structure of melanterite consists of two independent Fe(H2O)6 octahedra, M1 and M2, one isolated SO4 tetrahedron and a seventh ‘interstitial’ H2O group which is not coordinated to any Fe ions [11]. Hydrogen bonds connect the Ml and M2 Fe-octahedra with the SO4 tetrahedra creating a flexible undulating layer of repeating SO4M1–SO4M2 polyhedra, while the interstitial H2O group is H-bonded between the M2 octahedra and the SO4 tetrahedra within the layer. In rozenite the iron ions are coordinated to four H2O groups and two oxygen atoms from different adjacent SO4 ions in order to form ring-shaped structural units linked to each other by a three-dimensional network of H-bonds. During the melanterite-rozenite dehydration process, three H2O groups must be released from the heptahydrate melanterite: the extra-polyhedral H2O (i.e., the H2O that does not participate to the octahedral coordination with Fe) and two additional H2O groups coordinated to each independent Fe ions. During heating, these H2O groups are replaced by oxygen atoms belonging to two different SO4 groups, thus resulting into the rupture of the corresponding hydrogen bonds of melanterite and the formation of the new hydrogen bonding network of rozenite (Figure 8).
Rozenite is stable up to 75 °C (Figure 7) and its peaks disappear in the powder pattern collected at 100 °C. The most intense peak of szomolnokite at about d = 3.44 Å appears in the powder pattern collected at 75 °C; on heating, the szomolnokite content in the sample gradually increases from 50 up to 100 °C while, at the same temperature the decomposition of rozenite is complete. At T = 100 °C, the diffraction pattern of szomolnokite consists of broadened and very weak diffraction peaks, characteristic of poorly crystalline phases (Figure 2a). The structural differences between rozenite and szomolnokite explains the nucleation of a low crystalline compound, szomolnokite, starting from the disruption of the rozenite framework. In the 100 to 200 °C T range the amount of szomolnokite in the sample decreases rapidly and, simultaneously, the most intense peak of basic ferric sulfate, FeOHSO4, starts to increase its intensity at d ~ 3.28 Å (see Figure 2a and Figure 7).
Both structures of szomolnokite and FeOHSO4 are based on the same heteropolyhedral framework topology consisting of Fe octahedral chains interlinked by sulfate tetrahedra (Figure 9). The only differences between these two minerals are the oxidation state of constituent iron and the bridging anion in the octahedral chain: Fe2+ plus H2O for szomolnokite and Fe3+ plus OH for FeOHSO4. On the basis of this strict structural relationship, it is reasonable to expect a szomolnokite to FeOHSO4 high-temperature solid-state reaction. Nevertheless, the intermediate reaction path of szomolnokite during melanterite decomposition is a controversial matter in the literature. Indeed, most of the authors report the decomposition of this phase into anhydrous FeSO4 based only on thermogravimetric data [5,12,13,17,30], while others infer the formation of both FeSO4 and FeOHSO4 on the basis of ex situ HT-XRPD [21] data only. Kanari et al. [14] and Pannetier et al. [43], instead, proposed the following reaction mechanism: FeSO4·H2O + 1/4O2 → FeOHSO4 + 1/2H2O.
In order to check the decomposition products under different atmospheres, additional XRPD measurements were conducted on melanterite previously tempered at 300 °C also under N2. We identified that the reacted product contains a mixture of szomolnokite and FeOHSO4. This result suggests that in our experiment, the FeOHSO4 compound forms through the reaction proposed by Kanari et al. [14] and Pannetier et al. [43] and that the thermal treatment of melanterite in air accelerates the intermediate reaction of szomolnokite into FeOHSO4. The FeOHSO4 intermediate product was also observed in previous studies as a stable phase up to about 500 °C [44,45,46]. In our experiment, from 200 to 400 °C only FeOHSO4 occurs, whereas at 425 °C it coexists with mikasaite, Fe2(SO4)3. The amount of ferric sulphate quickly increases up to 500 °C and then decreases up to 600 °C, when it disappears (Figure 7). Note that 500 °C corresponds to the temperature of dehydroxylation of the FeOHSO4 phase. Finally, at T ≥ 500 °C hematite forms and results the only component at T ≥ 600 °C.
The observed trends indicate that, under the used experimental conditions, the decomposition process occurs according to the following reaction scheme:
FeSO4·7H2O → FeSO4·4H2O + 3H2O (25 ≤ T ≤ 50 °C),
FeSO4·4H2O → FeSO4·H2O + 3H2O (50 < T ≤ 100 °C),
FeSO4·H2O + 1/4O2 → FeOHSO4 + 1/2H2O (75 < T ≤ 200 °C),
3FeOHSO4 → Fe2(SO4)3 + 1/2Fe2O3 + 3/2H2O (400 < T ≤ 500 °C),
Fe2(SO4)3 → Fe2O3 + 3SO2 + 3/2 O2 (500 < T ≤ 775 °C),
The reactions (1)–(3) involve a total mass loss of ~39.5%, which is consistent with the mass loss from the TG curve in the 25–300 °C range (~39%, Figure 1). Note that the in situ structural analysis provides slightly lower temperature for the complete melanterite to rozenite dehydration (50 vs. 70 °C) as well as for the szomolnokite to FeOHSO4 decomposition (200 vs. 260 °C) with respect to those determined by DTA (Figure 1 and Figure 7).
Previous HT studies done by monitoring the H2O signal via IR spectroscopy have shown that the use of powdered sample embedded into pellets may lead to ambiguous results [46,47,48]. However, plots of the absorbance decrease of H2O infrared bands as a function of T may still provide additional information when coupled to XRPD data. Diffraction results in fact show a continuous loss of H2O groups along the sequence melanterite–rozenite–szomolnokite, and in agreement with this transformation sequence the plot of Figure 6 shows an almost linear and continuous decrease up to 300 °C. For higher T there is a steeper and definitive loss of H2O corresponding to the final disruption of the basic ferric sulfate compound, which is complete in the 400–500 °C range. The intensity decrease of H2O infrared bands during this step is around 30%, in close agreement with the OH loss expected during the disruption of the basic ferric sulfate. Analysis of the combination mode collected on pure powders shows a linear decrease of the signal up to 100 °C and an abrupt loss of H2O in the 100–150 °C range; this is in agreement with the abrupt disappearance of szomolnokite, the last H2O groups-bearing phase in the sequence, that occurs in the same T interval.
The three-step dehydration process entails the formation of FeOHSO4 as also observed in synthetic samples [21,23,24]. However, our structural analysis provides further details on the stability of the FeOHSO4 phase, which in fact resulted to be the predominant product of the entire decomposition process, as it was refined in the patterns collected from 100 to 475 °C (Figure 7). The decomposition of FeOHSO4 and Fe2(SO4)3 to Fe2O3 (reactions (4) and (5)) causes a theoretical mass loss of 27% which is in good agreement with the mass loss (~29%) obtained by the thermogravimetry in the 500–700 °C temperature range (Figure 1). The mechanism of the FeOHSO4 decomposition is a critical point. In detail, the Rietveld analysis in the present study, that starts from a natural sample, evidences the appearance of only mikasaite before the hematite formation. The intermediate Fe2O(SO4)2 [21,22,24] as well as the Fe12O3(SO4)15 [21,22] phases were not obtained in our experiment. Ventruti et al. [24], in particular, found that a small amount of synthetic FeOHSO4 decomposes to mikasaite whereas most of the compound transforms to Fe2O(SO4)2 which is, however, stable in a very narrow temperature range (75 °C, from about 475 to 550 °C).
In conclusion, our multimethodic study shows a different behavior of melanterite from Fornovolasco with respect to what observed for synthetic samples. Indeed, the studied melanterite does not dehydrate into FeSO4 and the intermediate FeOHSO4 product transforms into mikasaite and hematite without the formation of Fe2O(SO4)2. The peculiar dehydration pathway of the studied sample may depend on the adopted experimental conditions (equilibration time at a fixed temperature, counting time, heating rate, etc.) [13,14] as well as on crystal chemical features, such as the low Mg for Fe2+ substitution [3]. Finally, the investigation of the dehydration reaction of hydrated iron sulfates may help to develop geochemical models predicting the environmental impact of these secondary minerals and their decomposition products.

Author Contributions

M.L., G.V. and D.M. conceived and coordinated the study; G.V. and M.L. contributed to XRPD and TG/DTG/DTA analyses; G.D.V. and F.R. contributed with FTIR work; E.S. revised the paper. The first draft was written with the contribution of all authors. All authors have read and agreed to the published version of the manuscript.

Funding

This research received no external funding.

Acknowledgments

C. Biagioni is acknowledged for his assistance during sulfate sampling. The XRPD laboratory at the Earth and Geoenvironmental Sciences Department of the University of Bari “Aldo Moro”, was funded by Potenziamento Strutturale PONa3_00369 “Laboratorio per lo Sviluppo Integrato delle Scienze e delle Tecnologie dei Materiali Avanzati e per dispositivi innovativi (SISTEMA)”. G.D.V. was supported by the Grant to Department of Science, Roma Tre University (MIUR-Italy Dipartimenti di Eccellenza, ARTICOLO 1, COMMI 314–337 LEGGE 232/2016). Three anonymous referees are acknowledged for their insightful reviews.

Conflicts of Interest

The authors declare no conflict of interest.

References

  1. Frau, F. The formation-dissolution-precipitation cycle of melanterite at the abandoned pyrite mine of Genna Luas in Sardinia, Italy: Environmental implications. Mineral. Mag. 2000, 64, 995–1006. [Google Scholar] [CrossRef]
  2. Jambor, J.L.; Nordstrom, D.K.; Alpers, C.N. Metal-sulfate salts from sulfide mineral oxidation. Rev. Mineral. Geochem. 2000, 40, 303–350. [Google Scholar] [CrossRef]
  3. Anderson, J.L.; Peterson, R.C. Determination of sulfate mineral phase equilibria as a function of relative humidity. Intermediate compositions in the (Mg,Fe,Zn)SO4–H2O system at 22 °C. Geol. Assoc. Can. Mineral. Assoc. Can. Program. Abstr. 2005, 30, 4. [Google Scholar]
  4. Buckby, T.; Black, S.; Coleman, M.L.; Hodson, M.E. Fe-sulphate-rich evaporative mineral precipitates from the Río Tinto, southwest Spain. Mineral. Mag. 2003, 67, 263–278. [Google Scholar] [CrossRef]
  5. Kanari, N.; Menad, N.; Ostrosi, E.; Shallari, S.; Diot, F.; Allain, E.; Yvon, J. Thermal behavior of hydrated iron sulfate in various atmospheres. Metals 2018, 8, 1084. [Google Scholar] [CrossRef] [Green Version]
  6. Lane, M.D.; Bishop, J.L.; Dyar, M.D.; King, P.L.; Parente, M.; Hyde, B.C. Mineralogy of the Paso Robles soils on Mars. Am. Mineral. 2008, 93, 728–739. [Google Scholar] [CrossRef]
  7. Baur, W.H. On the crystal chemistry of salt hydrates. III. The determination of the crystal structure of FeSO4·7H2O (melanterite). Acta Crystallogr. 1964, 17, 1167–1174. [Google Scholar] [CrossRef]
  8. Fronczek, F.R.; Collins, S.N.; Chan, J.Y. Refinement of ferrous sulfate heptahydrate (melanterite) with low-temperature CCD data. Acta Crystallogr. 2001, 57, i26–i27. [Google Scholar] [CrossRef]
  9. Peterson, R.C. The relationship between Cu content and distortion in the atomic structure of melanterite from the Richmond mine, Iron Mountain, California. Can. Mineral. 2003, 41, 937–949. [Google Scholar] [CrossRef] [Green Version]
  10. Anderson, J.L.; Peterson, R.C.; Swainson, I.P. The atomic structure and hydrogen bonding of deuterated melanterite, FeSO4·7D2O. Can. Mineral. 2007, 45, 457–469. [Google Scholar] [CrossRef]
  11. Mauro, D.; Biagioni, C.; Pasero, M. Crystal-chemistry of sulfates from Apuan Alps (Tuscany, Italy). I. Crystal structure and hydrogen bond system of melanterite, Fe(H2O)6(SO4)·H2O. Period. Mineral. 2018, 87, 85–92. [Google Scholar]
  12. Mitchell, A.G. The preparation and characterization of ferrous sulphate hydrates. J. Pharm. Pharmacol. 1984, 36, 506–510. [Google Scholar] [CrossRef]
  13. Cardoso Maia, L.; Rocha dos Santos, G.; Vinícius Alves Gurgel, L.; de Freitas Carvalho, C. Iron recovery from the coarse fraction of basic oxygen furnace sludge. Part I: Optimization of acid leaching conditions. Environ. Sci. Pollut. R. 2020, 27, 40135–40147. [Google Scholar] [CrossRef] [PubMed]
  14. Kanari, N.; Filippova, I.; Diot, F.; Mochón, J.; Ruiz-Bustinza, I.; Allaina, E.; Yvon, J. Utilization of a waste from titanium oxide industry for the synthesis of sodium ferrate by gas-solid reactions. Thermochim. Acta 2014, 575, 219–225. [Google Scholar] [CrossRef]
  15. Wang, T.; Debelak, K.A.; Roth, J.A. Dehydration of iron(II) sulfate heptahydrate. Thermochim. Acta 2007, 462, 89–93. [Google Scholar] [CrossRef]
  16. Prasad, T.P. Kinetics of thermal decomposition of intermediate hydrates ad basic salts of iron (II) sulphate heptahydrate. J. Therm. Anal. 1986, 31, 553–557. [Google Scholar] [CrossRef]
  17. Swamy, M.S.R.; Prasad, T.P. Kinetic of the thermal decomposition of iron (II) sulphate heptahydrate in air. Thermochim. Acta 1983, 62, 229–236. [Google Scholar] [CrossRef]
  18. Swamy, M.S.R.; Prasad, T.P.; Sant, B.R. Thermal analysis of ferrous sulphate heptahydrate in air II. The oxidation-decomposition path. J. Therm. Anal. 1979, 16, 471–478. [Google Scholar] [CrossRef]
  19. Gallagher, P.K.; Johnson, D.W.; Schrey, F. Thermal Decomposition of Iron(II) Sulfates. J. Am. Ceram. Soc. 1970, 53, 666–670. [Google Scholar] [CrossRef]
  20. Duval, C. Inorganic Thermogravimetric Analysis, 2nd ed.; Elsevier: New York, NY, USA, 1963; p. 722. [Google Scholar]
  21. Kamel, A.H.; Sawires, Z.; Khalifa, H.; Saleh, S.A.; Abdallah, A.M. The thermal decomposition of ferrous sulphate heptahydrate I. Dehydration and oxidation. J. Appl. Chem. Biotechnol. 1972, 22, 591–598. [Google Scholar] [CrossRef]
  22. Safiullin, N.S.; Gitis, E.B.; Panesenko, N.M. Termochemical transformations of FeSO4·7H2O during heating in oxidizing and inert media. Russ. J. Inorg. Chem. 1968, 13, 1493. [Google Scholar]
  23. Mahapatra, S.; Prasad, T.P. Solid-state hydrolysis of iron (II) sulphate heptahydrate. Thermichim. Acta 1988, 128, 305–309. [Google Scholar] [CrossRef]
  24. Ventruti, G.; Della Ventura, G.; Gomez, M.A.; Captani, G.; Sbroscia, M.; Sodo, A. High-temperature study of basic ferric sulfate, FeOHSO4. Phys. Chem. Miner. 2020, 47, 43. [Google Scholar] [CrossRef]
  25. Jani, M.; Hodson, M.E.; Chippindale, A.M. In-situ Powder X-Ray Diffraction study on hydrous ferrous sulfate minerals. Adv. Mat. Res. 2015, 1087, 257–261. [Google Scholar] [CrossRef]
  26. Ventruti, G.; Della Ventura, G.; Lacalamita, M.; Sbroscia, M.; Sodo, A.; Plaisier, J.R.; Cinque, G.; Schingaro, E. Crystal-chemistry and vibrational spectroscopy of ferrinatrite, Na3[Fe(SO4)3]·3H2O, and its high-temperature decomposition. Phys. Chem. Miner. 2019, 46, 119–131. [Google Scholar] [CrossRef]
  27. Biagioni, C.; Bonaccorsi, E.; Orlandi, P. Volaschioite, Fe3+4(SO4)O2(OH)6·2H2O, a new mineral species from Fornovolasco, Apuan Alps, Tuscany, Italy. Can. Mineral. 2011, 49, 605–614. [Google Scholar] [CrossRef]
  28. D’Orazio, M.; Mauro, D.; Valerio, M.; Biagioni, C. Secondary Sulfates from the Monte Arsiccio Mine (Apuan Alps, Tuscany, Italy): Trace-element budget and role in the formation of acid mine drainage. Minerals 2021, 11, 206. [Google Scholar] [CrossRef]
  29. Larson, A.C.; Von Dreele, R.B. General Structure Analysis System (GSAS); Los Alamos Reports: Los Alamos, New Mexico, 2000; pp. 86–748. [Google Scholar]
  30. Földvári, M. Handbook of Thermogravimetric System of Minerals and its Use in Geological Practice; Geological Institute of Hungary: Budapest, Hungary, 2011; p. 180. [Google Scholar]
  31. Baur, W.H. Zur kristallchemie der salzhydrate. Die kristallstrukturen von MgSO4·4H2O (leonhardtit) und FeSO4·4H2O (rozenit). Acta Crystallogr. 1962, 15, 815–826. [Google Scholar] [CrossRef]
  32. Wildner, M.; Giester, G. The crystal structures of kieserite-type compounds. I. Crystal structures of Me(II)SO4·H2O (Me = Mn, Fe, Co, Ni, Zn). Neues Jb Miner. Monat. 1991, 7, 296–306. [Google Scholar]
  33. Miura, H.; Niida, K.; Hirama, T. Mikasaite, (Fe3+, Al)2(SO4)3, a new ferric sulphate mineral from Mikasa city, Hokkaido, Japan. Mineral. Mag. 1994, 58, 649–653. [Google Scholar] [CrossRef]
  34. Blake, R.L.; Hessevick, R.E.; Zoltai, T.; Finger, L.W. Refinement of the hematite structure. Am. Mineral. 1966, 51, 123–129. [Google Scholar]
  35. Brown, A.J.; Bish, D.L.; Bishop, J.L. Dehydration of ferrous sulfates monitored by XRD-Implications for CHEMIN. Lun. Planet. Sci. 2008, 39, 1008. [Google Scholar]
  36. Libowitzky, E. Correlation of O–H stretching frequencies and O–H…O hydrogen bond lengths in minerals. Monatsh. Chem. 1999, 130, 1047–1059. [Google Scholar] [CrossRef]
  37. Reddy, S.N.; Rao, P.S.; Ravikumar, R.V.; Reddy, B.J.; Reddy, Y.P. Spectral investigations on melanterite mineral from France. Spec. Acta 2001, 57, 1283–1287. [Google Scholar] [CrossRef]
  38. Frost, R.L.; Wills, R.-A.; Martens, W.; Weier, M.; Reddy, B.J. NIR spectroscopy of selected iron(II) and iron(III) sulphates. Spec. Acta 2005, 62, 42–50. [Google Scholar] [CrossRef] [PubMed] [Green Version]
  39. Adler, H.H.; Kerr, P.F. Variations in infrared spectra, molecular symmetry and site symmetry of sulfate minerals. Am. Mineral. 1965, 50, 132–147. [Google Scholar]
  40. Ross, S.D. Sulphates and other oxy-anions of group VI. In The Infrared Spectra of Minerals; Farmer, V.C., Ed.; Mineralogical Society of Great Britain and Ireland: Middlesex, UK, 1974; p. 4. [Google Scholar]
  41. Gomez, M.A.; Ventruti, G.; Celikin, M.; Assaaoudi, H.; Putz, H.; Becze, L.; Leea, K.E.; Demopoulos, G.P. The nature of synthetic basic ferric arsenate sulfate (Fe(AsO4)1–x(SO4)x(OH)x) and basic ferric sulfate (FeOHSO4): Their crystallographic, molecular and electronic structure with applications in the environment and energy. RSC Adv. 2013, 37, 16840–16849. [Google Scholar] [CrossRef]
  42. Ventruti, G.; Della Ventura, G.; Bellatreccia, F.; Lacalamita, M.; Schingaro, E. Hydrogen bond system and vibrational spectroscopy of the iron sulfate fibroferrite, FeOH(SO4)·5H2O. Eur. J. Mineral. 2016, 5, 943–952. [Google Scholar] [CrossRef]
  43. Pannetier, G.; Bregeault, J.M.; Djega-Maria-Dassou, G. Thermal dissociation of ferrous sulfate heptahydrate. C.R. Acad. Sci. USA 1964, 258, 2832–2835. [Google Scholar]
  44. Ventruti, G.; Scordari, F.; Schingaro, E.; Gualtieri, A.F.; Meneghini, C. The order-disorder character of FeOHSO4 obtained from the thermal decomposition of metahohmannite, Fe23+(H2O)4[O(SO4)2]. Am. Mineral. 2005, 90, 679–686. [Google Scholar] [CrossRef]
  45. Ventruti, G.; Della Ventura, G.; Scordari, F.; Susta, U.; Gualtieri, A.F. In situ high-temperature XRD and FTIR investigation of hohmannite, a water-rich Fe-sulfate, and its decomposition products. J. Therm. Anal. Calorim. 2015, 119, 1793–1802. [Google Scholar] [CrossRef]
  46. Ventruti, G.; Della Ventura, G.D.; Corriero, N.; Malferrari, D.; Gualtieri, A.F.; Susta, U.; Lacalamita, M.; Schingaro, E. In situ high-temperature X-ray diffraction and spectroscopic study of fibroferrite, FeOH(SO4)·5H2O. Phys. Chem. Miner. 2016, 43, 587–595. [Google Scholar] [CrossRef]
  47. Zhang, M.; Salje, E.K.H.; Carpenter, M.A.; Wang, J.Y.; Groat, L.A.; Lager, G.A.; Wang, L.; Beran, A.; Bismayer, U. Temperature dependence of IR absorption of hydrous/hydroxyl species in minerals and synthetic materials. Am. Mineral. 2007, 92, 1502–1517. [Google Scholar] [CrossRef]
  48. Radica, F.; Della Ventura, G.; Bellatreccia, F.; Cestelli Guidi, M. HT-FTIR micro-spectroscopy of cordierite: The CO2 absorbance from in situ and quenched experiments. Phys. Chem. Miner. 2015, 43, 69–81. [Google Scholar] [CrossRef]
Figure 1. Thermogravimetry (TG) (blue), differential thermal analysis (DTA) (black) and derivative thermogravimetric (DTG) (red) curves of melanterite from Fornovolasco. Endothermic peaks in the DTA curve are centered at 70, 100, 260, 500–560 and 660 °C.
Minerals 11 00392 g001
Figure 2. Selected XRPD patterns of the melanterite under study, showing the evolution of the diffraction data in the temperature range 25–200 °C (a) and 200–775 °C (b), in the 10–50° 2θ. Labels: M = melanterite, FeSO4·7H2O; R = rozenite, FeSO4·4H2O; S = szomolnokite, FeSO4·H2O; Fe = FeOHSO4; Mi = mikasaite, Fe2(SO4)3; H = hematite, Fe2O3.
Minerals 11 00392 g002
Figure 3. Rietveld refinement of the room temperature (RT) pattern of the studied melanterite sample in the 10–80° 2θ range. Cross symbols indicate the observed data; solid line indicates the calculated pattern; the solid line at the bottom indicates the residuals; melanterite (red) and rozenite (black) peak positions.
Minerals 11 00392 g003
Figure 4. Room temperature FTIR spectra for the studied melanterite, (a) in the H2O stretching and bending region and (b) at the low-frequency mode region.
Minerals 11 00392 g004
Figure 5. In situ HT-FTIR spectra collected on (a,b) KBr pellet and (c) pressed melanterite powders. (a) OH/H2O stretching region, (b) OH/H2O bending region, (c) H2O (ν3 + ν1) combination mode. Temperature, °C, is indicated on each pattern.
Minerals 11 00392 g005
Figure 6. Evolution of relative absorbance (%) as a function of T of the principal H2O stretching peak (in red) and the H2O (ν3 + ν1) combination mode in the HT-FTIR spectra (in black).
Minerals 11 00392 g006
Figure 7. Evolution of the phase amounts refined from the Rietveld method based on the powder X-ray diffraction patterns in the temperature range RT-600 °C.
Minerals 11 00392 g007
Figure 8. The crystal structure of (a) melanterite, and (b) rozenite. H-bonds to sulfate tetrahedra are indicated by dashed black lines. Symbols: green polyhedra = M1-Fe site, blue polyhedra = M2-Fe site, dark green = Fe site, yellow polyhedra = S site. Red, and black circles represent O, and H sites, respectively. The transition from melanterite to rozenite with the temperature is accomplished by replacing the H2O groups with oxygens belonging to different SO4 groups (see text).
Minerals 11 00392 g008
Figure 9. (a) The crystal structure of szomolnokite. (b) Unit cell representation of structure of Figure 4. Cell edges are indicated by light black lines. Symbols: green polyhedra = Fe site, yellow polyhedra = S site. Red, and black circles represent O, and H sites, respectively.
Minerals 11 00392 g009
Table 1. Data (°C) from the DTA curve of the literature and studied FeSO4·7H2O compound.
ProcessSwamy et al. [18]Swamy and Prasad [17]Mitchell [12]Földvári [30]Kanari et al. [5]Cardoso Maia et al. [13]This Study
(a)(b) (c)(d)(e)
Formation of FeSO4·6H2O or FeSO4·5H2O 52–65
Formation of FeSO4·4H2O 90 53–69 7080985470
Formation of FeSO4·H2O190150130–200106–120100–2008613315994100
Decomposition of FeSO4·H2O to FeSO4 330–370305–345300227250283253
Oxidation of FeSO4·H2O to FeOHSO4370 260
Decomposition of FeOHSO4 to Fe2O(SO4)2550; 590 eso580
Formation of Fe2(SO4)3 400–600 (f) 560
Decomposition of Fe2O(SO4)2 to Fe2O3810700680–800 617
Decomposition of FeSO4 to Fe2O3 680–830653687716
Decomposition of FeOHSO4 and Fe2(SO4)3 to Fe2O3 660
Note: (a) Crucible and multiplate (b) sample holders. Measurements in air; (c), (d), (e) heating rate of 2.5, 5 and 10 °C/min, respectively, under flow of nitrogen; (f) the compound is the product of oxidation and dehydration of the remaining FeSO4·H2O (i.e., 12FeSO4·H2O + 3O2 → 12FeOHSO4 + 6H2O; 12FeOHSO4 → 4 Fe2(SO4)3 + 2Fe2O3 + 6H2O). These reactions are associated to 12FeSO4 + 3O2 → 4Fe2(SO4)3 + 2Fe2O3 reaction.
Publisher’s Note: MDPI stays neutral with regard to jurisdictional claims in published maps and institutional affiliations.

