Abstract
Micro-Fourier transform infrared (micro-FTIR) spectroscopy was used to correlate the surface chemistry of low rank coal with hydrophobicity. Six square areas without mineral impurities on low rank coal surfaces were selected as testing areas. A specially-designed methodology was applied to conduct micro-FTIR measurements and contact angle tests on the same testing area. A series of semi-quantitative functional group ratios derived from micro-FTIR spectra were correlated with contact angles, and the determination coefficients of linear regression were calculated and compared in order to identify the structure of the functional group ratios. Finally, two semi-quantitative ratios composed of aliphatic carbon hydrogen, aromatic carbon hydrogen and two different types of carbonyl groups were proposed as indicators of low rank coal hydrophobicity. This work provided a rapid way to predict low rank coal hydrophobicity through its functional group composition and helped us understand the hydrophobicity heterogeneity of low rank coal from the perspective of its surface chemistry.
1. Introduction
Coal is heterogeneous at different levels. At the macroscopic level, coal heterogeneity is determined by lithotypes and mineral matter. Maceral composition, associated inorganic inclusions and porosity determine the heterogeneity at the microscopic level. At the molecular level, coal is described as a hydrocarbon skeleton containing different functional groups [1]. The heterogeneity of coal affects its hydrophobicity. Flotation relies mainly on the difference in hydrophobicity to separate materials. Hydrophobicity determines flotation subprocesses such as reagent adsorption and particle-bubble attachment. Therefore, it is essential to understand the effect of surface heterogeneity on coal hydrophobicity.
Many earlier studies have investigated the hydrophobicity/floatability of different coal macerals. Horsley and Smith [2] showed that vitrain (a vitrinite concentrate) was characterized with the highest hydrophobicity, followed by clarain (vitrinite + inertinite), durain (vitrinite + inertinite + mineral matter) and fusain (inertinite). Sun [3] calculated the floatability index and concluded that the hydrophobicity of coal macerals decreased in the order of clarain, vitrain, fusain and durain. Arnold and Aplan [4] measured the contact angles of different macerals identified by microscope, and obtained the following hydrophobicity order: liptinite > vitrinite > fusinite. At this stage, the hydrophobicity variation was observed mainly between different lithotypes or macerals, which could be complicated and time-consuming [5].
With the development of modern characterization techniques, the surface heterogeneity was studied in a more accurate and microscopic way. The time-of-flight secondary ion mass spectrometry technique (ToF-SIMS) was used to correlate the contact angle of mineral particles with their surface chemistry [6,7,8,9]. The contact angle value of chalcopyrite particles was given by using the information from three secondary ions: oxygen, sulfur and a thiol collector fragment [7]. By calculating the contact angle of individual particles, this approach was capable of evaluating the heterogeneity and hydrophobicity variation within particle groups. The inverse gas chromatography (IGC) technique was also used to characterize mineral surfaces and correlate the surface energy with hydrophobicity [10,11,12]. With the surface energies determined at different coverages, an energy distribution could be obtained, and it can be used as a tool to characterize the heterogeneity of mineral surfaces. Colloidal probe atomic force microscopy (CP-AFM) combined with Raman spectroscopy were used to evaluate the floatability of individual minerals in a cross section ore specimen [13,14,15]. In this method, CP-AFM was used to determine the hydrophobic interactions correlated with flotation and Raman spectroscopy was used to identify the mineral phase at the same location. This co-localized AFM-Raman measurement could allow the establishment of correlation between surface chemistry and hydrophobicity. Similarly, a semiautomated microscopic image analysis technique has been used to measure the distribution of macerals and minerals on coal’s surface, where a contact angle test was also conducted [16]. This methodology correlated coal heterogeneity determined by discrete petrographic components with hydrophobicity measured through contact angle tests. With the use of this method, the contact angles of maceral groups such as inertinite and liptinite can be estimated, and then the hydrophobicity of composite coal particles or the flotation performance could be further predicted. It should be noted that an assumption which lies in this methodology was that the chemical composition was homogeneous within the same maceral group. However, micro-Fourier Transform Infrared Spectroscopy (micro-FTIR) mapping results of macerals showed that there was variation in the abundance of aliphatic CH groups within optically uniform vitrinite [17,18]. In order to further understand the effect of this chemical heterogeneity on coal hydrophobicity, there was a need to establish the link between coal functional groups and hydrophobicity.
Micro-FTIR has been proven to be a useful tool to characterize the abundance of functional groups on coal’s surface [19,20,21,22]. In a recent study [23], a micro-FTIR test and contact angle measurements were conducted on the same surface area of the coal sample and functional group semi-quantitative ratios were correlated with contact angles. The results showed rank depending correlations between coal surface chemistry and hydrophobicity. In another study by Wang et al. [24], a similar methodology was used to analyze coal surface chemistry change after the addition of collectors and their effect on hydrophobicity.
In this study, low rank coal was characterized by the micro-FTIR technique and contact angle measurement on the same area. Low rank coal contains higher oxygen content than medium volatile coal. Therefore, oxygen containing functional groups were analyzed specifically in this work. A series of functional group semi-quantitative ratios was proposed and correlated with coal hydrophobicity as measured by contact angle. The determination coefficient of each linear relationship was calculated and compared to obtain the semi-quantitative ratios best correlated with contact angles. Finally, a correlation was established between contact angle and low rank coal surface chemistry. It could be used to estimate low rank coal contact angle, and it helps us to understand the effect of chemical heterogeneity on low rank coal hydrophobicity quantitatively. In addition, the relationship between low rank coal chemistry and hydrophobicity can also make the selection and design of the flotation reagent more targeted and intelligent.
2. Materials and Methods
2.1. Sample Preparation
The coal sample used in this study was lignite obtained from the Shengli coal field, Inner Mongolia, Xilinhot, China. The proximate analysis results of the coal sample are shown in Table 1. According to the analysis, the coal sample belongs to low rank coal. Four lump coal samples without gangue were selected. Then, according to the preparation method described in the previous literature [25], the lump samples were successively polished by sandpaper with 240, 600, 800, and 1200 grit and further polished by a diamond suspension of 6 μm and 1 μm, and finally by a silica colloid of 0.05 μm. After each polishing, the coal surface was washed with water to remove the polishing medium and the falling off coal particles. The purpose of this polishing treatment was to provide a smooth and flat coal surface for the subsequent contact angle measurement and micro FTIR tests. Finally, combined with microscope observation, six 5 mm × 5 mm square areas without mineral impurities on the coal surface were selected and marked as the testing areas for contact angle measurement and micro FTIR characterization.

Table 1.
Proximate analysis results of the coal sample.
2.2. Contact Angle Measurement
Contact angle measurement was conducted by using a JC2000D analyzer (Minsks, Xi’an, China). The captive bubble method was adopted in this study for the advantages of being less affected by surface defects [25] and constant humidity [5].
The sample was placed in a cube tank filled with neutral deionized water. A bubble with a volume of approximately 6 μL was formed at the tip of a U-shaped syringe needle and then was placed on a predetermined testing area on the sample surface. The bubble shape cast onto the charge coupled device (CCD) camera was digitized and analyzed by the software and then the contact angle was obtained. The measurement was repeated three times for each testing area.
2.3. Micro-FTIR Measurement
The micro-FTIR test was performed on the area where the contact angle was conducted and the block samples were dried each time before the tests. The experimental pattern of Liu et al. [23] and Wang et al. [24] was followed. As illustrated in Figure 1, the bubble was attached on the 5 mm × 5 mm square area for the contact angle test and the micro-FTIR tests were conducted on the 16 points evenly distributed within the same area. The size of testing points for micro-FTIR was 100 μm × 100 μm.

Figure 1.
Schematic of micro-FTIR test points on the polished coal surface.
The micro-FTIR platform was composed of a Nicolet iS50 infrared spectrometer and a Nicolet Continuμm microscope (Thermo Scientific, Waltham, USA). The microscope was equipped with two liquid nitrogen cooled mercury cadmium telluride (MCT) detectors. The OMNIC Version 6.1 software was used to collect and process the spectra. The measurement was performed under micro-FTIR reflection mode. Each test point was scanned for 200 times at a resolution of 4 cm−1 and a gold plate was used as background. A dry air purging system was also used to reduce the influence of water molecules. The obtained spectra were subjected to baseline correction, smoothing and Kramers–Krönig transformation, which corrected the band shift and was needed in the reflectance micro FTIR analysis for coal samples [22]. The OMNIC program Version 6.1 was also used for peak area integration, second derivative spectrum analysis and peak resolving. Peak assignments of coal spectrum followed the methods in the literature [26].
3. Results and Discussion
3.1. Contact Angle Results
The contact angle results of six marked areas on low rank coal surfaces are presented in Table 2. These six testing areas were distributed on the surfaces of different samples. The standard deviation of the results varied from 0.9° to 2.1°, which remained consistent with the previous captive bubble measurements [23,24]. The contact angle values showed a wide spread from 42.6°to 54.5°, reflecting the hydrophobic heterogeneity existing on low rank coal surfaces. This heterogeneity should mainly be attributed to the variation in chemical properties on coal surfaces, considering the previous polishing treatment and the avoidance of mineral grains in the selection of testing areas.
Table 2.
Contact angle and micro-FTIR results of different testing areas.
3.2. Micro-FTIR Measurement Results
A typical FTIR spectrum of a series of testing points is presented in Figure 2. The absorbance of hydroxyl groups was intense due to the high content of oxygen-containing functional groups existing in high volatile coal samples. On the contrary, the aromatic CH stretching and out-of-plane deformation signals were not significant owing to the low metamorphic level of the coal sample. The absorbance peak band at 1500 cm−1–1800 cm−1 was resolved by the OMNIC software in order to obtain the relative content of functional groups such as carbonyl and aromatic C=C (Figure 3). In particular, carbonyl groups were resolved into different types: the carbonyl absorbance peak at ~1700 cm−1 (C=O_1700) showed the existence of carboxyl, aldehyde and ketone structures, while the peak at ~1650 cm−1 represented the highly conjugated carbonyl groups in the coal structure. The relative content of a certain functional group was calculated by the corresponding absorbance peak area.
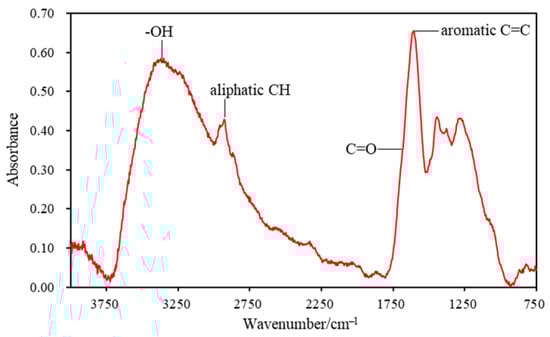
Figure 2.
A typical micro-FTIR spectrum of the test points.
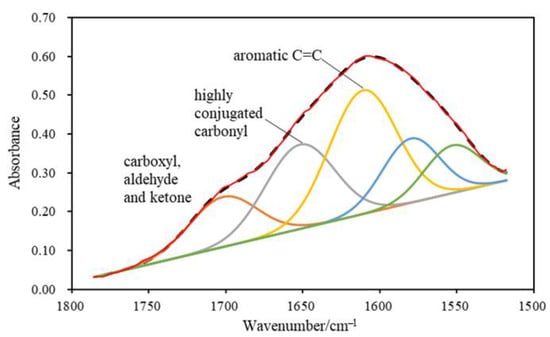
Figure 3.
Schematic showing the peak resolving of the ~1500–1800 cm−1 FTIR region. Solid envelopes represent measurements, whereas the dashed envelope indicates a summary curve.
As described above, there were 16 micro-FTIR testing points on each area where contact angle measurement was conducted. The spectra were quantitatively analyzed and the results were averaged on each testing area. The relative content of a series of functional groups on six testing areas is presented in Table 2. Although peak areas of functional groups had shown the variety, semi-quantitative ratios which combined different functional groups were more comprehensive indices to reveal the chemical heterogeneity over different testing areas.
3.3. Semi-Quantitative Ratios
Previous studies have used many semi-quantitative ratios to characterize coal macerals [17,27,28,29]. In this research, a series of new ratios was calculated to study their effects on hydrophobicity, considering the high oxygen content and low metamorphic degree features of low rank coal. Meanwhile, the determination coefficients of different correlations were calculated and compared to evaluate the performance of the semi-quantitative ratios.
3.3.1. The Effect of Aliphaticity on Hydrophobicity
In this part, aliphatic CH stretching over different forms of C=O stretching was selected as a semi-quantitative ratio for aliphaticity. Figure 4 shows the correlations between contact angles and aliphatic semi-quantitative ratios including PACHal/PAC=O (Figure 4A), PACHal/PAC=O_1700 (Figure 4B), and PACHal/PAC=O_1650 (Figure 4C). With the increase in the ratios, contact angles in all three correlations showed a rising trend. It suggested that the hydrophobicity of the low rank coal sample was enhanced with the increase in aliphaticity, which was consistent with the previous results [23,24]. The determination coefficient R2 could be calculated when the linear regression analysis was made between the contact angle and the semi-quantitative ratio. Although the data points in these correlations all seemed to be scattered, the determination coefficients of these correlations were still different. The R2 values followed the order: PACHal/PAC=O_1700 (R2 = 0.7997) > PACHal/PAC=O (R2 = 0.7843) > PACHal/PAC=O_1650 (R2 = 0.7500). The ratio containing C=O_1650 as the hydrophilic factor obtained the lowest R2 value, whereas the ratio with C=O_1700 achieved the best fitting performance. In the aliphatic carbon hydrogen skeleton of low rank coal, carbonyl mainly existed in the forms of carboxyl, aldehyde and ketone instead of highly conjugated structures such as quinone. This could explain the R2 results above. As a result, PACHal/PAC=O_1700 was selected as the aliphalicity index.
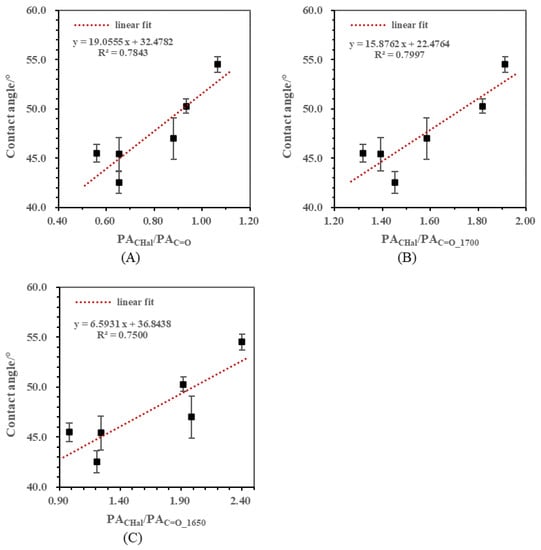
Figure 4.
Correlations between contact angles and aliphatic semi-quantitative ratios. (A) Correlation between contact angle and PACHal/PAC=O; (B) Correlation between contact angle and PACHal/PAC=O_1700; (C) Correlation between contact angle and PACHal/PAC=O_1650.
3.3.2. The Effect of Aromaticity on Hydrophobicity
Aromaticity was another important aspect which needed to be discussed. CHar/CHal was widely used as the aromaticity proxy for coal in many studies [17,23,24,29,30]. However, the aromatic CH stretching vibration signal of these low rank samples was too weak to be calculated in the quantitative analysis. In this part, the ratios of aromatic C=C ring stretching to C=O stretching were used to indicate aromaticity. The correlations between contact angles and aromatic semi-quantitative ratios including PAC=Car/PAC=O, PAC=Car/PAC=O_1700, and PAC=Car/PAC=O_1650 are presented in Figure 5A–C. The positive linear relationships observed in these figures suggested that the hydrophobicity of low rank coal samples was promoted by the increase in aromaticity. Specifically, the determination coefficients R2 of these correlations were listed as follows: PAC=Car/PAC=O (R2 = 0.8461) > PAC=Car/PAC=O_1650 (R2 = 0.8061) > PAC=Car/PAC=O_1700 (R2 = 0.6043). It was not surprising that the R2 value of correlation between PAC=Car/PAC=O_1700 and the contact angle was the lowest while the R2 of PAC=Car/PAC=O achieved the highest value. In the aromatic structure of low rank coal, carbonyl groups existed not only in the form of carboxyl, aldehyde and ketone, but also in the form of highly conjugated quinone. PAC=Car/PAC=O was selected as the FTIR index for aromaticity.
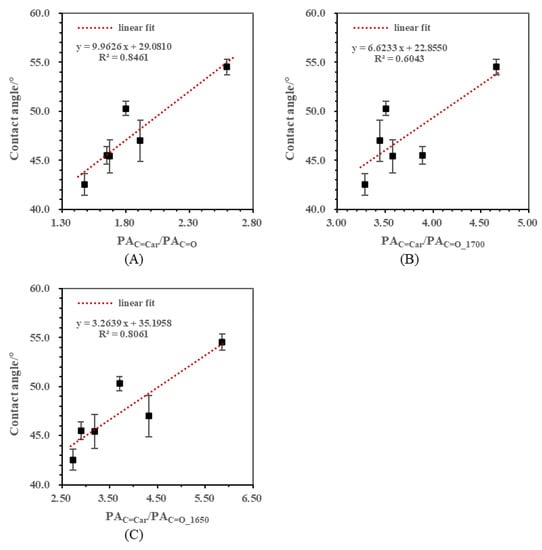
Figure 5.
Correlations between contact angles and aromatic semi-quantitative ratios. (A) Correlation between contact angle and PAC=Car/PAC=O; (B) Correlation between contact angle and PAC=Car/PAC=O_1700; (C) Correlation between contact angle and PAC=Car/PAC=O_1650.
Additionally, the effects of aliphaticity and aromaticity were compared since the increase in both of them led to the hydrophobicity improvement. From Figure 4A and Figure 5A, it can be found that the change rate of contact angle caused by PACHal/PAC=O was approximately two times that caused by PAC=Car/PAC=O. However, it cannot be concluded directly that the influence of aliphatic CH was twice as much as that of the aromatic C=C because peak area was determined not only by the content of the functional group, but also by the corresponding adsorption coefficient, according to Lambert–Beer’s law [31].
3.3.3. The Effect of Carbonyl Groups on Hydrophobicity
The ratio of carbonyl groups to hydrocarbon groups was proposed in order to assess the effect of C=O on hydrophobicity. The correlations between contact angles and carbonyl semi-quantitative ratios including PAC=O_1700/(PACHal + PAC=Car) and PAC=O_1650/(PACHal + PAC=Car) are presented in Figure 6A,B. The contact angles in both correlations showed a declining trend as C=O content increased. In particular, the change rate of contact angle caused by C=O_1700 was almost three times that caused by C=O_1650. This suggested that the effect of these two types of carbonyl groups was different. Specifically, C=O_1700 contributed more to hydrophilicity than C=O_1650. This might be explained by the following mechanism. On the surface of low rank coal, water molecules adsorb on oxygen-containing functional groups such as carbonyl through hydrogen bonds, and this makes the surface hydrophilic. For carbonyl groups highly conjugated with aromatic rings in low rank coal, the electron cloud density of the oxygen atom is reduced because of the conjugation effect [31], thus the hydrogen bond which forms in this structure becomes weaker than that in the aliphatic carboxyl structure. Wang et al. [32] compared the energy of hydrogen bonds formed by different oxygenated functional groups in low rank coal and water molecules by using a quantum chemical calculation, and obtained the order of -COOH > -OH > -C-O > -C=O, which was consistent with the above analysis.
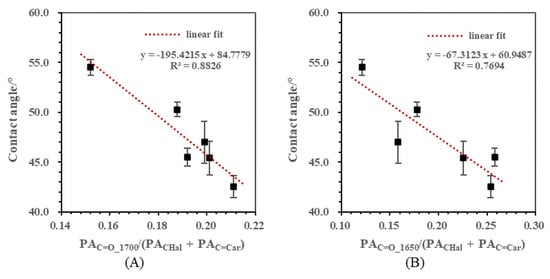
Figure 6.
Correlations between contact angles and carbonyl semi-quantitative ratios. (A) Correlation between contact angle and PAC=O_1700/(PACHal + PAC=Car); (B) Correlation between contact angle and PAC=O_1650/(PACHal + PAC=Car).
The hydroxyl group was also a very important oxygenated functional group in low rank coal. However, it was not discussed in this study because the calculation of hydroxyl content from the FTIR spectrum was complex and an extra chemical test was supposed to be carried out [26].
3.3.4. The Effect of Comprehensive Semi-Quantitative Ratios on the Hydrophobicity of Low Rank Coal
Since aliphaticity and aromaticity were both promoting factors of hydrophobicity for the low rank coal sample, it was necessary to use a few comprehensive semi-quantitative ratios to correlate with hydrophobicity.
The correlation between the contact angle and (PACHal + PAC=Car)/PAC=O is shown in Figure 7A. In this ratio, aliphatic CH and aromatic C=C acted as the hydrophobic part and C=O served as the hydrophilic part. The determination coefficient R2 reached 0.8900 when CHal, C=Car and C=O were combined together.
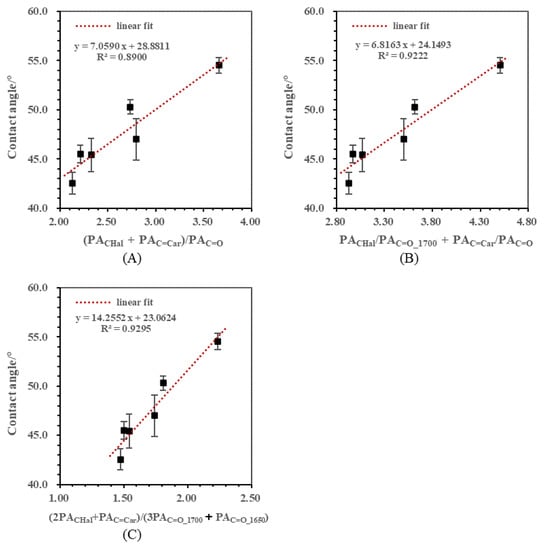
Figure 7.
Correlations between contact angles and comprehensive semi-quantitative ratios. (A) Correlation between contact angle and (PACHal + PAC=Car)/PAC=O; (B) Correlation between contact angle and PACHal/PAC=O_1700+ PAC=Car/PAC=O; (C) Correlation between contact angle and (2PACHal + PAC=Car)/(3PAC=O_1700 + PAC=O_1650).
Figure 7B shows the correlation between the contact angle and PACHal/PAC=O_1700 + PAC=Car/PAC=O. This ratio consisted of the aliphatic part PACHal/PAC=O_1700 and the aromatic part PAC=Car/PAC=O, and the carbonyl group in each part corresponded with its structure, as discussed above. The R2 of PACHal/PAC=O_1700 with the contact angle was the highest among PACHal/PAC=O, PACHal/PAC=O_1700 and PACHal/PAC=O_1650, and the R2 of PAC=Car/PAC=O was higher than that of PAC=Car/PAC=O_1700 and PAC=Car/PAC=O_1650. Here, the determination coefficient R2 achieved 0.9222 after these two previous ratios were combined together. It suggested that the regression effect can be further improved if the functional groups were organized by considering low rank coal’s structure characteristics.
Figure 7C presents the correlation between the contact angle and (2PACHal + PAC=Car)/(3PAC=O_1700 + PAC=O_1650), and the R2 value reached 0.9295. Comparing with (PACHal + PAC=Car)/PAC=O, the expression here introduced a few parameters before the peak area of the functional group. For carbonyl groups, the parameter showed that the influence of C=O_1700 on hydrophobicity was higher than that of C=O_1650. A better fitting effect was achieved by adding functional group influence coefficients into the previous expression, indicating that the influence degrees should be considered when FTIR functional group ratios were used to correlate with hydrophobicity.
4. Conclusions
Functional group semi-quantitative ratios derived from micro-FTIR characterization and contact angles obtained from the same testing area were correlated, and the determination coefficients of the linear relationships were compared. Semi-quantitative ratios PACHal/PAC=O_1700 + PAC=Car/PAC=O and (2PACHal + PAC=Car)/(3PAC=O_1700 + PAC=O_1650) were purposed as indicators to estimate the hydrophobicity of low rank coal. These FTIR indices established the link between low rank surface chemistry and hydrophobicity. Moreover, the chemical heterogeneity across the low rank coal surface can also be evaluated by these ratios. The future research work aims to find the proper separation reagent for the low rank coal sample with a known surface chemical composition. Since the correlation between hydrophobicity and surface chemistry has been created in the first step, the selection or design of the separation reagent will be targeted. With suitable reagents, low rank fine coal resources can then be used in a cleaner and more effective way.
Further challenges which need to be addressed include the selection of testing areas on a polished coal surface. Inorganic matter existing on the testing area will influence the contact angle value. Although large mineral grains could be avoided by microscopic observation, inherent ash embedded in macerals is inevitable during the establishment of the correlation between functional groups and contact angles. In addition, hydroxyl, as an important type of oxygen containing functional group, was not taken into account due to the limitation of FTIR spectra analysis. This work should still be considered a work in progress and the future study will use this methodology to collect more data.
Author Contributions
Formal analysis, W.W.; Funding acquisition, L.L.; Investigation, W.W.; Methodology, W.W. and L.L.; Resources, Y.P.; Supervision, M.H.; Validation, W.W.; Writing–original draft, W.W.; Writing–review & editing, L.L., Y.P. and M.H. All authors have read and agreed to the published version of the manuscript.
Funding
This research was funded by Priority Academic Program Development of Jiangsu Higher Education Institutions, grant number 20180115.
Data Availability Statement
The data presented in this study is openly available.
Conflicts of Interest
The authors declare no conflict of interest.
References
- Laskowski, J. Coal flotation and fine coal utilization. In Developments in Mineral Processing; Elsevier: Amsterdam, The Netherlands, 2001; Volume 14, pp. 31–94. [Google Scholar] [CrossRef]
- Horsley, R.M.; Smith, H.G. Principles of coal flotation. Fuel 1951, 30, 54–63. [Google Scholar]
- Sun, S.C. Hypothesis for different flotabilities of coals, carbons and hydrocarbon minerals. Trans. AIME 1954, 199, 67–75. [Google Scholar]
- Arnold, B.J.; Aplan, F.F. The hydrophobicity of coal macerals. Fuel 1989, 68, 651–658. [Google Scholar] [CrossRef]
- Gosiewska, A.; Drelich, J.; Laskowski, J.S.; Pawlik, M. Mineral Matter Distribution on Coal Surface and Its Effect on Coal Wettability. J. Colloid Interface Sci. 2002, 247, 107–116. [Google Scholar] [CrossRef] [PubMed]
- Priest, C.; Stevens, N.; Sedev, R.; Skinner, W.; Ralston, J. Inferring wettability of heterogeneous surfaces by ToF-SIMS. J. Colloid Interface Sci. 2008, 320, 563–568. [Google Scholar] [CrossRef] [PubMed]
- Abreu, S.B.E.; Brien, C.; Skinner, W. ToF-SIMS as a New Method to Determine the Contact Angle of Mineral Surfaces. Langmuir 2010, 26, 8122–8130. [Google Scholar] [CrossRef]
- Abreu, S.B.E.; Skinner, W. ToF-SIMS-derived hydrophobicity in DTP flotation of chalcopyrite: Contact angle distributions in flotation streams. Int. J. Miner. Process. 2011, 98, 35–41. [Google Scholar] [CrossRef]
- Abreu, S.B.E.; Skinner, W. Determination of Contact Angles, Silane Coverage, and Hydrophobicity Heterogeneity of Methylated Quartz Surfaces Using ToF-SIMS. Langmuir 2012, 28, 7360–7367. [Google Scholar] [CrossRef]
- Ali, S.S.M.; Heng, J.Y.Y.; Nikolaev, A.A.; Waters, K.E. Introducing inverse gas chromatography as a method of determining the surface heterogeneity of minerals for flotation. Powder Technol. 2013, 249, 373–377. [Google Scholar] [CrossRef]
- Mohammadi-Jam, S.; Burnett, D.J.; Waters, K.E. Surface energy of minerals—Applications to flotation. Miner. Eng. 2014, 66–68, 112–118. [Google Scholar] [CrossRef]
- Rudolph, M.; Hartmann, R. Specific surface free energy component distributions and flotabilities of mineral microparticles in flotation-An inverse gas chromatography study. Colloids Surf. A Physicochem. Eng. Asp. 2017, 513, 380–388. [Google Scholar] [CrossRef]
- Rudolph, M.; Peuker, U.A. Hydrophobicity of Minerals Determined by Atomic Force Microscopy—A Tool for Flotation Research. Chem. Ing. Tech. 2014, 86, 865–873. [Google Scholar] [CrossRef]
- Rudolph, M.; Peuker, U.A. Mapping hydrophobicity combining AFM and Raman spectroscopy. Miner. Eng. 2014, 66–68, 181–190. [Google Scholar] [CrossRef]
- Babel, B.; Rudolph, M. Characterizing mineral wettabilities on a microscale by colloidal probe atomic force microscopy. Miner. Eng. 2018, 121, 212–219. [Google Scholar] [CrossRef]
- Ofori, P.; Firth, B.; O’Brien, G.; Mcnally, C.; Nguyen, A.V. Assessing the Hydrophobicity of Petrographically Heterogeneous Coal Surfaces. Energy Fuels 2010, 24, 5966–5971. [Google Scholar] [CrossRef]
- Chen, Y.; Mastalerz, M.; Schimmelmann, A. Characterization of chemical functional groups in macerals across different coal ranks via micro-FTIR spectroscopy. Int. J. Coal Geol. 2012, 104, 22–33. [Google Scholar] [CrossRef]
- Holuszko, M.E.; Mastalerz, M.D. Coal Macerals Chemistry and Its Implications for Selectivity in Coal Floatability. Int. J. Coal Prep. Util. 2015, 35, 99–110. [Google Scholar] [CrossRef]
- Mastalerz, M.; Bustin, R.M. Electron microprobe and micro-FTIR analyses applied to maceral chemistry. Int. J. Coal Geol. 1993, 24, 333–345. [Google Scholar] [CrossRef]
- Mastalerz, M.; Bustin, R.M. Variation in maceral chemistry within and between coals of varying rank: An electron microprobe and micro-Fourier transform infra-red investigation. J. Microsc. 1993, 171, 153–166. [Google Scholar] [CrossRef]
- Mastalerz, M.; Bustin, R.M. Application of reflectance micro-Fourier transform infrared spectrometry in studying coal macerals: Comparison with other Fourier transform infrared techniques. Fuel 1995, 74, 536–542. [Google Scholar] [CrossRef]
- Mastalerz, M.; Bustin, R.M. Application of reflectance micro-Fourier transform infrared analysis to the study of coal macerals: An example from the late jurassic to early cretaceous coals of the Mist Mountain Formation, British Columbia, Canada. Int. J. Coal Geol. 1996, 32, 55–67. [Google Scholar] [CrossRef]
- Liu, J.; Holuszko, M.; Mastalerz, M. Applications of micro-FTIR technique in studying hydrophobicity of coal. Int. J. Coal Geol. 2017, 178, 74–83. [Google Scholar] [CrossRef]
- Wang, W.; Kumar, A.; Holuszko, M.E.; Mastalerz, M.D. Micro-FTIR analysis to study the change in surface chemistry after addition of collectors and their effect on coal hydrophobicity. Physicochem. Probl. Miner. Process. 2018, 54, 1292–1302. [Google Scholar] [CrossRef]
- Drelich, J.; Laskowskl, J.S.; Pawuk, M. Improved Sample Preparation and Surface Analysis Methodology for Contact Angle Measurements on Coal (Heterogeneous) Surfaces. Coal Prep. 2000, 21, 247–275. [Google Scholar] [CrossRef]
- Painter, P.; Starsinic, M.; Coleman, M. Determination of functional groups in coal by Fourier transform interferometry. In Fourier Transform Infrared Spectroscopy; Ferraro, J., Basile, L., Eds.; Academic Press: Orlando, FL, USA, 1985; Volume 4, pp. 169–241. [Google Scholar] [CrossRef]
- Ganz, H.; Kalkreuth, W. Application of infrared spectroscopy to the classification of kerogentypes and the evaluation of source rock and oil shale potentials. Fuel 1987, 66, 708–711. [Google Scholar] [CrossRef]
- Kister, J.; Guiliano, M.; Largeau, C.; Derenne, S.; Casadevall, E. Characterization of chemical structure, degree of maturation and oil potential of Torbanites (type I kerogens) by quantitative FT-i.r. spectroscopy. Fuel 1990, 69, 1356–1361. [Google Scholar] [CrossRef]
- Iglesias, M.J.; Jimenez, A.; Laggoun-Defarge, F.; Suarez-Ruiz, I. FTIR Study of Pure Vitrains and Associated Coals. Energy Fuels 1995, 9, 243. [Google Scholar] [CrossRef]
- Walker, R.; Mastalerz, M. Functional group and individual maceral chemistry of high volatile bituminous coals from southern Indiana: Controls on coking. Int. J. Coal Geol. 2004, 58, 181–191. [Google Scholar] [CrossRef]
- Weng, S. Fourier Transform Infrared Spectroscopy Analysis, 2nd ed.; Chemical Industry Press: Beijing, China, 2010; pp. 1–41. [Google Scholar]
- Wang, J.; He, Y.; Peng, Z.; Ling, X.; Wang, S. Estimation of hydrophilicity of coals by using the quantum chemistry calculation. Int. J. Miner. Process. 2017, 167, 9–15. [Google Scholar] [CrossRef]
Publisher’s Note: MDPI stays neutral with regard to jurisdictional claims in published maps and institutional affiliations. |
© 2021 by the authors. Licensee MDPI, Basel, Switzerland. This article is an open access article distributed under the terms and conditions of the Creative Commons Attribution (CC BY) license (http://creativecommons.org/licenses/by/4.0/).