Article

Metallogenic Characteristics and Formation Mechanism of Naomugeng Clay-Type Lithium Deposit in Central Inner Mongolia, China

1
Ocean College, Zhejiang University, Zhoushan 316000, China
2
School of Earth Sciences, Zhejiang University, Hangzhou 310000, China
3
Geological Survey Institute of Inner Mongolia, Hohhot 010000, China
*
Author to whom correspondence should be addressed.
Minerals 2021, 11(3), 238; https://doi.org/10.3390/min11030238
Submission received: 6 January 2021 / Revised: 7 February 2021 / Accepted: 11 February 2021 / Published: 25 February 2021
(This article belongs to the Special Issue Ore Mineralogy and Geochemistry of Rare Metal Deposits)

Abstract

:
A newly discovered Naomugeng lithium mineralization area is located to the east of the Central Asian Orogenic Belt (CAOB). The lithium is hosted in the volcanic rocks of the Manketou’ebo Formation. The altered volcanic rocks mainly consist of quartz, orthoclase, chlorite, montmorillonite, calcite, and dolomite. Here, we present integrated studies of petrography, mineralogy, and geochemistry of the altered volcanic rocks (with an average Li2O content of 0.43 wt.%) collected from the drilling hole and trail trench to systematically investigate the occurrence of lithium, the mineralizing processes, and the metallogenic mechanisms. The secondary minerals of the core samples are montmorillonite, chlorite calcite, and dolomite, while the secondary minerals from the earth surface ones are montmorillonite, chlorite, and calcite. The mass change calculation and isocon analysis show that the rocks received MnO, P2O5, Co, Ni, Cu, and Li and lost Na2O, K2O, MgO, rare earth elements (REE), and Rb in the alteration process. However, other elements such as Fe, V, Co, and Ca of the core samples increased while those of the earth surface ones did not change by much. Hence, there are two zones of alterations, i.e., the montmorillonization-chloritization zone and the montmorillonization-chloritization-carbonatization zone. Lithium enrichment occurs in the zone where montmorillonization and chloritization occur. The lithium is probably enriched in altered minerals such as montmorillonite and chlorite in the forms of interlayered or adsorbed ions. The slightly negative to positive Eu anomalies of the rocks can be explained by the metasomatism of hydrothermal fluid that enriched Eu. We suggest that the Naomugeng deposit is a clay-type lithium deposit and formed under a caldera setting. The meteoric and hydrothermal fluids leach the lithium from the volcanic materials and then alter the host rocks (e.g., tuff or sediments) in the caldera basin, which forms the type of lithium clay deposit. This study analyzed the migration behavior of elements in the Naomugeng lithium deposit during a hydrothermal process, which shows that the mass balance calculation has good application in reflecting the mineralization process of clay type deposit. This study also reveals the great exploration potential of the Naomugeng deposit and has important significance for further prospecting of clay-type lithium deposits in central Inner Mongolia.

1. Introduction

Lithium is becoming more and more important in modern industries, and prospecting lithium resources is urgent [1,2]. There are two main deposit types: continental brine deposits and pegmatite deposits. Lithium-rich brine deposits account for about three-fourths of the world’s lithium production. Famous deposits are Salar de Uyuni in Bolivia and Salar de Atacama in Chile [3]. Lithium-bearing pegmatites are generally considered the second largest resource due to their high grades and global distribution. Typical cases are the Greenbushes deposit in Australia, the Kings Mountain deposit in the USA, and the Jiajika lithium–beryllium deposit in SW China. Lithium usually occurs in lepidolite and spodumene [4,5,6].
Clay-type lithium deposits are a minority in mining, but they are attracting more interest due to their great potential. Clay-type lithium resources are mainly distributed in Mexico, Serbia, and the United States [1]. There are also some clay-type lithium deposits reported in China [7,8]. In many clay-type lithium deposits, the lithium is leached from rhyolitic lavas and volcanic ash by meteoric and hydrothermal fluids and then preserved in clay (e.g., hectorite) structurally, and they are developed in ash-rich sediments in basins adjacent to the source rocks [1,2]. The amount of clay-type lithium deposits found in the world is far less than that of other types of lithium deposits, which limits the study of clay-type deposits and, in turn, limits people's understanding and prospecting of this type of deposits. Naomugeng lithium deposit is the first clay-type lithium deposit prospected in Inner Mongolia and even northern China. It not only has economic value but also important scientific significance. We can study it to improve the formation theory of clay-type lithium deposits, to summarize the prospecting indictors of clay-type lithium deposits in this area, and to provide important guidance for the exploration of more clay-type lithium deposits.
The 1:200,000 scale regional geochemical exploration mapping found an anomaly named “AS59” in the northern part of the Naomugeng area, Inner Mongolia, China. The abnormal elements are Ti, Li, P, Hg, As, Sb, and Fe. The 1:10,000 scale soil densification survey was carried out to delineate three lithium anomaly zones with NW-SE trending, which were related to Late Jurassic felsic volcanic rocks [9]. The lithium anomaly in this area is stable and strong, which has great potential for exploration. However, there are few previous research in this area. The samples of this study are from the Manketou’ebo Formation in the Naomugeng lithium deposit area. In this study, detailed petrographic description and mineral and geochemical studies are carried out, and then, the occurrence of lithium, the metallogenic processes, the formation mechanism, and the potential of the deposit are discussed. We also use geochemical methods and mass balance calculation to study the ore-forming process of the deposit and summarize the prospecting indictors of the clay-type lithium deposit in this area.

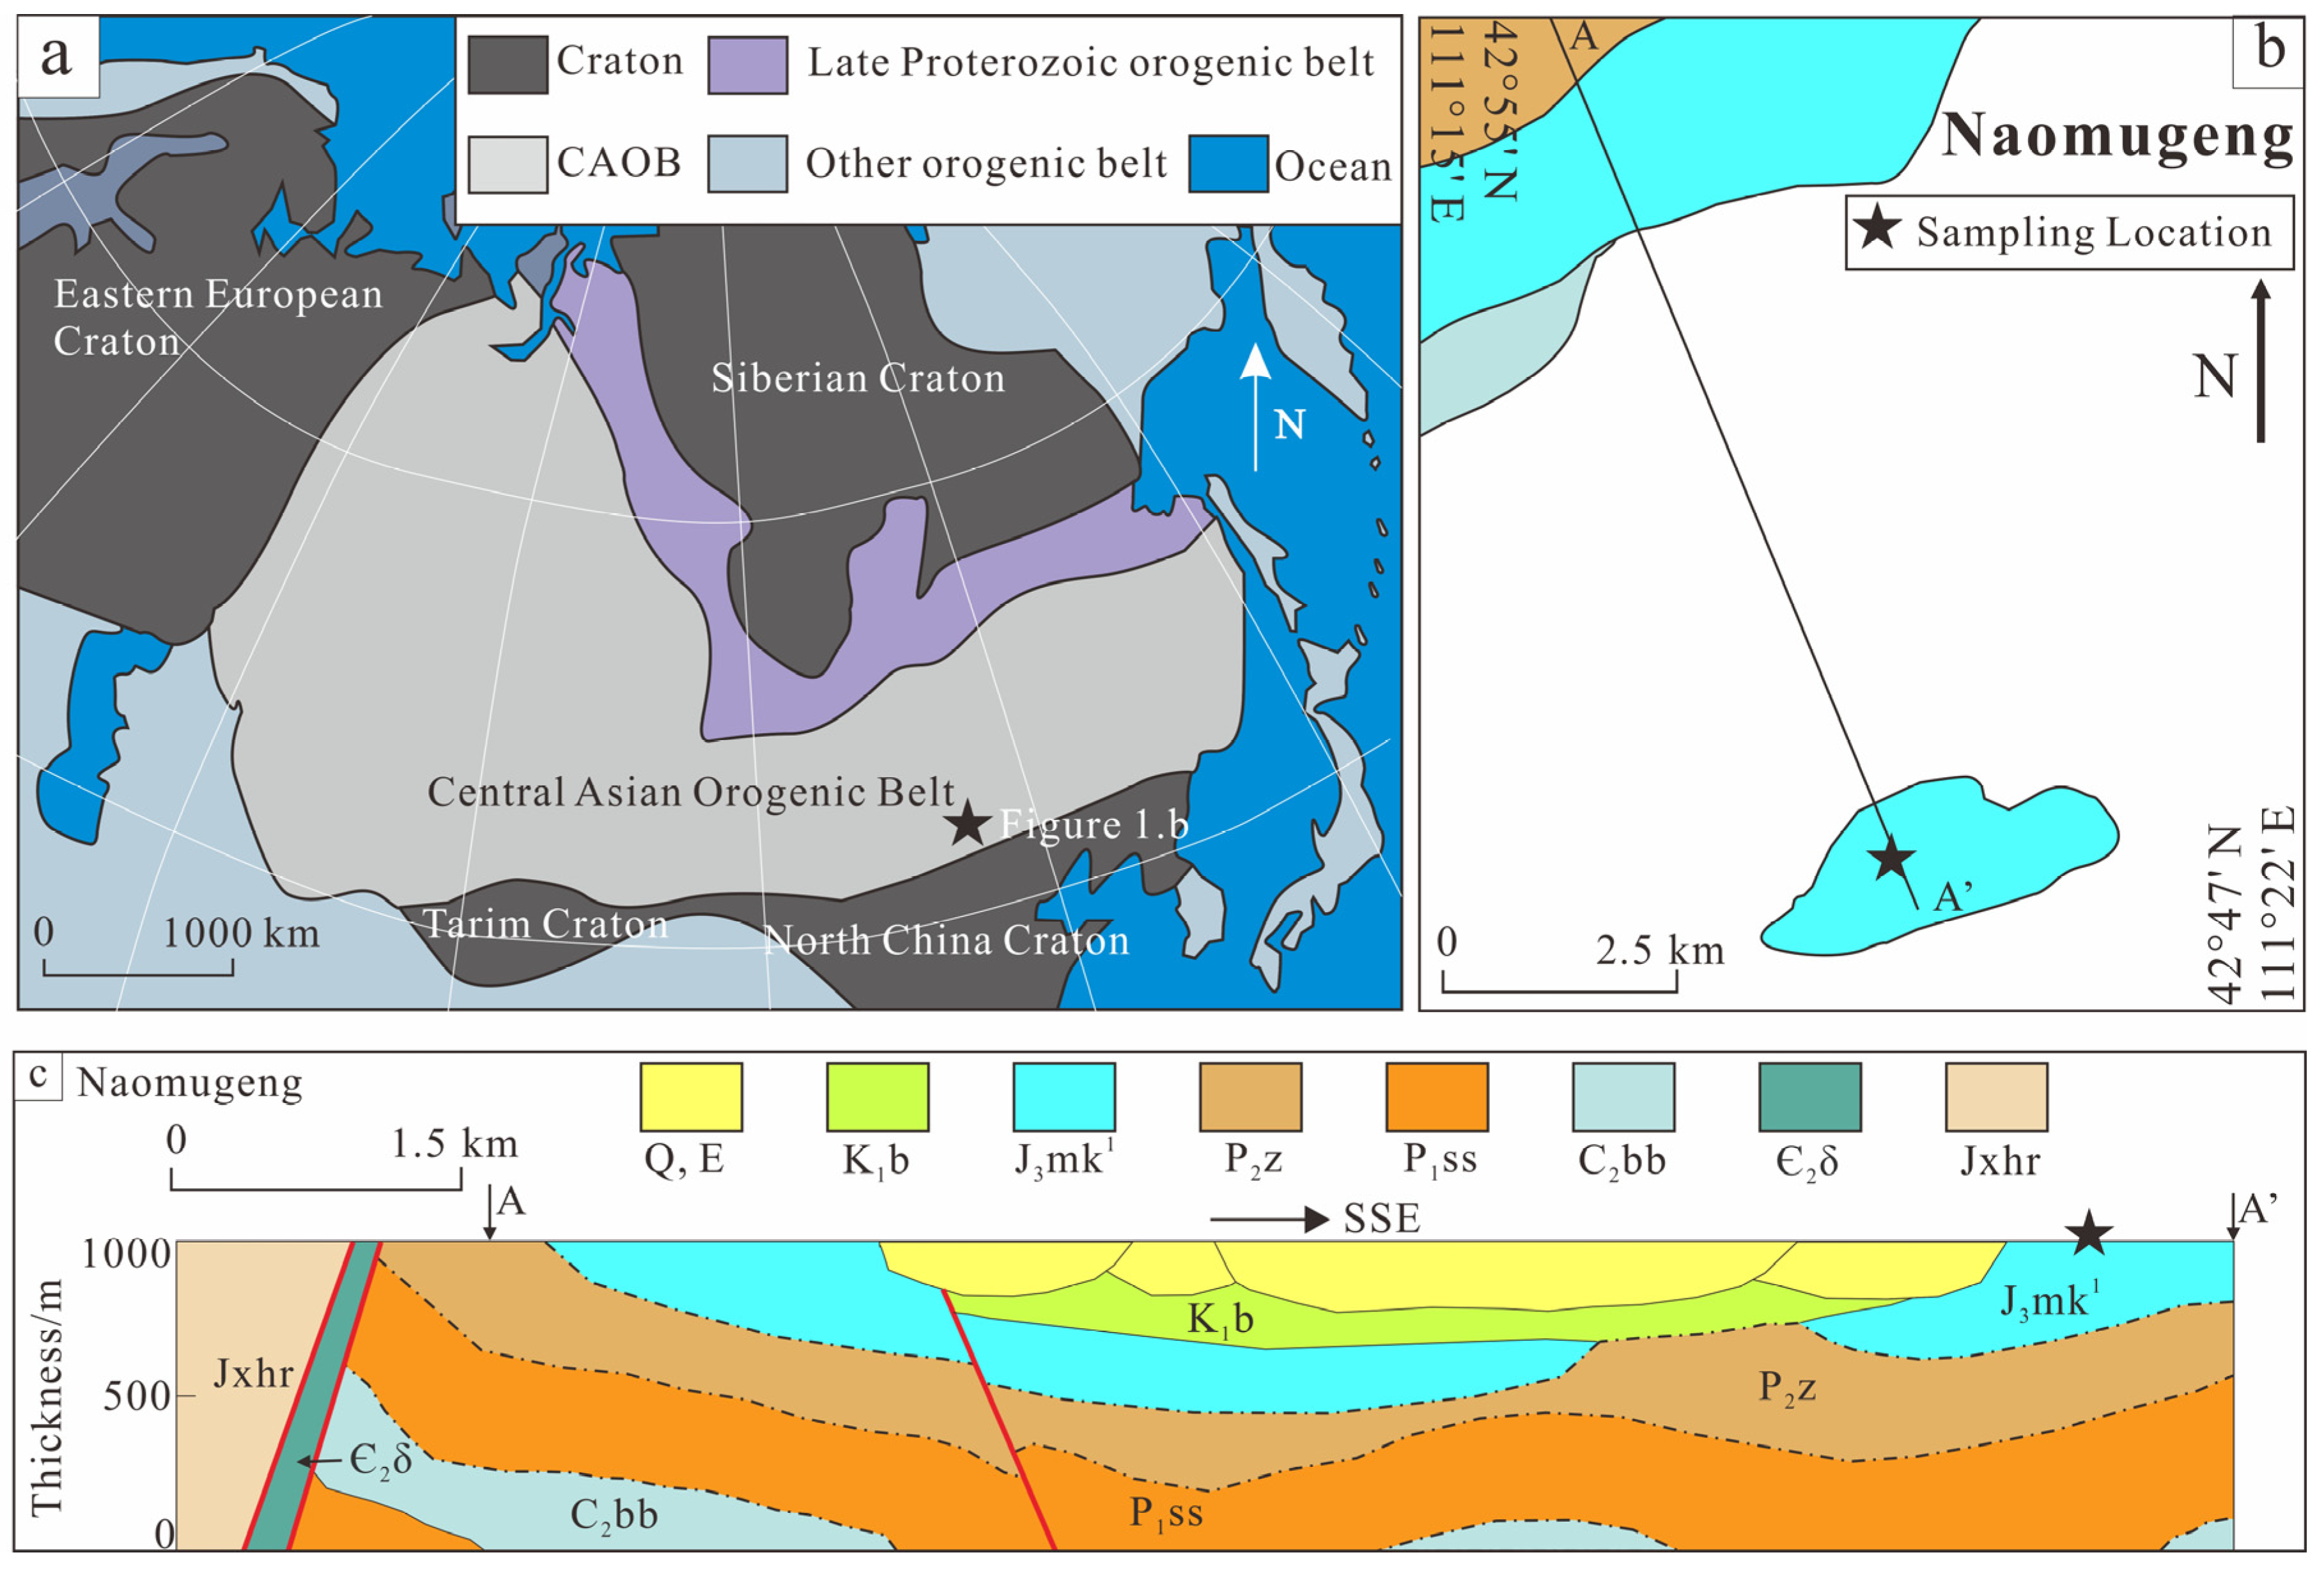
2. Regional Geological Setting and Ore Geology in Studied Area

The Naomugeng area is situated in Siziwangqi area, Inner Mongolia (Figure 1), and tectonically located to the east of the Central Asian Orogenic Belt (CAOB). The CAOB is one of the most important rare-metal (such as lithium, beryllium, niobium, and tantalum) metallogenic belts in the world [10,11]. Previous studies show that the Mongolia-Okhotsk Ocean was formed in the Early Paleozoic. The Mongolia-Okhotsk Ocean was subducted locally at the end of the Late Paleozoic. The scissor closure from the west to east began in the Late Triassic. Most scholars proposed that the closure of the Mongolia-Okhotsk Ocean was during the Middle-Late Jurassic [12,13,14]. Rhyolite of the Manketou’ebo Formation belongs to A-type rhyolite, which was formed in a post-orogenic extensional environment. It is a product of post-orogenic A-type granitic magmatism, which may be closely related to the lithospheric extension after the Mongolia-Okhotsk Ocean closure [15,16,17,18].
The structures of the Naomugeng area showed faults with mainly NNE and NE trends. The outcrops of the strata in this area are the Permian Zhesi Formation, Jurassic Manketou’ebo Formation, and Cretaceous Baiyinhua Formation (Figure 1). The Manketou’ebo Formation is mainly rhyolitic crystal tuff, tuff, and ignimbrite. Intrusive rocks are rarely distributed in the area, e.g., granitic porphyry and diorite sporadically occurred in the northern part of the mining area. From the 1:200,000 scale geochemical exploration, the large anomaly contrasts of Li, Hg, Ti, P, and As are 9.90, 2.63, 1.38, 1.24, and 1.16, respectively (the background values of soil samples in the whole Naomugeng area are from China Geological Survey). In the 1:10,000 scale soil geochemical survey, there are three SE-NW direction Li anomaly belts with an area of about 1.5 km2. The south anomaly belt is about 2000 m in length and 200−500 m in width. It is the strongest and largest Li anomaly in this area. The middle anomaly belt distributes in a string of beads with a length of 1500 m and a width of 100−500 m. The north anomaly belt is about 1000 m in length and 100−200 m in width. The anomaly center is obvious, and the belts have distribution characteristics of the inner, middle, and outer zones. According to field exploration and drilling, four lithium mineralized bodies and three lithium orebodies are delineated [9].

3. Methodology

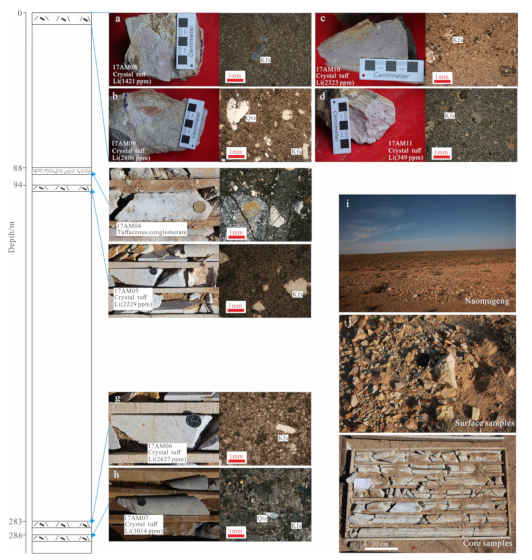
3.1. Sampling and Analytic Methods

All the samples were collected from the Manketou’ebo Formation in the Naomugeng area of Siziwangqi County. The samples were altered felsic volcanic rocks. The main alteration types were chloritization and montmorillonization. Four of them were from the drilling core ZK-04, and the others were from the trial trench. The samples from the trial trench were pink in color, while the core samples were gray. Detailed information is presented in Table 1 and Figure 1 and Figure 2. We carried out scanning electron microscopy (SEM) of the minerals, and X-ray diffraction (XRD), X-ray fluorescence (XRF), and inductively coupled plasma mass spectrometry (ICP-MS) of the rocks in order to obtain the compositions of the rocks and the structures and episodes of the minerals.
Seven samples were powdered in agate mortars in order to minimize potential contamination of transition metals. Major and trace elements were analyzed at the Second Institute of Oceanography, Ministry of Natural Resources of China (Beijing, China), and at the Department of Earth and Planetary Sciences, Harvard University of the USA (Cambridge, MA, USA), respectively. The major element concentrations were determined by XRF (model: PANalytical AxiosMAX from Holland), following the analytical procedures reported in Li, et al. [20]. The trace elements, including rare earth elements (REE), were determined by an ICP-MS (Thermo X-series from America). The samples (50 mg) were processed using the method described in Bézos, et al. [21]. 72Ge, 115In, 169Tm, and 209Bi were employed for internal standard normalization and the international standard rocks of BHVO-2, BCR-2, AGV-1, DNC-1, and JB-2, and the in-house standard Mid-Atlantic Ridge basalt (MAR) was used for the calibration curves. The in-house standard K1919 was also analyzed and used for drift correction. Trace element data obtained by ICP-MS were accurate to within ±5% via tests of blank samples and external standards. The analytical precision was better than 1% for major elements and better than 5% for trace elements.
XRD diffraction analysis of the samples on a Rigaku D/MAX 2550 X-Ray Diffractometer was carried out at Ocean College, Zhejiang University, Zhoushan, Zhejiang, China. The sample was powdered and sieved to 200 mesh. A X-ray powder diffractometer (PANalytical X’Pert3 Powder from Holland) was used under the following conditions: Cu-Ka radiation source, acceleration voltage of 40 kV, and tube current of 40 mA [22]. The 2θ ranged from 5° to 70° with a step of 0.02°/min at 25 °C. The data were processed by the software Jade (version 6.5, Materials Data Incorporated, Livermore, CA, USA).

3.2. Mass Balance Calculations

Previous studies showed that geochemical data are not only spatial but compositional. Element migration occurs in a lot of geological environments, including metasomatic alteration, tectonic deformation, and surface weathering [23,24,25,26,27,28,29]. A reference frame for quantitatively determining changes in mass and volume is required. Grant [30] proposed the isocon method, which has been widely applied to geological processes. The equation for composition relations of species i in metasomatic alteration is written as follows:
C i A   =   M O M A   ×   C i O + Δ C i ,
We rewrite it as follows:
Δ C i   =   M A M O   ×   C i A     C i O   =   x C i A     C i O ,
where M O and M A are equivalent masses before and after alteration, C i A is the concentration of element i in the altered rock, C i O is the concentration of element i in the “original” rock, Δ C i is the change in concentration of element i, Δ C i / C i O is the migration ratio of the element i, C i A and C i O are relative values, and M A and M O are absolute values.
In the traditional isocon method, variable x ( x = M A / M O ) indicates the mass change ratio during the alteration. This value is a reference frame independent of element i and can be used for quantitatively compositional comparisons among different samples. When an element remains immobile ( Δ C i = 0 ) during alteration, it can be used to determine x in the process defining the isocon, which is a straight line through the origin [28]. In many cases of actual isocon analysis, certain elements such as Al, Ti, Zr, and REE are recognized as immobile elements and can be adopted based on a priori knowledge and their geochemical characteristics [23,24,28,31,32]. However, there is no convincing evidence to select these frequently used elements as immobile elements occasionally, especially since there is no a priori geochemical knowledge or petrological/mineralogical evidence. Kuwatani, et al. [33] proposed the sparse isocon method, which used multiple samples that originated from the same parental rock to determine the reference frame x . That method adopted total optimization of the mass transfer during alteration based on the evaluation criteria by adjusting each mass change ratio. In general, the mobility of each species differs markedly from that of others, and some species show immobile behavior for certain physical and chemical environmental conditions and processes. Such mathematical properties enable us to automatically identify immobile or almost-immobile elements. The synthetic data [33] and natural sample data [25] demonstrate the effectiveness of the method to calculate the reference frame x .

4. Results

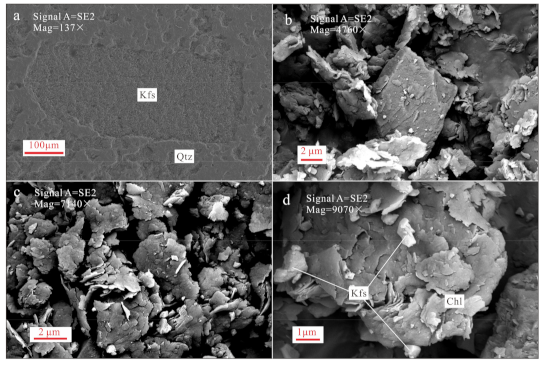
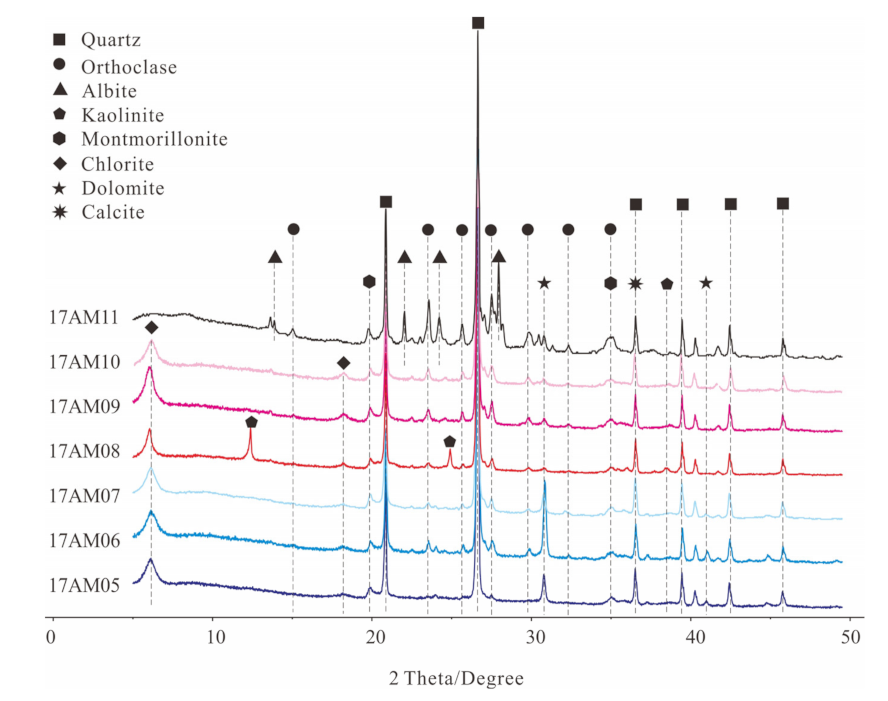
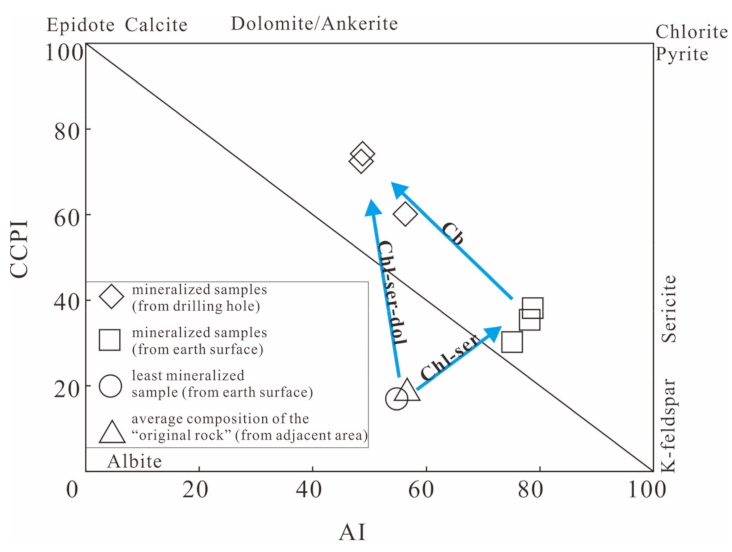
4.1. Petrography and Altered Minerals

The Naomugeng-altered felsic volcanic rocks from the drilling hole and earth surface are light grey and pink (Figure 2), respectively. They have tuffaceous texture and massive structure. There are angular crystal fragments that are mainly composed of K-feldspar and quartz. Some of the crystal fragments are melted and rounded. K-feldspar is 0.5–2 mm in size commonly, which is tabular pseudomorph and metasomatized by cryptocrystalline. The quartz is about 0.5 mm in size (Figure 2). The matrix is mainly composed of microcrystals of K-feldspar, quartz, and other altered minerals. The accessory minerals are zircon, titanite, and apatite. Combined with field work, the origin of the rocks of these samples are conferred as crystal tuff. There is metasomatism between the hydrothermal fluid and the tuff, which forms the clay minerals (Figure 3).
Because the individual grains in the matrix from thin sections are indistinguishable, XRD diffraction and SEM analyses are used to determine the species of altered clay minerals. From XRD diffraction patterns and SEM images (Figure 3 and Figure 4), there are quartz, K-feldspar, montmorillonite, calcite, chlorite, kaolinite, dolomite, and albite in the matrix. The least altered sample 17AM11 has a mineral assemblage of quartz + K-feldspar + montmorillonite + albite + calcite + dolomite. The altered samples are further subdivided into two types of assemblages by XRD, i.e., the earth surface ones and the core ones. Samples from the earth surface have an assemblage of quartz + K-feldspar + calcite + montmorillonite + chlorite + dolomite (minor). Additionally, the sample 17AM08 (from the earth surface) contains kaolinite, which is polymorphic with montmorillonite. The core samples have quartz + K-feldspar + calcite + montmorillonite + chlorite + dolomite assemblages. However, the dolomite components of the earth surface samples are far less than those of the core samples.

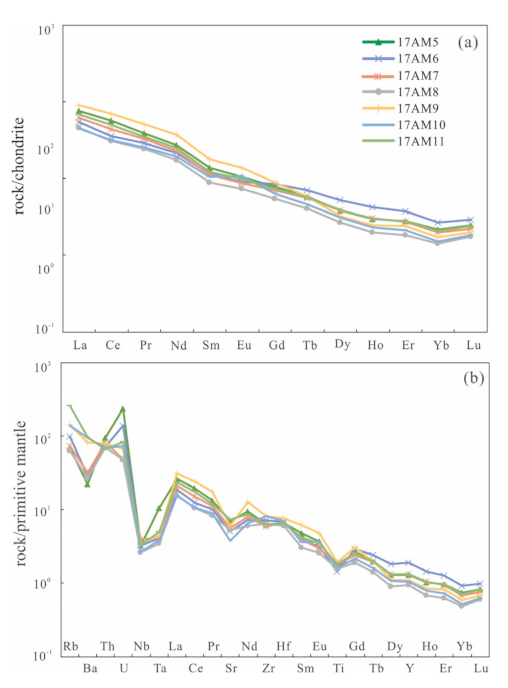
4.2. Whole-Rock Geochemistry

The major and trace element compositions of the samples are listed in Table 2. The contents of SiO2, TiO2, Al2O3, Na2O, K2O, and P2O5 are 70.7–79.6 wt.%, 0.20–0.27 wt.%, 11.7–15.6 wt.%, 0.07–0.19 wt.%, 1.13–2.89 wt.%, and 0.06–0.10 wt.%, respectively. The contents of Fe2O3T, MnO, MgO, CaO, and Li from the drilling core samples are 1.13–2.09 wt.%, 0.65–1.63 wt.%, 0.03–0.06 wt.%, 1.29–3.59 wt.%, and 2229–3014 ppm, while those from the earth surface samples are 0.40–0.75 wt.%, 0.20–0.27 wt.%, below 0.01 wt.%, 0.24–0.61 wt.%, and 1421–2806 ppm. Specially, the least mineralized sample 17AM11 has the highest Na2O and K2O (2.33 wt.% and 4.29 wt.%) and lowest lithium (349 ppm) and loss on ignition (LOI) contents. The other elements are similar to the surface samples. The primitive mantle normalized spider diagram shows right dipping patterns with positive anomalies of Rb and U and negative anomalies of Ba, Sr, Nb, and Ti (Figure 5). The total REE amounts are 51.1–101.1 ppm, with an average of 72.3 ppm, and the LREE/HREE (light rare earth elements to heavy rare earth elements) are 2.9–7.7. There are slightly negative to positive Eu anomalies (δEuN of 0.91–1.32) in the REE patterns.

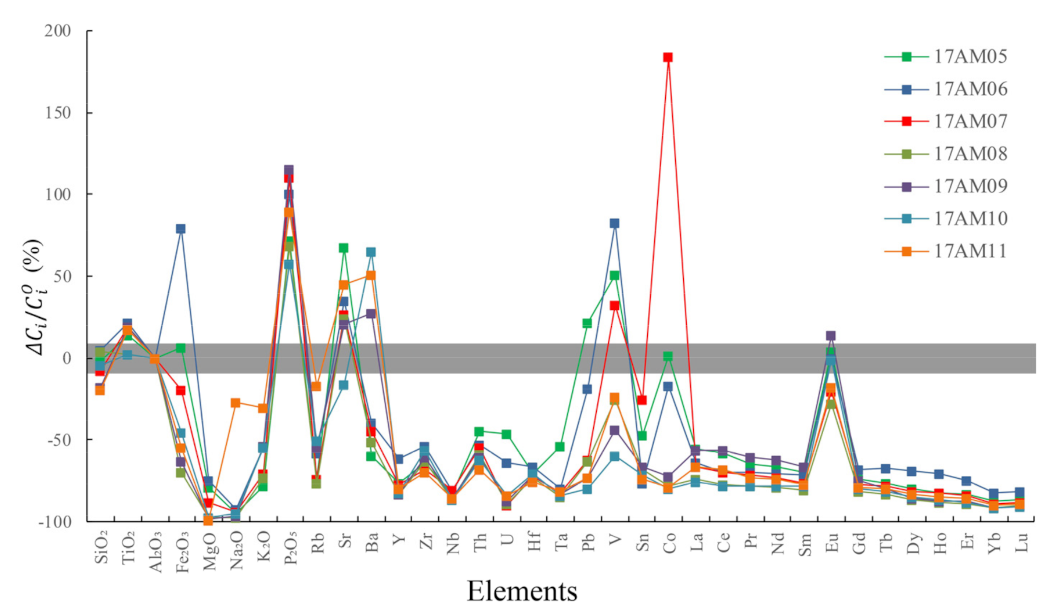
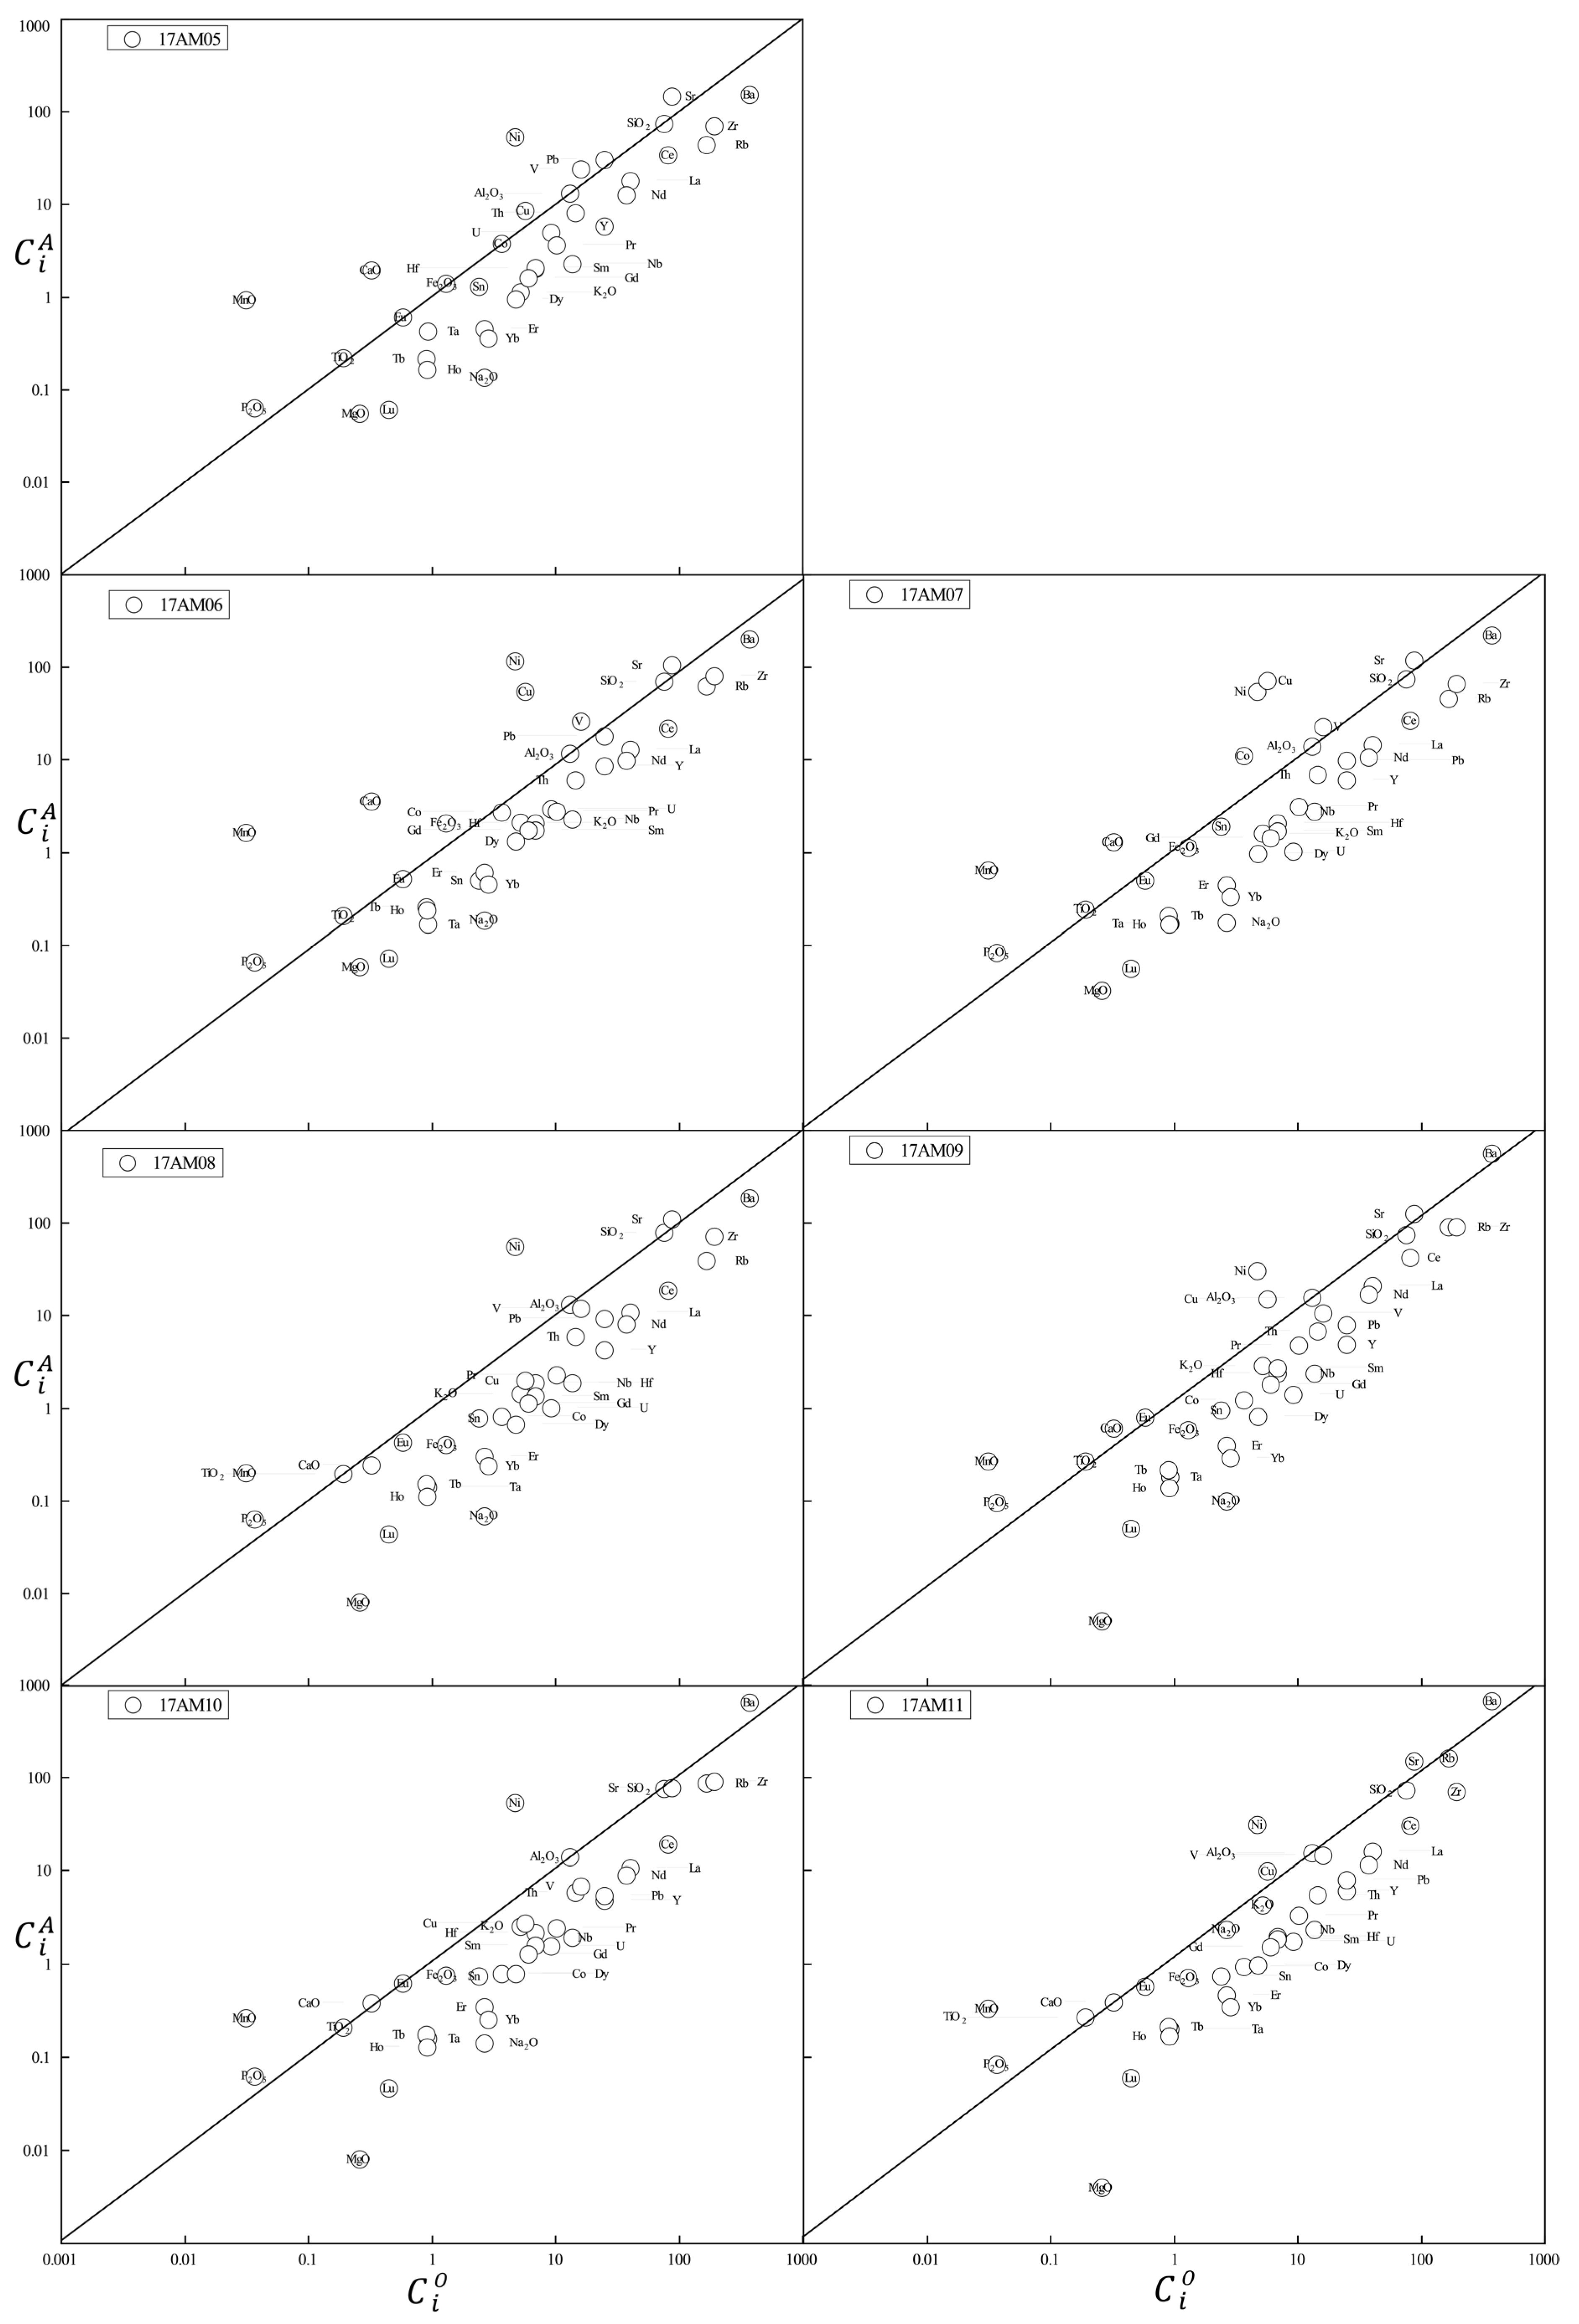
4.3. Mass Changes Related to Hydrothermal Alteration

The mass changes from the hydrothermal alteration were estimated from the geochemistry data using sparse isocon analysis and the standardized method of mass change calculation. In this study, we used the average geochemical composition of the igneous rocks of Manketou’ebo Formation from adjacent areas as the “original rock” composition [15,17,18], and every dataset of the altered sample was used to calculate the reference frame and their amounts, and the ratios of mass transfer. We used the sparse isocon method to calculate the reference frame x . The calculated values of x and relative movement of elements from least alteration are shown in Figure 6 and Table 3.
In general, 70% mass of the rare earth elements is lost during the alteration process except for in Eu. SiO2, TiO2, Al2O3, and Sr are relatively unchanged. MgO, Na2O, K2O, Rb, Zr, Nb, Th, U, Hf, Ta, and Pb are leached, while P2O5 and other volatiles are enriched.
However, there are some differences between the surface samples and core samples. Fe2O3T, V, and Co show characteristics of enrichment or few change in the core samples but show characteristics of loss in the surface samples. The core samples also gained more MnO, CaO, Ni, and Cu than the surface samples (Table 3). This difference is in accordance with the two subtypes of rocks described before. Some element migrations in the core samples are more intensive than the earth surface samples, and the differences are shown in Figure 7 and Table 3.

5. Discussion

5.1. Occurrence of Lithium

K-feldspar, quartz crystal fragments, and microcrystals in the samples were observed under a microscope. The particle size of the matrix minerals and clay minerals are less than 0.01 mm and the atomic number of lithium is 3, which makes it very difficult to identify the occurrence of lithium by means of in situ microanalysis such as laser ablation ICP-MS or electronic probe microanalysis, although the whole rocks have high lithium contents. The phases of chlorite, montmorillonite, calcite, dolomite, kaolinite, and albite are identified by XRD diffraction analysis (Figure 4), which makes it possible to investigate the extremely fine-grained mineral phases in the samples.
The quartz cannot contain very much lithium because of their lattice properties [35,36]. The dolomite components from the drilling hole and earth surface have large variations; however, there is no evidence that the lithium contents of them have this variation. The incoherence of the lithium contents and dolomite components indicates that lithium does not occur in the dolomite. K-feldspar and albite are framework silicate minerals, and their cations have low electrovalence, large ion radius, and low coordination number. The cations are usually K+, Ca2+, Na+, and Ba2+ and sometimes Rb+, Cs+, and NH4+. The lithium ion radius is relatively small; thus, it cannot replace the cations extensively without changing the X-ray diffraction characteristics of the feldspar [37,38,39]. Moreover, 17AM11 has the strongest X-ray diffraction peaks of feldspar (Figure 4) but has the lowest concentration of lithium.
Hence, montmorillonite, as an altered mineral, has the capacity to contain the lithium. It has a fine-grained natural structure with sheet-like geometry. Lithium ions can exist in the interlayered structure of montmorillonite in a stable form. Montmorillonite has a higher negative charge and larger specific surface area, so it has a stronger ability to adsorb cations (such as Li+) compared to other minerals [40,41,42,43]. Other lithium deposits also show that the lithium can reside in smectite or hectorite, such as the McDermitt Caldera lithium deposit, Nevada, USA [2]. Chlorite is a layered silicate mineral (Figure 3) with complex composition. The lithium can replace Mg and Fe in chlorite in some extent. In addition, no independent lithium mineral was found so far by optical or X-ray methods.

5.2. Metallogenic Characteristics

The element mass changes show evidence of metasomatism between the hydrothermal fluid and volcanic rocks. The LOI of the samples indicates high volatile contents and strong alteration. The LOI values of the earth surface samples are 2.96–4.75 wt.%, while those of the core samples are more than 5 wt.%, which may indicate that there are different contents of volatiles added to the rocks. From the petrography and XRD diffraction data, the volcanic rocks underwent chloritization, montmorillonization, and carbonatization (including calcitization and dolomitization). However, carbonatization is much more intensive in the deep part of the orebody. The spatial distribution of carbonatization is not consistent with that of chloritization and montmorillonitization, indicating that different parts of the orebody underwent different metasomatic processes. The carbonate–chlorite–pyrite index (CCPI) represents the degree of intensity of chlorite, sericite and pyrite alteration. The alteration index (AI) represents the degree of metasomatism that converted plagioclase to sericite, illite, and chlorite by hydrothermal alteration. An AI-CCPI diagram can be used to represent the alteration degree of the volcanic rocks [26]. The mineralized samples show chloritization and montmorillonitization. Moreover, the core samples also show carbonatization. These indicate that there are two alteration zones in the deposit (Figure 8 and Table 4).
Montmorillonitization: In the montmorillonitization process, feldspar or volcanic glass were replaced by montmorillonite, and Na and K were leached along with dissolution of these materials. Montmorillonitization consumes the H+ in these reactions between the hydrothermal fluid and the rocks, which can change the pH of the ore-bearing fluid. Conversely, the pH of the solutions increases towards alkaline. Montmorillonite is a layered silicate, and its edge charge is affected by the pH of the solution. With the increase in pH, the negative edge charge increases, which enhances the adsorption capacity of montmorillonite to cations [40,41,44]. At this stage, lithium is enriched in the rocks in the form of an interlayer cation or absorption. Cations such as Mn2+, Fe2+, Fe3+, Ni2+, and Li+ can also substitute Al3+ in the octahedral sheet [41].
Chloritization: At the same time, the temperature of the ore-forming fluid begins to decrease with evolution of the hydrothermal fluid. The changes in physical and chemical conditions of the hydrothermal fluid promote the metasomatization of montmorillonite to form chlorite. In the chloritization process, the Mn and Ni contents show an increasing trend (Figure 6), and the pH decreases gradually [45], which is conductive to increasing the content of metal cations in the hydrothermal solution and causing loss of metal elements in the rocks [46]. In general, the montmorillonitization-chloritization process leads to the loss of Na2O, K2O, Rb, and Ba and a gain of Li, Sr, P, and other volatiles. Because the rare earth element contents in carbonate are very low, the loss of rare earth elements mainly occurs in the process of chloritization and montmorillonization.
Carbonatization: Based on the “isocon analysis”, the core samples gain a lot of Ca, Mn, Ni, V, Co, and Cu during the alteration process. These elements can be explained by the hydrothermal solution leaching the elements from a more mafic composition volcanic rock. Additionally, the hydrothermal solution is rich in CO2 so carbonate minerals are formed in the deep sections. In contrast, the REEs and the high field strength elements Nb, Ti, Hf, Zr, and Th show similar mobility in different alteration zones of the orebody (Figure 6), indicating that alteration occurred within the same or similar host rocks.
The volcanic rocks of the Manketou’ebo Formation are negative Eu anomalies because they originated from the young lower crust and underwent fractional crystallization [15,17,18,47,48,49]. However, all the mineralized samples of this study show slight negative to positive Eu anomalies (Figure 5), indicating that margination of Eu must occur. Dissolution of the feldspar leads to a negative Eu anomaly because the Eu and Ca in feldspar are usually isomorphic. Then, there must be additional sources of Eu. Europium is usually positively anomalous in the hydrothermal fluid [50,51]. There is evidence that the hydrothermal fluid can transport the Eu far away from the ore zones in the volcanogenic massive sulfide deposits [26,51]. In the Naomugeng lithium deposit, the elements including Li and Eu are leached by hydrothermal fluid from the other part of the volcanic rocks. Then, they are transported to the metallogenic section and enriched in the alteration processes. The Eu concentrations of the orebody are increased, which can be used for prospecting. However, it needs further work to find the extremely negative Eu anomaly volcanic rocks around the orebody to perfect this model for a clay-type lithium deposit.
In summary, there are two alteration zones caused by the hydrothermal fluid. The chloritization-montmorillonitization zone occurs mainly near the earth surface, and the chloritization-montmorillonitization-carbonatization zone occurs in the lower part of the orebody. The hydrothermal fluid leaches lithium and europium from the volcanic rocks, which is the main ore source. The slight Eu anomaly is characteristic of the rocks that have obvious interaction with the ore-forming fluid.

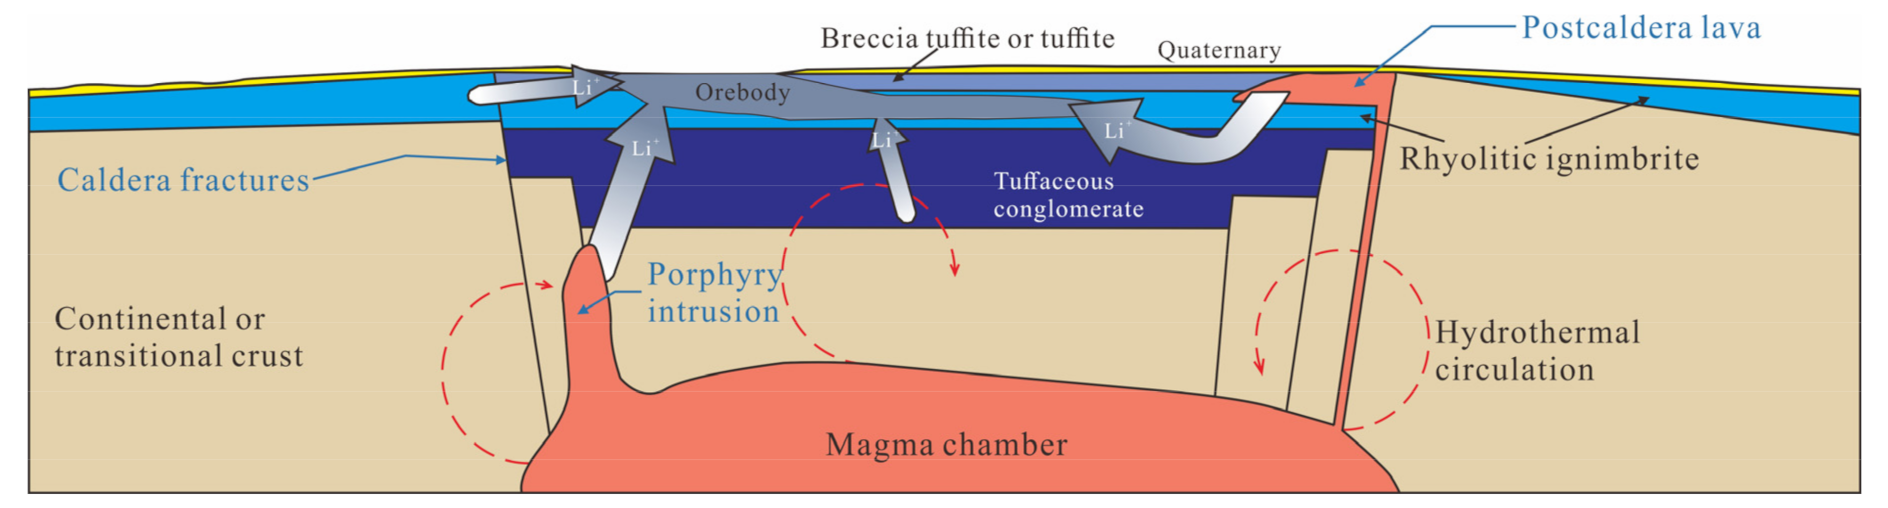
5.3. Formation Mechanism and Prospective Potential of Lithium Deposits

The Manketou’ebo Formation volcanic rock is a set of felsic volcanic lavas and pyroclastic rock formed during the Late Jurassic [15,17,18,47,48]. The volcanic stratum of the Manketou’ebo Formation can be divided into three lithologic members, which are (1) tuffaceous conglomerate with tuffite; (2) rhyolitic ignimbrite, welded rhyolitic breccia tuff, and rhyolitic tuff with locally rhyolite; and (3) breccia tuffite with tuffite. They correspond to the product of the initial eruption stage, large-scale eruption stage, and collapse deposit stage of a caldera [49]. Hence, we conclude that the Naomugeng lithium deposit occurs in a caldera setting, which is similar to the lithium deposit of the McDermitt Caldera in USA. Both of the deposits are related to the rhyolitic rocks and formed in caldera settings, and the lithium occurs in clay minerals [1,2]. In this type of deposit, the lithium leached from the volcanic rocks or post-magmatic fluids can be the source of ore-forming materials. The lithium shows mobility after the eruption and can be concentrated by degassing of magmatic fluids and leaching of the volcanic materials [1,52]. Lakes and hydrothermal systems are common in intracontinental caldera. The collapsed caldera is an ideal proximal basin, which can be used to accumulate lithium-enriched runoff and tuffaceous sediments. The lithium-enriched meteoric and hydrothermal fluids alter the host rocks (e.g., tuff or sediments) in the caldera basin, which form the clay-type of lithium deposit. The model explaining the metallogenic mechanism of Naomugeng lithium deposit is illustrated in Figure 9.
The Paleozoic Angeeryinwula Formation in the Bayan Obo area is also rich in lithium. The source of lithium is related to the leaching of volcanic rocks [53]. Lithium occurs in clay minerals in the strata, which results in the widespread geochemical anomalies of the lithium soil in this area. The similarities between the lithium occurrences and geological processes with the Naomugeng lithium deposit indicate that clay-type lithium deposits have a very broad exploration prospect in the central Inner Mongolia. This study increases the understanding of the characteristics, metallogenic mechanism, and exploration guidelines of the Naomugeng lithium deposit. However, further work is needed to improve the mechanism of lithium mineralization related to volcanic rocks in central Inner Mongolia. This includes, but is not limited to, the dating of lithium mineralization, the formation temperature of lithium deposits, and the isotopic analysis of clay-type lithium deposits.

6. Conclusions

The Naomugeng lithium deposit is a clay-type lithium deposit that developed in a caldera setting. The felsic volcanic rocks from the Manketou’ebo Formation were identified as an ore-host rock. The lithium was carried by the hydrothermal and enriched in the crystal tuff. The extreme lithium enrichment may be from the leaching of volcanic materials or from post-magmatic fluids. The core and the earth surface samples have high lithium contents of 1421–3014 ppm.
Based on detailed petrographical, mineralogical, and geochemical studies, there are two alteration zones in the orebody: the chloritization-montmorillonitization zone and the chloritization-montmorillonitization-carbonatization zone. The lithium is enriched in the montmorillonization and chloritization process. Montmorillonite and chlorite have layered structures and large specific surface areas. We infer that lithium mainly exists within them. An “isocon analysis” shows that Na2O and K2O were leached and that Li, Sr, P, and other volatiles were enriched during the alteration/mineralization process. Carbonatization is related to the CO2-enriched hydrothermal solution. The REEs (except Eu) are lost during the alteration. The slight Eu anomaly (compared with the strong negative Eu anomaly of the original rocks) is characteristic of the rocks, which have an obvious interaction with the ore-forming fluid.
For future prospecting work in the study area, we put forward the following prospecting indicators. (1) The high content of Lithium and alteration characteristics (such as montmorillonization and chloritization) are direct prospecting indicators. (2) A similarity of the mass transfer characteristics and Eu anomalies to this study indicates the spatial range of metasomatism of the ore-forming hydrothermal solution. It can also be used as significant vectors for geochemical exploration in the Naomugeng area.
In order to strengthen the limitation of deposit distribution and ore body shape, remote sensing mapping and field investigation should be increased. It is necessary to further determine the metallogenic age and times of the deposit to guide future prospecting work. The discovery of Naomugeng lithium deposit is of great significance for prospecting of clay-type lithium deposits in Inner Mongolia and even northern China. This indicates that central Inner Mongolia has great potential to prospect this type of lithium deposit. It is worth further work to improve the metallogenic mechanism of clay-type lithium deposit in this region.

Author Contributions

Conceptualization: C.L., Z.L. and W.Y.; experiments: C.L., X.C. and Y.L.; data curation: C.L.; methodology: Z.L., T.W. and C.L.; investigation: C.L., Z.L., Y.L., J.Z. and X.L.; resources: X.L.; writing—original draft preparation: C.L.; writing—review and editing: Z.L. and T.W.; visualization: C.L.; project administration: Z.L.; funding acquisition: Z.L. and W.Y. All authors have read and agreed to the published version of the manuscript.

Funding

This research was funded by the National Natural Science Foundation of China (No. 91858213), the Geological Exploration Fund of Inner Mongolia (No. 2017-YS02) , Jiaojiang Branch of Tai-zhou Natural Resources and Planning Bureau (No. 201903), and Geological Exploration Bureau of Zhejiang (No. 202006).

Institutional Review Board Statement

Not applicable.

Informed Consent Statement

Not applicable.

Data Availability Statement

Not applicable.

Acknowledgments

The authors thank Y. Liu and P.P. Zhang of Zhejiang University for providing some useful suggestion and for guiding the XRD diffraction and SEM analyses; C.H. Langmuir and Z.X. Chen of Harvard University; and J.H. Zhu of Second Ocean Institute of the Ministry of Natural Resources for geochemical analysis. Inner Mongolia Institute of Geological Survey also provided the support in the field work.

Conflicts of Interest

The authors declare no conflict of interest.

References

  1. Benson, T.R.; Coble, M.A.; Rytuba, J.J.; Mahood, G.A. Lithium enrichment in intracontinental rhyolite magmas leads to Li deposits in caldera basins. Nat. Commun. 2017, 8, 270. [Google Scholar] [CrossRef]
  2. Castor, S.B.; Henry, C.D. Lithium-rich claystone in the McDermitt Caldera, Nevada, USA: Geologic, mineralogical, and geochemical characteristics and possible origin. Minerals 2020, 10, 68. [Google Scholar] [CrossRef] [Green Version]
  3. Munk, L.A.; Hynek, S.A.; Bradley, D.; Boutt, D.; Labay, K.; Jochens, H. Lithium brines: A global perspective. In Reviews in Economic Geology; Verplanck, P.L., Hitzman, M.W., Eds.; Society of Economic Geologists: Littleton, CO, USA, 2016; Volume 18, pp. 339–365. [Google Scholar]
  4. Partington, G.A.; Mcnaughton, N.J.; Williams, I.S. A review of the geology, mineralization, and geochronology of the Greenbushes pegmatite, Western Australia. Econ. Geol. 1995, 90, 616–635. [Google Scholar] [CrossRef]
  5. Dai, H.; Wang, D.H.; Liu, L.J.; Yu, Y.; Dai, J.J. Geochronology and Geochemistry of Li(Be)-bearing granitic pegmatites from the Jiajika superlarge Li-polymetallic deposit in western Sichuan, China. J. Earth Sci. 2019, 707–727. [Google Scholar] [CrossRef]
  6. Swanson, S.E. Mineralogy of spodumene pegmatites and related rocks in the rin-spodumene belt of north Carolina and south Carolina, USA. Can. Mineral. 2012, 50, 1589–1608. [Google Scholar] [CrossRef]
  7. Ma, S.C.; Wang, D.H.; Sun, Y.; Li, C.; Zhong, H.R. Geochronology and geochemical characteristics of lower-middle Triassic clay rock and their significances for prospecting clay-type lithium deposit. Earth Sci. 2019, 44, 427–440. [Google Scholar] [CrossRef]
  8. Wen, H.J.; Luo, C.G.; Du, S.J.; Yu, W.X.; Gu, H.N.; Ling, K.Y.; Cui, Y.; Li, Y.; Yang, J.H. Carbonate-hosted clay-type lithium deposit and its prospecting significance. Chin. Sci. Bull. 2020, 65, 53–59. [Google Scholar] [CrossRef]
  9. Baoyinwuliji; Zhao, W.T.; Wang, X.K.; Cui, L.W.; Li, X.R.; Bao, F.Q. Geochemical anomaly and metallogenic potential of the Naomugengsumu lithium mineralization area in Inner Mongolia. Geol. Resour. 2014, 23, 531–534. [Google Scholar] [CrossRef]
  10. Hong, D.W.; Wang, S.G.; Xie, X.L.; Zhang, J.S.; Wang, T. Metallogenic province derived from mantle sources: A case study of Central Asian Orogenic Belt. Miner. Depos. 2003, 22, 41–55. [Google Scholar] [CrossRef]
  11. Xiao, W.J.; Shu, L.S.; Gao, J.; Xiong, X.L.; Wang, J.B.; Guo, Z.J.; Li, J.Y.; Sun, M. Continental dynamics of the central asian orogenic belt and its metallogeny. Xinjiang Geol. 2008, 26, 4–8. [Google Scholar]
  12. Cogn, J.P.; Kravchinsky, V.A.; Halim, N.; Hankard, F. Late Jurassic-Early Cretaceous closure of the Mongol-Okhotsk Ocean demonstrated by new Mesozoic palaeomagnetic results from the Trans-Bakal area (SE Siberia). Geophys. J. R. Astron. Soc. 2010, 163, 813–832. [Google Scholar] [CrossRef] [Green Version]
  13. Windley, B.F.; Alexeiev, D.; Xiao, W.; KröNer, A.; Badarch, G. Tectonic models for accretion of the Central Asian Orogenic Belt. J. Geol. Soc. 2007, 164, 31–47. [Google Scholar] [CrossRef] [Green Version]
  14. Zhao, P.; Chen, Y.; Xu, B.; Faure, M.; Shi, G.; Choulet, F. Did the Paleo-Asian Ocean between North China Block and Mongolia Block exist during the late Paleozoic? First paleomagnetic evidence from central-eastern Inner Mongolia, China. J. Geophys. Res. Solid Earth 2013, 118, 1873–1894. [Google Scholar] [CrossRef] [Green Version]
  15. Li, P.C.; Li, S.C.; Liu, Z.H.; Li, G.; Bai, X.H.; Wan, L. Formation age and tectonic environment of volcanic rocks from Manketouebo Formation in Linxi area, Inner Mongolia. Glob. Geol. 2016, 35, 77–88. [Google Scholar] [CrossRef]
  16. Wang, J.F.; Li, Y.J.; Li, H.Y.; Dong, P.P. Post- orogeny of the Hegenshan suture zone: Zircon U-Pb age and geochemical constraints from volcanic rocks of the Manketouebo Formation. Geol. Bull. China 2019, 38, 1443–1454. [Google Scholar]
  17. Yin, Z.G.; Hao, K.; Liu, C.L.; Wang, Y.; Li, H.N.; Li, M.; Gong, Z.M.; Zhang, S.T. Geochronological and geochemical characteristics of rhyolite in the Manketou’ebo Formation of Dong Ujimqin Banner, Inner Mongolia, and its geological implications. Geol. Bull. China 2019, 38, 1825–1836. [Google Scholar]
  18. Guo, J.G.; Zhang, Y.J.; Zhang, C.; Li, W.; Wang, Y.; Wang, Q.Z.; Guo, J. Formation age and geochemical characteristics of volcanic rocks in Manketou’ebo Formation in Kundu area of Ar Horqin Banner, Inner Mongolia. Geol. Bull. China 2018, 37, 1652–1661. [Google Scholar] [CrossRef]
  19. Bor-Ming, J.; Wu, F.; Chen, B. Granitoids of the Central Asian Orogenic Belt and continental growth in the Phanerozoic. Trans R Soc Edinburgh Earth Sci. Earth Environ. Sci. Trans. R. Soc. Edinb. 1999, 91, 181–193. [Google Scholar] [CrossRef]
  20. Li, X.H.; Li, Z.X.; Wingate, M.T.D.; Chung, S.L.; Liu, Y.; Lin, G.C. Geochemistry of the 755 ma mundine well dyke swarm, northwestern australia: Part of a neoproterozoic mantle superplume beneath rodinia? Precambrian Res. 2006, 146, 1–15. [Google Scholar] [CrossRef]
  21. Bézos, A.; Escrig, S.; Langmuir, C.H.; Michael, P.J.; Asimow, P.D. Origins of chemical diversity of back-arc basin basalts: A segment-scale study of the eastern lau spreading center. J. Geophys. Res. Solid Earth 2009, 114, 1–25. [Google Scholar] [CrossRef] [Green Version]
  22. Ma, Q.; Xia, M. Modification of mechanical and color properties of polypropylene with colored nano SiO2 prepared from diatomite. J. Appl. Polym. Sci. 2020, 137, 48328. [Google Scholar] [CrossRef]
  23. Ague, J.J. Mass transfer during Barrovian metamorphism of Pelites, South-Central Connecticut. I: Evidence for changes in composition and volume. Am. J. Sci. 1994, 294, 989–1057. [Google Scholar] [CrossRef]
  24. Wang, C.Y.; Li, X.F.; Xiao, R.; Bai, Y.P.; Yang, F.; Mao, W.; Jiang, S.K. Elements mobilization of mineralized porphyry rocks during hydrothermal alteration at Zhushahong porphyry copper deposit, Dexing district, South China. Acta Petrol. Sin. 2012, 28, 3869–3886. [Google Scholar]
  25. Ague, J.J. Extreme channelization of fluid and the problem of element mobility during barrovian metamorphism. Am. Mineral. 2011, 96, 333–352. [Google Scholar] [CrossRef]
  26. Dong, K.; Chen, S.; Graham, I.; Zhao, J.; Fu, P.; Xu, Y.; Tian, G.; Qin, W.; Chen, J. Geochemical behavior during mineralization and alteration events in the Baiyinchang volcanic-hosted massive sulfide deposits, Gansu Province, China. Ore Geol. Rev. 2017, 91, 559–572. [Google Scholar] [CrossRef]
  27. Mori, Y.; Nishiyama, T.; Yanagi, T. Mass transfer and reaction paths in alteration zones around carbonate veins in the Nishisonogi Metamorphic Rocks, southwest Japan. Am. Mineral. 2003, 88, 611–623. [Google Scholar] [CrossRef]
  28. Grant, J.A. Isocon analysis: A brief review of the method and applications. Phys. Chem. Earth 2005, 30, 997–1004. [Google Scholar] [CrossRef]
  29. Villaplaza, B.R.B.; Buena, A.E.; Pacle, N.A.D.; Payot, B.D.; Gabo-Ratio, J.A.S.; Ramos, N.T.; Dimalanta, C.B.; Faustino-Eslava, D.V.; Queaño, K.L.; Yumul, G.P., Jr. Alteration and lithogeochemistry in the Masara gold District, Eastern Mindanao, Philippines, as tools for exploration targeting. Ore Geol. Rev. 2017, 91, 530–540. [Google Scholar] [CrossRef]
  30. Grant, J.A. The isocon diagram: A simple solution to Gresens’ equation for metasomatic alteration. Econ. Geol. 1986, 81, 1976–1982. [Google Scholar] [CrossRef]
  31. Maclean, W.; Kranidiotis, P. Immobile elements as monitors of mass transfer in hydrothermal alteration; Phelps Dodge massive sulfide deposit, Matagami, Quebec. Econ. Geol. 1987, 82, 951–962. [Google Scholar] [CrossRef]
  32. Kessel, R.; Schmidt, M.W.; Ulmer, P.; Pettke, T. Trace element signature of subduction-zone fluids, melts and supercritical liquids at 120–180 km depth. Nature 2005, 437, 724–727. [Google Scholar] [CrossRef] [PubMed]
  33. Kuwatani, T.; Yoshida, K.; Ueki, K.; Oyanagi, R.; Uno, M.; Akaho, S. Sparse isocon analysis: A data-driven approach for material transfer estimation. Chem. Geol. 2020, 532, 119345. [Google Scholar] [CrossRef]
  34. Sun, S.S.; McDonough, W.F. Chemical and isotopic systematics of oceanic basalts: Implications for mantle composition and processes. Geol. Soc. Lond. Spec. Publ. 1989, 42, 313–345. [Google Scholar] [CrossRef]
  35. Hendricks, S.B. Lattice structure of clay minerals and some properties of clays. J. Geol. 1942, 50, 276–290. [Google Scholar] [CrossRef]
  36. Rakov, L.T. Mechanisms of isomorphic substitution in quartz. Geochem. Int. 2006, 40, 1004–1014. [Google Scholar] [CrossRef]
  37. Liu, S.K.; Li, J.J.; Liu, J.M. An updated model of Rietveld structure refinement of Na/K-feldspar. Period. Mineral. 2017, 86, 75–85. [Google Scholar] [CrossRef]
  38. Müller, G. Preparation of hydrogen and lithium feldspars by ion exchange. Nature 1988, 332, 435–436. [Google Scholar] [CrossRef]
  39. Ribbe, P.H. Feldspar Minerals. Vol. 1: Crystal structure and physical properties; Vol. 2: Chemical and textural properties. Geosci. Can. 1975, 83, 537–538. [Google Scholar] [CrossRef]
  40. Uddin, F. Clays, nanoclays, and montmorillonite minerals. Metall. Mater. Trans. A 2008, 39, 2804–2814. [Google Scholar] [CrossRef]
  41. Uddin, F. Montmorillonite: An introduction to properties and utilization. In Current Topics in the Utilization of Clay in Industrial and Medical Applications; Zoveidavianpoor, M., Ed.; IntechOpen: London, UK, 2018; pp. 3–22. [Google Scholar]
  42. Madejová, J.; Barlog, M.; Jankovi, U.; Slan, M.; Pálková, H. Comparative study of alkylammonium- and alkylphosphonium-based analogues of organo-montmorillonites. Appl. Clay Sci. 2021, 200, 105894. [Google Scholar] [CrossRef]
  43. Slaný, M.; Jankovič, Ľ.; Madejová, J. Structural characterization of organo-montmorillonites prepared from a series of primary alkylamines salts: Mid-IR and near-IR study. Appl. Clay Sci. 2019, 176, 11–20. [Google Scholar] [CrossRef]
  44. Shu, S.K.; Peng, C.L.; Shi, W.G.; Qin, L.; Luo, S.H. Adsorption characteristics and mechanism of ammonium ions on montmorillonite surface. Chin. Rare Earths 2020, 41, 68–77. [Google Scholar]
  45. Zhang, X.K.; Cai, Y.F.; Fan, C.X. Simulation of “chloritization” of montmorillonite to chlorite. In Proceedings of the 17th Annual Academic Meeting of the Chinese Society of Mineral Petrogeochemistry, Hangzhou, China, 19 April 2019; p. 97. [Google Scholar]
  46. Seyfried, W.E., Jr.; Foustoukos, D.I.; Allen, D.E. Ultramafic-hosted hydrothermal systems at mid-ocean ridges: Chemical and physical controls on pH, redox and carbon reduction reactions. In Proceedings of the American Geophysical Union, Washington, DC, USA, 1 January 2004; p. 267. [Google Scholar]
  47. Bai, Y.L.; Wang, T.; Wang, Z.Q.; Kang, X.L.; Gu, X.Y.; Qiu, G.D.; Wang, D.X.; Yan, J. Forming age and paleoclimate of Manketouebo Formation in Manzhouli-Xinbarhuyouqi area. Acta Geol. Sin. 2020, 94, 1367–1381. [Google Scholar] [CrossRef]
  48. He, P.; Guo, S.; Zhang, T.F.; Zhang, Y.L.; Su, H.; Fu, Q.L. Geochronology, geochemistry and tectonic setting of volcanic rocks from Manketouebo Formation in Wulagai area, southern Da Hinggan Mountains. Geol. China 2020, 1–27. Available online: http://kns.cnki.net/kcms/detail/11.1167.P.20200106.1707.007.html (accessed on 20 February 2021).
  49. Meng, X.F.; Zhang, Z.P.; Xu, C.; Wang, D.Q. Geologic characteristics and lithologic member division in the Late Jurassic Manketou’ebo Formation in Wulanhade area, Dongwuzhumuqinqi, Inner Mongolia, China. Geol. Bull. China 2010, 29, 1649–1654. [Google Scholar] [CrossRef]
  50. Douville, E.; Bienvenu, P.; Charlou, J.L.; Donval, J.P.; Fouquet, Y.; Appriou, P.; Gamo, T. Yttrium and rare earth elements in fluids from various deep-sea hydrothermal systems. Geochim. Cosmochim. Acta 1999, 63, 627–643. [Google Scholar] [CrossRef]
  51. Genna, D.; Gaboury, D.; Roy, G. Evolution of a volcanogenic hydrothermal system recorded by the behavior of LREE and Eu: Case study of the Key Tuffite at Bracemac–McLeod deposits, Matagami, Canada. Ore Geol. Rev. 2014, 63, 160–177. [Google Scholar] [CrossRef]
  52. Ellis, B.S.; Szymanowski, D.; Magna, T.; Neukampf, J.; Dohmen, R.; Bachmann, O.; Ulmer, P.; Guillong, M. Post-eruptive mobility of lithium in volcanic rocks. Nat. Commun. 2018, 9, 3228. [Google Scholar] [CrossRef] [Green Version]
  53. Jin, S.; Liang, Q.S. Study on the cause of lithium soil geochemical abnormal in the layer of Angeeryinwula formation in Bayanaobao area, Inner Mongolia. Geol. Chem. Miner. 2019, 41, 82–89. [Google Scholar] [CrossRef]
Figure 1. Modified geological maps of the study area with sample locations. (a) The sketched geomap showing tectonic units adjacent to CAOB [19]. (b) The simplified geological map of Naomugeng in Siziwangqi with the sample location (after 1:250,000 geological maps of Bulitai areas). (c) The geological section of the Naomugeng area. Q, E: Quaternary and Palaeogene; K1b: Baiyinhua Formation; J3mk1: lower section of Manketoúebo Formation; P2z: Zhesi Formation; P1ss: Shoushangou Formation; C2bb: Benbatu Formation; Є2δ: diorite of Middle Cambrian; Jxhr: Halhada Formation.
Minerals 11 00238 g001
Figure 2. Samples and micrographics. The profile on the left shows the depth of the sampling. (ah) Samples collected from the outcrops and drilling cores, and their corresponding micrographs. They are 17AM08, 09, 10, 11, 04, 05, 06, and 07. (i) Field photo of the study area. (jk) Photos of the earth surface and drilling core samples of the Naomugeng deposit. Note: Qtz—quartz; Kfs—K-feldspar.
Minerals 11 00238 g002
Figure 3. SEM images. (a) Altered K-feldspar fragment and protruding hard quartz are found from the altered rocks. (bd) The flake clay minerals and granular feldspar can be detected from the powder samples. Note: Qtz—quartz; Kfs—K-feldspar; and Chl—chlorite.
Minerals 11 00238 g003
Figure 4. XRD results identified the phases of quartz, orthoclase, albite, kaolinite, montmorillonite, chlorite, dolomite, and calcite from the samples.
Minerals 11 00238 g004
Figure 5. (a) Chondrite-normalized REE patterns and (b) primitive mantle normalized trace element patterns in the ore-bearing tuff (normalized by Sun and McDonough [34]).
Minerals 11 00238 g005
Figure 6. Diagrams showing the mass change ratios in major, trace, and rare elements in the samples: 17AM05, 06, and 07 are from the drilling core, while 17AM08, 09, 10, and 11 are from the earth surface. Some elements show different migration characteristics between them.
Minerals 11 00238 g006
Figure 7. The isocon diagrams for the surface samples and drilling samples. The isocon line is a straight line passing through the origin with a slope of 1/ x . The circle below the line indicates mass loss, while the circle above the line indicates mass gain during the alteration process. Note: C i O is the content of element i in the “origin rock”, and C i A is the average content of element i in the altered rocks.
Minerals 11 00238 g007
Figure 8. The carbonate–chlorite–pyrite index (CCPI)-alteration index (AI) diagram for “original rock”, least mineralized samples, and mineralized samples from the Naomugeng lithium deposit modeled after Dong, et al. [26]. AI: 100 × (MgO + K2O)/(MgO + K2O + Na2O + CaO), CCPI: 100 × (MgO + FeO)/(MgO + FeO + Na2O + K2O). Chl: chloritization, Ser: sericitization Cb: carbonatization, Dol: dolomitization.
Minerals 11 00238 g008
Figure 9. Schematic model for the formation of Naomugeng clay-type lithium deposits, mainly modified by Benson, et al. [1].
Minerals 11 00238 g009
Table 1. Sampling in the Naomugeng lithium deposit of Siziwangqi in central Inner Mongolia.
Sample No.GPSLithology
17AM04 (zk04-1, depth: 88 m)42°48′14″ N,
111°19′00″ E
(storage site of core samples)
Tuffaceous conglomerate
17AM05 (zk04-1, depth: 94 m)Crystal tuff
17AM06 (zk04-1, depth: 286 m)Crystal tuff
17AM07 (zk04-1, depth: 283 m)Crystal tuff
17AM08 Crystal tuff
17AM0942°48′11″ N,Crystal tuff
17AM10111°20′30″ ECrystal tuff
17AM11 Crystal tuff
Table 2. Major and trace elements results.
Element17AM517AM617AM717AM817AM917AM1017AM11
SiO275.070.774.879.574.476.872.7
TiO20.220.210.240.200.270.210.27
Al2O313.111.613.913.215.613.915.5
Fe2O3T1.392.091.130.400.580.750.71
MnO0.060.060.030.010.010.010.00
MgO0.941.630.650.200.270.260.33
CaO1.963.591.290.240.610.380.39
Na2O0.140.190.180.070.100.142.33
K2O1.132.111.621.432.892.534.29
P2O50.060.070.080.060.100.060.08
LOI6.427.915.684.134.753.982.96
Total100.34100.0299.6399.5099.6099.0399.58
Li222926273014142128062323349
Rb43.962.646.439.790.888.1163.9
Sr14910611911112779152
Ba154201223186570657673
Zr70.680.666.072.591.490.270.2
Nb2.292.292.801.872.391.912.35
Th8.076.106.985.976.855.865.55
U4.972.941.031.011.411.551.73
Pb30.518.010.09.38.05.47.9
V24.426.122.712.110.76.914.5
Co3.772.7411.180.811.220.780.93
Ni541175556315431
Cu8.6755.3172.121.9915.142.719.82
Sn1.290.501.930.780.960.740.73
Cs4.928.515.593.947.436.437.26
La18.012.914.410.821.210.716.1
Ce34.421.926.618.842.819.030.8
Pr3.682.763.112.304.842.423.32
Nd12.709.9410.768.1417.168.9111.59
Hf2.032.102.071.872.372.151.98
Sm2.091.751.711.352.721.591.84
Eu0.610.520.500.430.800.620.57
Gd1.601.731.441.131.801.291.51
Tb0.210.260.210.150.210.170.21
Dy0.961.330.960.670.820.780.98
Ho0.170.240.170.110.140.130.17
Er0.460.610.450.300.390.350.46
Yb0.360.450.330.240.290.250.35
Lu0.060.070.060.040.050.050.06
Y5.848.556.054.294.944.796.03
ΣREE85.366.970.851.1101.153.777.0
LREE/HREE5.22.94.24.57.74.15.0
δEu1.020.910.971.061.101.321.05
Notes: Concentrations in wt.% except traces in parts per million. “Fe2O3T” is the total iron in the form of Fe2O3.
Table 3. Isocon analysis of altered rocks in the Naomugeng lithium deposit.
Sub Groups Core SamplesEarth Surface Samples
Sample No.Composition of “Original Rock”17AM517AM617AM717AM817AM917AM1017AM11
Reference Frame x 0.991.110.930.980.830.930.84
SiO275.2−2%5%−7%4%−18%−5%−19%
TiO20.1914%22%19%3%19%3%17%
Al2O312.99-------
Fe2O3T1.306%79%−19%−70%−63%−46%−54%
MgO0.032894%5803%1844%539%625%690%802%
MnO0.26−79%−75%−88%−97%−98%−97%−99%
CaO0.32502%1146%274%−25%57%12%2%
Na2O2.65−95%−92%−94%−97%−97%−95%−27%
K2O5.16−78%−54%−71%−73%−53%−54%−31%
P2O50.0472%101%110%69%115%58%89%
Rb165.7−74%−58%−74%−77%−54%−50%−17%
Sr87.567%35%26%24%20%−16%45%
Ba372.5−59%−40%−44%−51%27%65%51%
Y24.7−77%−61%−77%−83%−83%−82%−80%
Zr192.9−64%−53%−68%−63%−61%−56%−70%
Nb13.6−83%−81%−81%−86%−85%−87%−86%
Th14.3−45%−53%−55%−59%−60%−62%−68%
U9.2−47%−64%−90%−89%−87%−84%−84%
Hf6.9−71%−66%−72%−73%−71%−71%−76%
Ta0.9−54%−80%−83%−85%−84%−84%−82%
Pb24.722%−19%−63%−63%−73%−80%−73%
V15.951%82%32%−26%−44%−60%−24%
Sn2.4−47%−77%−25%−68%−67%−71%−74%
Co3.72%−17%184%−78%−72%−80%−79%
Ni4.71038%2686%989%1068%445%976%463%
Cu5.751%986%1082%−66%122%−55%45%
La40.3−56%−64%−67%−74%−56%−75%−67%
Ce81.4−58%−70%−70%−77%−56%−78%−68%
Pr10.2−64%−70%−72%−78%−61%−78%−73%
Nd37.5−67%−70%−73%−79%−62%−78%−74%
Sm6.8−70%−71%−77%−81%−67%−78%−77%
Eu0.64%0%−20%−28%14%−1%−18%
Gd6.0−74%−68%−78%−81%−75%−80%−79%
Tb0.9−76%−67%−78%−83%−80%−82%−80%
Dy4.8−80%−69%−81%−86%−86%−85%−83%
Ho0.9−82%−71%−83%−88%−87%−87%−85%
Er2.7−83%−74%−84%−89%−88%−88%−85%
Yb2.9−88%−82%−89%−92%−92%−92%−90%
Lu0.4−86%−82%−88%−90%−91%−90%−89%
Notes: Concentrations in wt.% except traces in ppm in the column composition of “original rock”. The numbers with % represent the ratios of gain or loss of element mass that are relative to the “original rock” in the mineralizing process. They correspond to the values of Δ C i / C i O in the text. The positive numbers represent gain, and the negative numbers represent loss. The reference frames   x are calculated by the sparse isocon method.
Table 4. The alteration zones of the Naomugeng deposit.
Alteration zonesChloritizationMontmorillonitizationCalcitizationDolomitization
Least mineralized sample Minerals 11 00238 i001
Mineralized samples (from earth surface)
Mineralized samples (from drilling hole)
Publisher’s Note: MDPI stays neutral with regard to jurisdictional claims in published maps and institutional affiliations.

