
Physical Simulation Test on Surrounding Rock Deformation of Roof Rockburst in Continuous Tunneling Roadway


Abstract
:1. Introduction
2. Materials and Methods
2.1. Engineering Background
2.2. Sample Preparation of Similar Materials
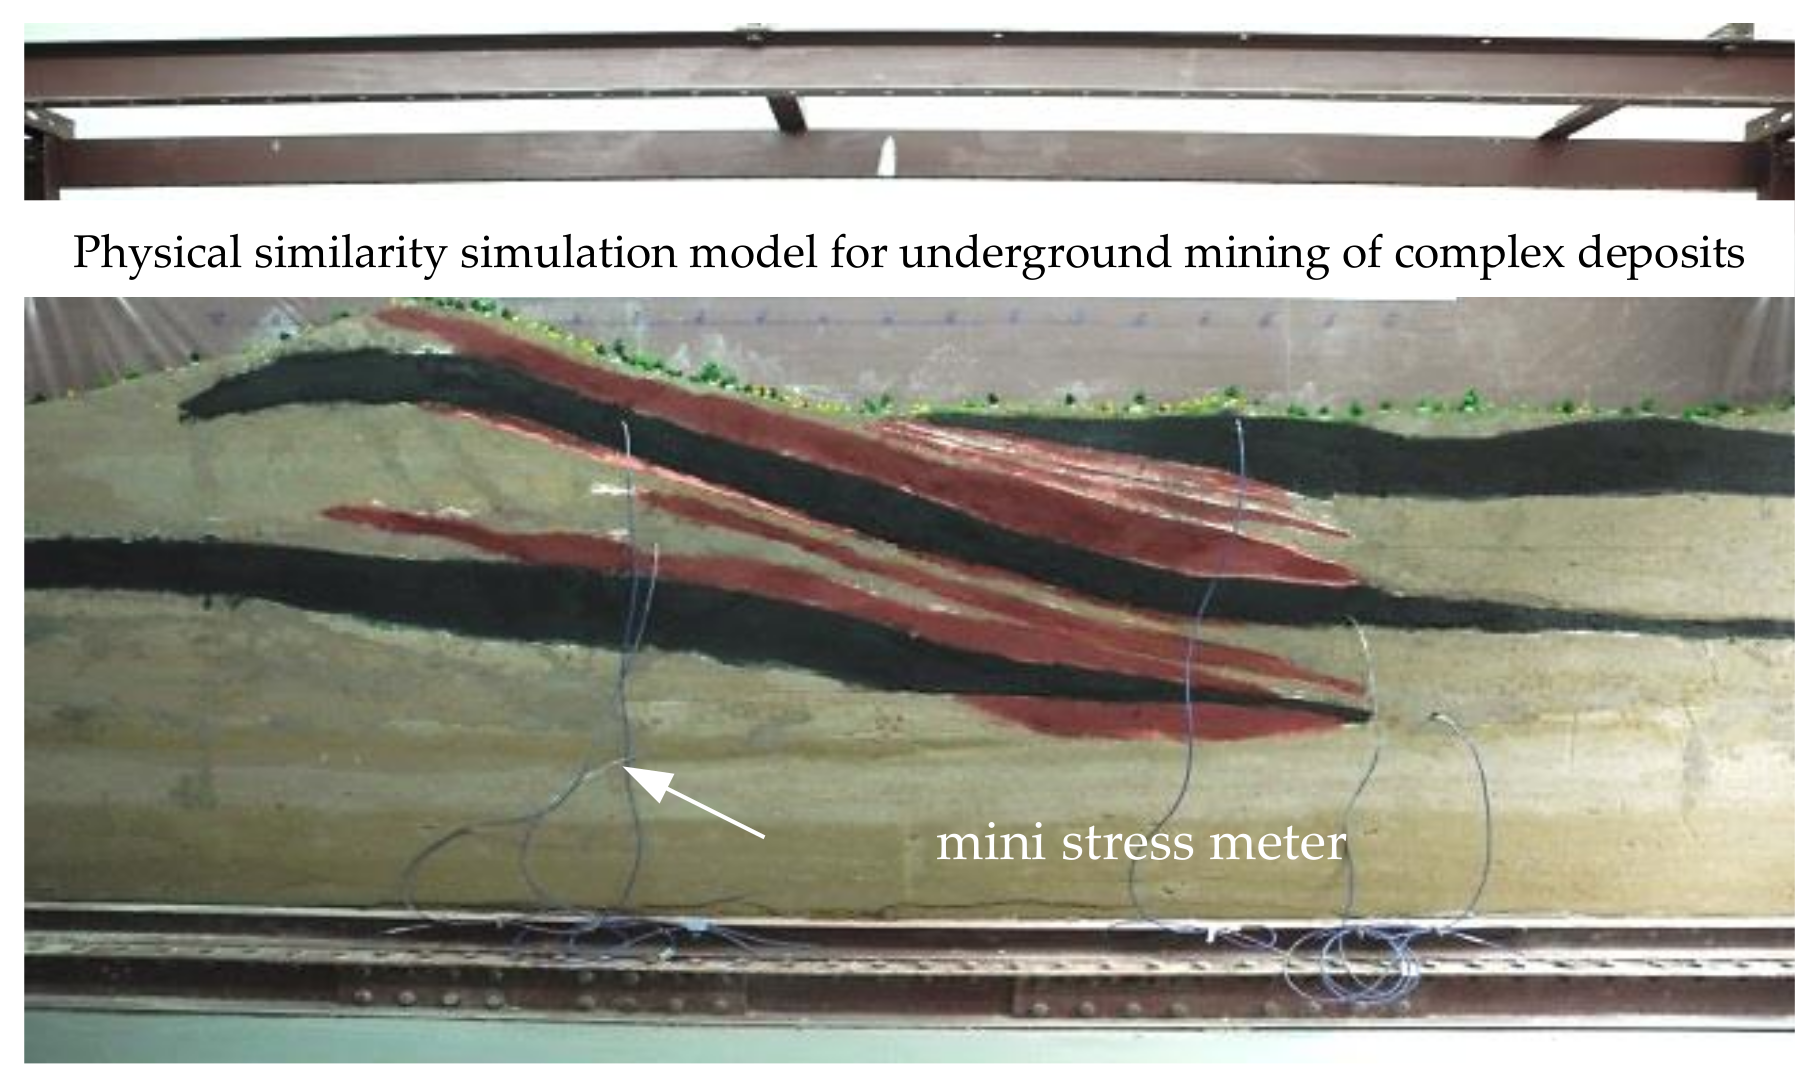
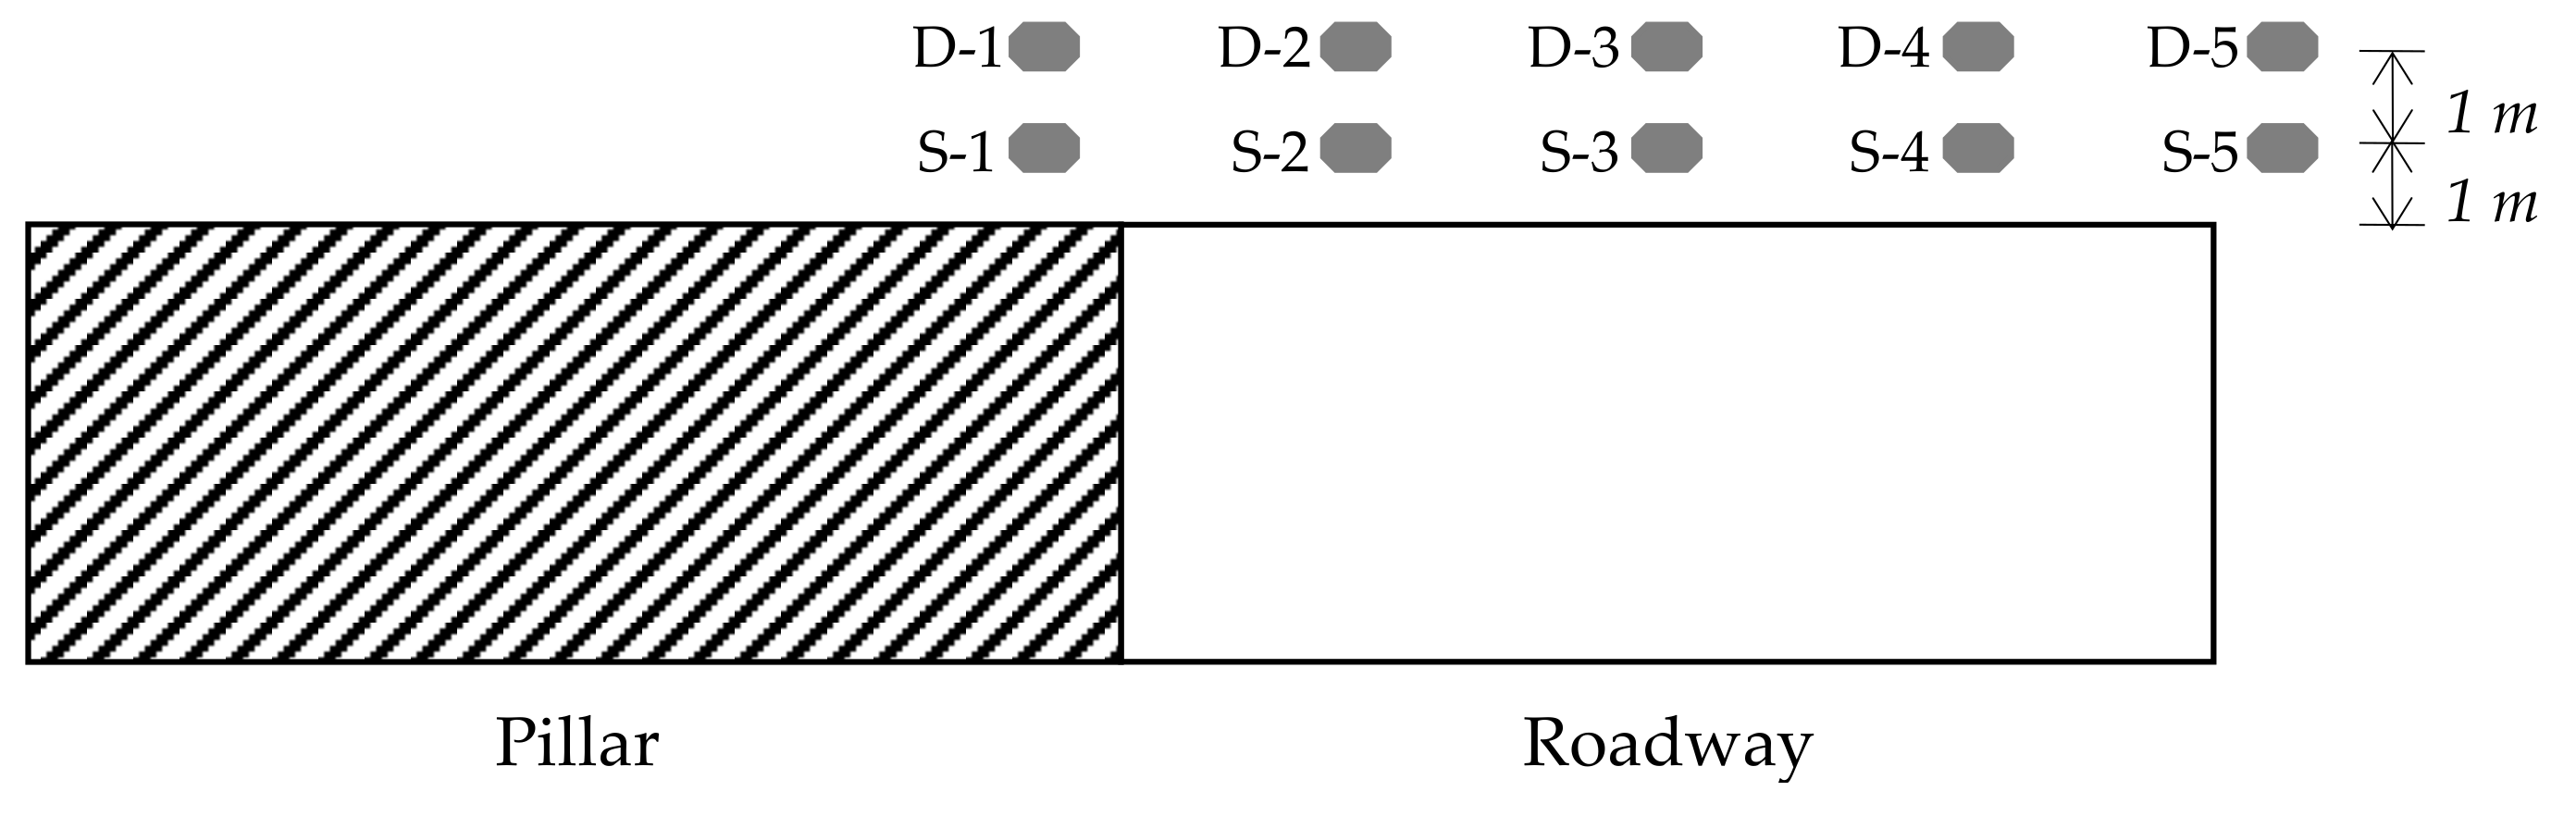
2.3. Test Equipment and Methods
3. Stress Analysis of Roadway-Surrounding Rock Affected by Adjacent Face Mining
3.1. Mechanical Model
3.2. Stress Function of Mode I and Mode II Crack Tip Affected by Mining in Adjacent Working Face
3.3. Stress Function at Crack Tip of I–II Composite Mode
4. Results
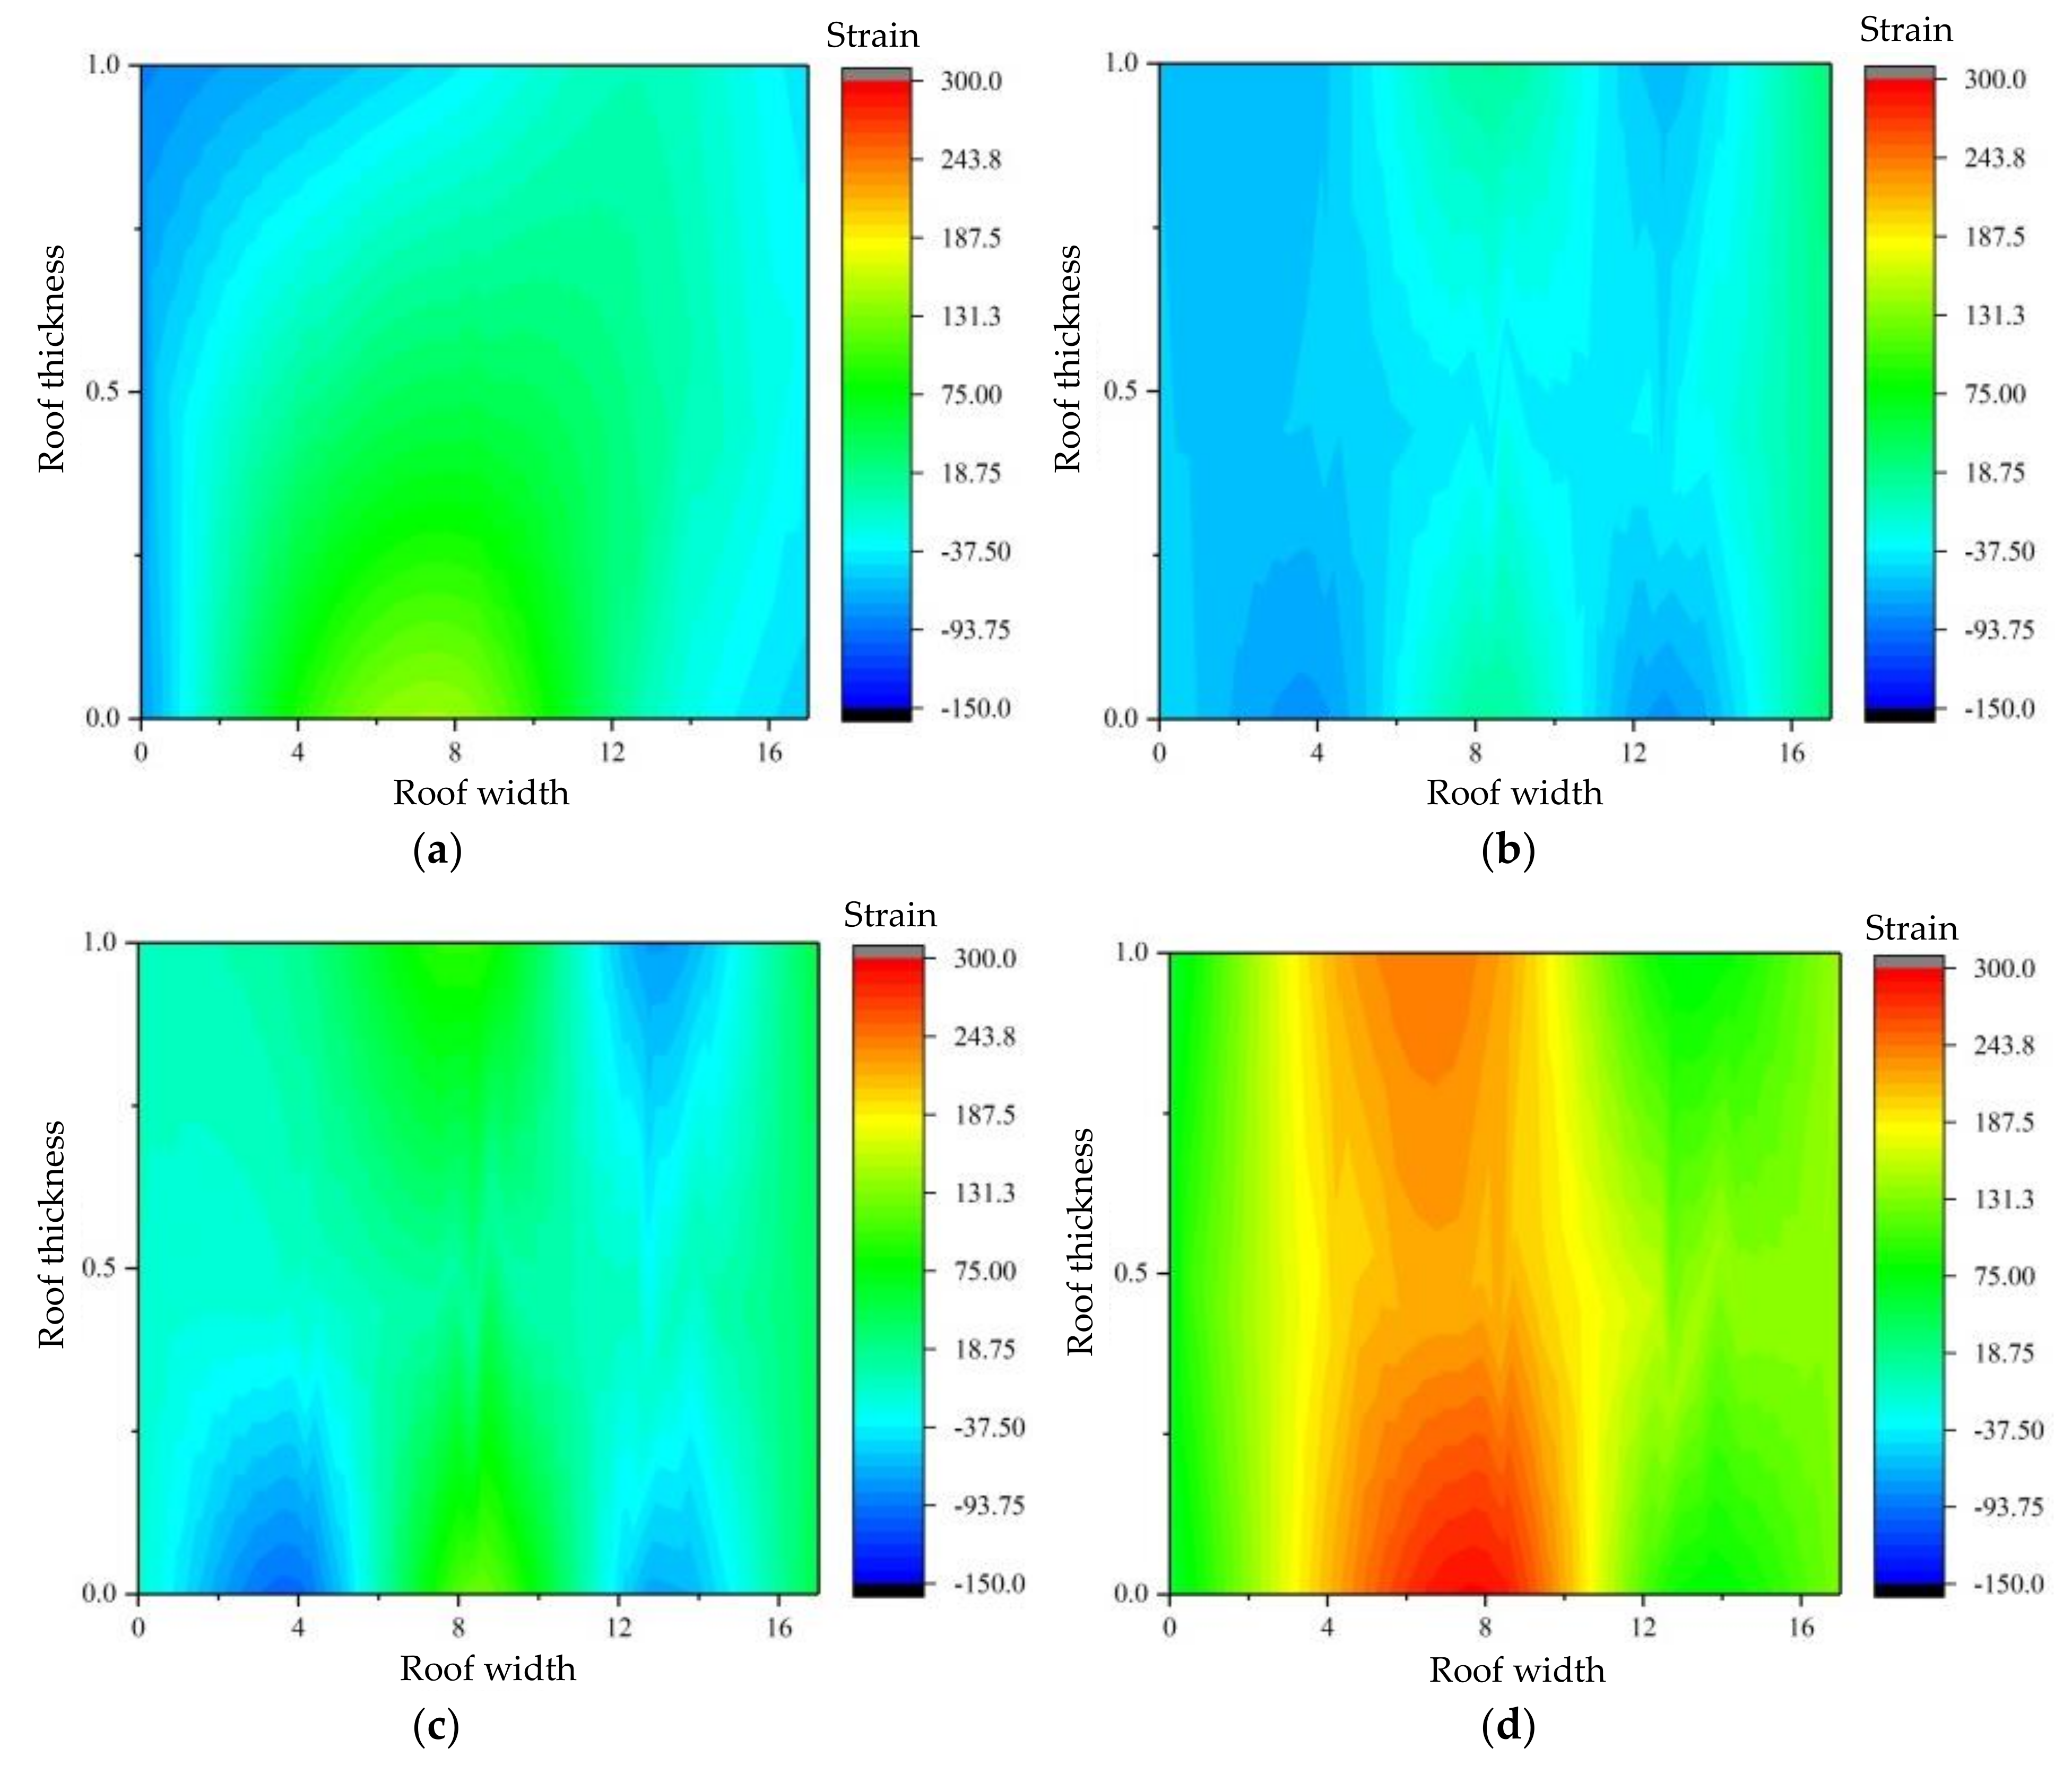
4.1. Analysis of Roadway Roof Deformation
4.2. Deformation and Failure Process of Roadway Roof
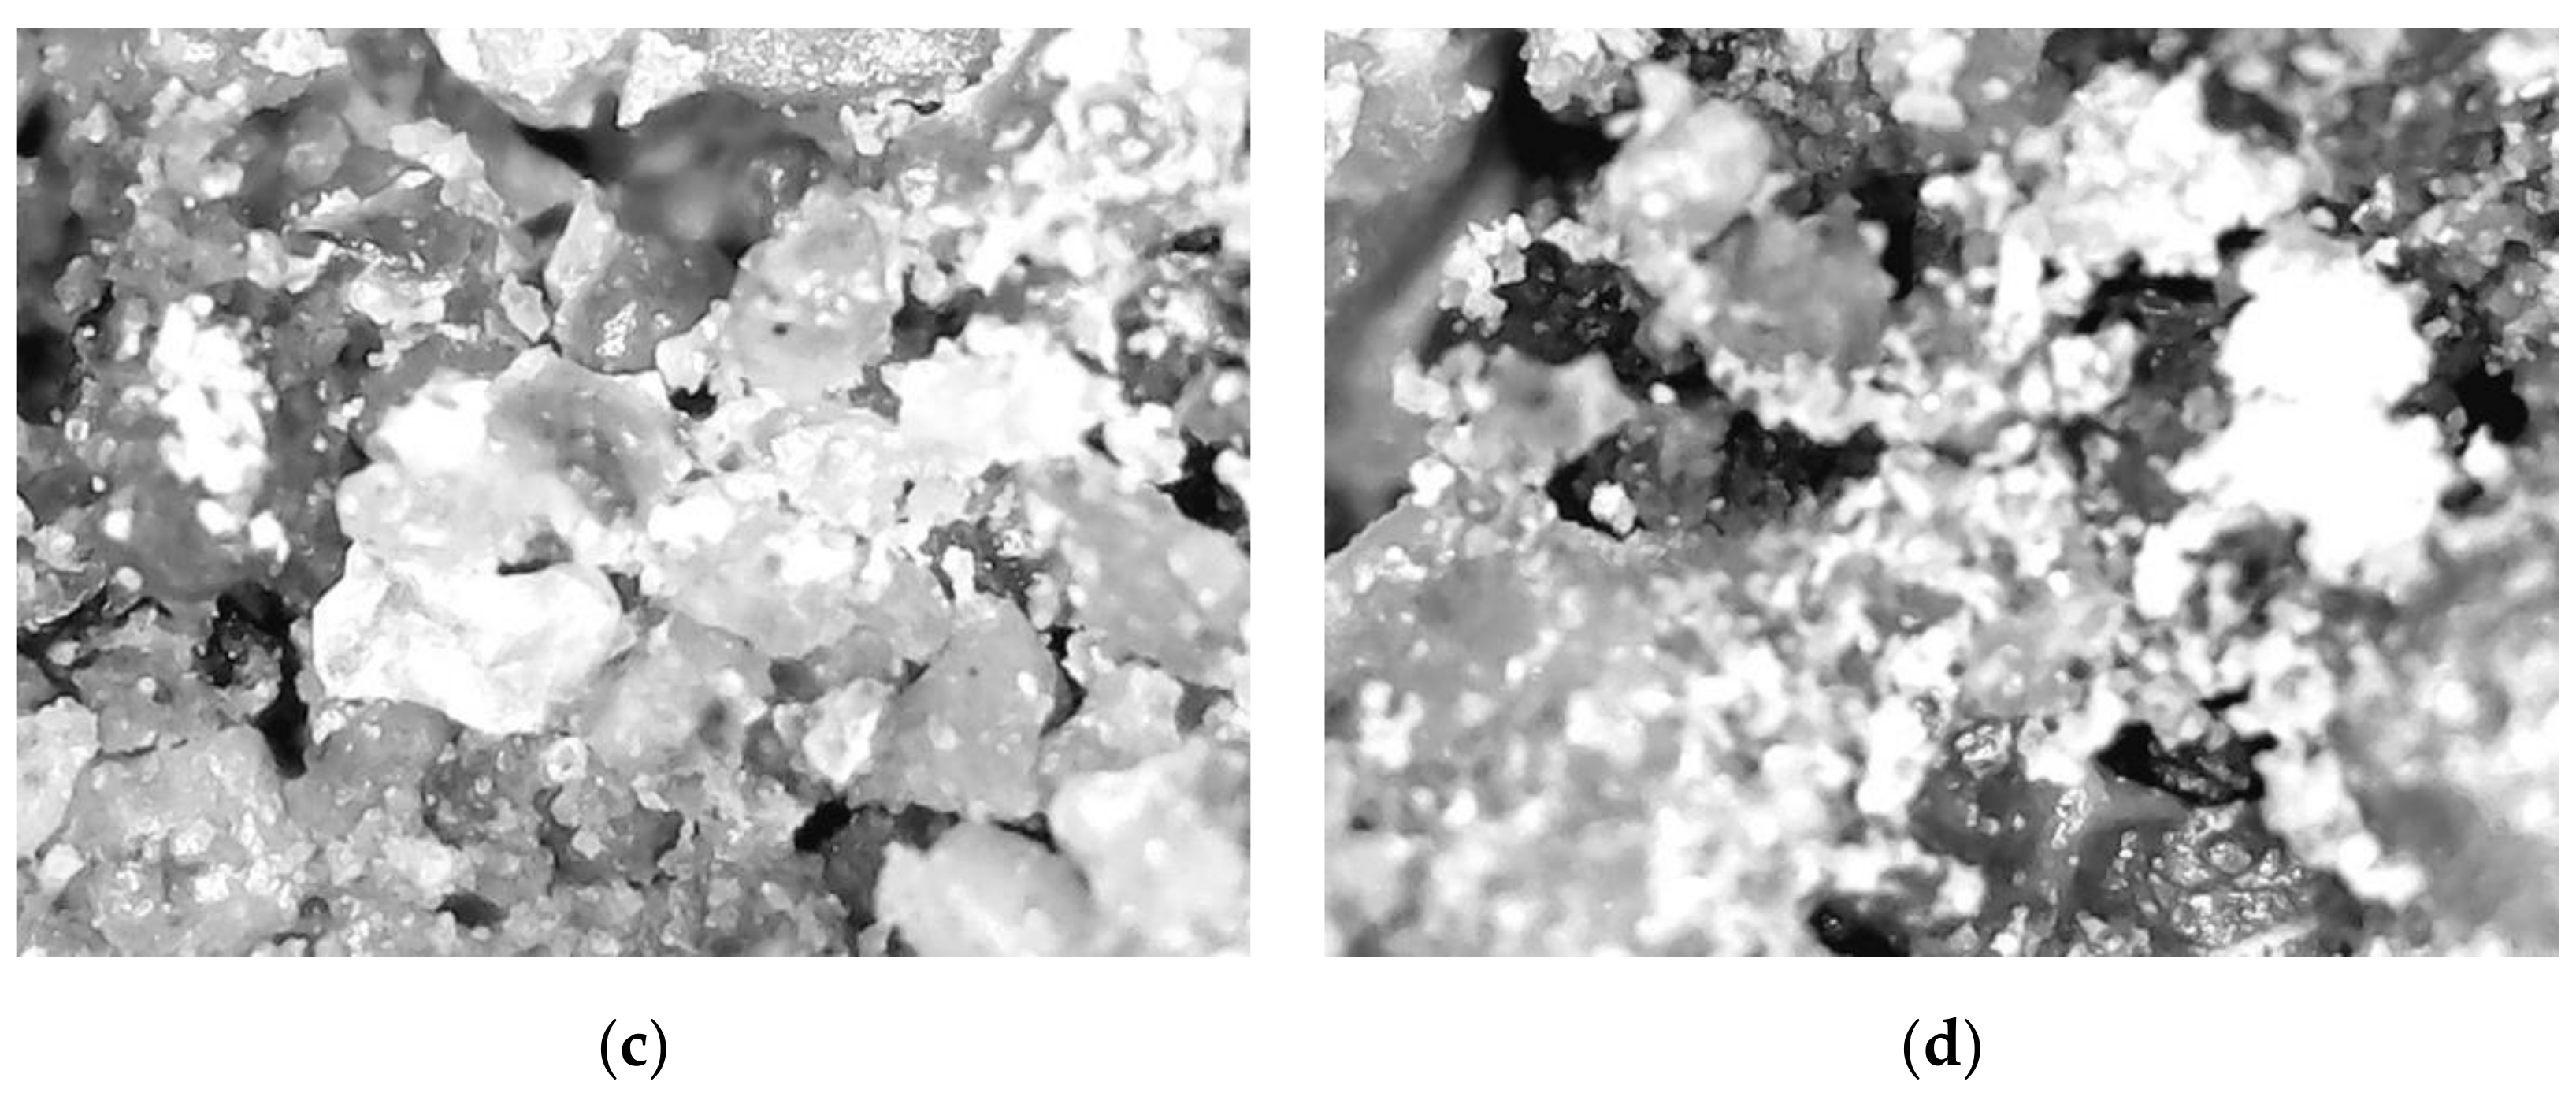
4.3. Temporal and Spatial Evolution Law of Microscopic Damage and Failure in Roadway Roof Rockburst Process
4.4. Deformation and Failure Characteristics of Roadway Roof
5. Discussion
- The rock material studied is a brittle material, which can be considered to have linear elasticity and can be studied using the relevant theories of linear elastic fracture mechanics;
- The rock material was considered to be isotropic;
- The deformation and failure process of the surrounding rock is quasi-static and isothermal;
- In the micro research of rock, the cracks studied are regarded as ideal cracks, and the crack size is much smaller than the rock mass size. Ignoring the influence of finite size on the calculation results, it is assumed that the rock mass size is infinite.
6. Conclusions
Author Contributions
Funding
Institutional Review Board Statement
Informed Consent Statement
Data Availability Statement
Conflicts of Interest
References
- Li, T.; Gong, H.; Xu, G.L.; Kong, D.Z. Study on the influence of in situ stress distribution on the stability of roadway surrounding rock. Adv. Civ. Eng. 2021, 10, 3570523. [Google Scholar] [CrossRef]
- Yu, Y.; Lu, J.F.; Chen, D.C.; Pan, Y.X.; Zhao, X.Q.; Zhang, L.Y. Study on the Stability Principle of Mechanical Structure of Roadway with Composite Roof. Minerals 2021, 11, 1003. [Google Scholar] [CrossRef]
- Zhao, G.P.; Yang, S.L. Analytical solutions for rock stress around square tunnels using complex variable theory. Int. J. Rock Mech. Min. Sci. 2018, 106, 74–83. [Google Scholar] [CrossRef]
- Wang, J.; Apel, D.B.; Pu, Y.Y.; Hall, R.; Wei, C.; Sepehri, M. Numerical modeling for rockbursts: A state-of-the-art review. J. Rock Mech. Geotech. Eng. 2020, 13, 457–478. [Google Scholar] [CrossRef]
- Li, Z.L.; He, X.Q.; Dou, L.M.; Song, D.Z.; Wang, G.F. Numerical investigation of load shedding and rockburst reduction effects of top-coal caving mining in thick coal seams. Int. J. Rock Mech. Min. Sci. 2018, 110, 266–278. [Google Scholar] [CrossRef]
- Shadabfar, M.; Gokdemir, C.; Zhou, M.L.; Kordestani, H.; Muho, E.V. Estimation of Damage Induced by Single-Hole Rock Blasting: A Review on Analytical, Numerical, and Experimental Solutions. Energies 2020, 14, 29. [Google Scholar] [CrossRef]
- Mu, W.Q.; Li, L.C.; Chen, D.Z.; Wang, S.X.; Xiao, F.K. Long-term deformation and control structure of rheological tunnels based on numerical simulation and on-site monitoring. Eng. Fail. Anal. 2020, 118, 104928. [Google Scholar] [CrossRef]
- Tahmasebinia, F.; Zhang, C.G.; Canbulat, I.; Vardar, O.; Saydam, S. Numerical and analytical simulation of the structural behaviour of fully grouted cable bolts under impulsive loading. Int. J. Min. Sci. Technol. 2018, 28, 807–811. [Google Scholar] [CrossRef]
- Brink, S.; Dorfling, C.; Aldrich, C. An acoustic sensor for prediction of the structural stability of rock. Int. J. Rock Mech. Min. Sci. 2016, 85, 187–191. [Google Scholar] [CrossRef]
- Fang, Q.C.; Shang, L.; Shang, Y.H.; Zhao, Y.; Ou, N.Y. Study on the Reinforcement Measures and Control Effect of the Surrounding Rock Stability Based on the Shield Tunneling Under Overpass Structure. J. Eng. Sci. Technol. Rev. 2016, 9, 131–138. [Google Scholar] [CrossRef]
- Sainoki, A.; Maina, D.; Schwartzkopff, A.K.; Obara, Y.; Karakus, M. Impact of the intermediate stress component in a plastic potential function on rock mass stability around a sequentially excavated large underground cavity. Int. J. Rock Mech. Min. Sci. 2018, 127, 104223. [Google Scholar] [CrossRef]
- Zhao, D.S. Retrospection on the development of rock mass mechanics and the summary of some unsolved centennial problems. Chin. J. Rock Mech. Eng. 2021, 40, 1297–1336. [Google Scholar]
- Ahmad, M.; Hu, J.L.; HadzimaNyarko, M.; Ahmad, F.; Tang, X.W.; Rahman, Z.U.; Nawaz, A.; Abrar, M. Rockburst Hazard Prediction in Underground Projects Using Two Intelligent Classification Techniques: A Comparative Study. Symmetry 2021, 13, 632. [Google Scholar] [CrossRef]
- Guo, L.; Li, X.B.; Yan, X.M. Research progress and development tendency of rockburst. Min. Technol. 2006, 6, 16–20. [Google Scholar]
- Kaiser, P.K.; Cai, M. Design for rock support system under rockburst condition. J. Rock Mech. Geotech. Eng. 2012, 4, 215–227. [Google Scholar] [CrossRef] [Green Version]
- Ma, D.; Wang, J.J.; Cai, X.; Ma, X.T.; Zhang, J.X.; Zhou, Z.L.; Tao, M. Effects of height/diameter ratio on failure and damage properties of granite under coupled bending and splitting deformation. Eng. Fract. Mech. 2019, 220, 106640. [Google Scholar] [CrossRef]
- Du, H.; Song, D.Q.; Chen, Z.; Guo, Z.Z. Experimental study of the influence of structural planes on the mechanical properties of sandstone specimens under cyclic dynamic disturbance. Energy Sci. Eng. 2020, 8, 4043–4063. [Google Scholar] [CrossRef]
- Pei, F.; Ji, H.G.; Zhao, J.W.; Geng, J.M.; Kong, H.L. Energy Evolution and AE Failure Precursory Characteristics of Rocks with Different Rockburst Proneness. Adv. Civ. Eng. 2020, 9, 8877901. [Google Scholar] [CrossRef]
- Aslannezhad, M.; Keshavarz, A.; Kalantariasl, A.; Aslannezhad, M.; Keshavarz, A.; Kalantariasl, A. Evaluation of mechanical, chemical, and thermal effects on wellbore stability using different rock failure criteria. J. Nat. Gas. Sci. Eng. 2020, 78, 103278. [Google Scholar] [CrossRef]
- Li, X.B.; He, W.R.; Xu, Z.H.; Gu, F. Study on Law of Overlying Strata Breakage and Migration in Downward Mining of Extremely Close Coal Seams by Physical Similarity Simulation. Adv. Civ. Eng. 2020, 2020, 2898971. [Google Scholar] [CrossRef]
- Makeiev, S.; Andreiev, S.; Ryzhov, H. The study of the process of physic-chemical destruction of coal by the method of physical modeling. International Conference Essays of Mining Science and Practice. E3S Web Conf. EDP Sci. 2019, 109, 00054. [Google Scholar] [CrossRef]
- Jiang, L.S.; Wang, P.; Zheng, P.Q.; Luan, H.J.; Zhang, C.; Corradi, M. Influence of Different Advancing Directions on Mining Effect Caused by a Fault. Adv. Civ. Eng. 2019, 2019, 7306850. [Google Scholar] [CrossRef] [Green Version]
- Zhou, N.; Zhang, J.X.; Yan, H.; Li, M.; Wang, M. Deformation Behavior of Hard Roofs in Solid Backfill Coal Mining Using Physical Models. Energies 2017, 10, 557. [Google Scholar] [CrossRef] [Green Version]
- Chen, B.; Zhang, S.C.; Li, Y.Y.; Li, Z.K.; Zhou, H.J. Physical simulation study of crack propagation and instability information discrimination of rock-like materials with faults. Arab. J. Geosci. 2020, 13, 1–14. [Google Scholar] [CrossRef]
- Li, S.G.; Du, X.H.; Zhao, P.x.; Xiao, P.; Lin, H.F.; Shuang, H.Q. Experimental study on crack evolution characteristics of rock-like materials under different strain rates. J. Geophys. Eng. 2018, 15, 2071–2078. [Google Scholar]
- Ma, D.; Zhang, J.X.; Duan, H.Y.; Huang, Y.L.; Li, M.; Sun, Q.; Zhou, N. Reutilization of gangue wastes in underground backfilling mining: Overburden aquifer protection. Chemosphere 2021, 264, 128400. [Google Scholar] [CrossRef]
- Shi, Y.B.; Ye, Y.C.; Hu, N.Y.; Huang, X.; Wang, X.H. Experiments on Material Proportions for Similar Materials with High Similarity Ratio and Low Strength in Multilayer Shale Deposits. Appl. Sci. 2021, 11, 9620. [Google Scholar] [CrossRef]
- Ye, Y.C.; Shi, Y.B.; Wang, Q.H.; Yao, N.; Lu, F.; Yue, Z. Test model research on low strength similar material of Shanghengshan multilayer shale deposit. Rock Soil Mech. 2014, 35, 114–120. [Google Scholar]
- Shi, Y.B.; Ye, Y.C.; Wang, Q.H.; Yue, Z.; Lu, F.; Xia, Z.Q. Pillar deformation characteristics for multilayer gently-dipping deposits by strip mining and mining intensity simulation. Min. Metall. Eng. 2015, 35, 4–9. [Google Scholar]
- Ye, Y.C.; Shi, Y.B.; Wang, Q.H.; Liu, Y.Z.; Yao, N.; Lu, F. Experimental study of deformation of wall rock and stoping sequence in mining gently inclined and multilayer deposits by backfill mining in Shanghengshan. J. Min. Saf. Eng. 2015, 32, 407–413. [Google Scholar]
- Hu, X.C.; Su, G.S.; Chen, G.Y.; Mei, S.M.; Feng, X.T.; Mei, G.X.; Huang, X.H. Experiment on rockburst process of borehole and its acoustic emission characteristics. Eng. Geol. 2019, 52, 783–802. [Google Scholar] [CrossRef]
- Tian, C.L.; Yang, X.L.; Sun, H.T.; Liu, Y.B.; Hu, Q.T. Experimental study on the overburden movement and stress evolution in multi-seam mining with residual pillars. Energy Sci. Eng. 2019, 7, 3095–3110. [Google Scholar] [CrossRef] [Green Version]
- Hu, G.J.; Yang, T.H.; Zhou, J.R.; Yu, Q.L.; Xie, L.K.; Liu, H.L.; Zhao, Y.; Taheri, A. Mechanism of Surrounding Rock Failure and Crack Evolution Rules in Branched Pillar Recovery. Minerals 2017, 7, 96. [Google Scholar] [CrossRef] [Green Version]
- Zhu, Z.M.; Gao, W.T.; Wan, D.Y.; Wang, M.; Shu, Y.; Niu, L.L. Numerical Study of Fracture Characteristics of Deep Granite Induced by Blast Stress Wave. Shock Vib. 2021, 2021, 2579569. [Google Scholar] [CrossRef]
- Zhang, S.; Wang, H.Y.; Li, X.J.; Zhang, X.L.; An, D.C.; Yu, B.X. Experimental study on development characteristics and size effect of rock fracture process zone. Eng. Fract. Mech. 2020, 241, 107377. [Google Scholar] [CrossRef]
- Cao, K.W.; Khan, N.M.; Liu, W.; Hussain, S.; Zhu, Y.G.; Cao, Z.T.; Bian, Y.C. Prediction Model of Dilatancy Stress Based on Brittle Rock: A Case Study of Sandstone. Arab. J. Sci. Eng. 2021, 46, 2164–2176. [Google Scholar] [CrossRef]
- Wang, M.; Zhu, Z.M.; Wang, X. The growth of mixed-mode I/II crack under impacting loads. Chin. J. Rock Mech. Eng. 2016, 35, 1323–1332. [Google Scholar]
- Justo, J.; Castro, J.; Cicero, S.; Sanchez, C.M.; Husillos, R. Notch effect on the fracture of several rocks: Application of the Theory of Critical Distances. Theor. Appl. Fract. Mech. 2017, 90, 251–258. [Google Scholar] [CrossRef] [Green Version]
- Wang, X.; Su, O. Specific energy analysis of rock cutting based on fracture mechanics: A case study using a conical pick on sandstone. Eng. Fract. Mech. 2019, 213, 197–205. [Google Scholar] [CrossRef]
- Shi, Y.B.; Ye, Y.C.; Liu, Y.Z.; Wang, Q. H Analysis for the breadth of the pillar-damaged mining strip based on I-II mixed crack mode. J. Saf. Environ. 2017, 17, 888–895. [Google Scholar]
- Dumont, N.A.; Mamani, E.Y.; Cardoso, M.L. A boundary element implementation for fracture mechanics problems using generalised Westergaard stress functions. Eur. J. Comput. Mech. 2018, 27, 401–424. [Google Scholar] [CrossRef]
- Deng, J.L.; Yang, P.; Dong, Q.; Yan, X. Elasto-Plastic Fracture Analysis of Finite-Width Cracked Stiffened Plate. Appl. Mech. Mater. 2014, 496, 1052–1057. [Google Scholar] [CrossRef]
- Paliwal, B.; Hammi, Y.; Chandler, M.; Moser, R.D.; Horstemeyer, M.F. A three-invariant cap-viscoplastic rate-dependent-damage model for cementitious materials with return mapping integration in Haigh-Westergaard coordinate space. Int. J. Solids Struct. 2020, 182, 77–99. [Google Scholar] [CrossRef]
- Lv, X.; Wang, S.Z.; Qiu, Y.; Liu, X.X.; Gong, F.Q. Study on the Influence of Tectonic Stress on Stability of Horseshoe-Shaped Tunnels. Adv. Mater. Sci. Eng. 2021, 2021, 5566142. [Google Scholar] [CrossRef]
- Zhang, Z.Q.; Chen, F.F.; Li, N.; He, M.M.; Moayedi, H. Influence of Fault on the Surrounding Rock Stability for a Mining Tunnel: Distance and Tectonic Stress. Adv. Civ. Eng. 2019, 2019, 2054938. [Google Scholar] [CrossRef] [Green Version]
- Azarafza, M.; Koçkar, M.K.; Faramarzi, L. Spacing and block volume estimation in discontinuous rock masses using image processing technique: A case study. Environ. Earth Sci. 2021, 80, 1–13. [Google Scholar] [CrossRef]
- Liu, Q.S.; Wang, Z.W. Review of numerical modeling based on digital image processing for rock mechanics applications. Chin. J. Rock Mech. Eng. 2020, 39, 3286–3296. [Google Scholar]
- Sun, B. Adaptive multi-scale beam lattice method for competitive trans-scale crack growth simulation of heterogeneous concrete-like materials. Int. J. Fract. 2021, 228, 85–101. [Google Scholar] [CrossRef]
- Li, M.; Mao, X.B. Based on the complex variable functions of rectangular roadway surrounding rock stress and deformation viscoelastic analysis. Chin. Q. Mech. 2011, 32, 195–202. [Google Scholar]
- Lee, Y.K.; Pietruszczak, S. Limit equilibrium analysis incorporating the generalized hoek–brown criterion. Rock Mech. Rock Eng. 2021, 54, 4407–4418. [Google Scholar] [CrossRef]
- Ban, H.X.; Peng, Z.L.; Fang, D.N.; Yao, Y.; Chen, S.H. A modified conventional theory of mechanism-based strain gradient plasticity considering both size and damage effects. Int. J. Solids Struct. 2020, 202, 384–397. [Google Scholar] [CrossRef]
- Hütter, G.; Sab, K.; Forest, S. Kinematics and constitutive relations in the stress-gradient theory: Interpretation by homogenization. Int. J. Solids Struct. 2020, 193, 90–97. [Google Scholar] [CrossRef] [Green Version]
- Anderson, T.L. Fracture Mechanics: Fundamentals and Applications; CRC Press: Boca Raton, FL, USA, 2017; pp. 136–157. [Google Scholar]
- Girard, J.; Silber, R.E.; Mohiuddin, A.; Chen, H.Y.; Karato, S. Development of a Stress Sensor for In-Situ High-Pressure Deformation Experiments Using Radial X-Ray Diffraction. Minerals 2020, 10, 166. [Google Scholar] [CrossRef] [Green Version]
- Brown, E.T.; Hoek, E. Technical note trends in relationships between measured in-situ stress and depth. Int. J. Rock Mech. Min. Sci. Geomech. Abstr. 1978, 15, 211–215. [Google Scholar] [CrossRef]
- Zhao, D.; Chen, Z.M.; Cai, X.L.; Li, S.G. Analysis of distribution rule of geostress in china. Chin. J. Rock Mech. Eng. 2007, 26, 1265–1271. [Google Scholar]


| Rock Formation | Density /(kg/m3) | Porosity /% | Compressive Strength /MPa | Tensile Strength /MPa | Elastic Modulus /GPa | Poisson’s Ratio |
|---|---|---|---|---|---|---|
| Vanadium-bearing shale | 2 482.53 | 14.33 | 76.69 | 12.56 | 58.80 | 0.21 |
| Carbonaceous shale | 2 429.86 | 18.61 | 49.45 | 7.42 | 50.80 | 0.20 |
| Siliceous shale | 2 564.72 | 16.07 | 112.63 | 17.24 | 59.80 | 0.21 |
| Rock Formation | ρ /(kg/m3) | σc /MPa | σt /kPa | n /% | E /GPa | ν | c /kPa | ϕ /(°) |
|---|---|---|---|---|---|---|---|---|
| Siliceous shale | 1 704.41 | 0.75 | 114.87 | 16.21 | 0.399 1 | 0.213 3 | 71.218 | 41.087 |
| Vanadium-bearing shale | 1 661.74 | 0.51 | 84.01 | 14.46 | 0.394 4 | 0.210 0 | 61.891 | 40.275 |
| Carbonaceous shale | 1 620.98 | 0.33 | 49.42 | 18.56 | 0.336 8 | 0.203 3 | 56.748 | 40.106 |
| Rock Formation | Density | Compressive Strength | Tensile Strength | Elastic Modulus | Poisson’s Ratio | Cohesion Internal | Friction Angle | Cσ/(Cρ·Cl) |
|---|---|---|---|---|---|---|---|---|
| Siliceous shale | 1.505 | 150.173 | 150.082 7 | 149.837 | 0.985 | 150.243 | 0.998 | 1.002 0≈1 |
| Vanadium-bearing shale | 1.494 | 150.373 | 149.506 0 | 149.087 | 1.000 | 150.264 | 1.003 | 1.000 3≈1 |
| Carbonaceous shale | 1.499 | 149.848 | 150.141 6 | 150.831 | 0.984 | 149.785 | 0.997 | 0.993 5≈1 |
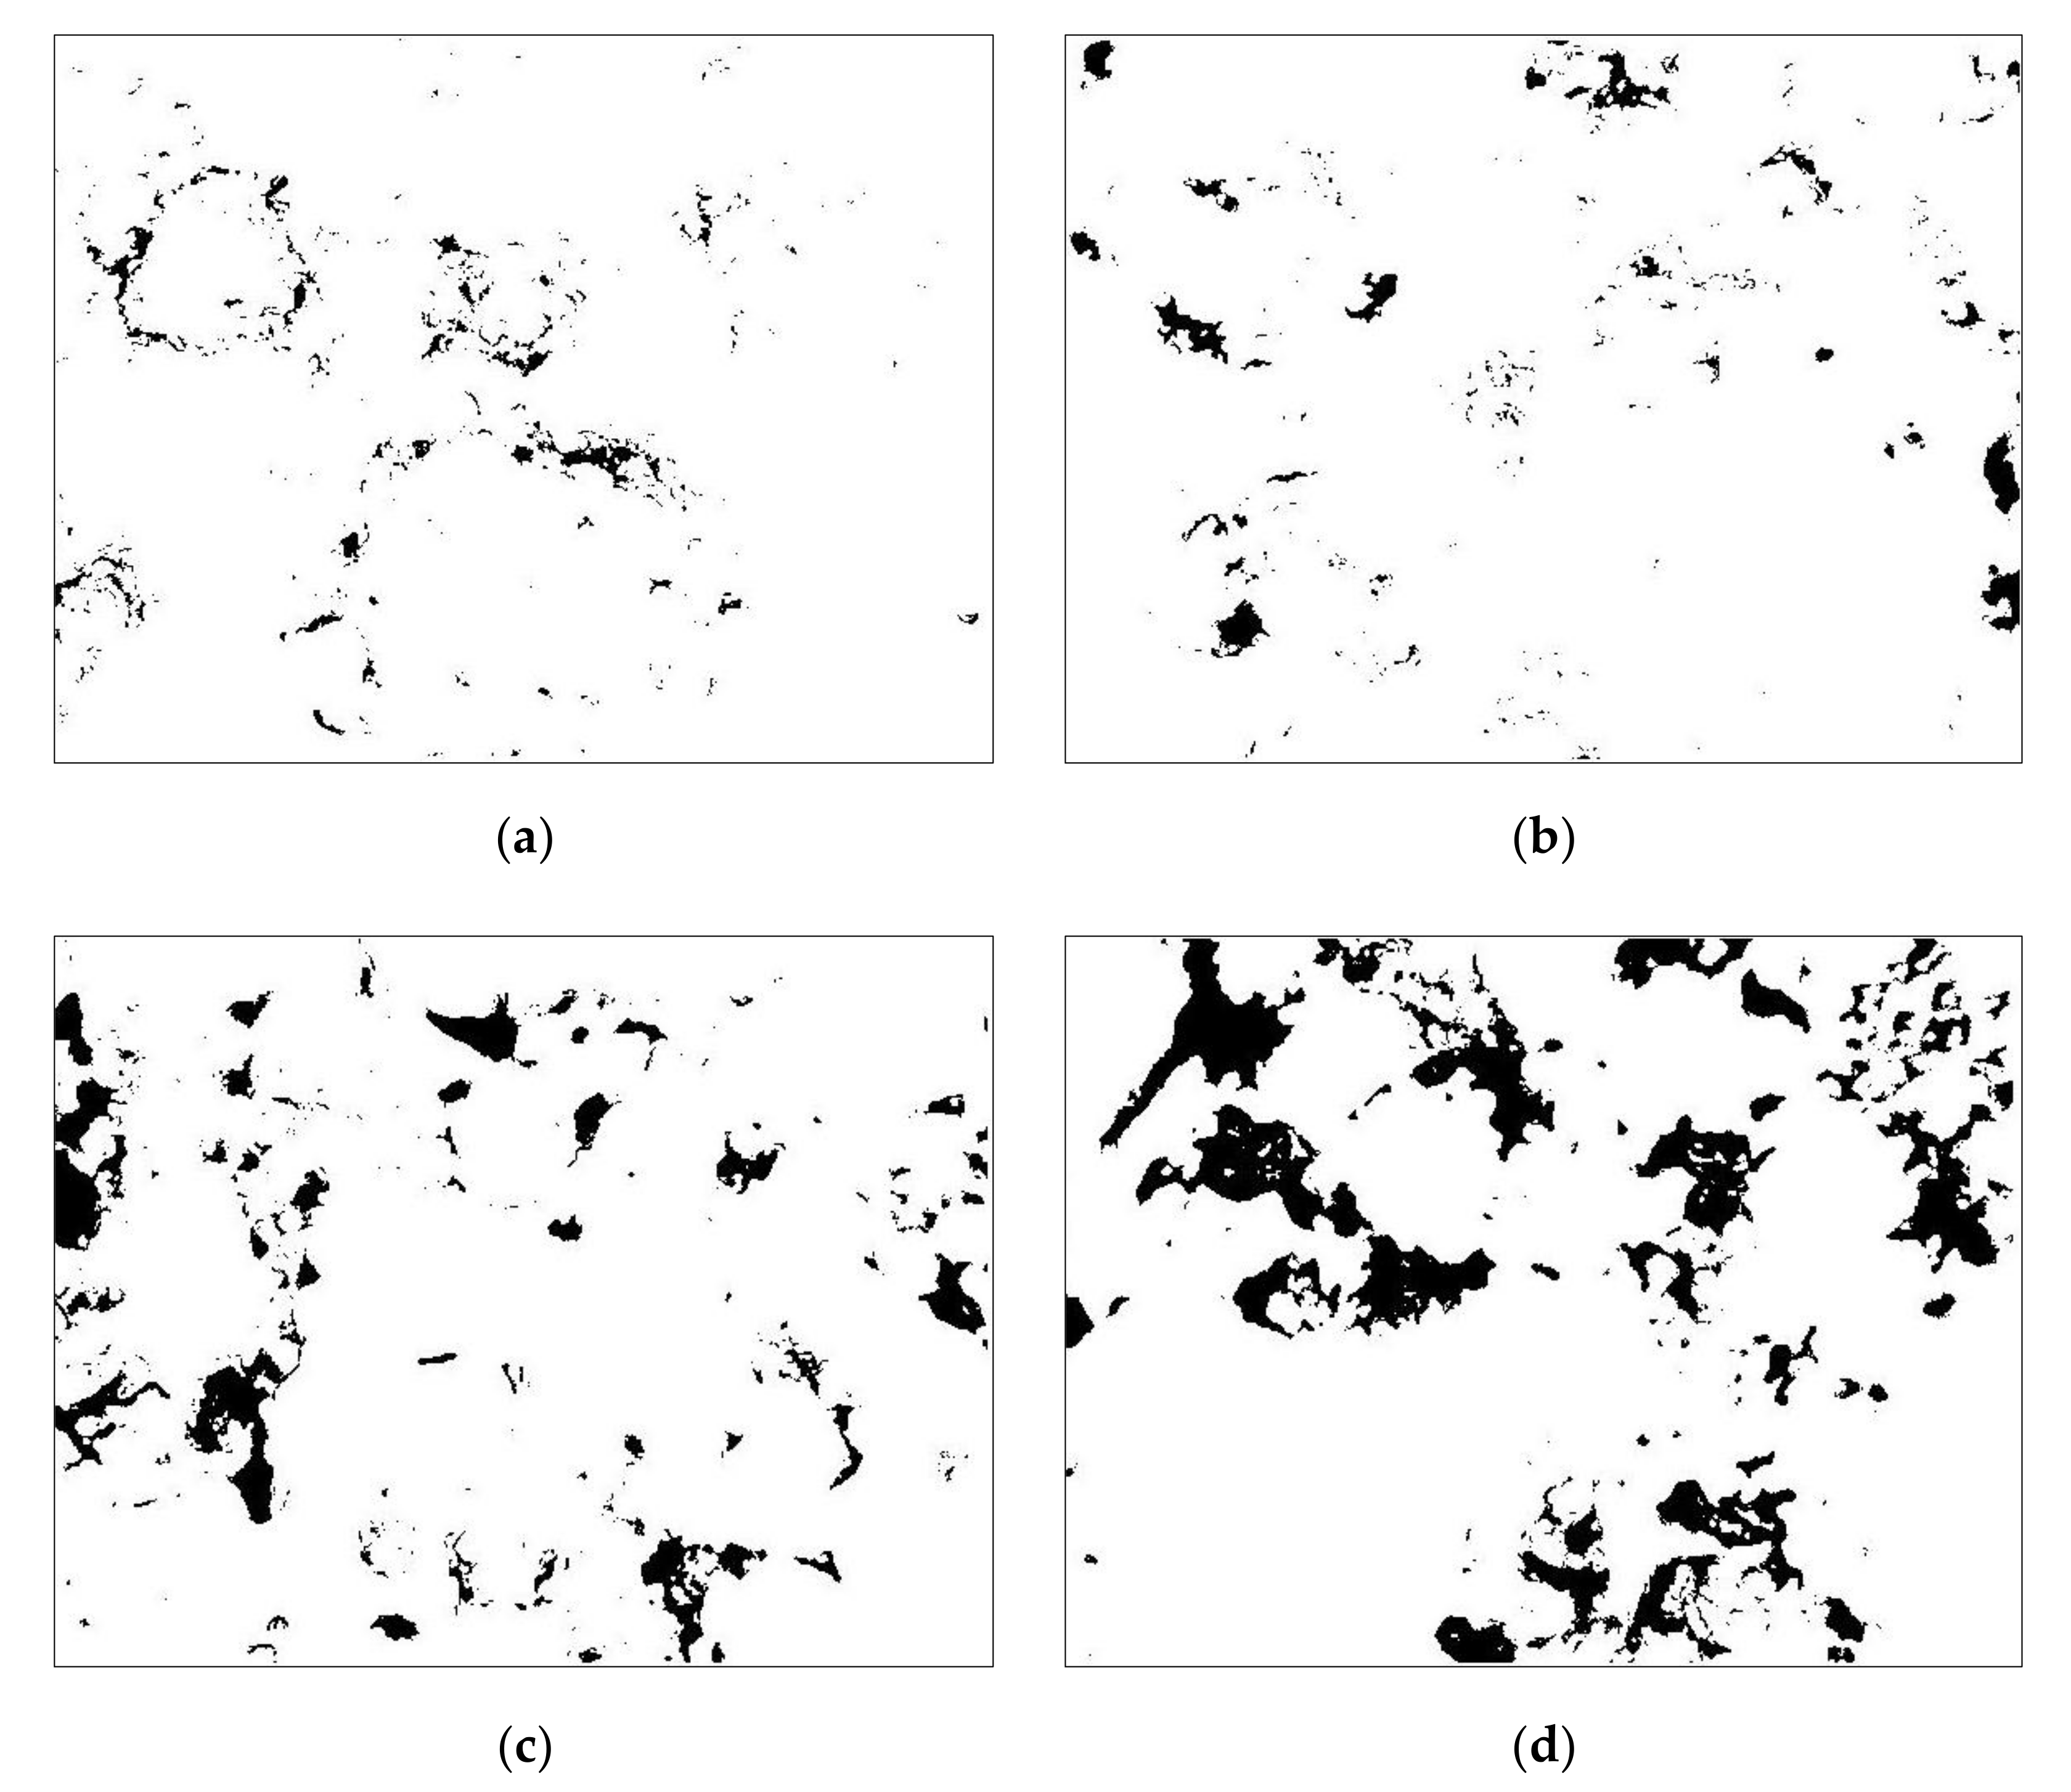
| Time Step | Low Gray Level/ Level 0–85 | Medium Gray Level/Level 86–170 | High Gray Level/ Level 170–256 |
|---|---|---|---|
| First | 0.93% | 44.97% | 54.10% |
| Second | 1.84% | 34.41% | 63.75% |
| Third | 5.37% | 35.85% | 58.78% |
| Fourth | 11.71% | 37.01% | 51.28% |
| # | D-1 | D-2 | D-3 | D-4 | D-5 |
|---|---|---|---|---|---|
| Peak load/Pa | 255.630 5 | 225.563 7 | 146.756 4 | 195.853 1 | 147.642 0 |
| σθmax/σc | 1.57 | 1.29 | 1.69 | 1.35 | 1.59 |
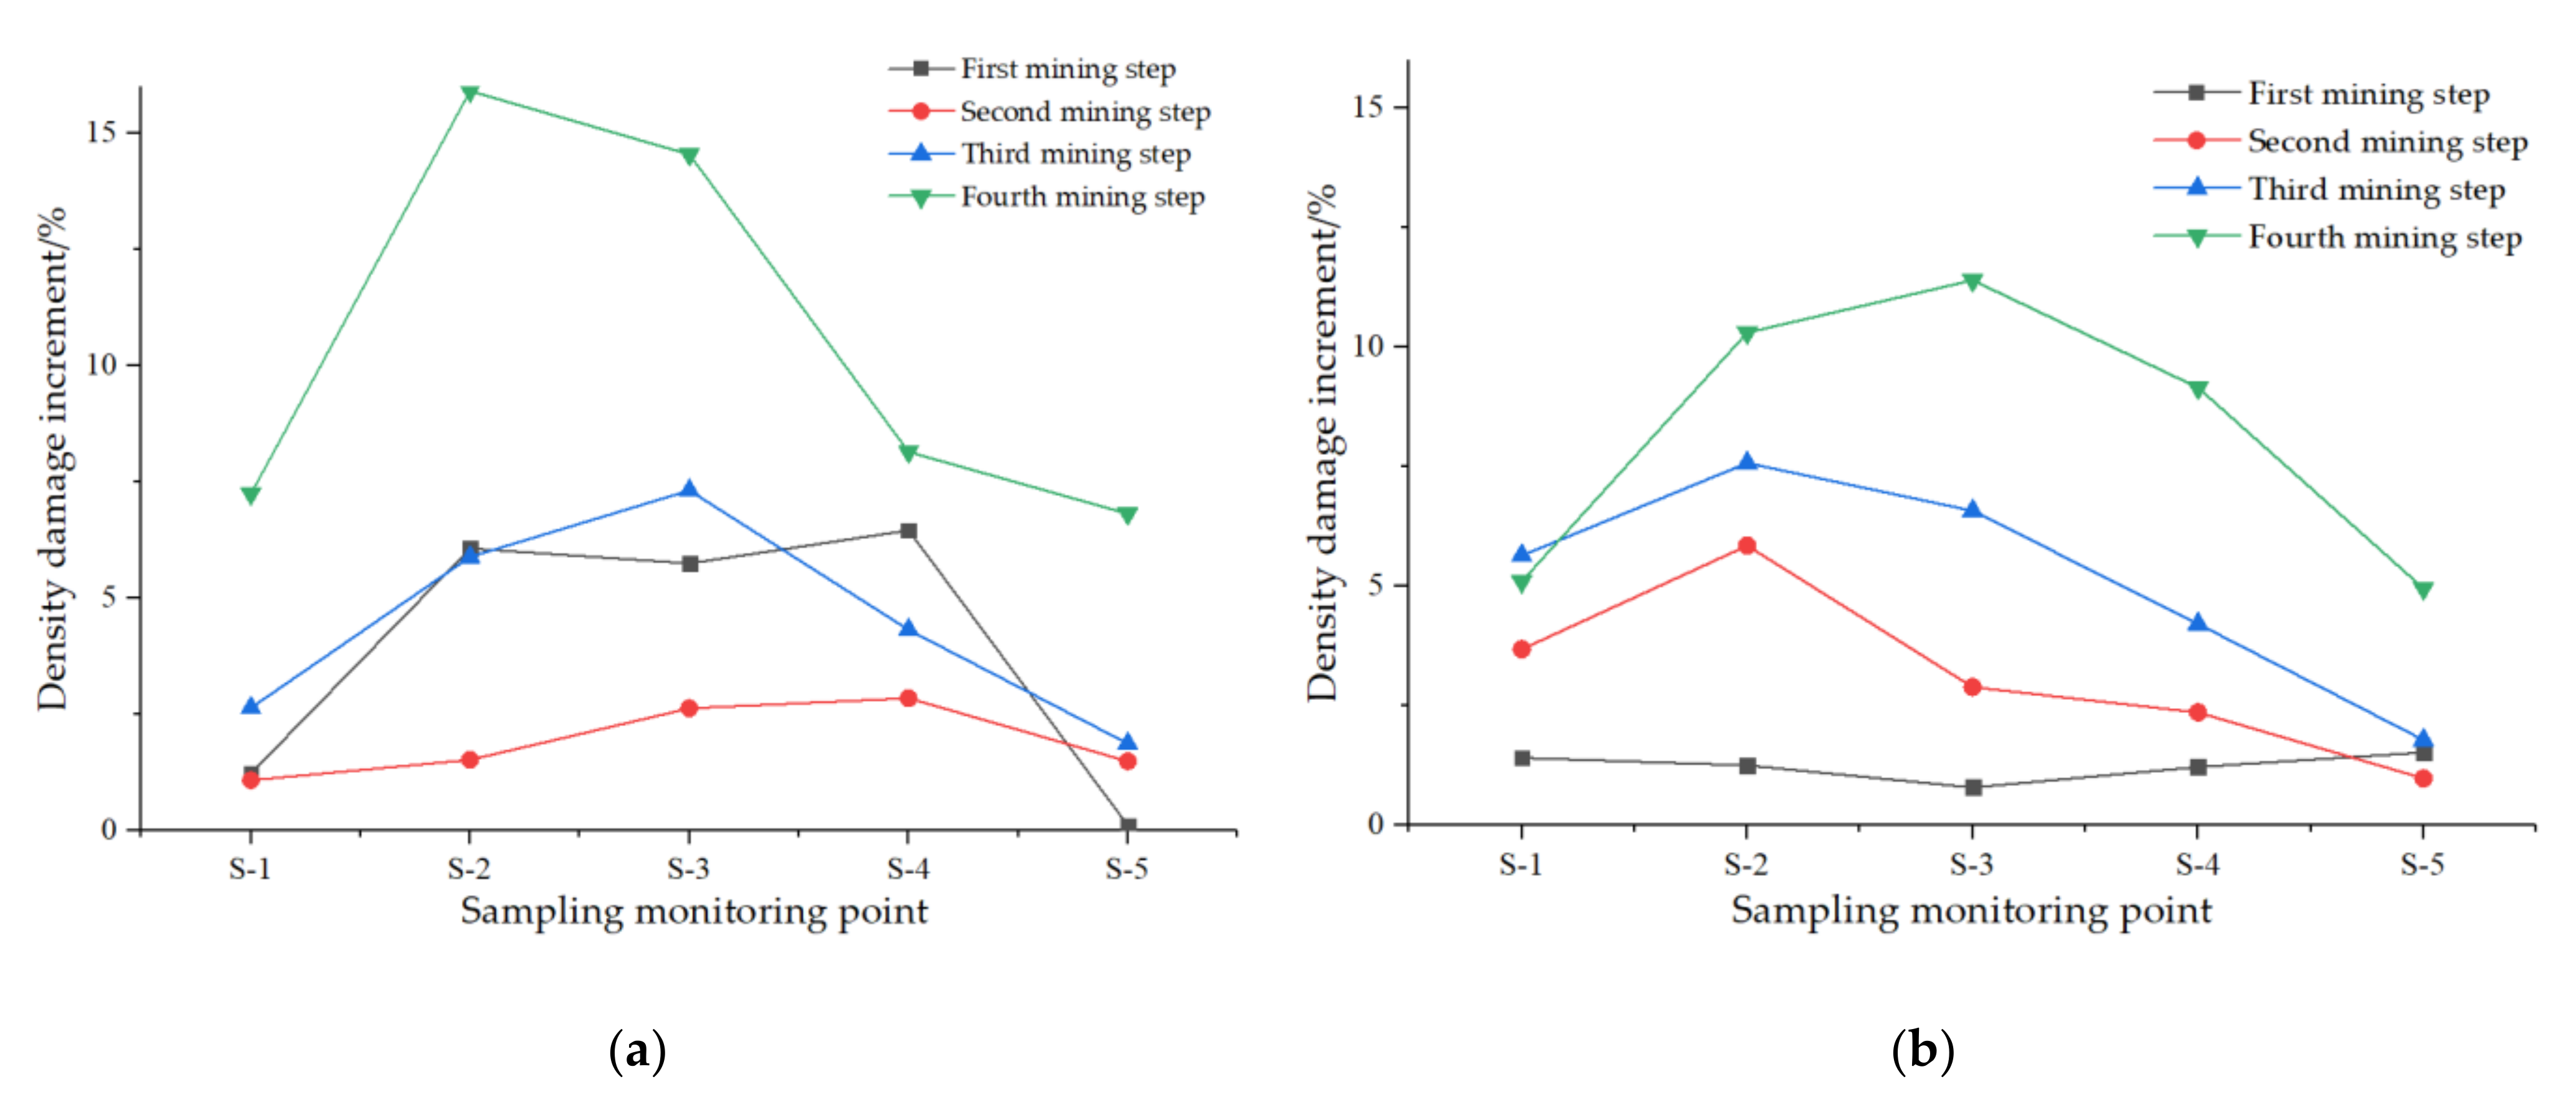
| # | S-1 | S-2 | S-3 | S-4 | S-5 |
| Peak load/Pa | 241.386 9 | 40.3965 8 | 187.357 7 | 206.746 4 | 153.157 1 |
| σθmax/σc | 1.68 | 1.31 | 1.76 | 1.44 | 1.63 |
Publisher’s Note: MDPI stays neutral with regard to jurisdictional claims in published maps and institutional affiliations. |
© 2021 by the authors. Licensee MDPI, Basel, Switzerland. This article is an open access article distributed under the terms and conditions of the Creative Commons Attribution (CC BY) license (https://creativecommons.org/licenses/by/4.0/).
Share and Cite
Shi, Y.; Ye, Y.; Hu, N.; Jiao, Y.; Wang, X. Physical Simulation Test on Surrounding Rock Deformation of Roof Rockburst in Continuous Tunneling Roadway. Minerals 2021, 11, 1335. https://doi.org/10.3390/min11121335
Shi Y, Ye Y, Hu N, Jiao Y, Wang X. Physical Simulation Test on Surrounding Rock Deformation of Roof Rockburst in Continuous Tunneling Roadway. Minerals. 2021; 11(12):1335. https://doi.org/10.3390/min11121335
Chicago/Turabian StyleShi, Yaobin, Yicheng Ye, Nanyan Hu, Yu Jiao, and Xianhua Wang. 2021. "Physical Simulation Test on Surrounding Rock Deformation of Roof Rockburst in Continuous Tunneling Roadway" Minerals 11, no. 12: 1335. https://doi.org/10.3390/min11121335
APA StyleShi, Y., Ye, Y., Hu, N., Jiao, Y., & Wang, X. (2021). Physical Simulation Test on Surrounding Rock Deformation of Roof Rockburst in Continuous Tunneling Roadway. Minerals, 11(12), 1335. https://doi.org/10.3390/min11121335