Article

Use of Temperature Controlled Stage Confocal Raman Microscopy to Study Phase Transition of Lead Dioxide (Plattnerite)

by
Ilaria Costantini
1,*,
Pier Paolo Lottici
2,
Kepa Castro
1 and
Juan Manuel Madariaga
1
1
Department of Analytical Chemistry, Faculty of Science and Technology, University of the Basque Country UPV/EHU, P.O. Box 644, 48080 Bilbao, Basque Country, Spain
2
Department of Mathematical, Physical and Computer Sciences, University of Parma, Parco Area delle Scienze 7/a, 43124 Parma, Italy
*
Author to whom correspondence should be addressed.
Minerals 2020, 10(5), 468; https://doi.org/10.3390/min10050468
Submission received: 15 April 2020 / Revised: 15 May 2020 / Accepted: 19 May 2020 / Published: 21 May 2020
(This article belongs to the Special Issue Historical Mineral Pigments)

Abstract

:
The present work concerns the study of the phase transition of plattnerite [β-PbO2 lead (IV) oxide]-based samples when they are analysed by Raman spectroscopy. The laser-induced degradation process was carried out either on historical painting samples, where plattnerite was present as a degradation product of lead-based pigments, or commercial plattnerite samples as powder and pellets. The Raman spectra of plattnerite taken at low excitation power, to avoid phase transformations, are reported up to low wavenumbers, and they were characterized by the features at 159, 380, 515 and 653 cm−1 and a shoulder at 540 cm−1. The degradation of plattnerite was induced by increasing the laser power on the sample, and the formation of its secondary products red lead (Pb3O4), litharge (α-PbO) and massicot (β-PbO), when varying the laser power, is discussed. The analyses were performed in a controlled condition by coupling the Raman spectrometer to a temperature-controlled stage (Linkam THMS600- Renishaw), which allows for varying the sample temperature (from room temperature up to 600 °C) and keeping it constant inside the stage during the analysis. In this way, commercial plattnerite samples were heated by increasing the cell temperature to verify the temperature range at which the phase transitions of lead dioxide occur. In addition, thanks to the construction of temperature ramps, all the degradation pathways were shown, and other lead compounds were identified, generated by the laser power contribution. A different behaviour was found between pigments from historical painting samples and commercial samples under the effect of the laser. This information could be useful in order to recognize their nature when they are found in cultural heritage materials.

1. Introduction

In the field of diagnostics of cultural heritage, the lead compound plattnerite [β-PbO2, lead (IV) oxide] is known as a secondary product of lead-based pigments, white lead [2PbCO3·Pb(OH)2] and red lead (Pb3O4), widely employed since medieval times for the realisation of artworks. The tendency towards blackening when the lead pigments are used on wall paintings, with a negative effect on the correct appreciation of the artwork, has been largely studied [1,2,3,4,5]. Indeed, several researchers have shown that its formation on mural paintings is closely related to the formation of other lead compounds, such as anglesite (PbSO4), scrutinyite (α-PbO2), cerussite (PbCO3) and lead-magnesium carbonate [PbMg(CO3)2] [6,7]. This phenomenon is linked to different intrinsic and extrinsic factors related to each other, such as the manufacturing process of the pigment [8] and especially the environmental conditions in which the wall paintings are preserved. The formation of plattnerite has been documented under certain conditions of humidity, light and temperature [9], and in the presence of an alkaline environment, microorganisms [10,11,12], natural inorganic salts and synthetic salts [6], acidic pollutants (SOx, but also CO2) [1,13] or chlorine compounds [2].
Since it has been mainly studied as a degradation product, plattnerite has received less attention than common lead pigments, and only in one case has it been reported as pigment [14]. Although plattnerite can be detected even with portable Raman instrumentation [15], its identification can be difficult compared to common lead pigments, since it presents a very weak Raman scattering with a poorly defined broad main band. Besides, as plattnerite is black, it absorbs most of both the incident and scattered radiation. In addition, it is also highly unstable under the laser due to the heating effect. It has been shown that if the laser power is not kept sufficiently below some threshold, depending on the laser wavelength and the morphology at the analysed point, degradation phenomena may be triggered in plattnerite samples during Raman analyses, with the consequent formation of secondary products [16]. A colour change in the point of analysis from black to red/orange has also been reported [16]. For this reason, in some cases incorrect assignments have been made [17] due to the sensitivity of the plattnerite during Raman analysis, demonstrating the need to pay attention during the analysis of lead compounds [18]. In the study of De Santis et al. [19], the presence of plattnerite, coming from white lead, was indirectly demonstrated through its laser degradation to massicot.
In recent years, many studies have been carried out on different metal oxides in order to investigate their behaviour under laser irradiation in different fields of research, ranging from microelectronics to medicine. The investigation of Vila et al. [20] showed the α-Bi2O3 to δ-Bi2O3 phase transformation by laser irradiation in ceramic samples and single crystal nanowires of this oxide, which is of interest to electronic and optoelectronic applications. In this work, the threshold power densities necessary to induce the chemical transformation were determined by micro-Raman spectroscopy.
Another study reported by Camacho-López et al. [21] showed for the first time the transition threshold for the phase transformation from m-MoO2 to α-MoO3, by means of in-situ micro Raman spectroscopy. On the other hand, a study of the anatase (β-TiO2) to rutile (α-TiO2) transition induced by laser irradiation of TiO2 nanoparticles was carried out by Cristian Vásquez et al. [22]. The kinetics of this process were investigated as a function of the dopant (Al or Fe) on the TiO2 nanoparticles, its concentration, and the irradiation conditions.
One of the most complete studies on the behaviour of the plattnerite under the laser effect of a Raman spectrometer was conducted by Burgio et al. [16], in which they demonstrated the sensitivity of β-PbO2 when it is irradiated with varying laser power and with different wavelengths. During the Raman analyses, the degradation of plattnerite was demonstrated with the formation of its secondary products, red lead (Pb3O4), litharge (α-PbO) and massicot (β-PbO). However, keeping the laser power low enough, it is possible to obtain from the Raman spectrum of β-PbO2 that it is characterised by three bands at 653, 515 and 424 cm−1, identified as deriving from the B2g, A1g and Eg modes, by analogy with the corresponding isostructural SnO2 modes located at 776, 634 and 475 cm−1. Recently, in one of our works the presence of another band at 159 cm−1 was proposed as belonging to β-PbO2, since it has been identified both in commercial and in mineral plattnerite using Raman lasers at different excitation wavelengths (632 and 532 nm) [23].
According to Burgio et al. [16], the degradation of β-PbO2, caused by the effect of the laser power during Raman analyses, occurs following the path: β-PbO2 → Pb3O4 → α-PbO → β-PbO. In addition, another lead oxide (PbO1.55) was identified during the experiments whose spectrum differs from that of the other secondary products (red lead, litharge and massicot) of plattnerite. Previous thermogravimetric studies attempted to characterise compounds of intermediate stoichiometry during the decomposition process from β-PbO2 to Pb3O4, defining the temperature at which the phase change occurs as >375 °C. [24]. However, the results of this research were not considered totally satisfactory due to the influence of atmospheric agents, the heating rate of the sample, and the quenching procedure adopted at any particular temperature to obtain an intermediate phase at room temperature [16]. The temperature of the phase transition from β-PbO2 to Pb3O4 was confirmed by Greenwod et al. [25], according to whom lead dioxide decomposes upon heating in air as follows: β-PbO2 → Pb12O19 → Pb12O17 → Pb3O4 → PbO, where the first step occurs at 290 °C, the second at 350 °C, the third at 375 °C and the last one at 600 °C.
On the other hand, some studies show that the chromatic variation of pigments due to the laser effect on easel and wall paintings can be opportunely used for laser cleaning operations, although the presence of a binder and the mixtures of pigments may affect the result [26,27,28,29]. Concerning the chromatic reconversion of lead-based pigments, preliminary studies on both pure plattnerite powder samples and darkened red lead paint samples were proposed for the restoration of darkened red lead-containing paintings by a laser-induced photo-thermal reduction [30].
In this work, analyses varying the laser power were performed on a sample from a late medieval pictorial cycle preserved in the church of Santo Stefano of Montani (Bolzano, Italy), which consists of a mixture of plattnerite and scrutynite, present as a degradation product coming from red lead. During Raman analyses, the formation of degradation products coming from β-PbO2, generated by laser power, was noted to be similar to what is reported in the literature about the behaviour of the commercial product. Therefore, to better understand the behaviour of plattnerite and of lead-based pigments in general under laser excitation, analyses were performed by Raman spectroscopy, varying the incident light power on powders of commercial plattnerite and lead oxides (red lead, massicot and litharge), and these were compared with those from the wall paintings samples. Subsequently, commercial plattnerite was analysed in the form of pellets using a temperature-controlled stage (Linkam THMS600-Renishaw, Linkam Scientific Instruments Ltd., Waterfield, UK), with the aim of determining the temperature range at which the phase transition of plattnerite occurs. The temperature-controlled stage was used in order to show the gradual degradation of plattnerite and the formation of the secondary products during the Raman analyses. This methodology has been applied in other investigations for the study of materials belonging to cultural heritage [31,32], and has been used on lead compounds [33] in which stability with temperature was required during Raman analyses.

2. Experiment

2.1. Materials

A sample (FR1) belonging to frescoes preserved in the church of Santo Stefano in Montani was analysed by varying the laser power. In this sample, plattnerite was present as a degradation product of lead pigments, together with the alpha form scrutinyite. The temperature tests were also applied on samples of commercial plattnerite (C-P1, C-P2, C-P3, Sigma-Aldrich, 99% pureness), both in the form of powder and of pellets to avoid variations due to the orientation of the grains of this lead dioxide. In addition, commercial powder samples of lead oxide, α-PbO (sample C-αP, Aldrich, +99.9% pureness), β-PbO (sample C-βP, Kremer Pigmente 43010) and Pb3O4 (sample C-RL1 and C-RL2, Kremer Pigmente 42500), were analysed to verify their stability at high temperatures. All commercial samples were analysed in powder form, taking a small amount from the commercial container, and these were placed above a glass sample holder (26 × 76 × 1 mm). The plattnerite samples (C-P4, C-P5, C-P6), analysed by means of thermal cell, were prepared in the form of pellets and placed on a circular glass coverslip (13 × 0.1 mm), which sat directly on a heating plate through which heat was propagated to the samples.
For the realisation of pellets, commercial plattnerite powders were weighed, aggregated, and mixed with 30% potassium bromide thoroughly in an agate mortar, to obtain homogenous mixtures with total weight of 0.2 g. The mixed compounds were then placed in a cylindrical die to form pellets, applying a pressure of 7 tn/m2 for 5 min.

2.2. Laboratory Instrumentation

2.2.1. Raman Spectroscopy

Horiba Jobin Yvon LabRam micro-spectrometer

The micro-Raman measurements were carried out with a 633 nm laser in a nearly backscattered geometry using a Horiba Jobin Yvon LabRam micro-spectrometer (Horiba, Kyoto, Japan) (300 mm focal length) equipped with an integrated Olympus BX40 microscope (Olympus Corporation, Tokyo, Japan). The spectral resolution was about 1.5 cm−1. The Rayleigh radiation was blocked by a holographic edge filter and the backscattered Raman light was dispersed by an 1800 lines/mm holographic grating on a Peltier cooled CCD (charge-coupled device), consisting of an array of 1024/256 pixels. The entrance slit width was fixed at 100 μm. The laser power on the samples was adjusted by means of density filters from D2 (~0.1 mW) to D0 (~10 mW). Raman spectra were collected at very low laser power (<0.1 mW) in order to avoid photo-thermal effects on the samples induced by the laser excitation, or at varying powers to check the thermal behaviour of the pigments. The spectra were collected using an Olympus 50 × ultra-long working distance (MSPlan ULWD numerical aperture 0.55) microscope objective. The minimum theoretical spot diameter for 633 nm excitation laser, using the Olympus 50 × objective, is 1.5 μm. The power density (W/cm2) of the laser beams calculated for all density filters was 5.6 × 10⁵ (D0.0), 2.8 × 10⁵ (D0.3), 1.4 × 10⁵ (D0.6), 5.6 × 10⁴ (D1), and 5.6 × 10³ (D2).
The system was regularly calibrated using the 520.6 cm−1 Raman band of silicon. The data analysis was performed by LABSPEC 5.78.24, Jobin Yvon Horiba, built-in software package.

Renishaw InVia Raman spectrometer

Lead oxides samples were analysed using a Renishaw InVia Raman spectrometer (Renishaw, Wotton-under-Edge, Gloucestershire, UK UK), coupled to a Leica DMLM microscope (Leica, Wetzlar, Germany). The spectra were acquired with the 20× N Plan EPI (0.40 aperture) and Leica 5× N Plan (0.12 aperture) objectives. The minimum theoretical spot diameters using the 785 nm laser were, for the 20 × N Plan EPI and Leica 5× N Plan, 2.39 μm and 7.98 μm, respectively. The power density (W/cm2) of the laser beams calculated for all laser powers for the 5× N Plan objective were: 6 × 10⁵ (100%), 3 × 10⁵ (50%), 6 × 10⁴ (10%), 3 × 10⁴ (5%), 6 × 10³ (1%), 3 × 10³ (0.5%), 6 × 10² (0.1%), 3 × 10² (0.05%). For the 20× N Plan EPI objective, they were: 6.6 × 10⁶ (100%), 3.3 × 10⁶ (50%), 6.6 × 10⁵ (10%), 3.3 × 10⁵ (5%), 6.6 × 10⁴ (1%), 3.3 × 10⁴ (0.5%), 6.6 × 10³ (0.1%), 3.3 × 10³ (0.05%). For focusing on and searching for points of interest, the microscope implements a motorised stage (XYZ). A 785 nm diode pumped solid state Nd:YAG (neodymium-doped yttrium aluminium garnet) laser was used in all measurements with 50 mW nominal power at source. Normally, 10–300 scans, each lasting 1–20 s, are accumulated to achieve a suitable signal-to-noise enhancement at an operating spectral resolution of ≤1 cm−1. Some Raman measurements were also performed with the 633 nm laser. The minimum theoretical spot diameter using the 633 nm laser was, for the 20× N Plan EPI and Leica 5× N Plan objectives, 1.931 μm and 6.436, μm respectively. In this case the power density (W/cm2) of the laser beams calculated for the 5 × N Plan objective were: 5.2 × 10⁴ (100%), 2.6 × 10⁴ (50%), 5.2 × 10³ (10%), 2.6 × 10³ (5%), 5.2 × 10² (1%), 2.6 × 10² (0.5%), 5.2 × 101 (0.1%), 2.6 × 101 (0.05%). For the 20× N Plan EPI objective, they were: 5.8 × 10⁵ (100%), 2.9 × 10⁵ (50%), 5.8 × 10⁴ (10%), 2.9 × 10⁴ (5%), 5.8 × 10³ (1%), 2.9 × 10³ (0.5%), 5.8 × 10² (0.1%), 2.9 × 10² (0.05%).
For the variable-temperature analysis, the InVia Renishaw Raman microscope system was equipped with a T95 temperature controller. This is a complete system providing high precision and stability temperature control for Linkam thermal cell (model THMS600), were the pellets of plattnerite were placed. The T95 can be programmed with up to 100 different temperature ramps, and can also be supplied with the standalone touch sensitive LinkPad controller. The THMS600 freezing–heating stage can be operated over a temperature range of −196 to +600 °C. For temperatures above 300 °C, a water circulation pump was used to cool the stage. The temperature stability was <0.1 °C. The analyses were carried out programming temperature ramps where Raman spectra were collected every 5 °C, starting from a temperature of 50 °C. The ramp was set so that in one minute it got an increase of 20 °C. The hold temperature was kept constant for two minutes before taking measurements. All Raman spectra collected during the experiments with the thermal cell were acquiring using 300 scans, each lasting 1 s.

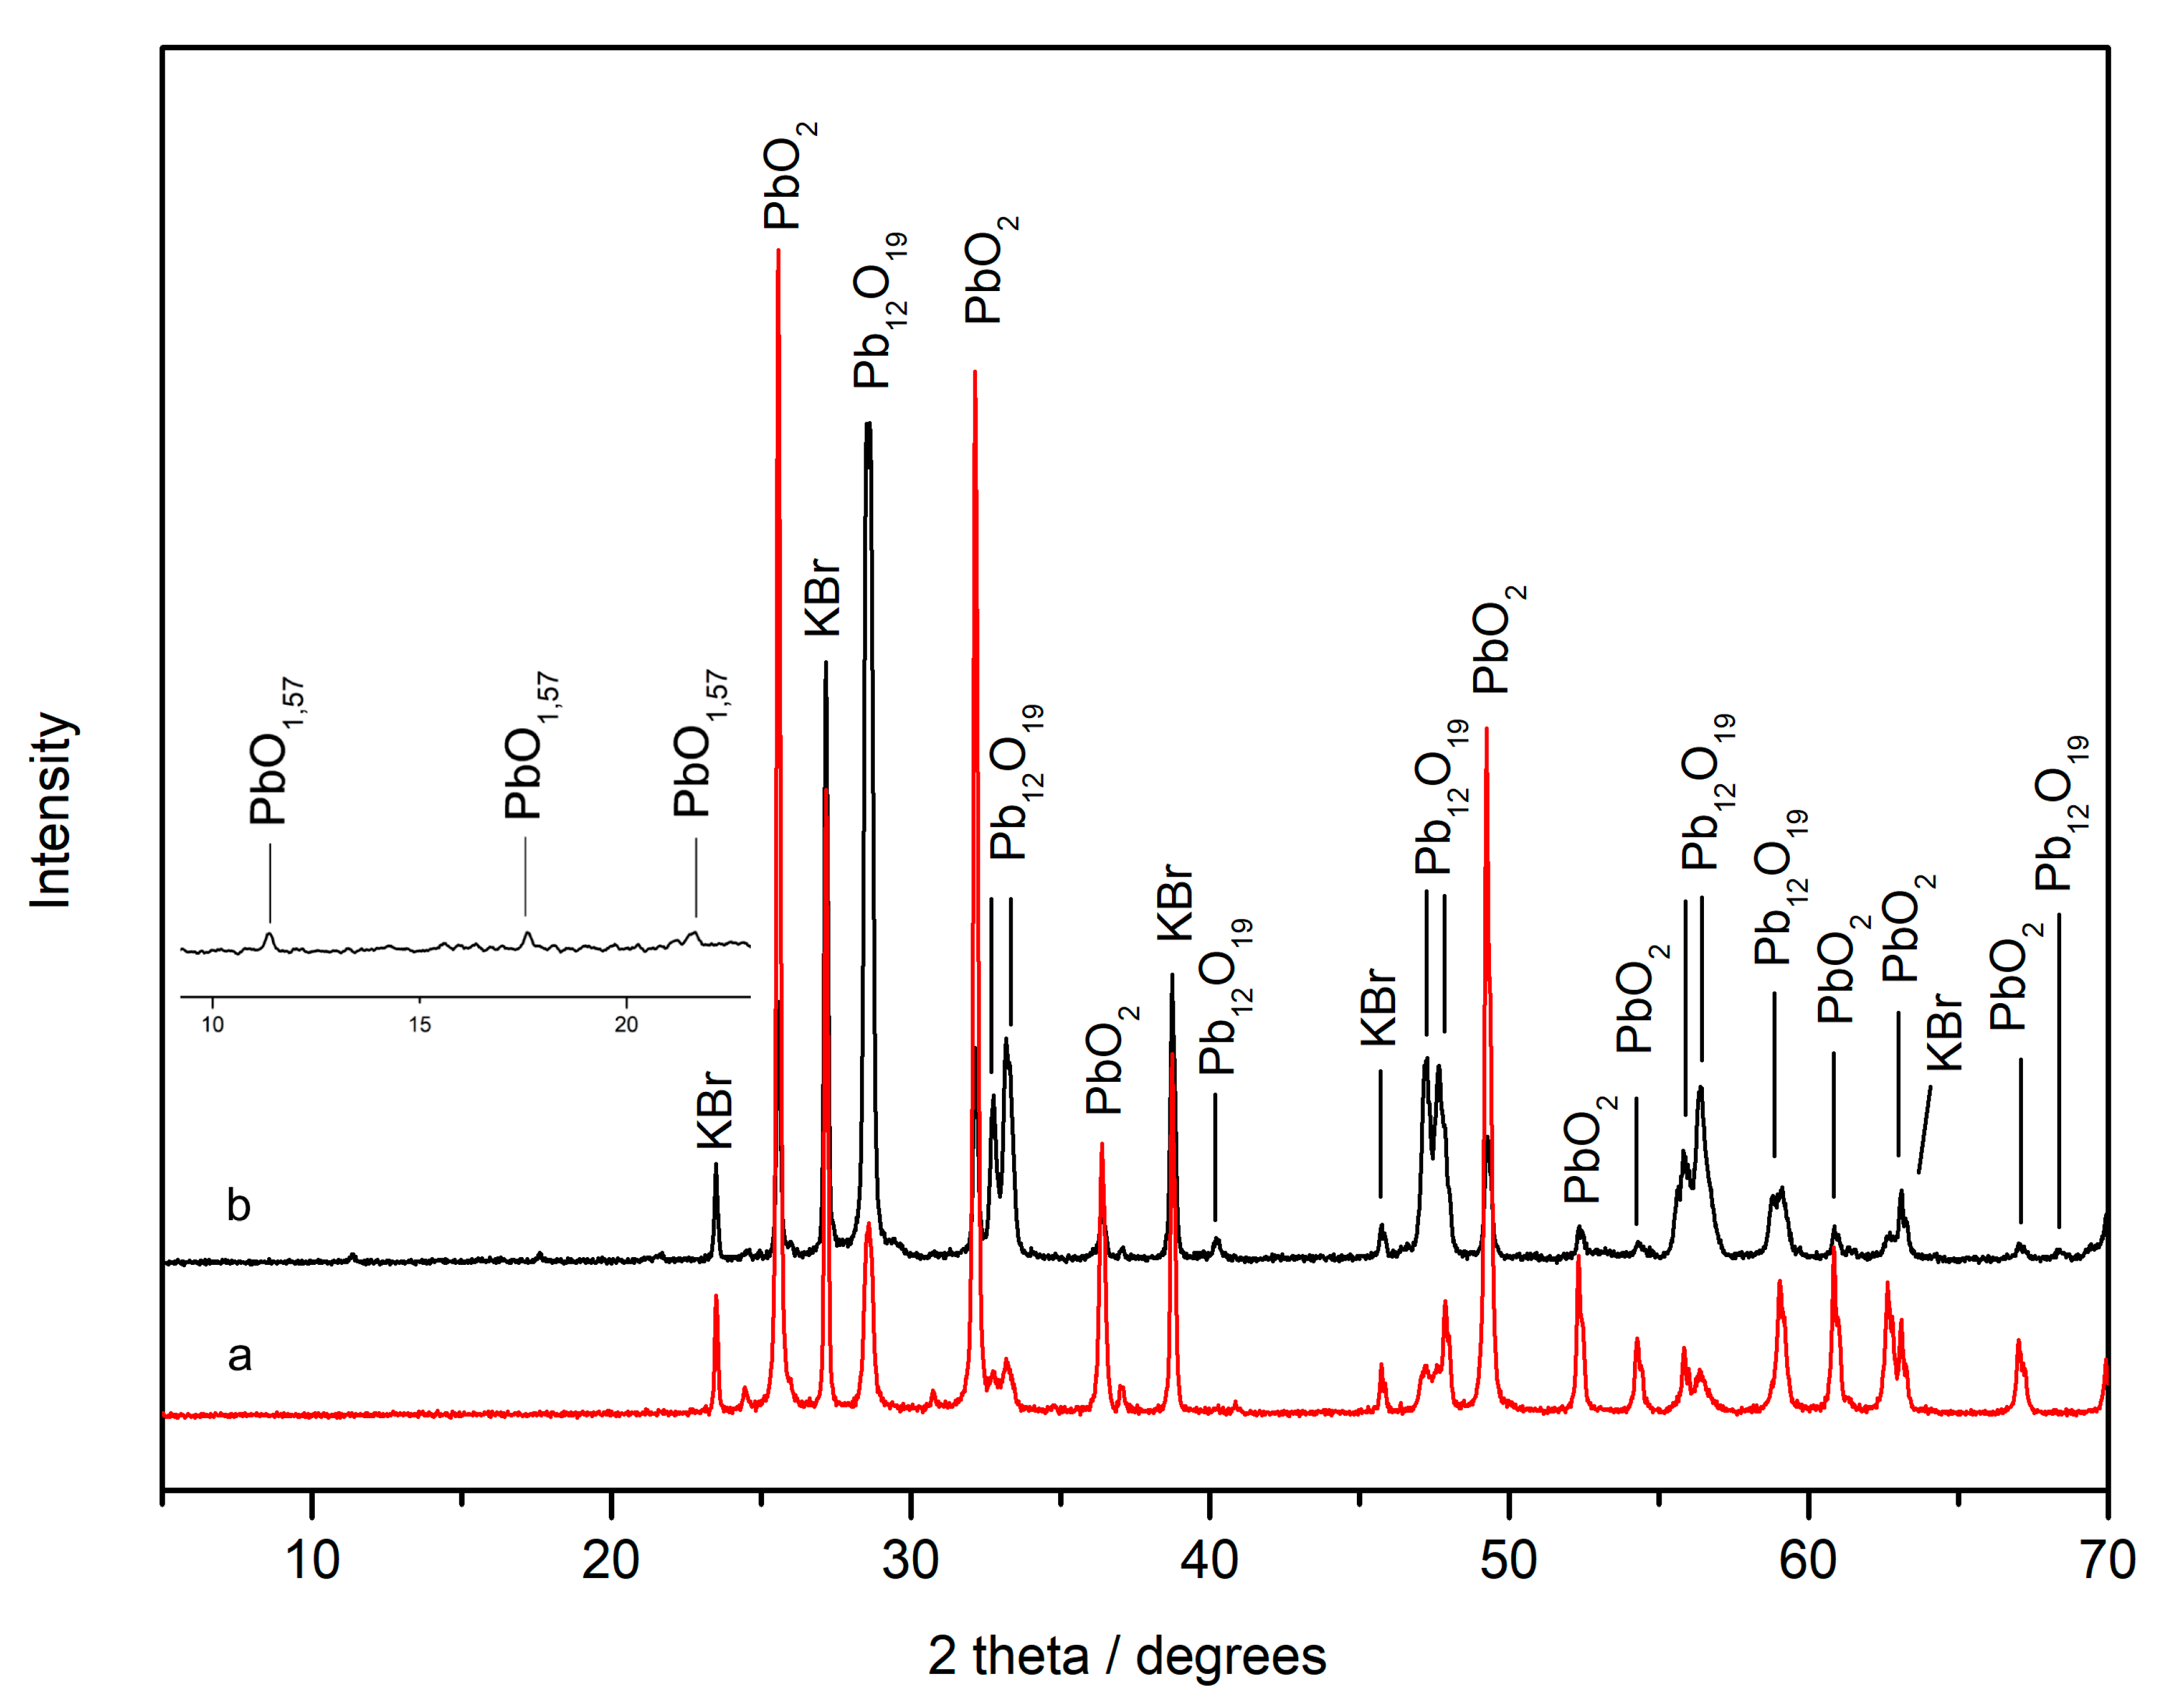
2.2.2. PANalytical Xpert PRO Diffractometer

Powdered pure plattnerite was also analysed by Powder X-ray diffraction (PXRD), on a PANalytical Xpert PRO diffractometer (Philips, Amsterdam, The Netherlands), equipped with copper tube (Cu-Kα λ = 1.5418 Å), vertical goniometer (Bragg-Brentano), programmable divergence slit, automatic sample exchanger, secondary graphite monochromator and PixCel detector. The measurement conditions were 40 KV and 40 mA, over 2θ range from 5° to 70°.

3. Results and Discussion

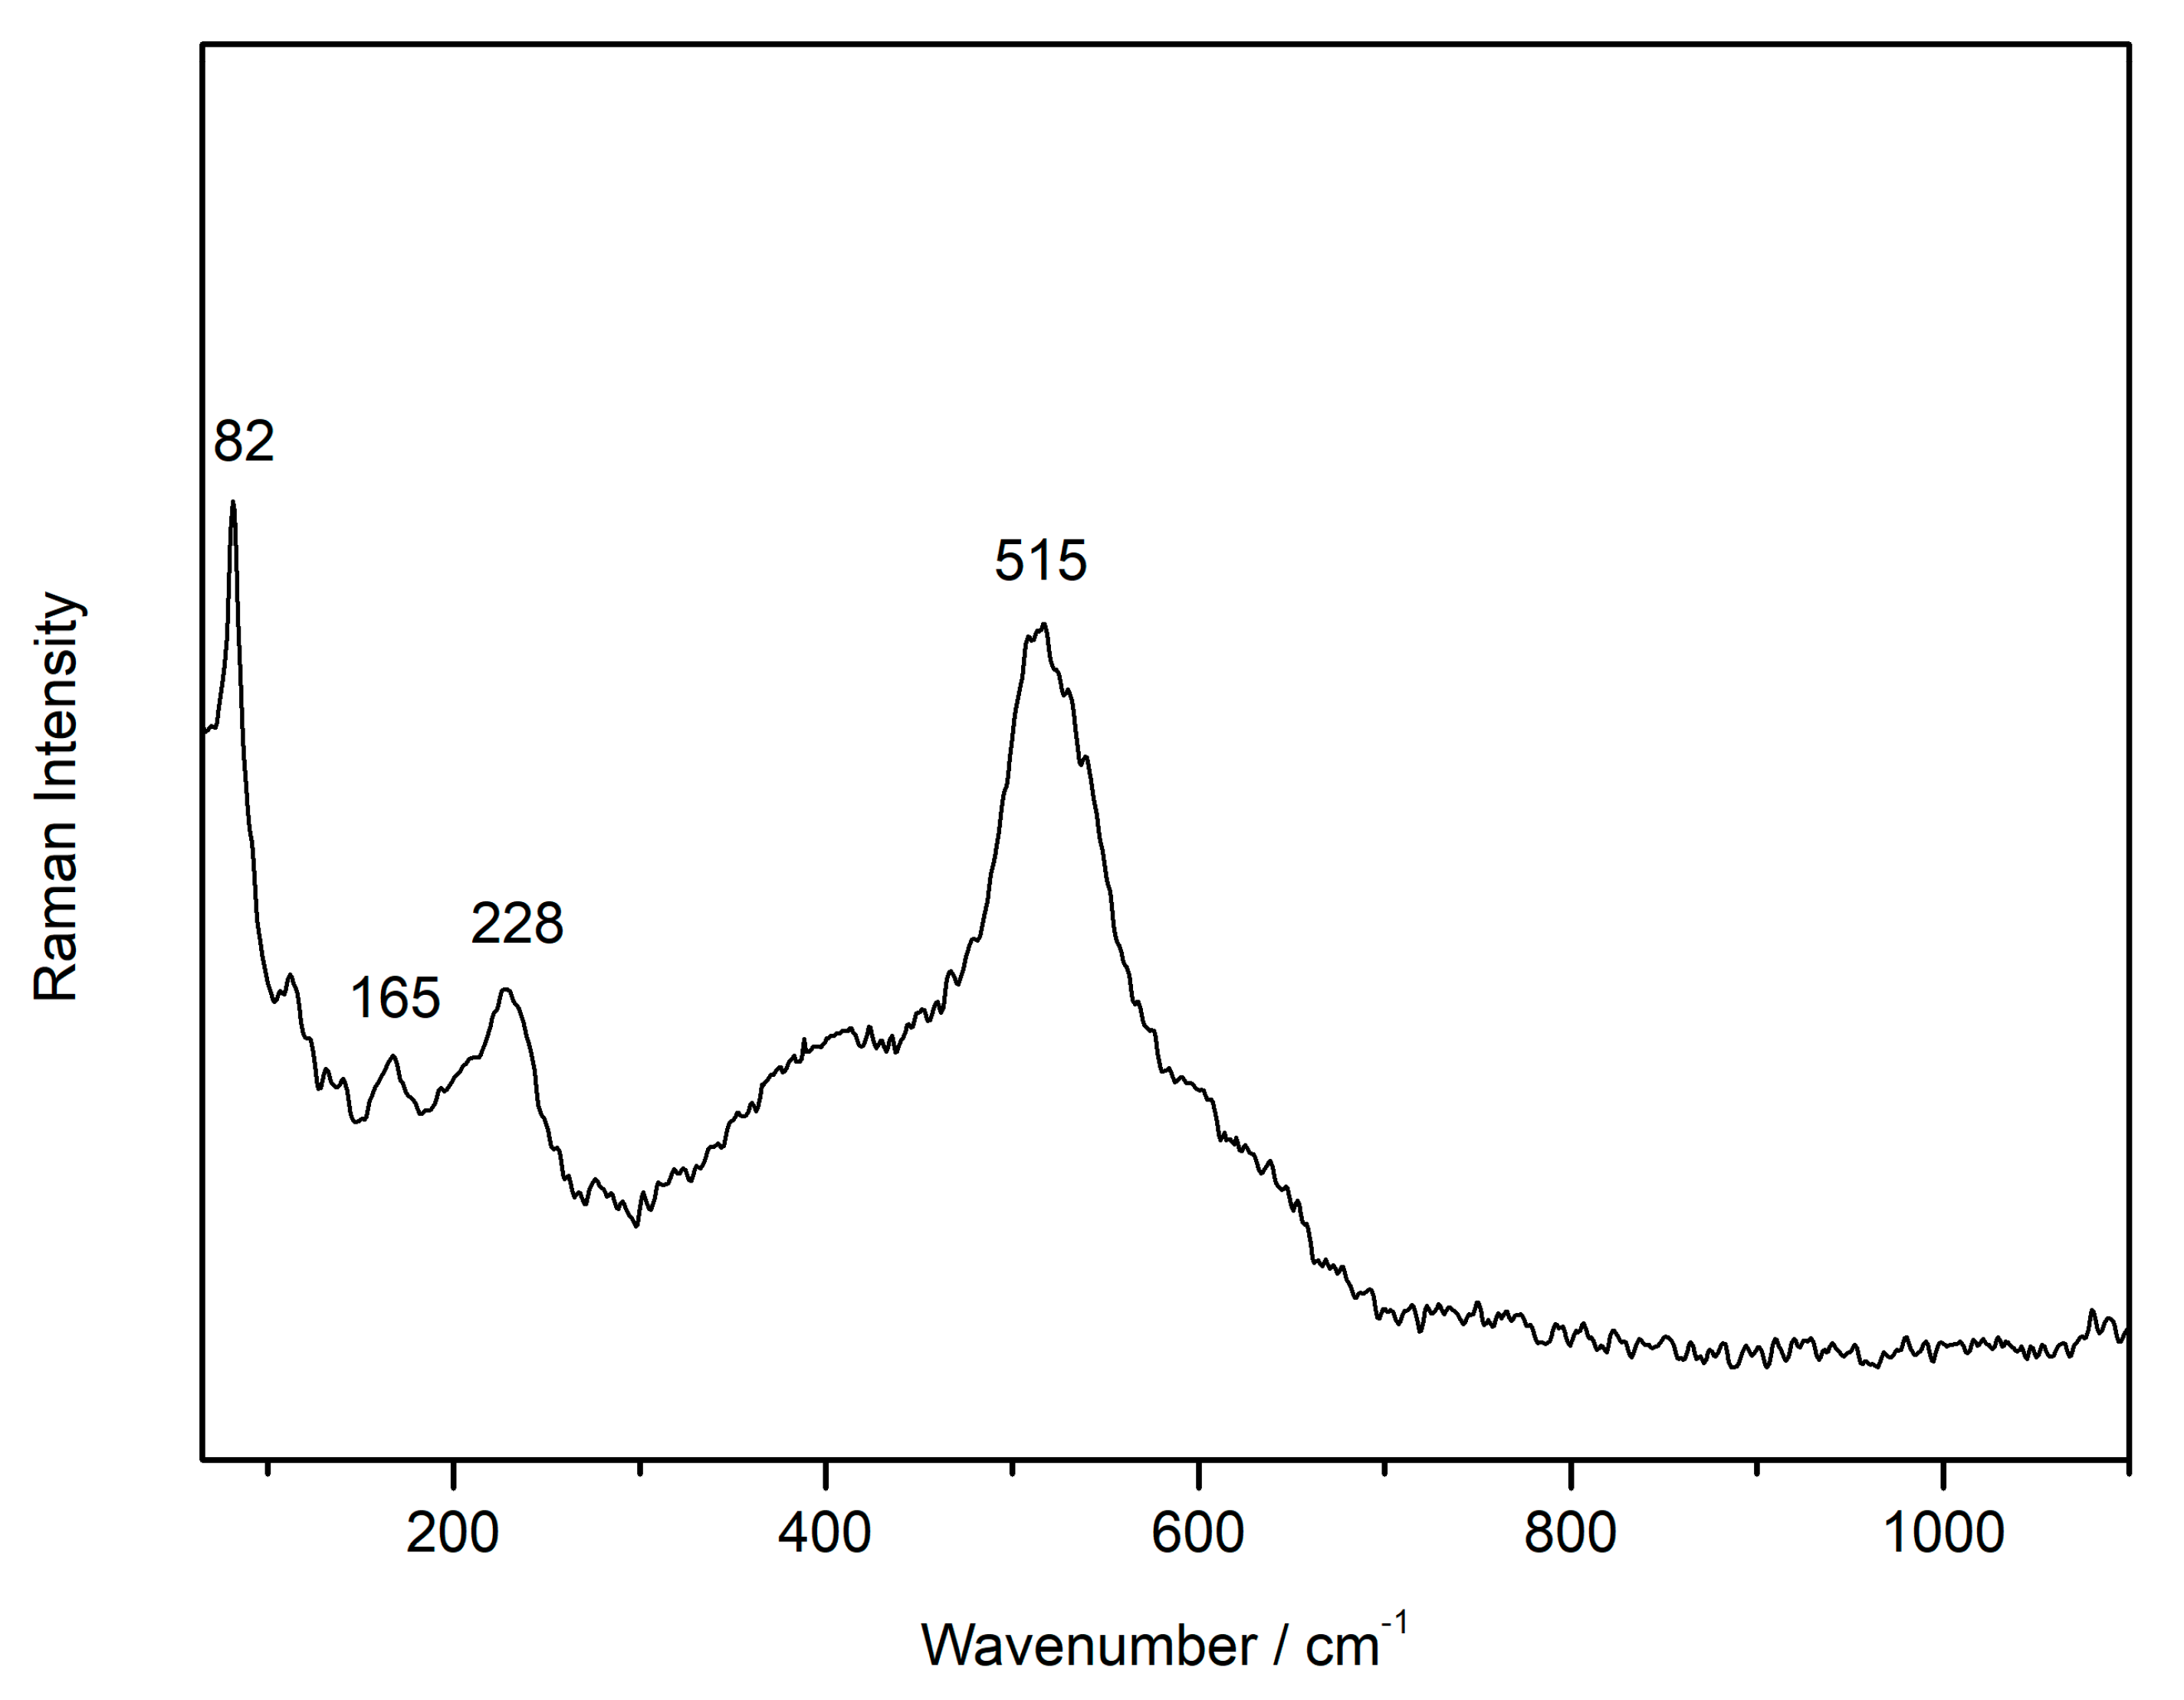
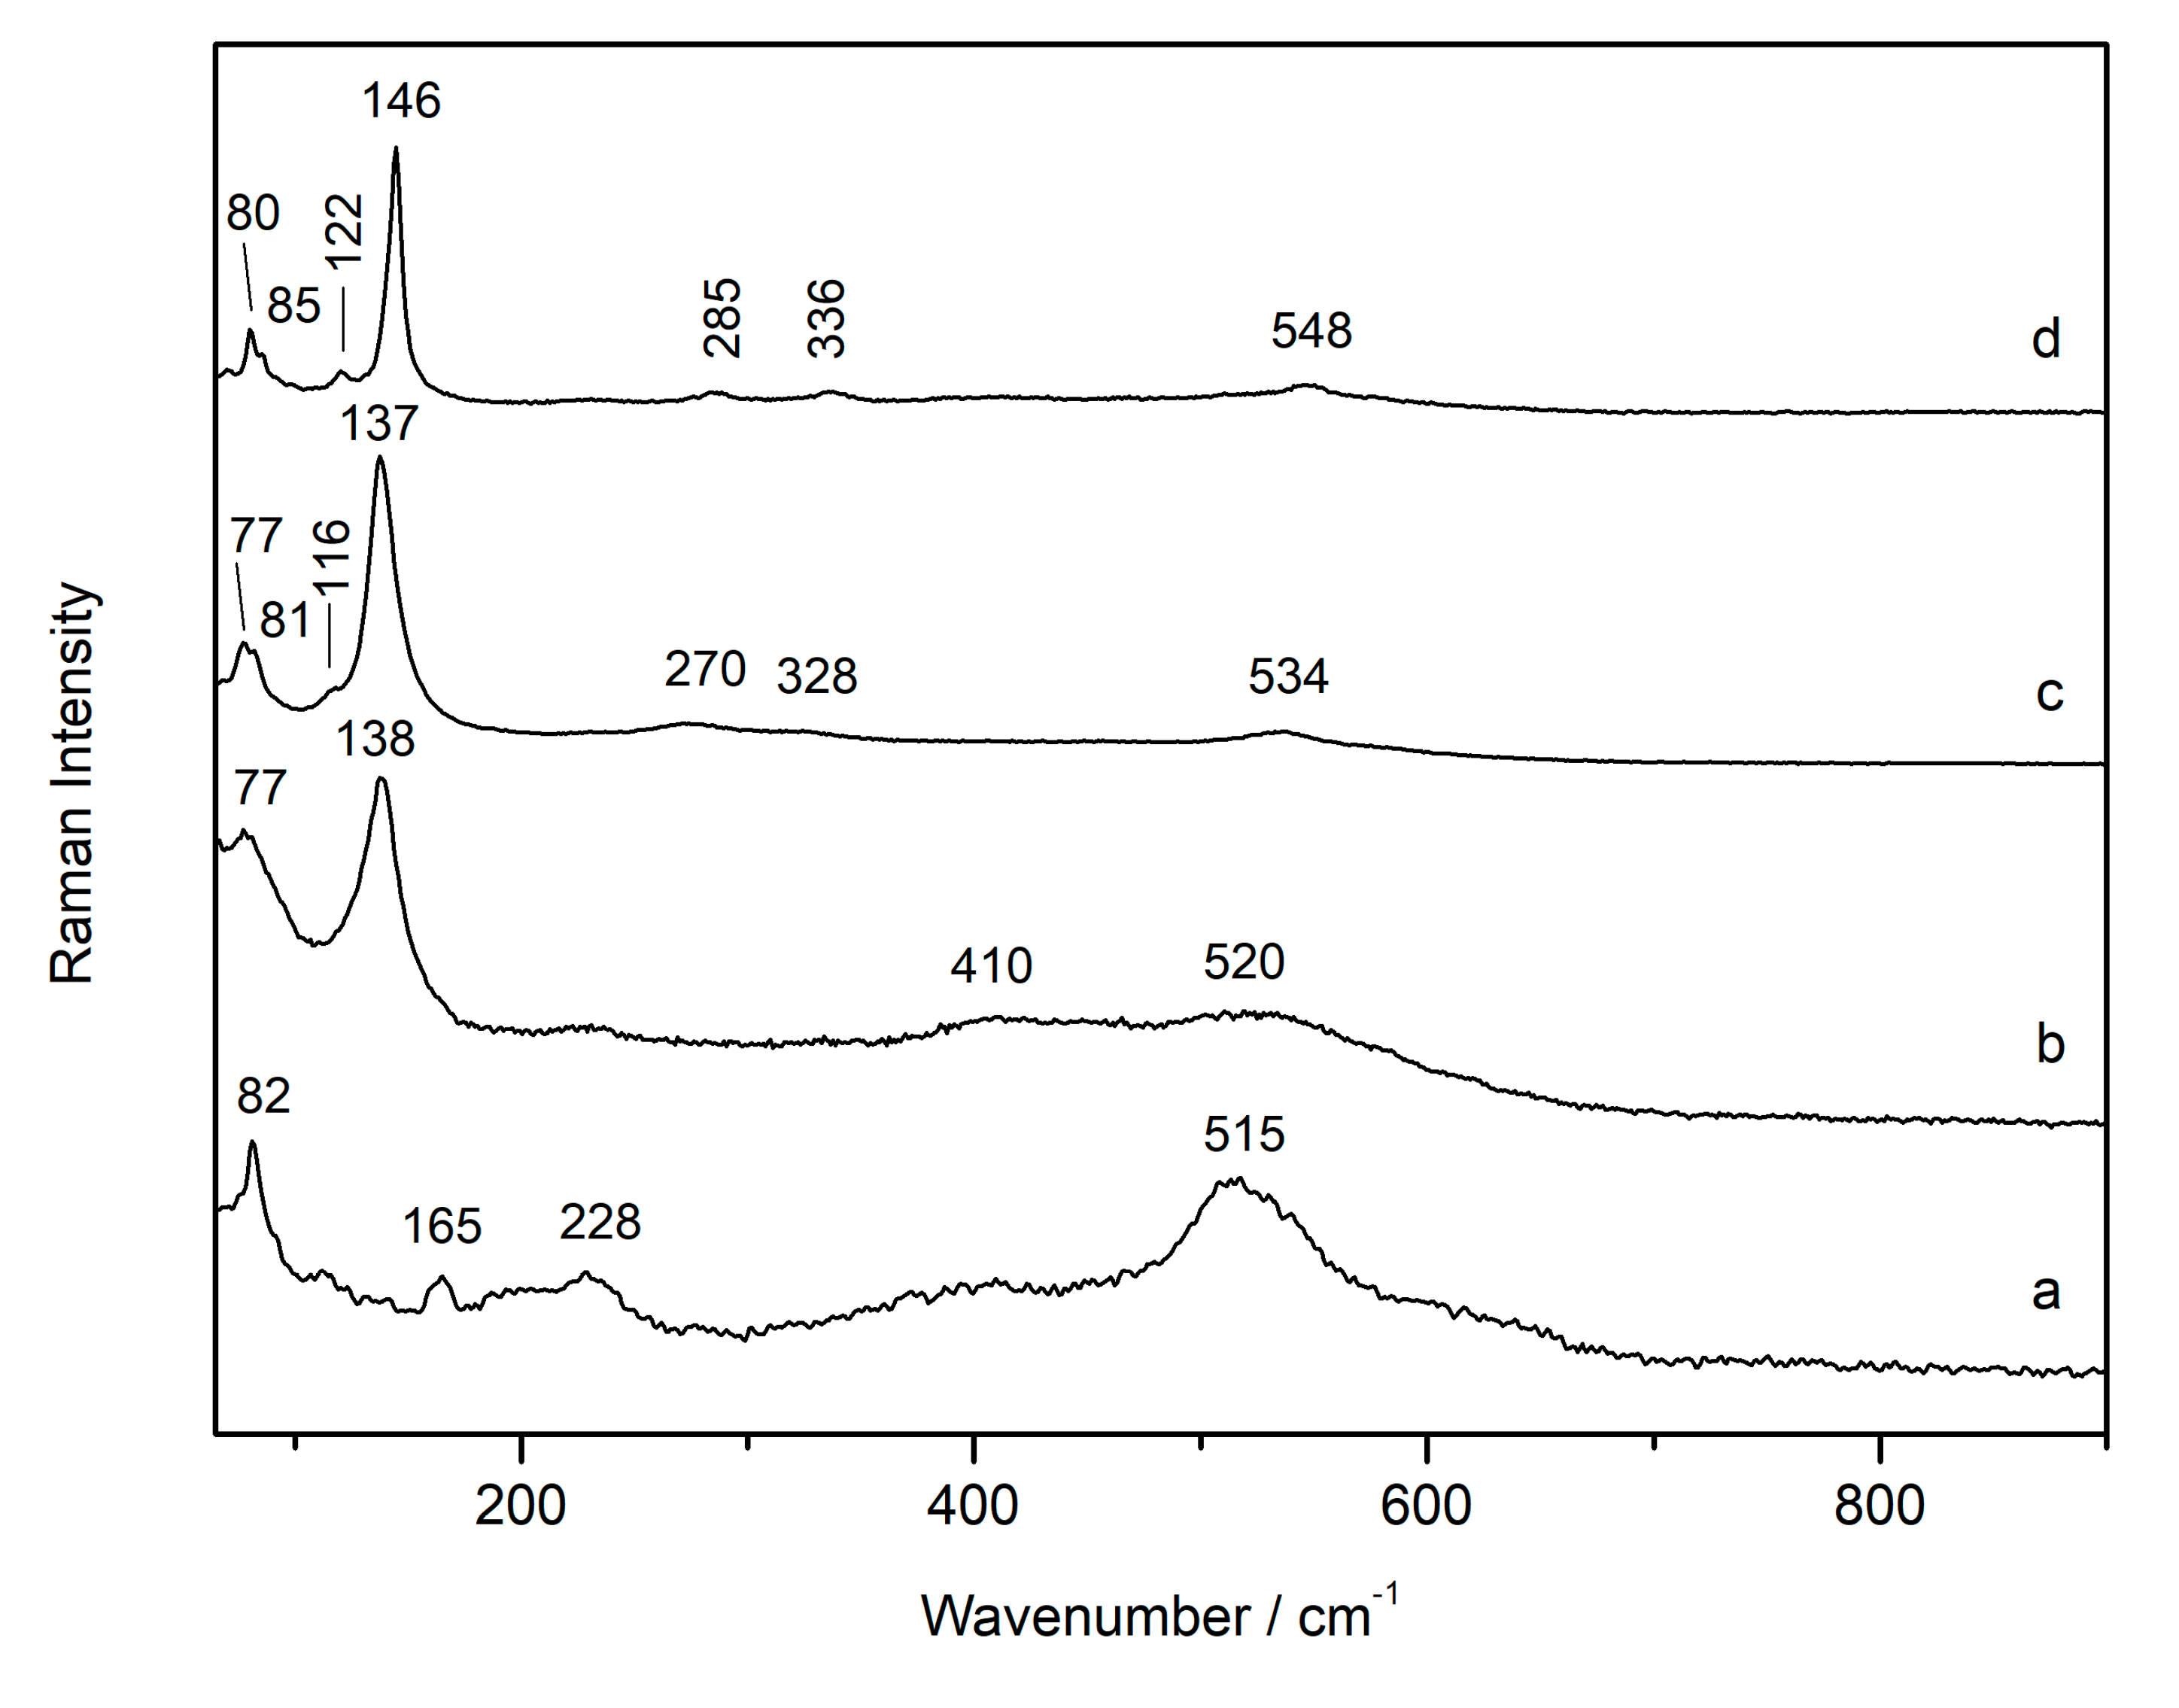
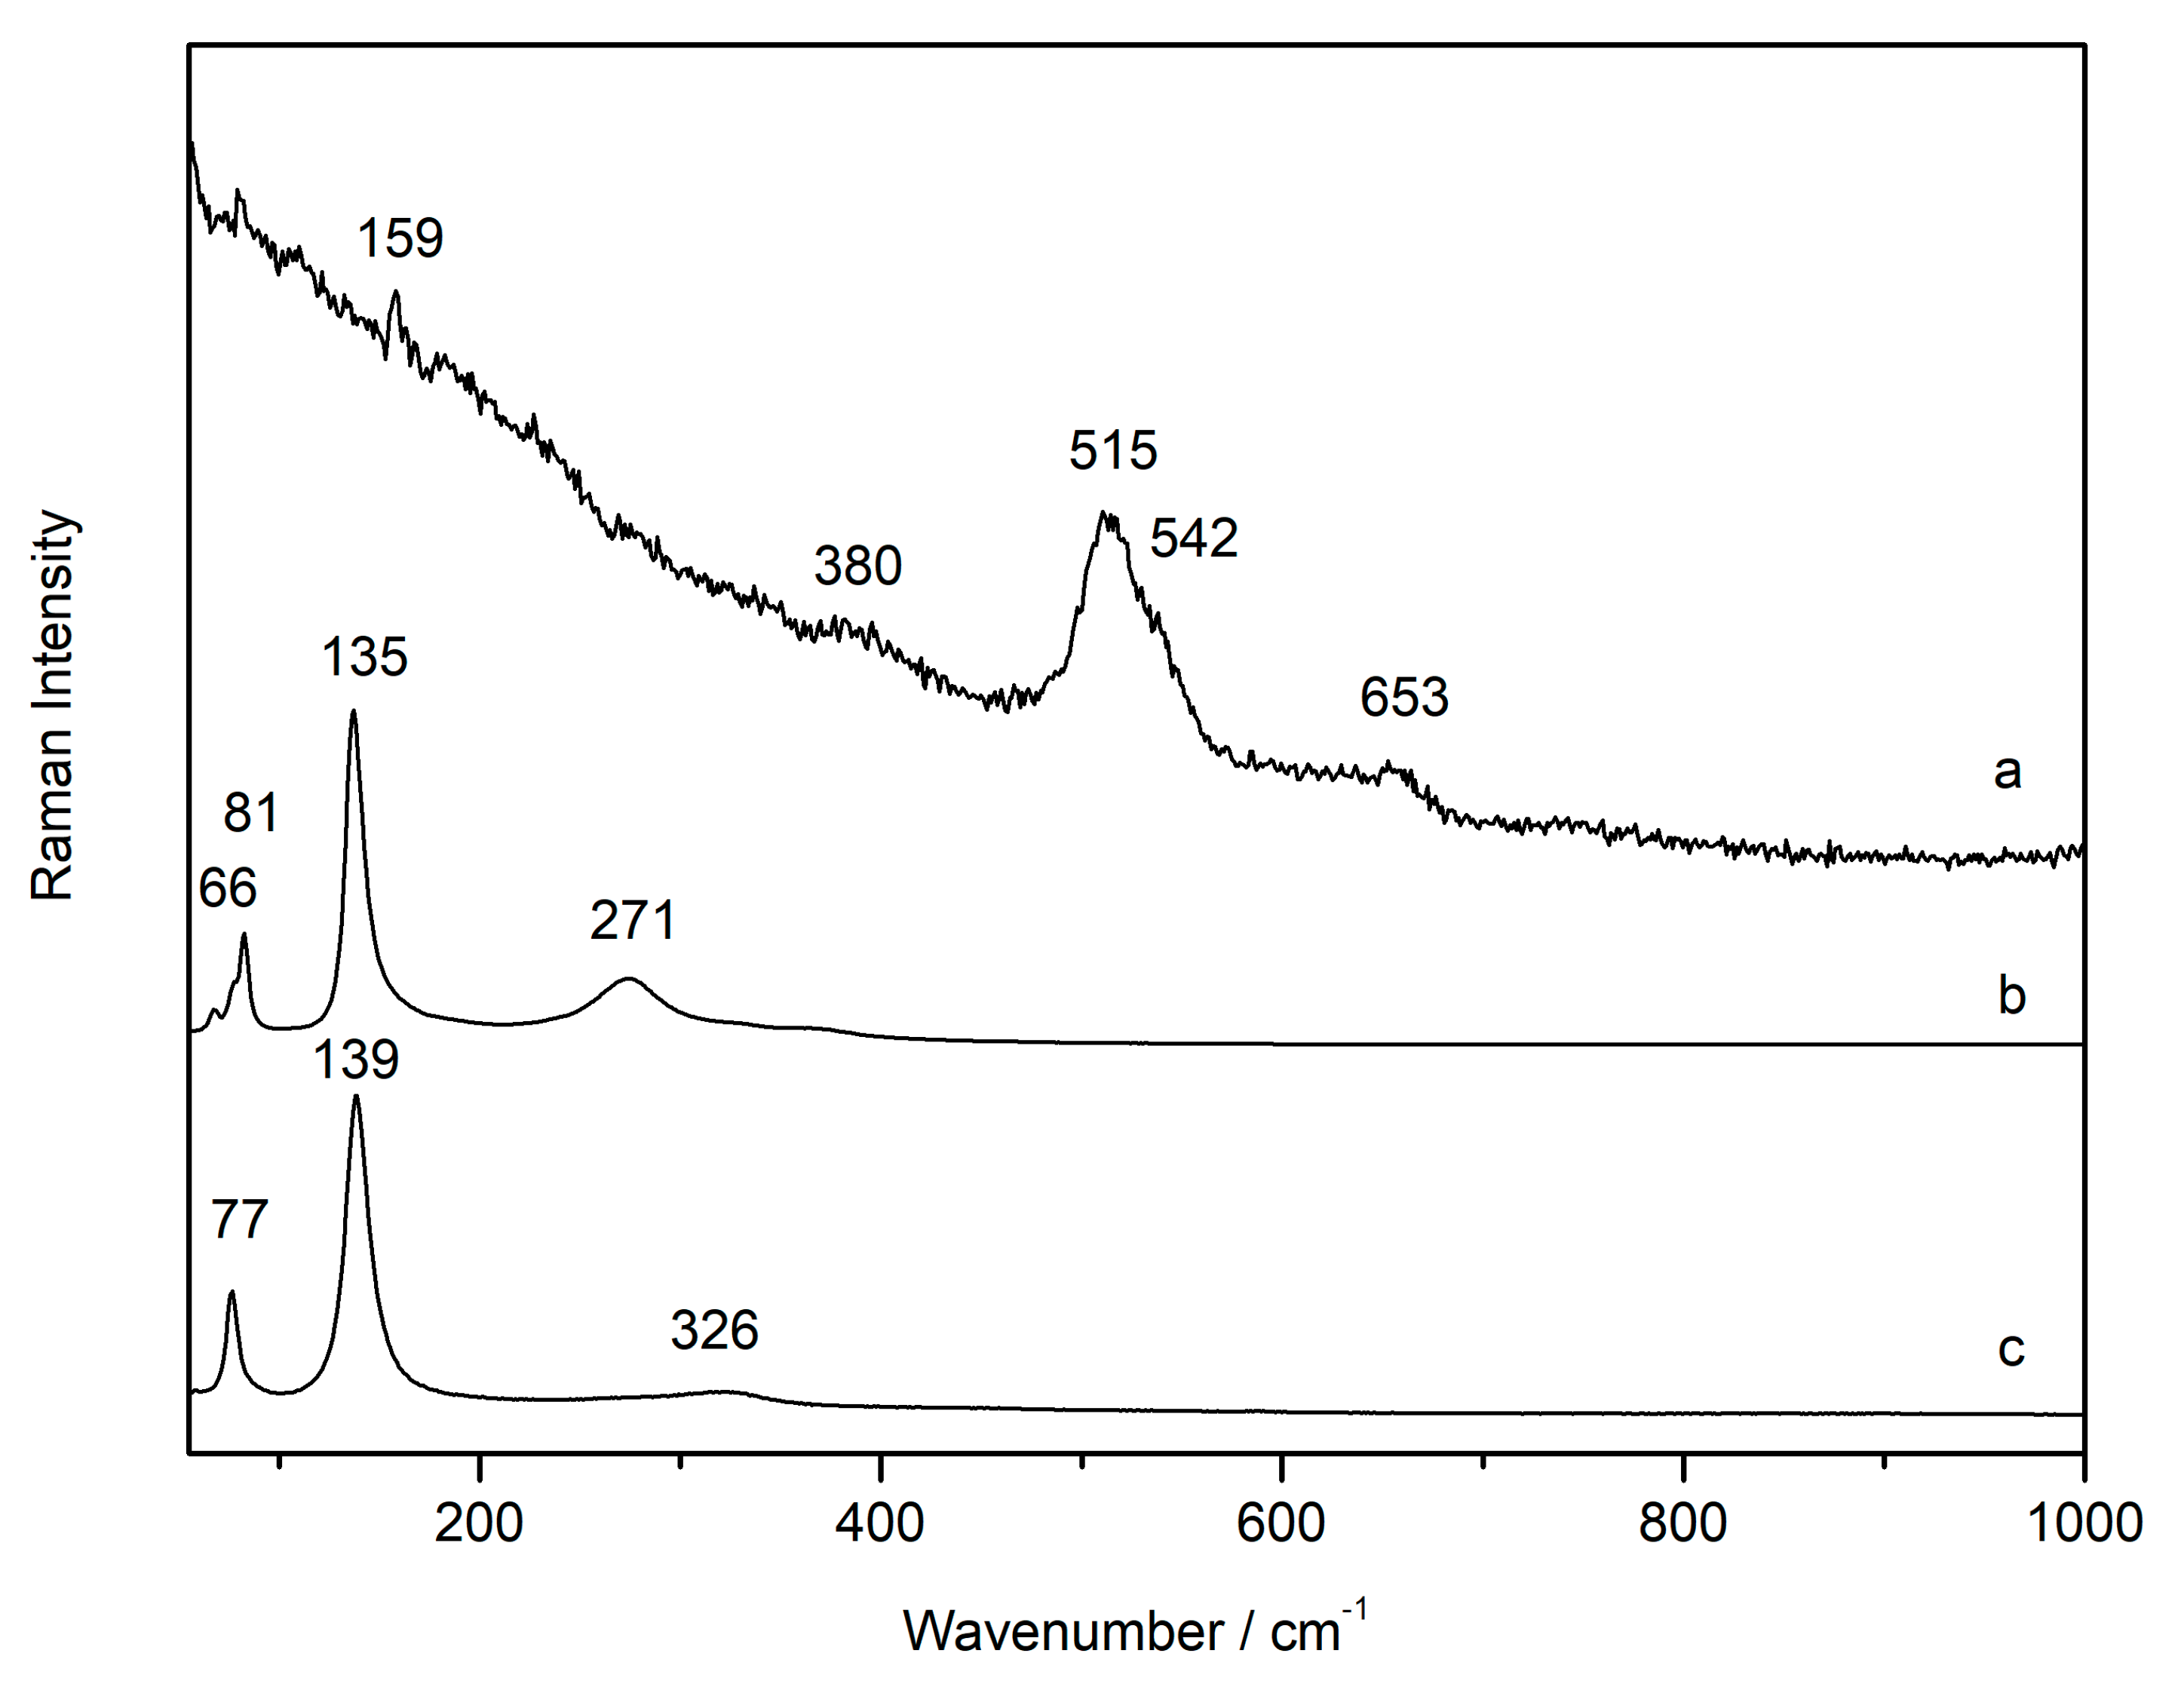
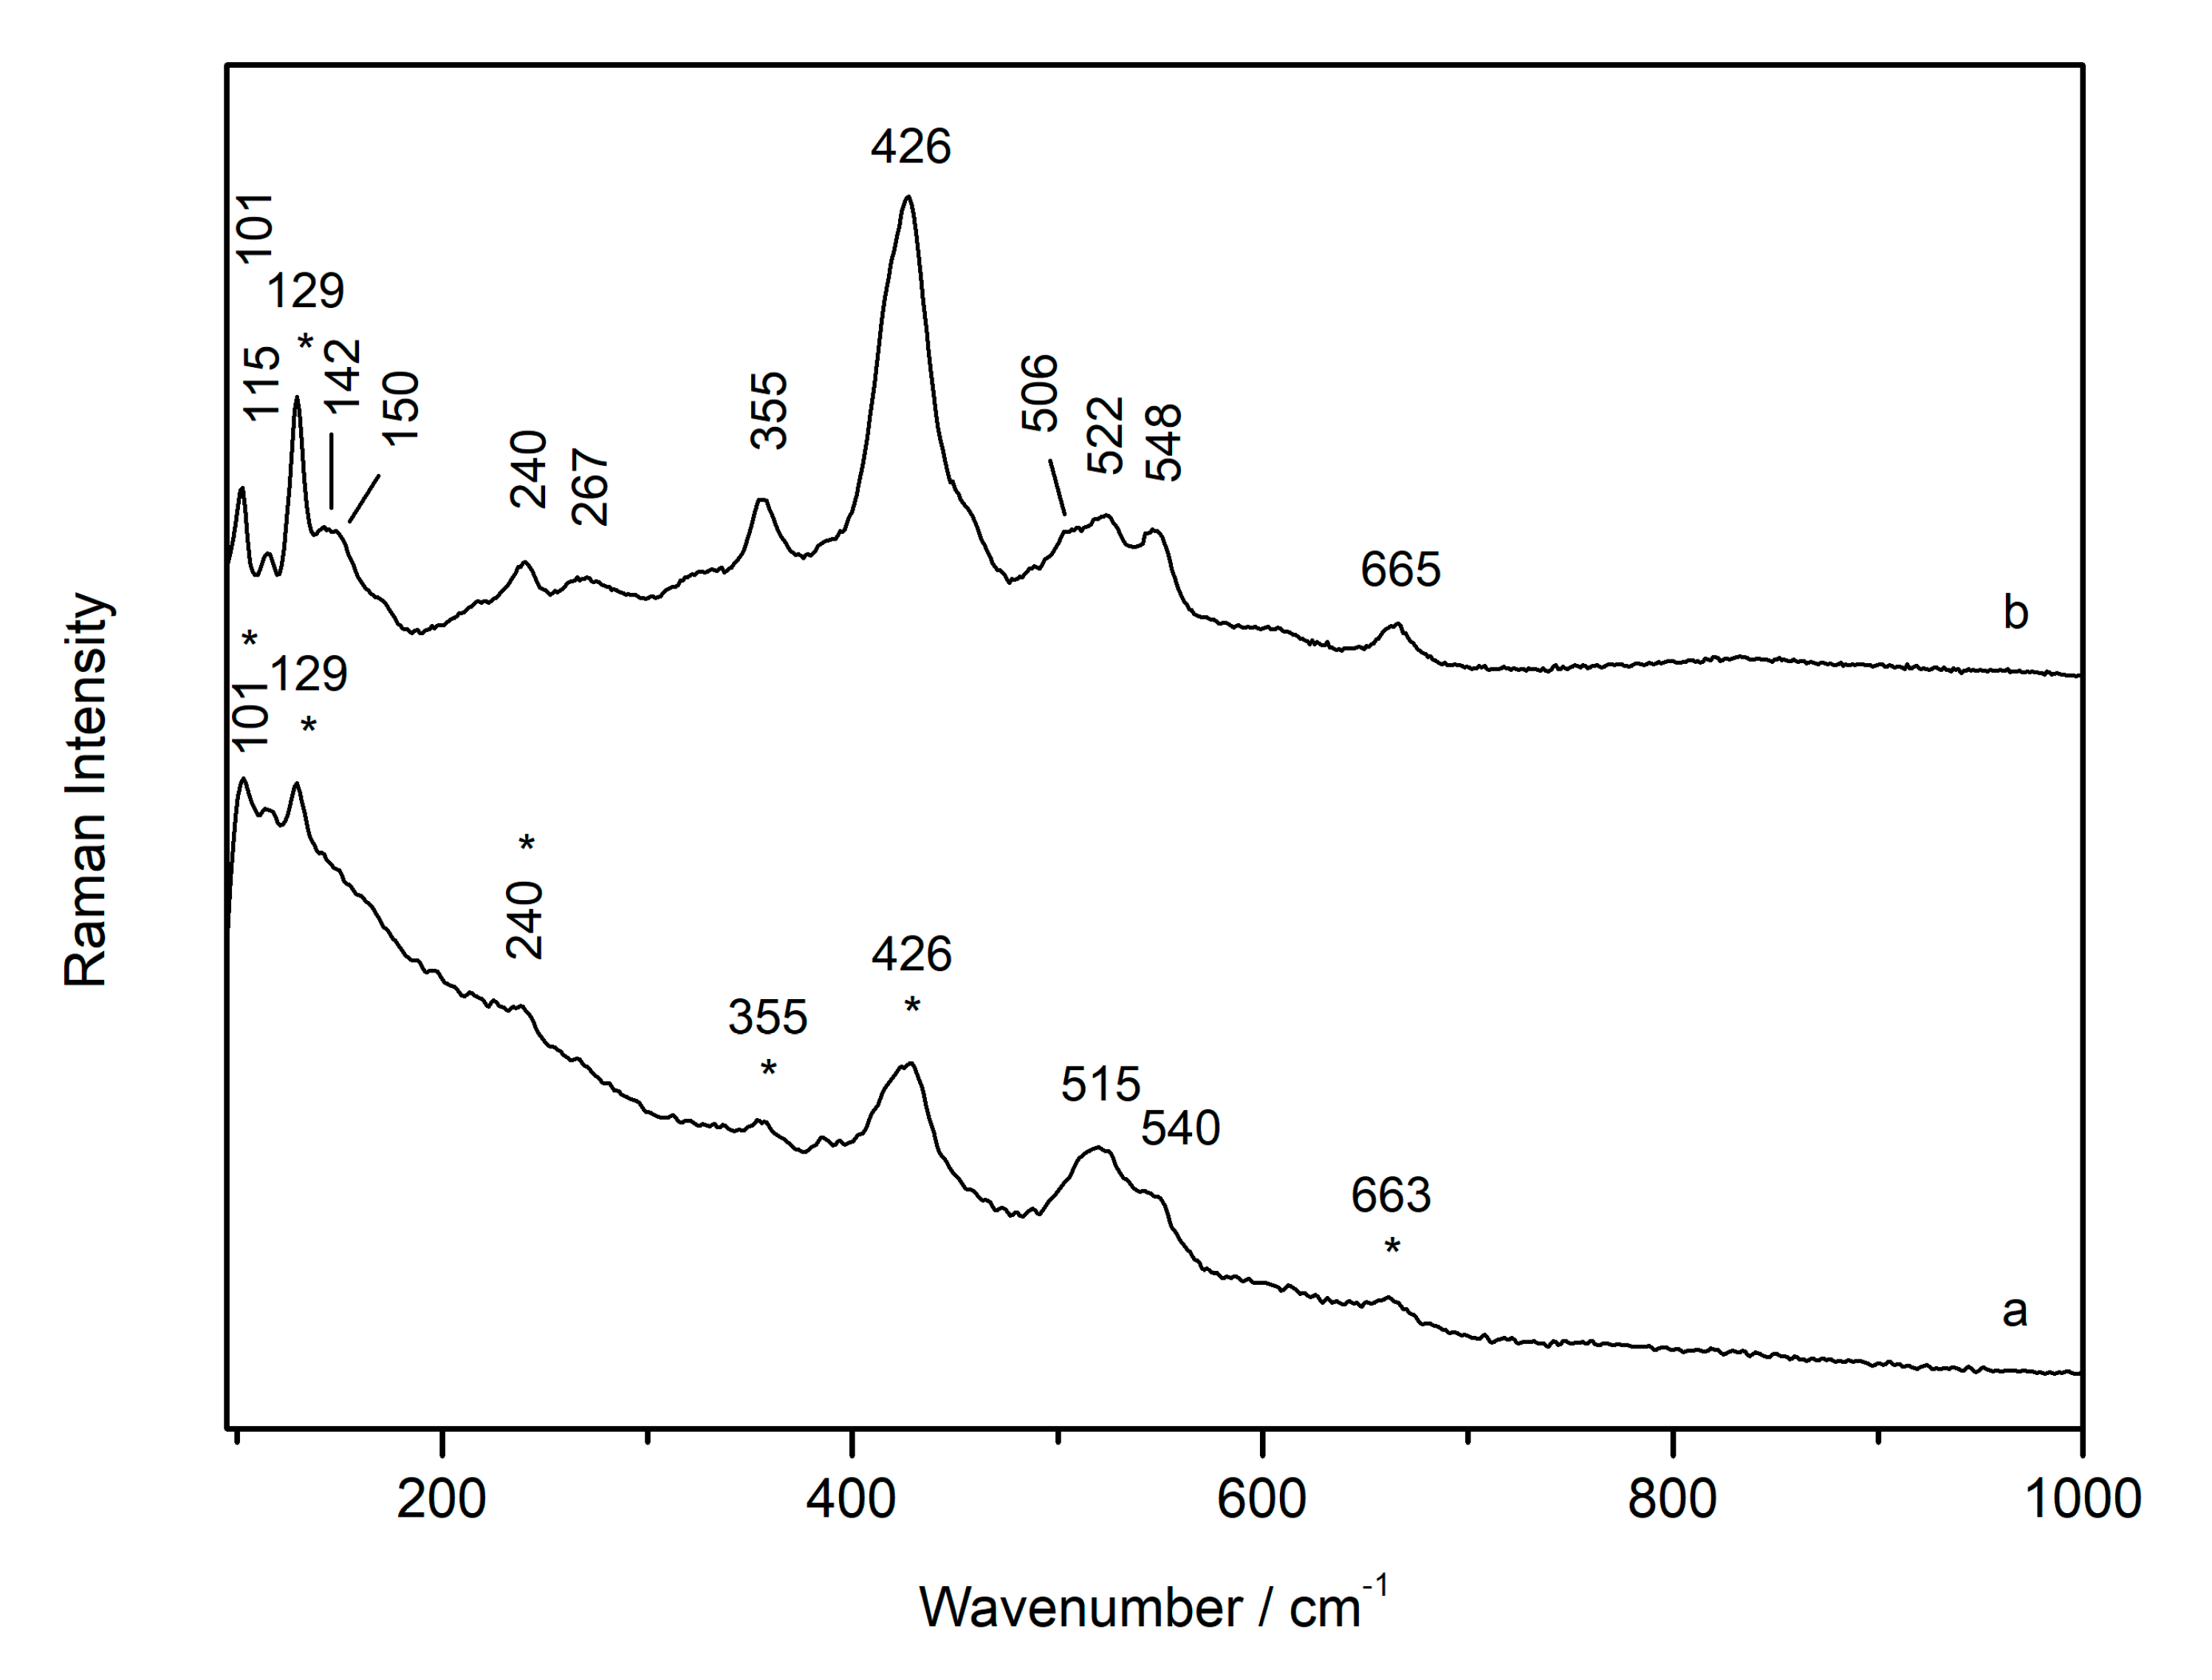
3.1. Laser-Induced Degradation of Plattnerite with 633 nm Laser Excitation

3.1.1. Laser-Induced Degradation of Plattnerite taken from the Mural Paintings

As previously mentioned, the sensitivity of plattnerite when it was irradiated by the laser during Raman analyses was noted, with the formation of lead oxides (red lead, massicot and litharge) during the study of blackening samples from a late gothic mural painting. Therefore, a Raman spectrum of the degradation compound was acquired, keeping the laser power low enough (0.1 mW on the sample) to avoid the formation of secondary products. The characteristic spectrum recorded for the degradation product of the wall paintings (sample FR1) showed the features belonging to scrutinyite at 82, 165 and 228 cm−1 [34], and the most intense band of plattnerite at 515 cm−1, as shown in Figure 1.
Then, some tests were carried out by varying the laser power, in order to induce the degradation of the plattnerite sample collected from the wall paintings, and to study the phase transition of β-PbO2. These samples were grinded.
The powdered sample of plattnerite from the wall painting (FR1) was investigated as a function of the laser power, changing the density of absorbing neutral filters from D0.0 (full power on the sample, ~10 mW) to D2 (~0.1 mW). The Raman spectrum collected at low laser power D2 (~0.1 mW; Figure 2a) showed the large band of plattnerite at 515 cm−1, and the features at 82, 165 and 228 cm−1 of scrutinyite. With increasing laser power (D0.6, ~2.5 mW; Figure 2b) plattnerite began to degrade and the Raman spectrum showed two new weak bands at ~410 and ~520 cm−1, which were probably due to the gradual degradation of β-PbO2. The degradation of plattnerite was more evident with the formation of massicot, which broadened mainly as a result of increasing local temperature. When the laser power was further increased on the sample (D0, ~10 mW; Figure 2c), the presence of new bands was shown at 116 and 534 cm−1, together with the features of massicot, which shifted towards lower wavelengths as a consequence of the heating. The formation of litharge was also noted. The more intense feature of litharge was not clearly visible, probably because the slightly asymmetric band at 138 cm−1 of the massicot could hide it. When the sample was analysed again at low laser power (D2, ~0.1 mW; Figure 2d), after cooling the sample, the band at 534 cm−1 was shifted to 548 cm−1. This band, and a feature at 122 cm−1, suggested the formation of red lead, generated as a laser degradation product of plattnerite. Furthermore, one band, at low frequencies of 80 cm−1 and the shoulder at 338 cm−1, confirmed the presence of litharge in addition to massicot.
Therefore, a shift of the bands towards the lower wavelengths due to the effect of laser heating was shown for the lead oxides (red lead, massicot and litharge), generated by the degradation of β-PbO2. However, this shift disappeared after heating, and the bands move to their “usual” positions.
All the Raman bands of the compounds generated by the laser degradation of β-PbO2 are listed in the Table 1.
In the sample from the wall paintings (FR1), even the features of α-PbO2—scrutinyite—disappeared with increasing the laser power, and they were not visible in the cold sample analysed at low laser power. In addition, the features at 534 and 116 cm−1 appeared only when red lead was obtained as a degradation product from plattnerite [16]. They did not appear when commercial red lead (sample C-RL1) was analysed under similar conditions of high laser power. In fact, analyses carried out on red lead commercial powder showed that it was nearly insensitive to the laser power with 633 nm radiation, analysed with changing filters between D2, D1 and D0.0 (Figure 3). In this spectrum, all features belonging to Pb3O4 were visible at 52, 62, 85, 120, 150, 222, 313, 390, 478 and 549 cm−1.
At the same time, when the red lead (sample C-RL2) was analysed with the same excitation line (633 nm) and changing the laser power (from 0.05% to 100% with InVia Raman spectrometer), it remained stable up to 50% of the laser power (Figure 4a–g). Indeed, all Raman spectra varied only in intensity. There was neither an increase in the band nor a shift towards low wavelengths. Using 100% laser power, the compound underwent a phase transition to massicot, with the bands broadening and shifting (Figure 4h). When the sample was analysed again at low laser power (0.05%), the Raman spectrum showed the main bands of red lead and massicot (Figure 4i). Using the 785 nm laser excitation, this phase transition did not occur and the spectra underwent no variation.
Such behaviour was not found for the commercial sample of massicot (C-βP), showing a good stability with increasing temperature (laser power) when it was analysed with both 633 nm and 785 nm. Only a slight shift towards lower wavelengths (less than 2 cm−1) was visible in the spectra collected at high laser powers. On the other hand, Raman analyses of the commercial powder sample of litharge (C-αP) showed the formation of the massicot feature at 285 cm−1 at 100% of laser power, and this was more visible when the compound was analysed with the 633 nm laser compared to the 785 nm laser, as the shorter the wavelength of the incident radiation, the greater is its Raman cross section effect. The complete phase transition was not visible with maximum laser power for α-PbO samples.

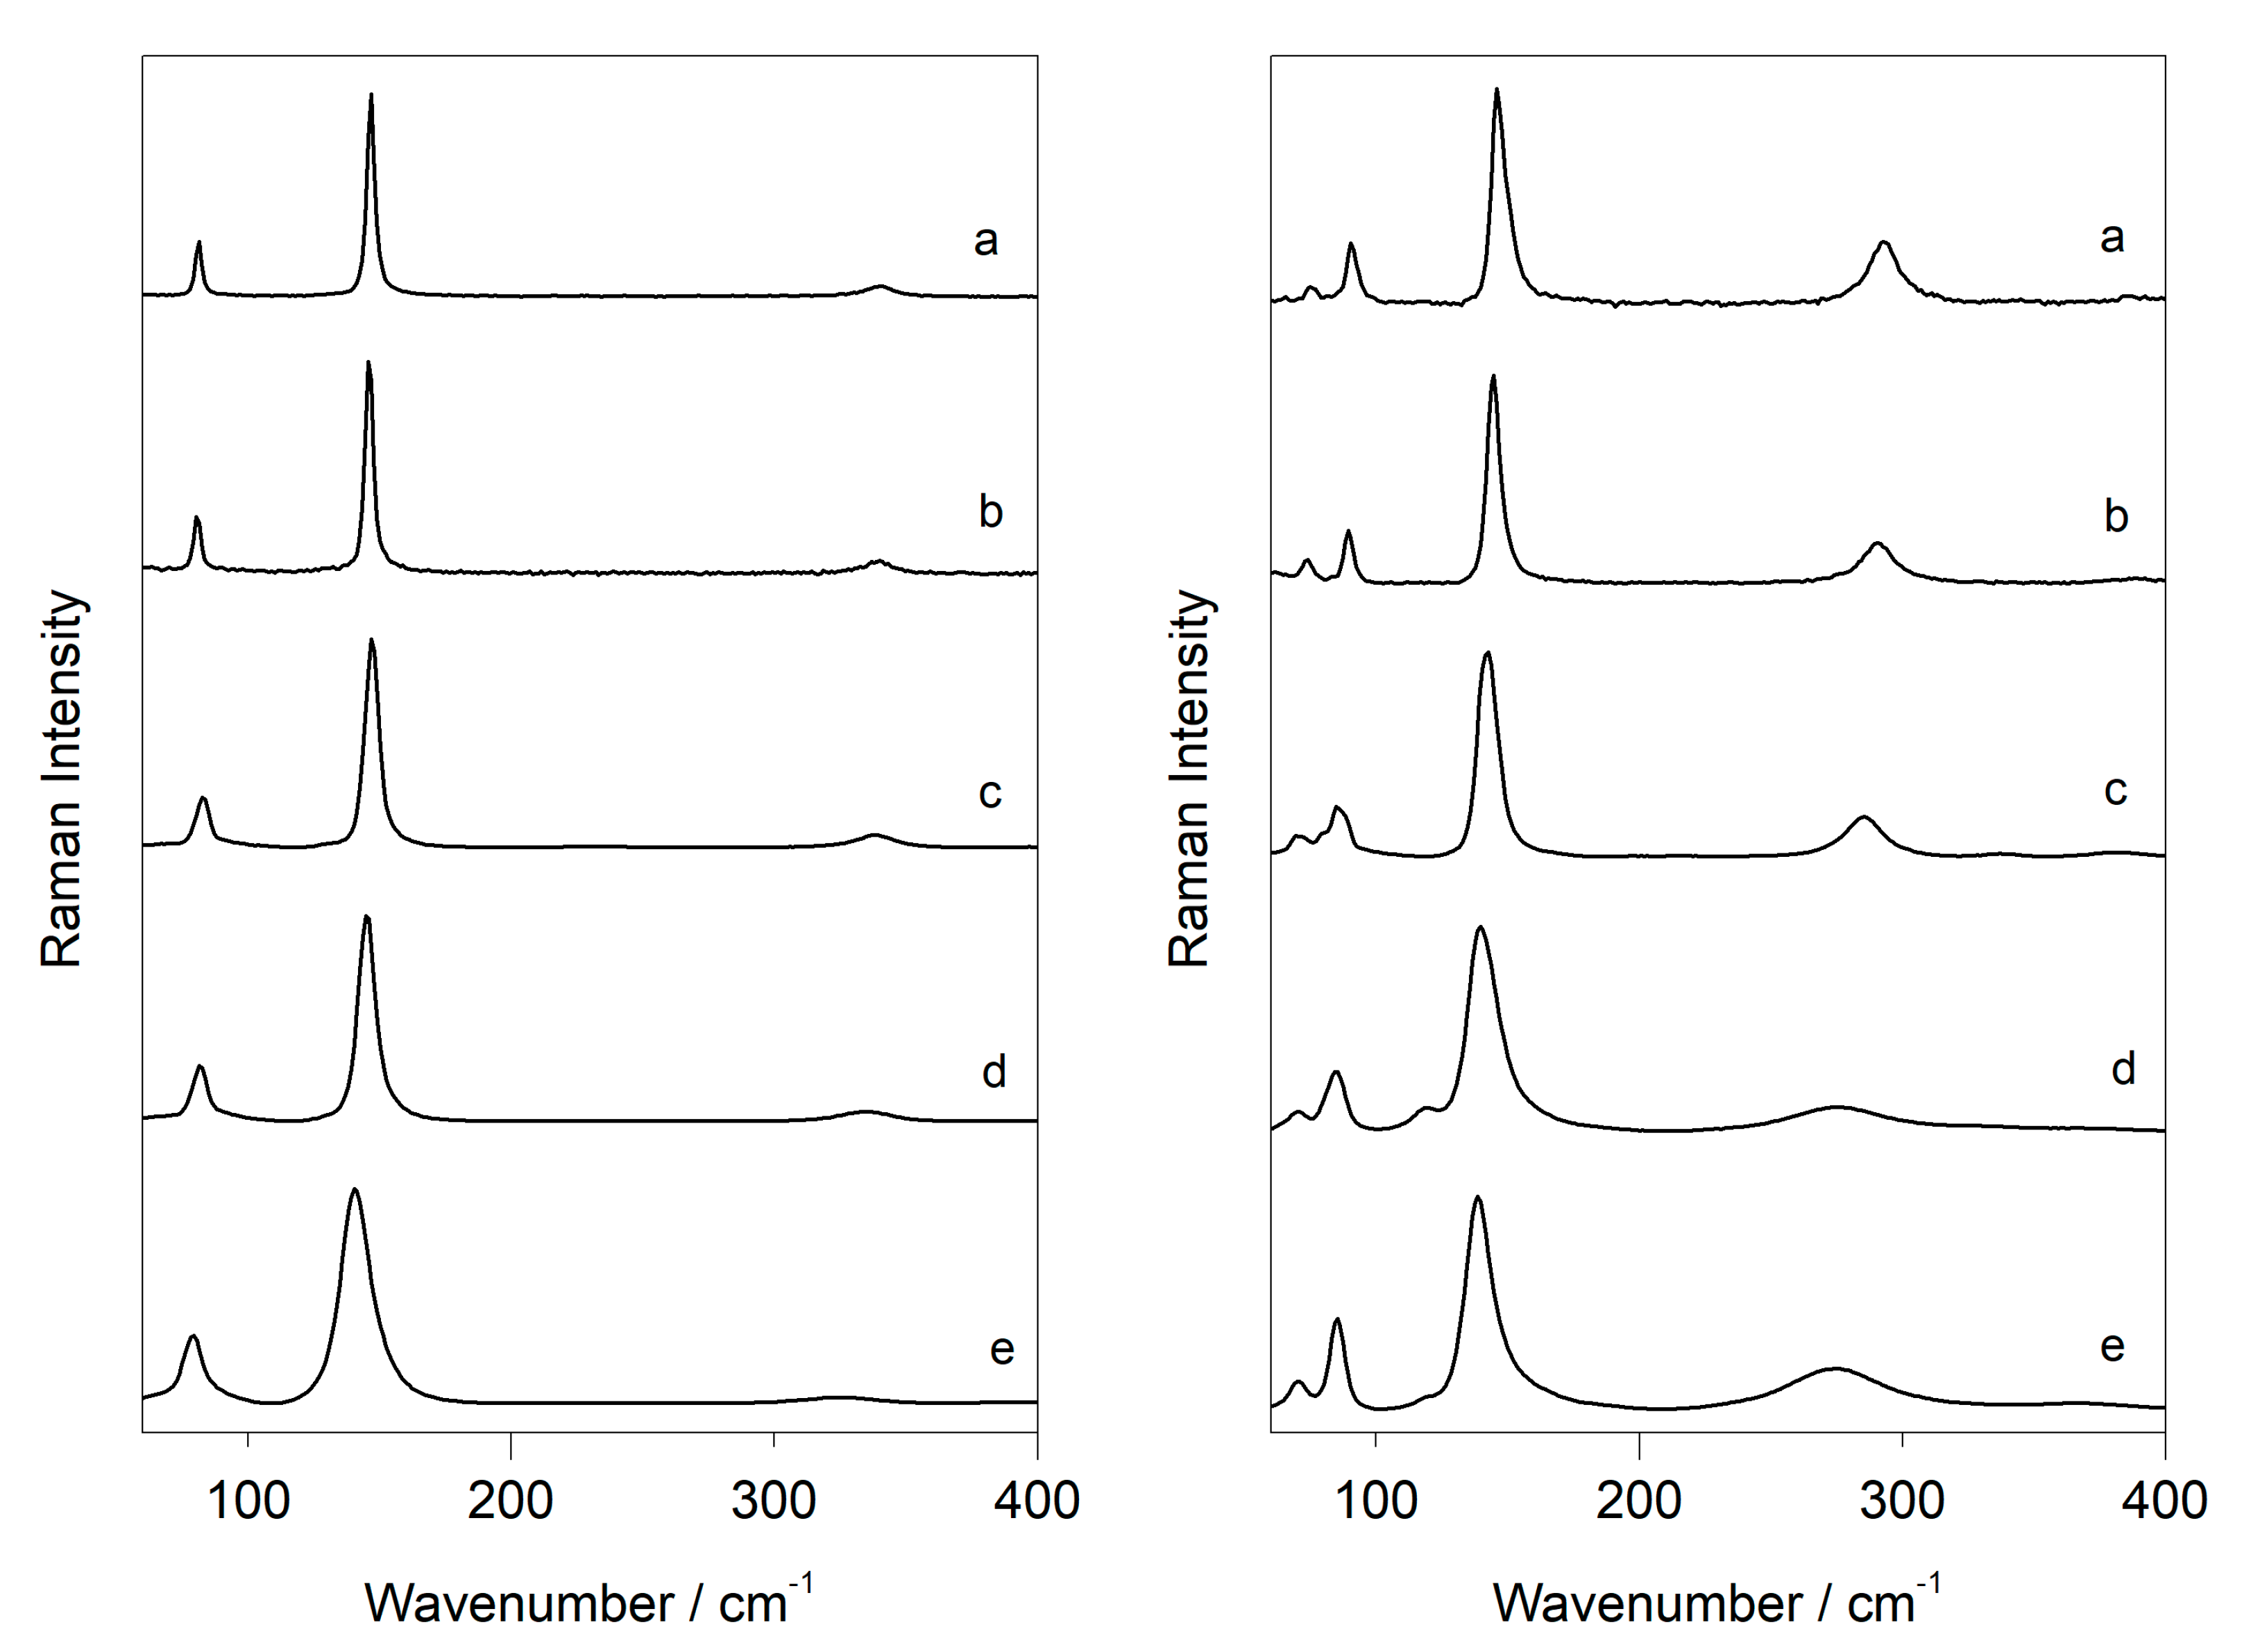
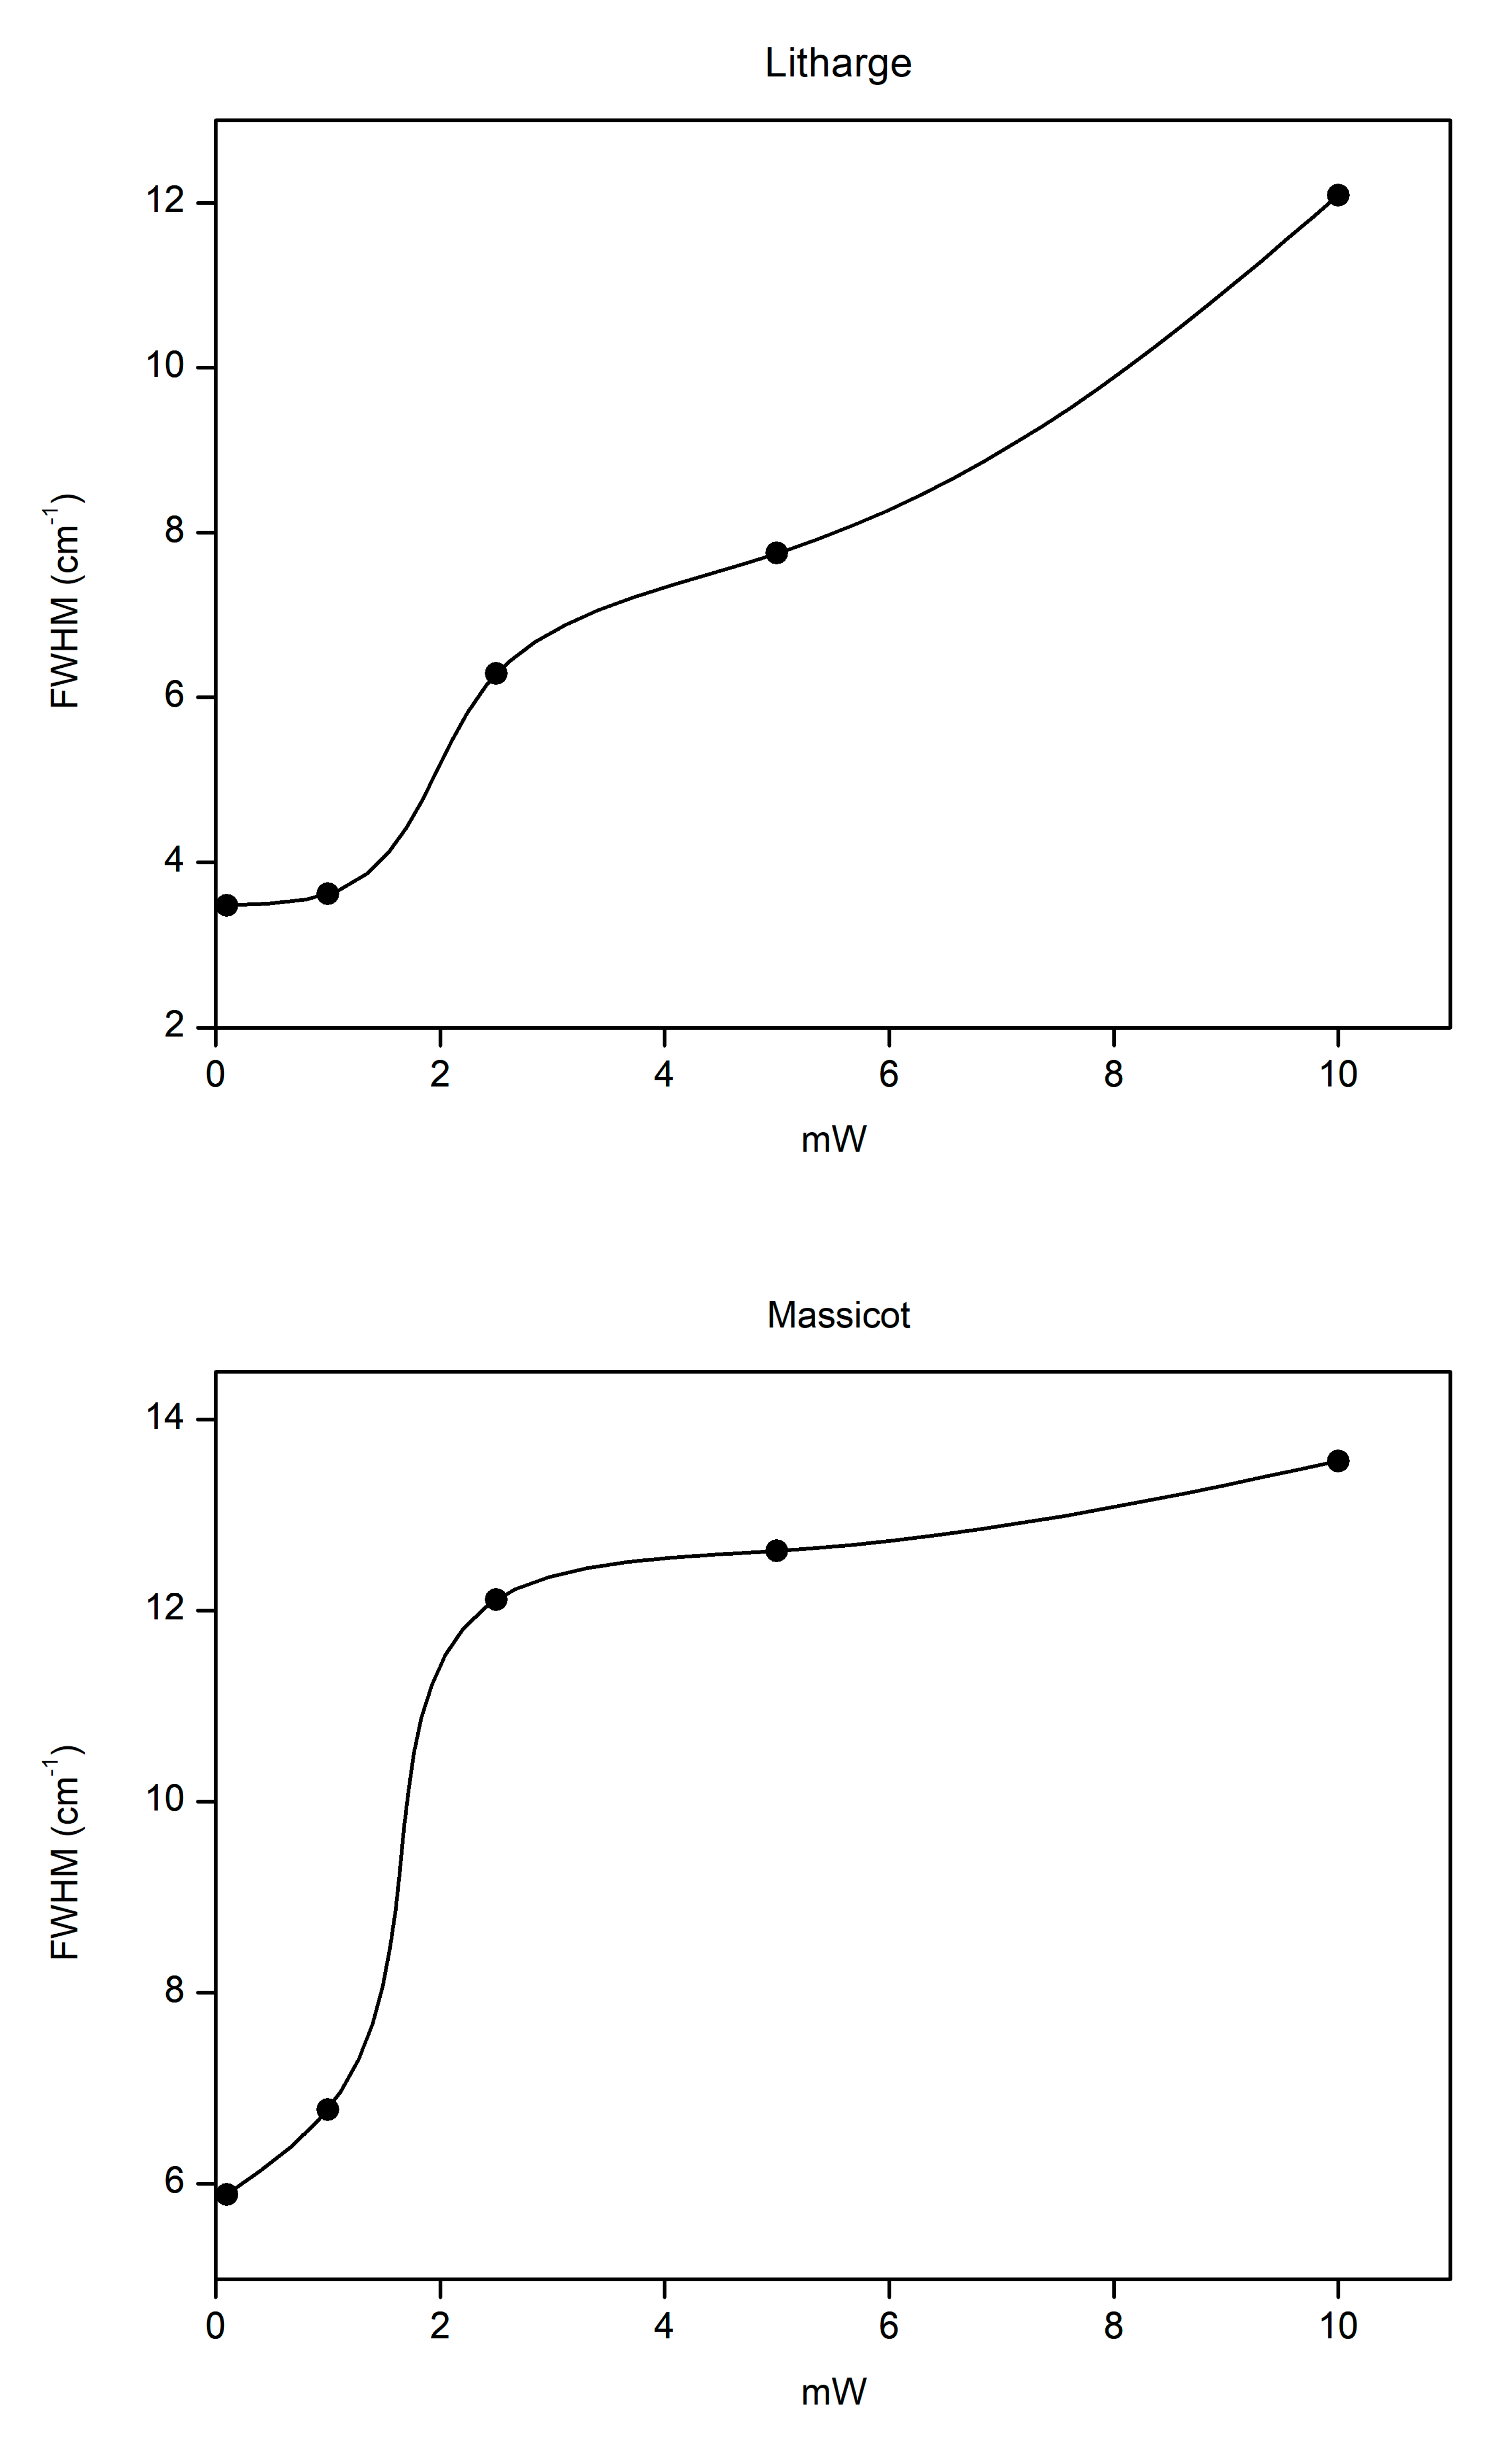
3.1.2. Laser-Induced Degradation of Commercial Plattnerite

Pure commercial plattnerite powder (sample C-P1) was analysed with the 633 nm laser by changing the power of the excitation light. The Raman spectrum of plattnerite was obtained at low laser power. In these conditions, plattnerite did not undergo phase transformations, showing features at 159, 515 and 653 cm−1 (Figure 5a). The broadening of the main band at about 515 cm−1 may have arisen from small amounts of Pb3O4, having a strong band at 548 cm−1. The temperature increase with increasing laser power caused the growth of a band, assigned to red lead, at about 390 cm−1, and subsequently the appearance of features indicating the formation of lead monoxide litharge (Figure 5c), and then of massicot (Figure 5b). With further increases in the laser power (and temperature), the Raman spectra showed only massicot as the final product of the induced degradation, in agreement with previous studies on plattnerite [16].
At high power, the massicot Raman signal overwhelmed that of litharge. Massicot and litharge together were visible only at low laser power. On the other hand, when the spectra were taken at high laser power (D0.0), it was not possible to collect the Raman spectrum of plattnerite because only the secondary alteration products, massicot and litharge, were visible.
Although not all the features of Pb3O4 were observed during the thermal transformation of plattnerite, this compound was identified always together with massicot. Indeed, β-PbO2 easily lost oxygen and Pb3O4 was the first degradation product formed when heating the sample. However, it was very difficult to assess precisely in which experimental condition the different phases formed, because the spectra varied according to the laser power, and presumably also the crystal orientation of the materials. The thermal degradation was also clearly visible via the colour change of the plattnerite powder. Under normal conditions, the β-PbO2 sample was composed of an iridescent grey powder. As a result of irradiation, a colour change from black to reddish orange was noticed.
The formed degradation products from plattnerite (massicot and litharge) were also analysed by varying the power of the laser. Their wavenumbers were compared with those of commercial pigments, with the aim of recognising when a degradation of the sample occurs due to the laser. The variations in the wavenumber and width of the massicot and litharge features, at increasing excitation power using the 633 nm laser, were observed only if they were obtained as degradation products of commercial plattnerite (Figure 6). For both, it was evident that the shift of the bands towards lower wavenumbers increased with temperature. The position of the more intense band in massicot varied between 145 and 135 cm−1, while that of litharge varied between 146 and 140 cm−1, as shown in Table 2 and Table 3. When, after laser heating, the sample was irradiated at low laser power, Raman bands narrowed and returned to higher wavenumbers.
In addition to shifting the Raman bands towards lower wavenumbers, an increase in the band width for both lead oxides was determined as the temperature increased. Figure 7 graphically shows the value of the full width at half maximum (FWHM) of the main band of litharge and massicot, determined by fitting a single Lorentzian curve, as a function of the laser power (Milliwatt) of each filter used, confirming that a directly proportional relationship exists between the two variables. Although the trend of the curve confirms a gradual increase in the width of the band with the increase in laser power for both lead oxides, the widening of the band of litharge was more evident if the spectrum obtained at high temperatures (D0.0) was compared with that recorded on the cold sample, using filter D2. On the other hand, for both lead oxides, a minimal variation in the band width occurred using filters D2 and D1, which correspond to 0.1 and 1 mW, respectively. When the sample was analysed again with low laser power (D2), the value of FWHM corresponded with that previously calculated at the same laser power.

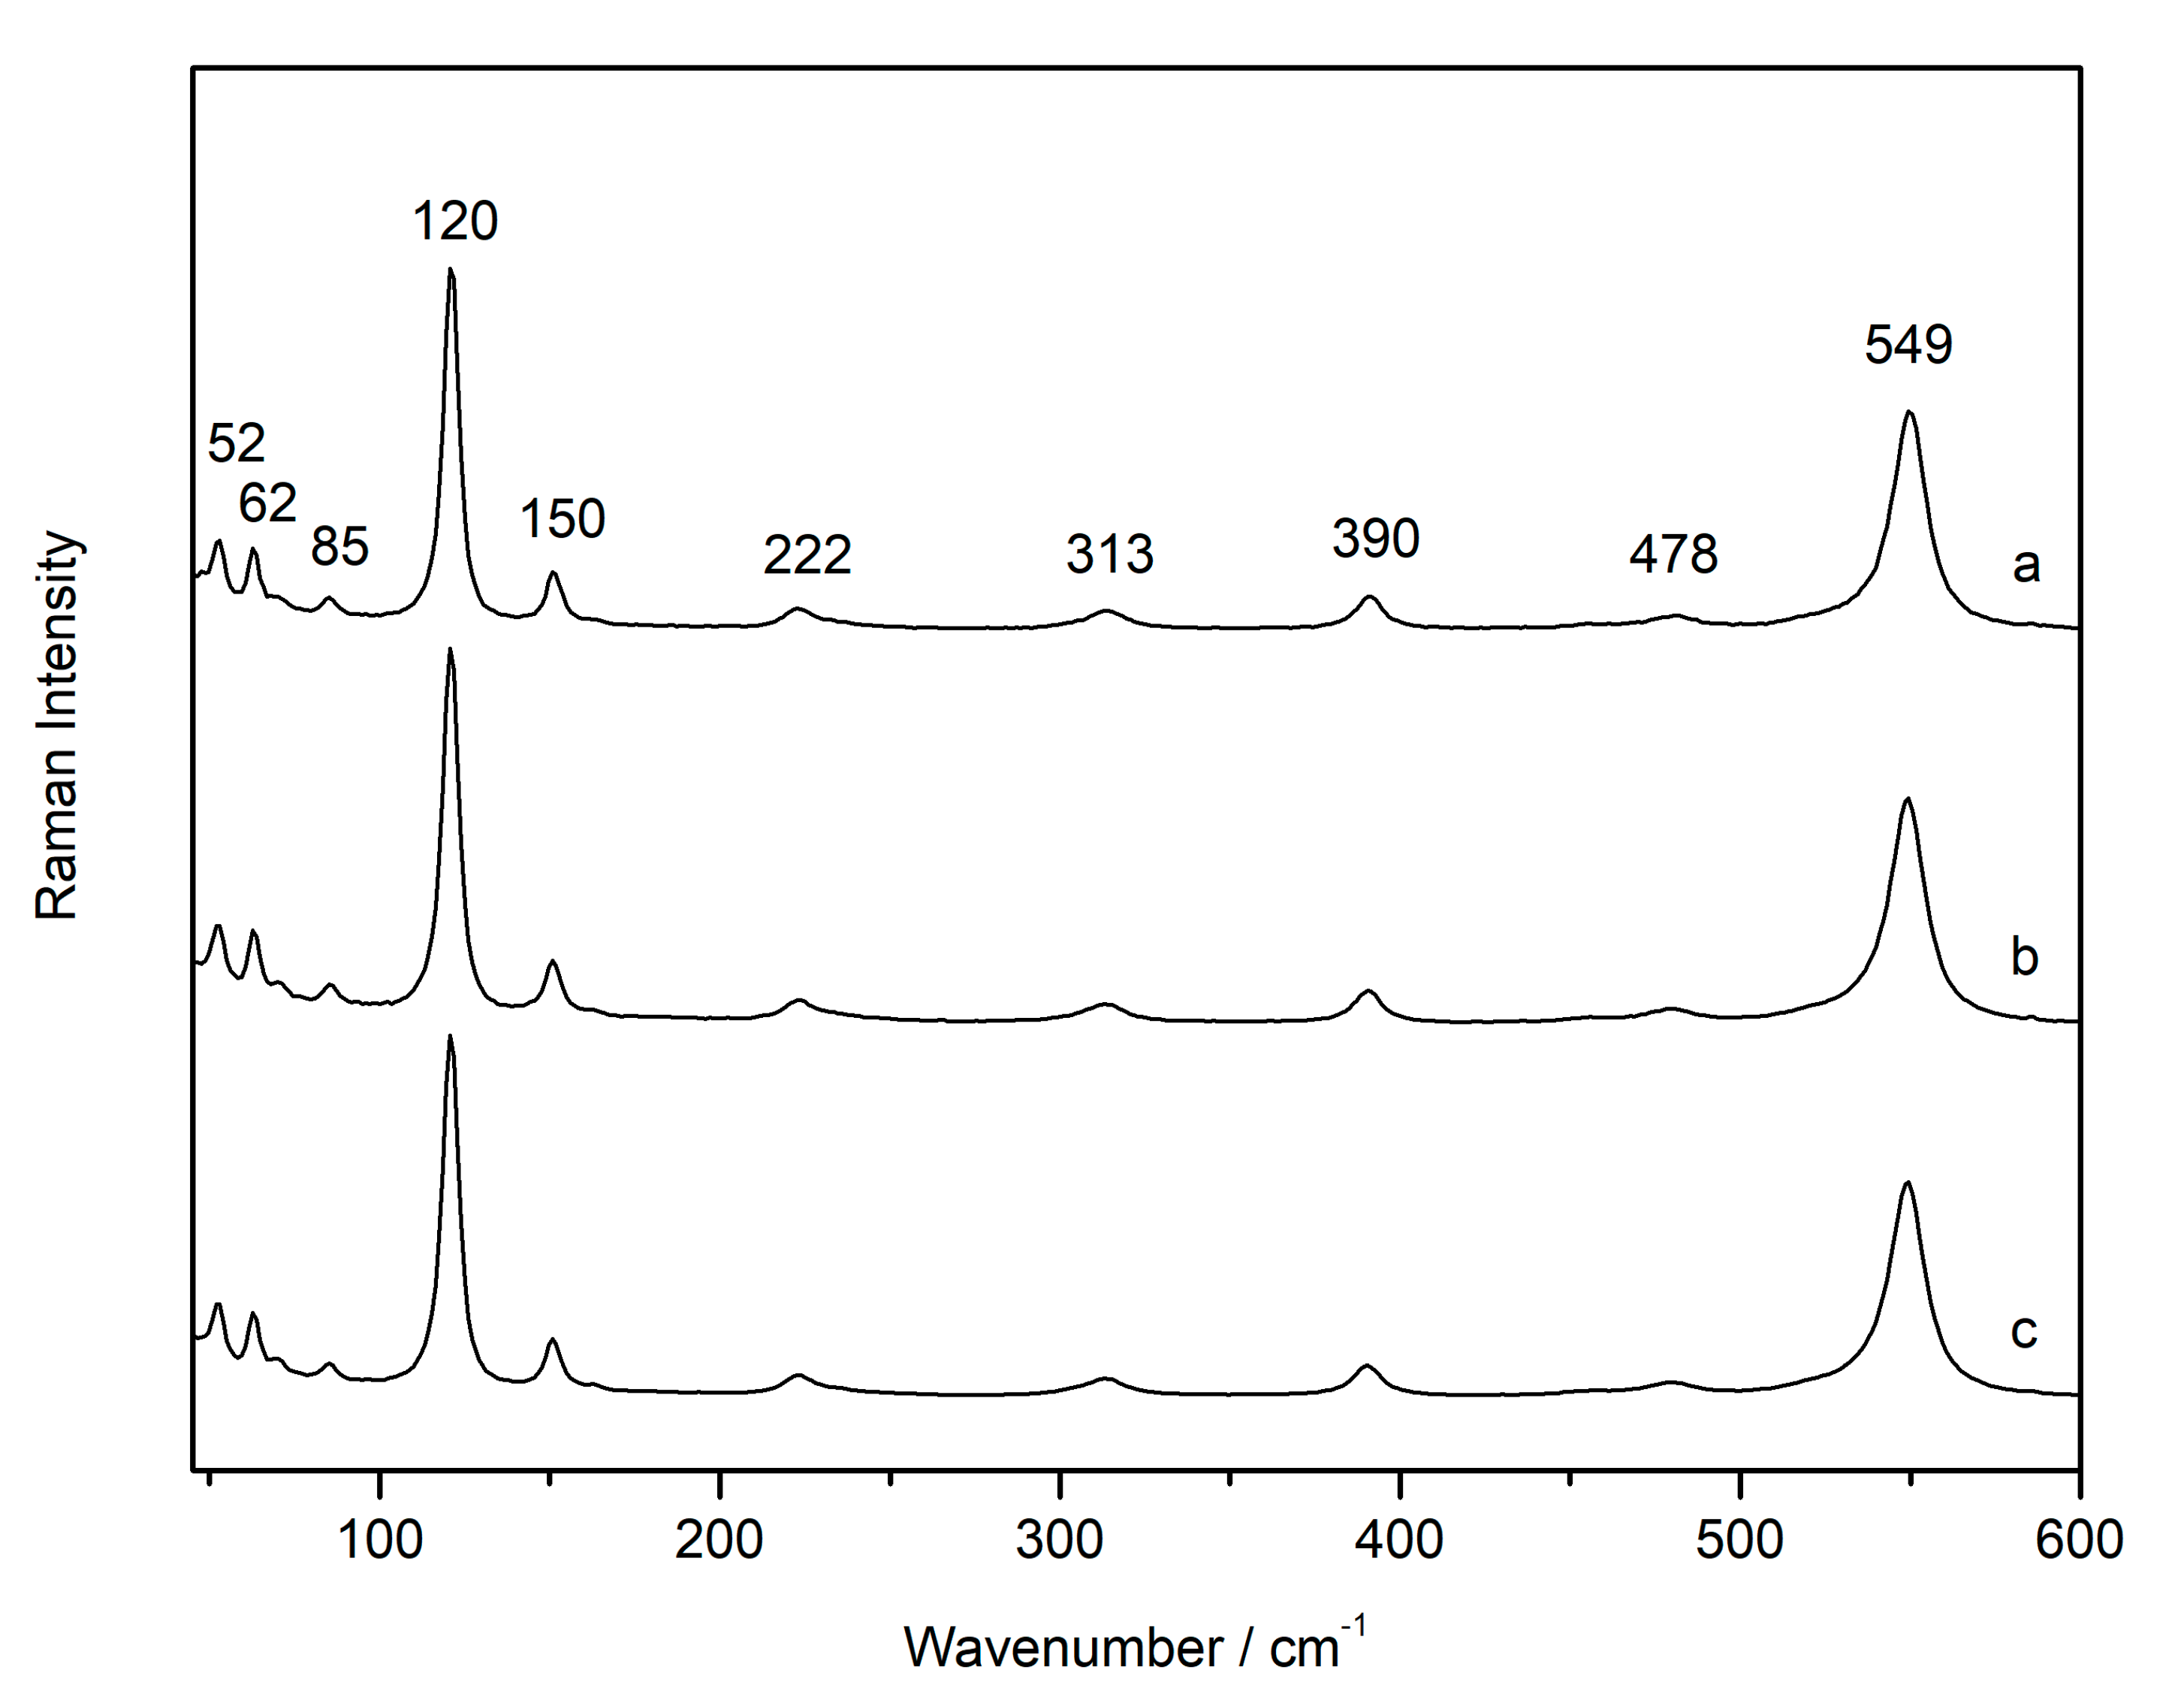
3.2. Laser-Induced Degradation of Plattnerite with 785 nm Laser

Analyses in the same sample point were performed using the 785 nm excitation line to induce degradation of commercial plattnerite samples (C-P2 and C-P3) by increasing the laser power. Unlike with the Raman Horiba, previously used, the power here is expressed as a percentage. By means of some tests it was estimated that the minimum laser power necessary to obtain the characteristic spectrum of plattnerite was 0.05%. Since this is a rather low laser power, it was necessary to use long acquisition times and accumulations (10 s, 300 scans) with this low laser intensity. The measurement parameters were changed (1 s, 200 accumulations) for the high laser powers to avoid saturation of the spectra.
As shown in Figure 8, the spectrum of plattnerite with its characteristic bands was visible up to 10% of the laser power. The temperature increase, due to the effect of the laser between 10% and 50%, was very high, and did not allow the visualisation of the spectrum of the red lead, which generally forms as the first degradation compound. In fact, with 50% laser power, the only well-defined band was that of the massicot (140 cm−1), while the other bands were barely visible and showed a transformation into red lead and massicot. At maximum laser power (100%), the spectrum of the massicot was visible with the bands shifted towards shorter wavelengths (138 cm−1). A band at 534 cm−1 and a shoulder at 116 cm−1 were visible, belonging to the red lead when it was generated as a secondary product of plattnerite. On the other hand, the broad band at 325 cm−1 belonged to litharge, whose main band was probably hidden by the most intense band of the massicot. In fact, since the lead oxides litharge and massicot have the most intense bands close to each other, the main feature of the massicot likely covered that of the litharge.
After cooling the sample, the Raman spectra obtained at low laser power (0.1%) showed the bands of litharge (147 and 339 cm−1) and red lead (120, 390 and 548 cm−1). In this case, therefore, the massicot formation did not take place completely, despite the high temperatures reached with the 100% laser power, because the massicot formation was reversible, and this compound did not appear in the cooled sample. Indeed, only the bands belonging to a mixture of litharge and red lead, the two phases preceding the formation of massicot, were evident in the cooled samples.

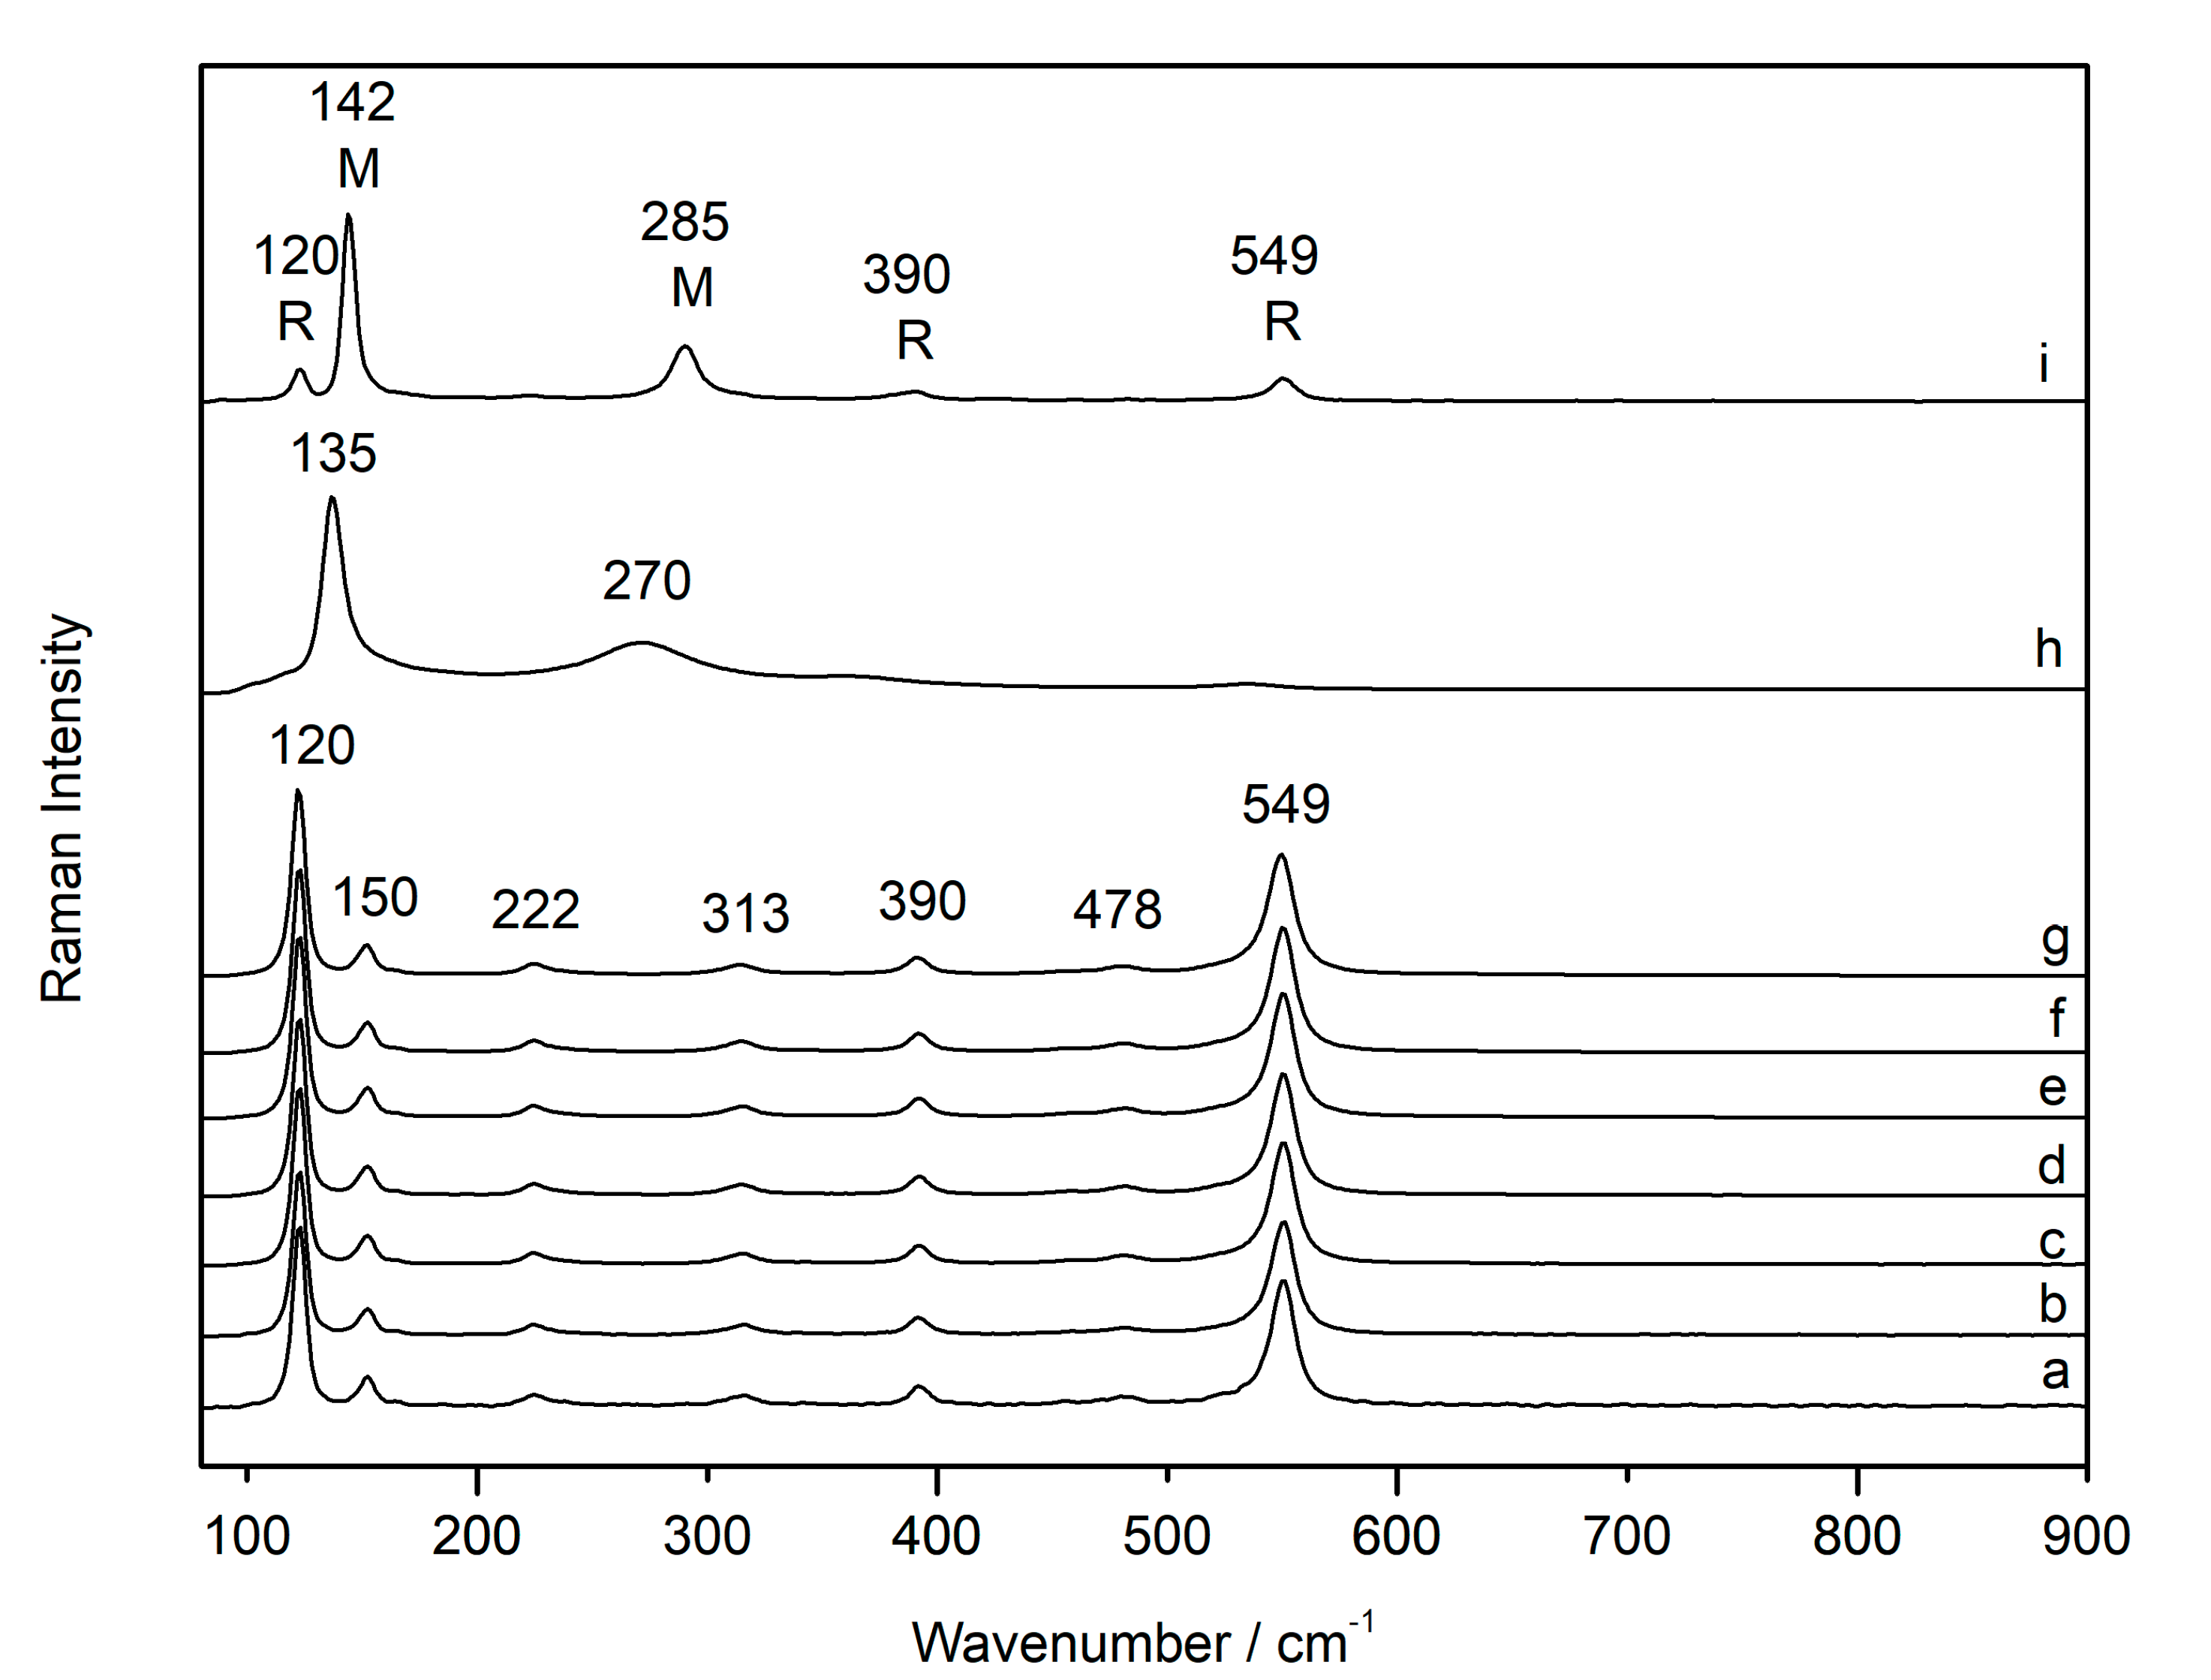
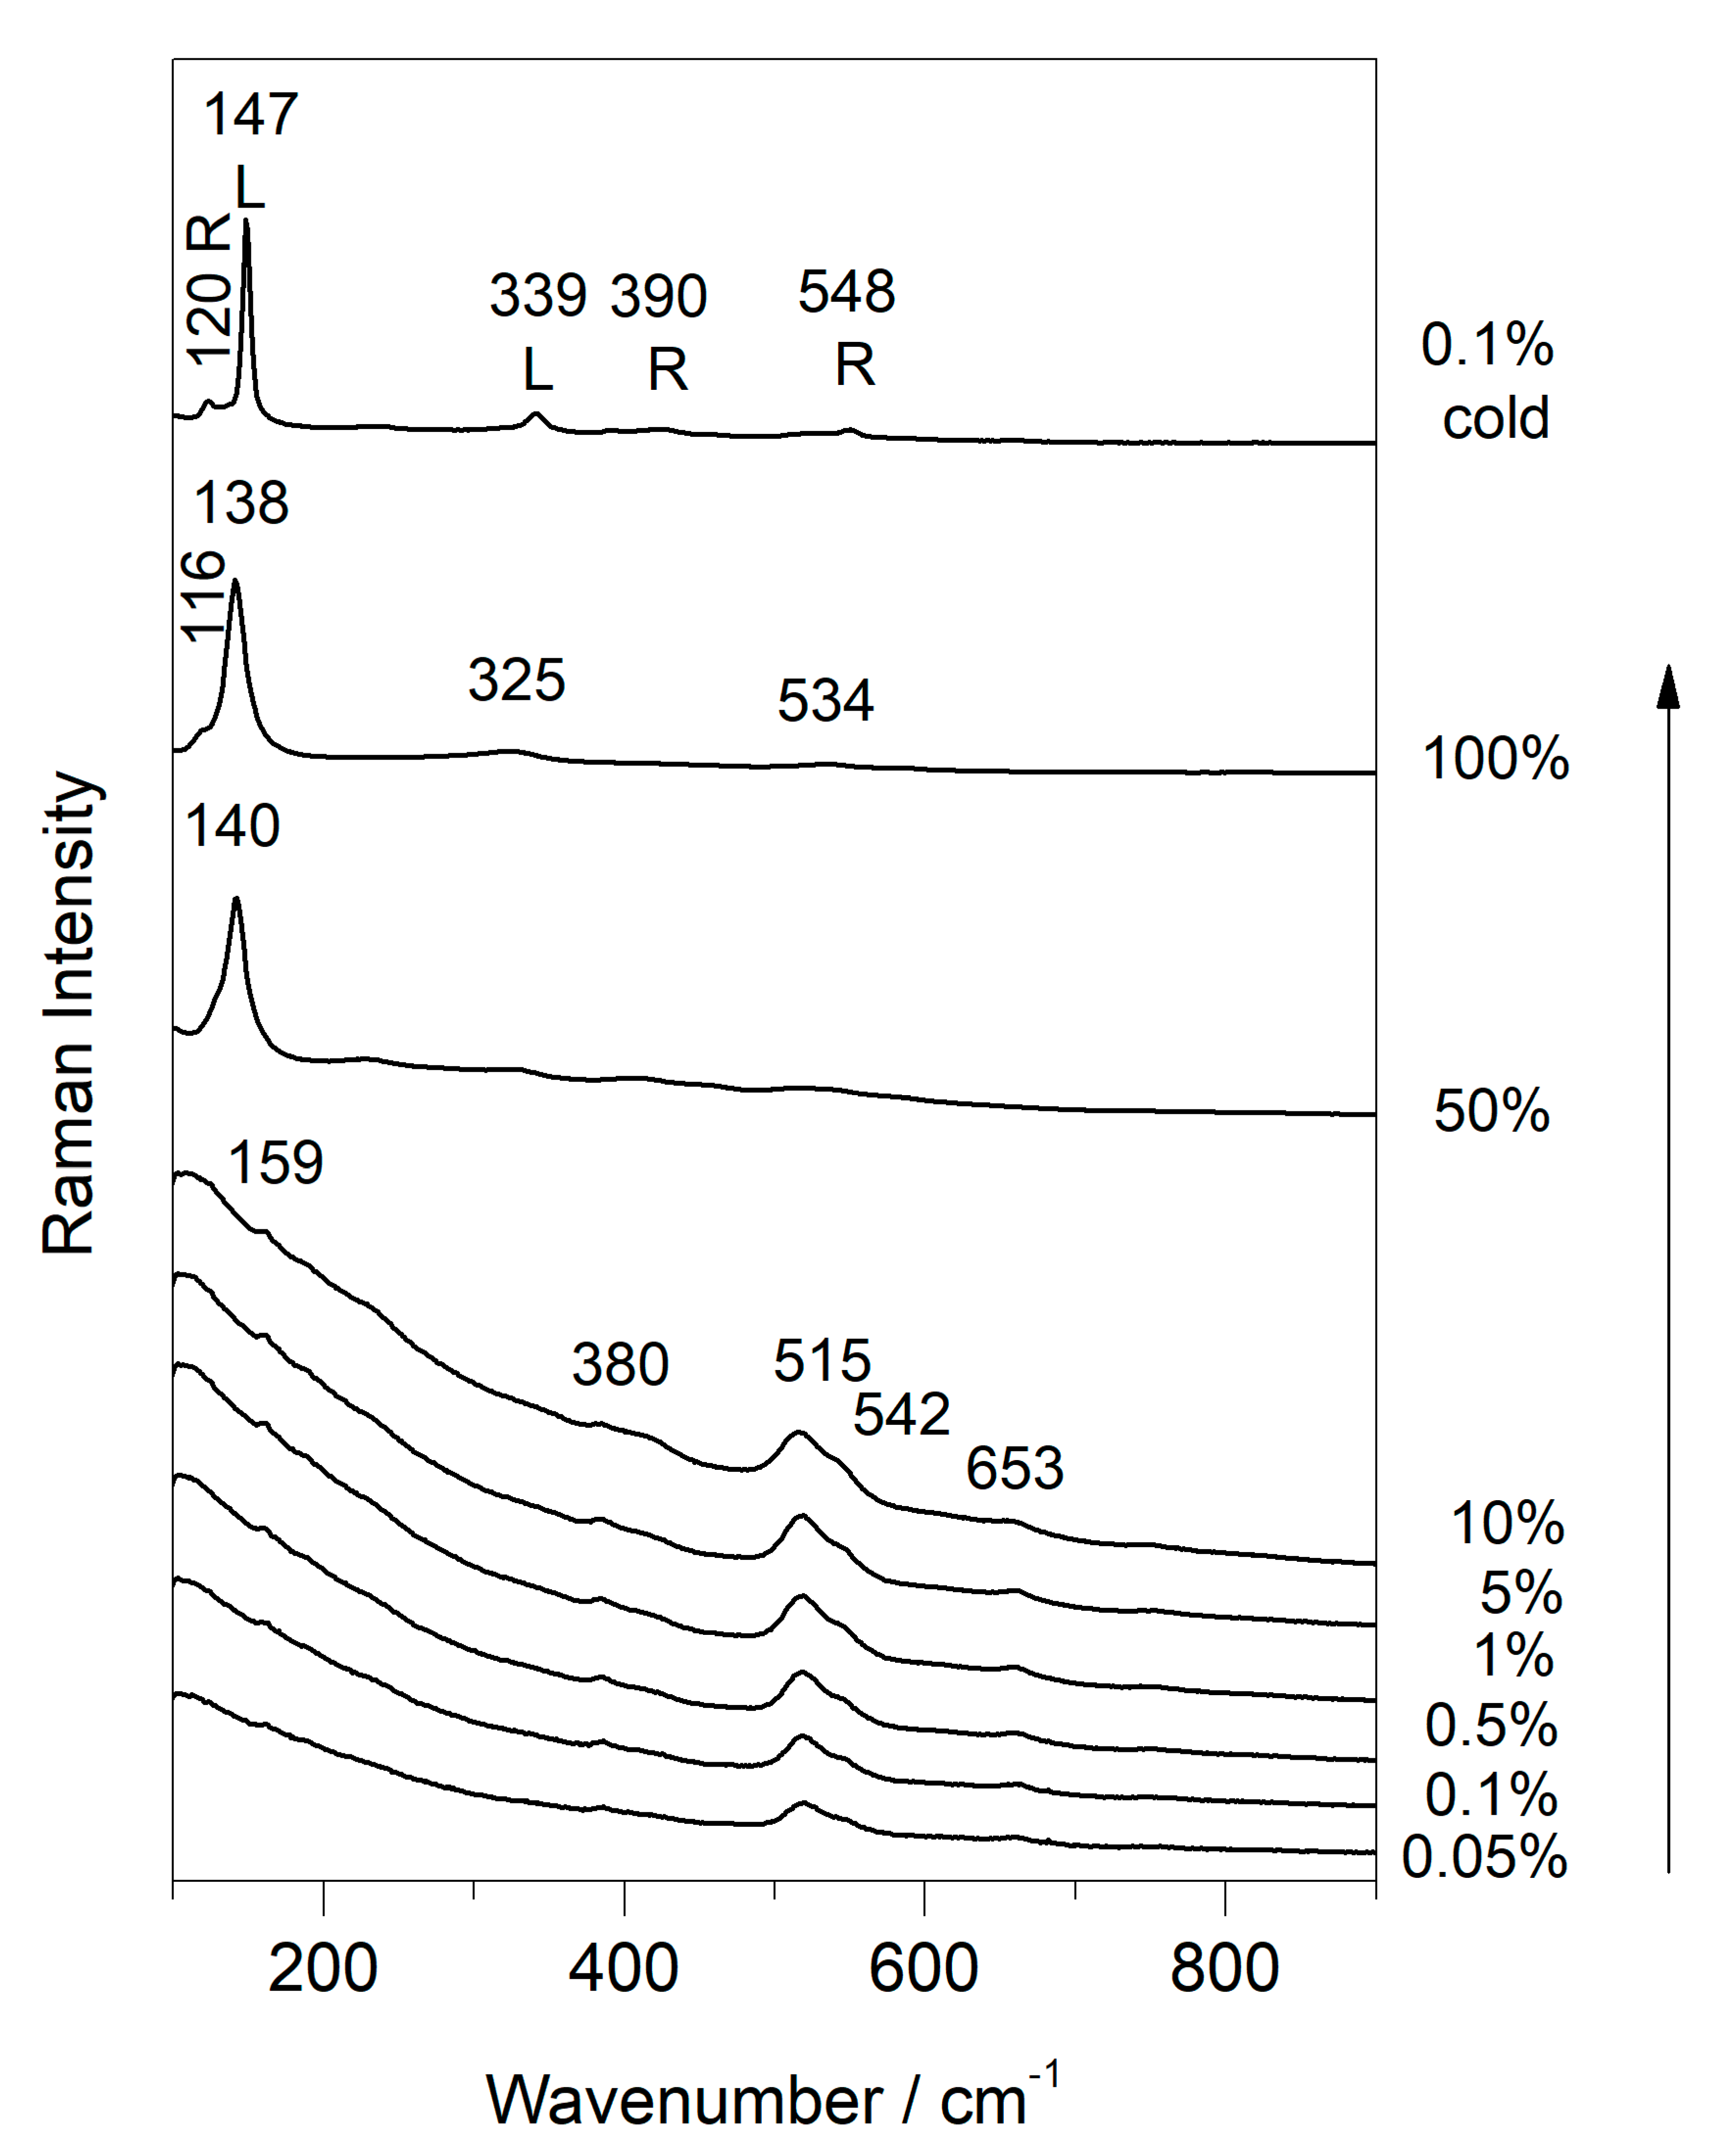
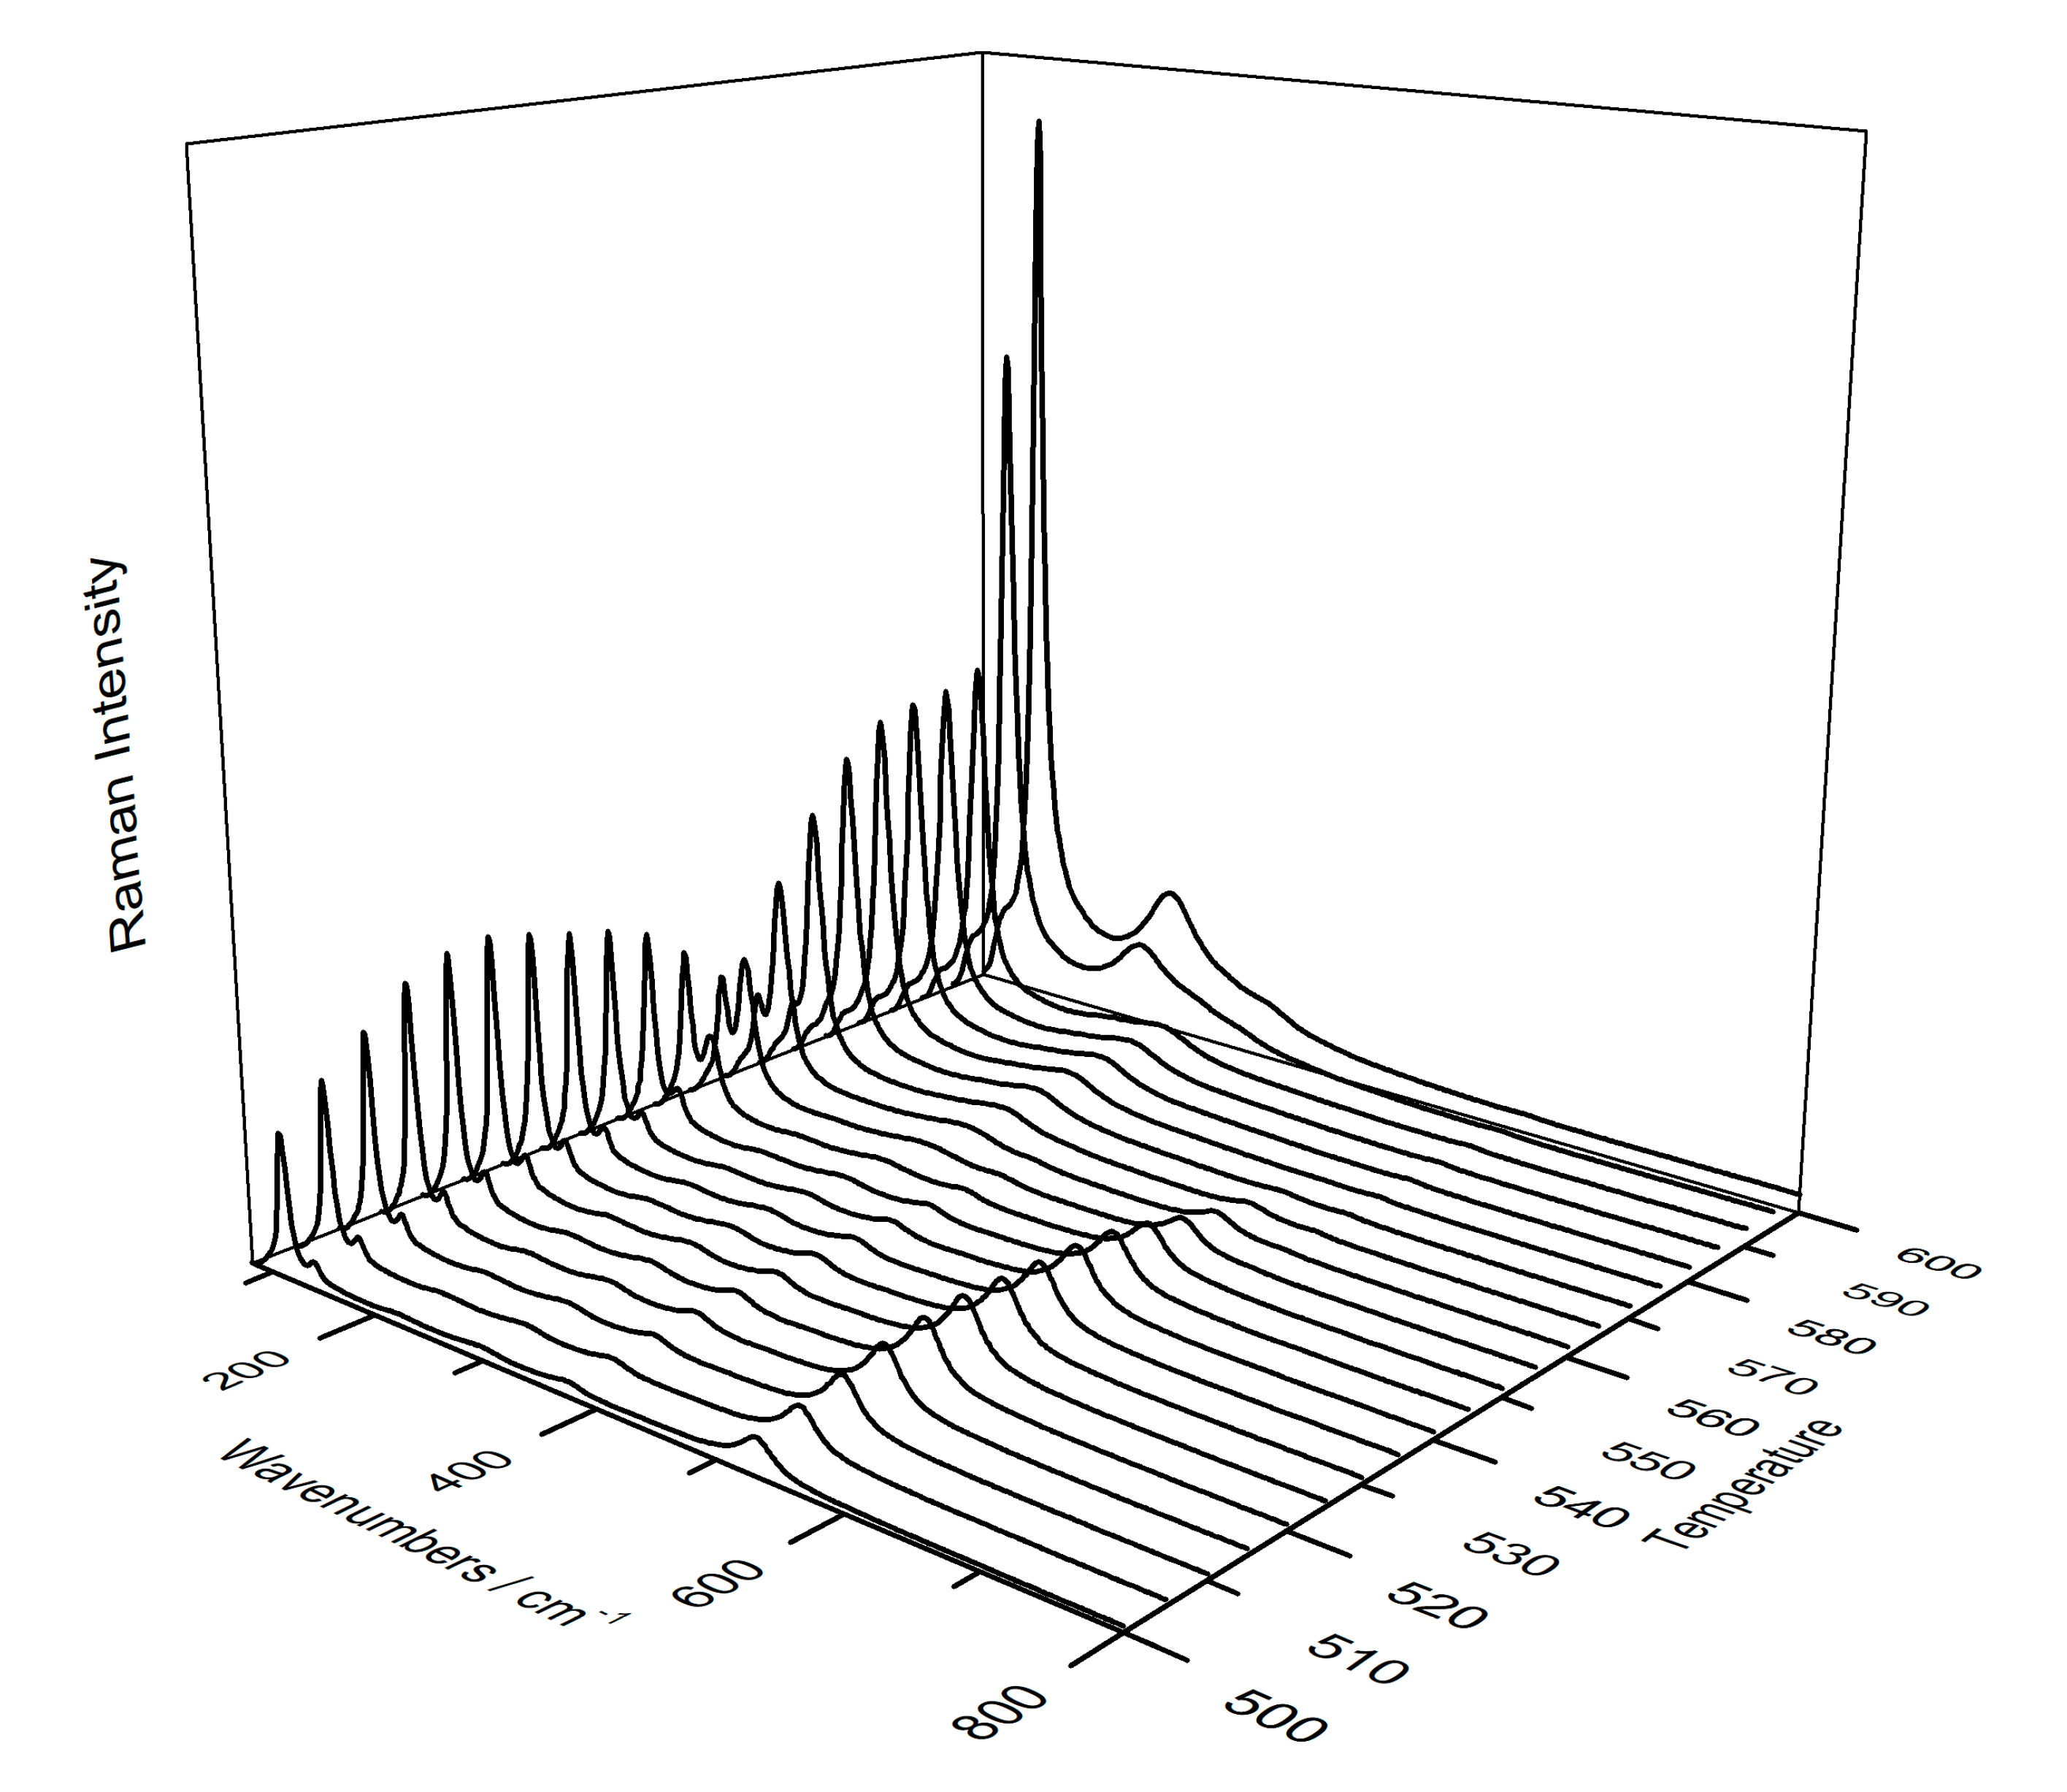
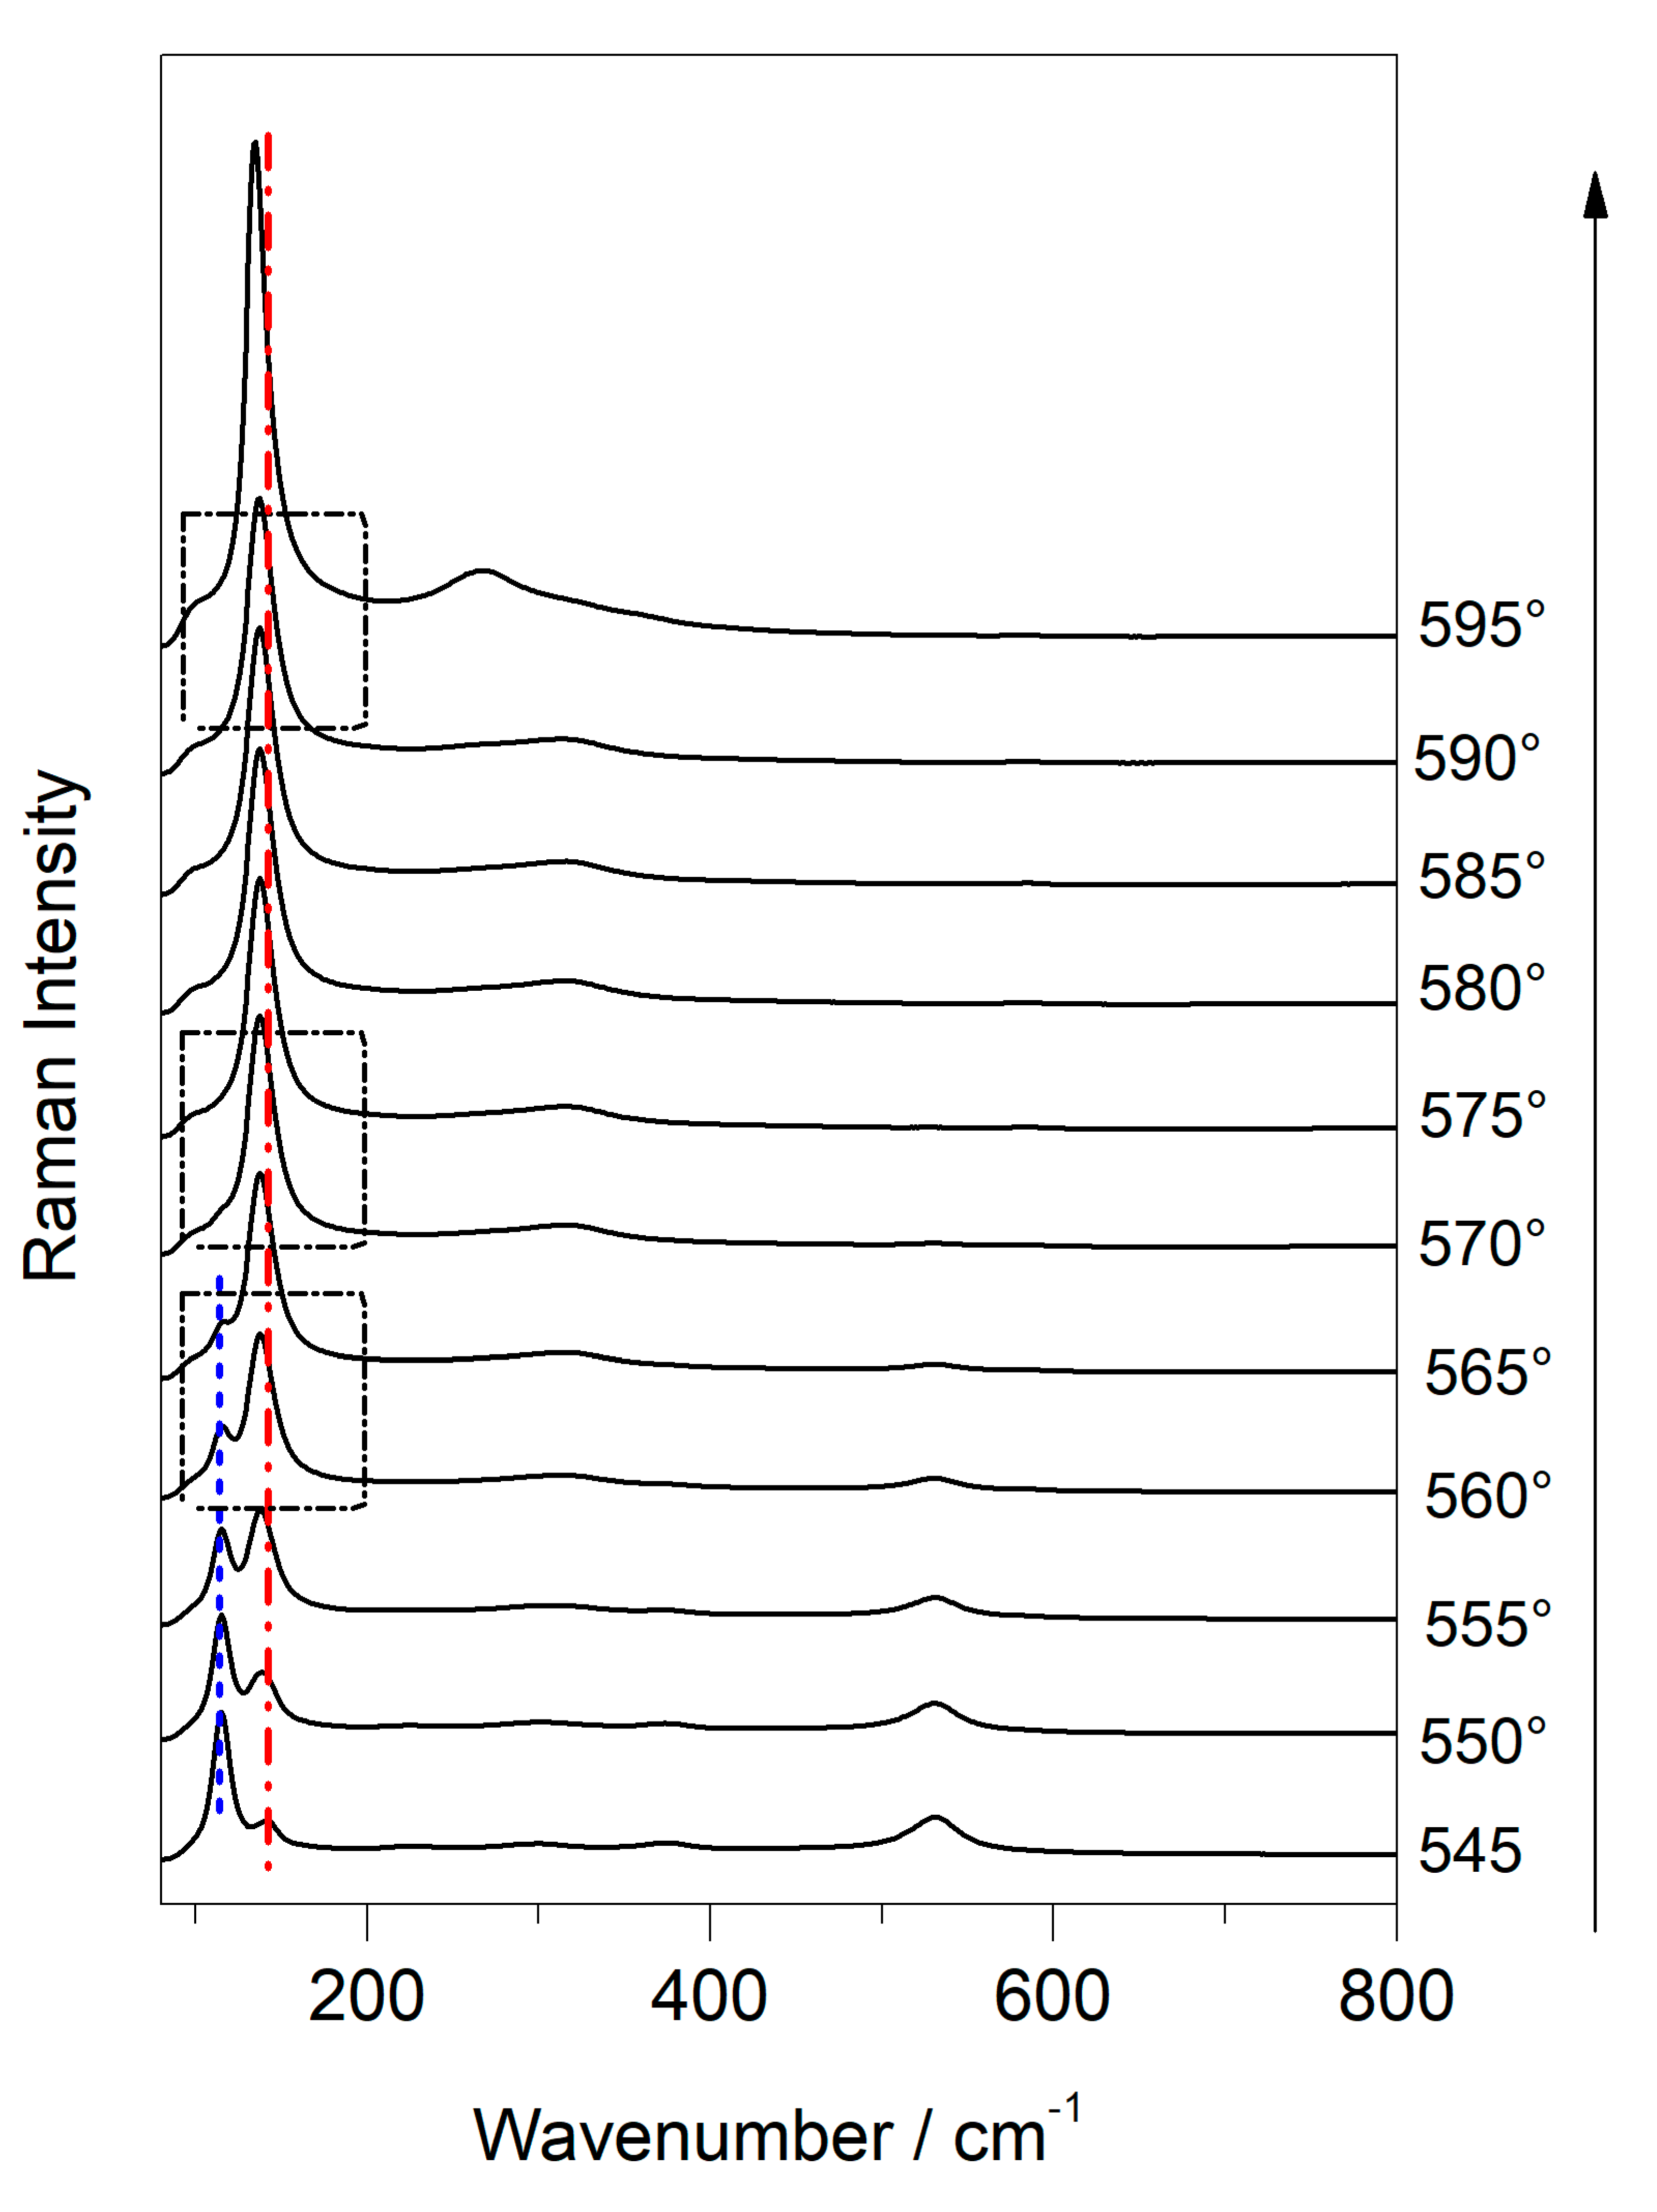
3.3. Use of Temperature-Controlled Stage to Study Phase Transition

At first, the temperature-controlled stage was used to verify whether the degradation of the plattnerite occurs at a temperature lower than 375 °C, as described in the literature. It was decided to prepare plattnerite pellets (samples C-P4 and C-P5) so that the surface was more flat and homogeneous, compared to the powder samples, and to avoid the analyses being influenced by the orientation of crystals. Then, pellets of plattnerite were inserted into the cell and the temperature was raised to different temperatures, starting at 300 °C and increasing in steps of 5 °C. The temperature was kept constant for half an hour inside the cell for each step. After cooling the sample, it was analysed again at minimum laser power (0.05%), in order not to induce further degradation. By these experiments we verified that the first phase transformation of plattnerite takes place at a temperature between 365 and 370 °C. In this interval, in fact, a broad band at about 426 cm−1 appeared, together with the plattnerite bands (515, 540 and 653 cm−1), which become increasingly evident in samples subjected to temperatures higher than 375 °C, as shown in the Raman spectrum in Figure 9a relative to a sample heated up to 400 °C. When the temperature increased, the product showed further transformation and the consequent formation of a lead compound (Figure 9b), whose spectrum was shown by Burgio et al. [16] to belong to a degradation compound identified as PbO1.55. On the other hand, according to Anderson et al. [35], the decomposition of plattnerite at 300–350 °C produced a monoclinic (pseudo-tetragonal) oxide, with a composition close to PbO1.57.
XRD analyses were carried out to identify the intermediate phases that had formed during the heating. Analysis of the plattnerite sample heated to 400 °C (C-P4) allowed us to identify a mixture of tetragonal β-PbO2 and monoclinic Pb12O19 (Figure 10a). On the other hand, analyses of the sample heated to 450 °C (C-P5) showed that the dominant phase was Pb12O19, compared to tetragonal β-PbO2. In addition, the presence of another diffraction peak between 10° and 22° theta, corresponding to a small amount of the lead oxide PbO1.57 monoclinic, was noted (Figure 10b). In the X-ray diffraction pattern, the peaks of potassium bromide (KBr) were present because this was used to make pellets mixed with plattnerite.
Experiments carried out with the construction of temperature ramps at low laser power (0.5%) did not show the formation of the degradation product PbO1.57, highlighting that it was caused by the heating induced by the laser power, since it was evident when using higher laser powers (1%, 5%). On the other hand, with 10% of the total laser power, it was not possible to detect PbO1.57, because the laser power was so high that plattnerite degraded directly into red lead.
In addition, thanks to the use of the temperature-controlled stage cell, it was possible to obtain a gradual degradation of plattnerite, and all phases were shown. Figure 11 and Figure 12 show the gradual transformation from red lead into litharge and massicot, generated by the thermal plattnerite degradation (sample C-P6). Following the formation of red lead, with the bands moving to lower wavelengths due to the heating of the sample, an increase in the intensity of the bands as the temperature increased was evident. All the bands belonging to Pb3O4 recorded at high temperatures, as a result of the plattnerite degradation, were evident (116, 145, 220, 299, 376 and 534 cm−1).
At 540 °C, an increase in the intensity of the band at 145 cm−1 was noticed, and even a gradual shift towards lower wavelengths. Between 550 °C and 555 °C, an inversion of intensity between the two bands at 116 and 140 cm−1 was visible in the Raman spectra in Figure 12. At 560 °C, the transition from red lead to litharge occurred, with the formation of the band at 138 cm−1 and one at 314 cm−1, and only the band at 534 cm−1 from red lead was visible, which lost intensity. In the spectrum collected at 570 °C the red lead bands were not visible, and only the litharge ones were present. Between 590 °C and 595 °C, the phase transition between litharge and massicot occurred, with the formation of the massicot bands at maximum power (at 135 and at 270 cm−1), which remained in that position even at 600 °C. Although the laser power used for the analyses was low (1%), a contribution of the laser to the formation of the secondary products could not be excluded. However, the formation of the massicot between 590 and 595 °C disagrees (5 °C) with what is reported in the literature.

4. Conclusions

The Raman spectrum of plattnerite can be collected by maintaining very low laser power, in order not to cause any thermally induced degradation phenomena that could cause a wrong interpretation of the results, especially when they are present as a degradation product over wall paintings. Therefore, in the presence of plattnerite, some precautions regarding the instrumental parameters to be used, in particular the laser power, should be taken if Raman spectroscopy is the chosen diagnostic analytical tool.
Raman analyses, performed with increasing laser power on historical painting samples of plattnerite and on commercial plattnerite samples, emphasised the photo/thermal instability of β-PbO2. However, the Raman signal obtained could be recognised from those of other lead-based compounds such as red lead, massicot and litharge, which arise from plattnerite degradation.
The same sensitivity was found for red lead, massicot and litharge, formed as laser-induced degradation products from plattnerite. In particular, test varying the laser power showed a shift of the main bands of about 20–25 cm−1, depending on the temperature. Such behaviour was not found for commercial samples of lead oxide (massicot, litharge and red lead), which showed a good stability with increasing temperature (laser power) when they were analysed with both 633 nm and 785 nm. For them, in fact, there was evidence of neither a widening of the band nor a shift towards lower wavelengths. At maximum laser power, the phase transition was seen only for the red lead. These characteristics could allow us to recognise their presence as secondary products, generated by the decomposition of plattnerite, or as pigments voluntarily used when they are found on wall paintings.
Experiments carried out using a temperature-controlled stage showed the progressive degradation of β-PbO2, confirming that it followed the path of Pb3O4, α-PbO and β-PbO. However, the degradation process was reversible, since the only contribution of the laser beam, even if used at maximum laser power, was not enough to obtain a stable form of massicot. Indeed, the intermediate products of the decomposition of plattnerite were evident when the sample was analysed again at low laser power after cooling.
New phases of lead oxides were formed during the Raman analyses of commercial plattnerite, and they were identified through XRD analyses. They were generated by the effect of the laser power due to the high thermal sensitivity of lead dioxide compounds during Raman analysis.
Only thanks to the use of the temperature-controlled stage was it possible to recognise the gradual degradation of the plattnerite. It allowed us to see the Raman spectra belonging to the different phase transitions, which it had not been possible obtain by same point analysis via varying the laser power.
These findings indicate that, in the presence of lead compounds, it is very important to use a low laser power during the Raman measurements, in order not to induce structural modification and to obtain an exact characterisation of the materials, especially when they are found on mural paintings’ surfaces.
However, the difference in behaviour found between pigments from historical painting samples and commercial pigments under the effect of the laser power could be determined by the type of painting technique used for the realization of the artwork under study; in our case, the painting was made with the fresco technique. Thus, it would be interesting to extend the study to other type of paintings in order to verify whether the behaviour of plattnerite found in wall paintings could also be influenced by the presence of other minerals present in the surface and in the matrix. In particular, it could be interesting to test the behaviour of lead oxide and its degradation products in tempera painting, to understand the influence of the binder when the substances are subjected to a degradation process induced by laser power during Raman analysis.

Author Contributions

Conceptualization, P.P.L. and K.C.; methodology, I.C. and J.M.M.; validation, K.C.; investigation, I.C.; resources, J.M.M.; writing—original draft preparation, I.C.; writing—review and editing, P.P.L., K.C. and J.M.M.; supervision, K.C.; project administration, J.M.M.; funding acquisition, J.M.M. All authors have read and agreed to the published version of the manuscript.

Funding

This research was funded by the Spanish Agency for Research AEI (MINEICO/FEDER-UE), grant number BIA2017-87063-P.

Acknowledgments

This work has been financially supported by the MADyLIN project (Grant BIA2017-87063-P) funded by the Spanish Agency for Research AEI (MINEICO/FEDER-UE). Technical and manpower support provided by SGIker (UPV/EHU, MICINN, GV/EJ, ERDF and ESF) is gratefully acknowledged in XRD analysis. Authors would like to thank all the support done by the Department of Inorganic Chemistry of the University of the Basque Country.

Conflicts of Interest

The authors declare no conflict of interest.

References

  1. Aze, S.; Vallet, J.-M.; Pomey, M.; Baronnet, A.; Grauby, O. Red Lead Darkening in Wall Paintings: Natural Ageing of Experimental Wall Paintings versus Artificial Ageing Tests. Eur. J. Miner. 2007, 19, 883–890. [Google Scholar] [CrossRef]
  2. Vagnini, M.; Vivani, R.; Viscuso, E.; Favazza, M.; Brunetti, B.G.; Sgamellotti, A.; Miliani, C. Investigation on the Process of Lead White Blackening by Raman Spectroscopy, XRD and Other Methods: Study of Cimabue’s Paintings in Assisi. Vib. Spectrosc. 2018, 98, 41–49. [Google Scholar] [CrossRef]
  3. Giovannoni, S.; Matteini, M.; Moles, A. Studies and Developments Concerning the Problem of Altered Lead Pigments in Wall Painting. Stud. Conserv. 1990, 35, 21–25. [Google Scholar]
  4. Coccato, A.; Moens, L.; Vandenabeele, P. On the Stability of Mediaeval Inorganic Pigments: A Literature Review of the Effect of Climate, Material Selection, Biological Activity, Analysis and Conservation Treatments. Herit. Sci. 2017, 5, 1–12. [Google Scholar]
  5. Daniilia, S.; Minopoulou, E. A Study of Smalt and Red Lead Discolouration in Antiphonitis Wall Paintings in Cyprus. Appl. Phys. A 2009, 96, 701–711. [Google Scholar]
  6. Kotulanová, E.; Bezdička, P.; Hradil, D.; Hradilová, J.; Švarcová, S.; Grygar, T. Degradation of Lead-Based Pigments by Salt Solutions. J. Cult. Herit. 2009, 10, 367–378. [Google Scholar] [CrossRef]
  7. Hradil, D.; Hradilová, J.; Kočí, E.; Švarcová, S.; Bezdička, P.; Maříková-Kubková, J. Unique Pre-Romanesque Murals in Kostoľany Pod Tríbečom, Slovakia: The Painting Technique and Causes of Damage. Archaeometry 2013, 55, 691–706. [Google Scholar] [CrossRef]
  8. Aze, S.; Vallet, J.-M.; Detalle, V.; Grauby, O.; Baronnet, A. Chromatic Alterations of Red Lead Pigments in Artworks: A Review. Phase Transit. 2008, 81, 145–154. [Google Scholar] [CrossRef]
  9. Daniilia, S.; Sotiropoulou, S.; Bikiaris, D.; Salpistis, C.; Karagiannis, G.; Chryssoulakis, Y.; Price, B.A.; Carlson, J.H. Panselinos’ Byzantine Wall Paintings in the Protaton Church, Mount Athos, Greece: A Technical Examination. J. Cult. Herit. 2000, 1, 91–110. [Google Scholar] [CrossRef]
  10. Petushkova, J.P.; Lyalikova, N.N. Microbiological Degradation of Lead-Containing Pigments in Mural Paintings. Stud. Conserv. 1986, 31, 65–69. [Google Scholar]
  11. Feng, Q.; Zhang, X.; Ma, X. Effects of Microbes on Color Changes of Red Lead in Murals. J. Gen. Appl. Microbiol. 1999, 45, 85–88. [Google Scholar]
  12. Rosado, T.; Gil, M.; Mirão, J.; Candeias, A.; Caldeira, A.T. Darkening on Lead-Based Pigments: Microbiological Contribution. Color Res. Appl. 2016, 41, 294–298. [Google Scholar] [CrossRef]
  13. Aze, S.; Vallet, J.-M.; Baronnet, A.; Grauby, O. The Fading of Red Lead Pigment in Wall Paintings: Tracking the Physico-Chemical Transformations by Means of Complementary Micro-Analysis Techniques. Eur. J. Mineral. 2006, 18, 835–843. [Google Scholar] [CrossRef]
  14. Holakooei, P.; Karimy, A.-H. Early Islamic Pigments Used at the Masjid-i Jame of Fahraj, Iran: A Possible Use of Black Plattnerite. J. Archaeol. Sci. 2015, 54, 217–227. [Google Scholar] [CrossRef]
  15. De Ferri, L.; Mazzini, F.; Vallotto, D.; Pojana, G. In Situ Non-Invasive Characterization of Pigments and Alteration Products on the Masonry Altar of S. Maria Ad Undas (Idro, Italy). Archaeol. Anthropol. Sci. 2019, 11, 609–625. [Google Scholar] [CrossRef]
  16. Burgio, L.; Clark, R.J.H.; Firth, S. Raman Spectroscopy as a Means for the Identification of Plattnerite (PbO2), of Lead Pigments and of Their Degradation Products. Analyst 2001, 126, 222–227. [Google Scholar] [CrossRef]
  17. Andalò, C.; Bicchieri, M.; Bocchini, P.; Casu, G.; Galletti, G.C.; Mandò, P.A.; Nardone, M.; Sodo, A.; Plossi Zappalà, M. The Beautiful “Trionfo d’Amore” Attributed to Botticelli: A Chemical Characterisation by Proton-Induced X-Ray Emission and Micro-Raman Spectroscopy. Anal. Chim. Acta 2001, 429, 279–286. [Google Scholar] [CrossRef]
  18. Smith, G.D.; Burgio, L.; Firth, S.; Clark, R.J.H. Laser-Induced Degradation of Lead Pigments with Reference to Botticelli’s Trionfo d’Amore. Anal. Chim. Acta 2001, 440, 185–188. [Google Scholar] [CrossRef]
  19. Santis, A.D.; Mattei, E.; Pelosi, C. Micro-Raman and Stratigraphic Studies of the Paintings on the ‘Cembalo’ Model Musical Instrument (A.D. 1650) and Laser-Induced Degradation of the Detected Pigments. J. Raman Spectrosc. 2007, 38, 1368–1378. [Google Scholar] [CrossRef]
  20. Vila, M.; Díaz-Guerra, C.; Piqueras, J. Laser Irradiation-Induced α to δ Phase Transformation in Bi2O3 Ceramics and Nanowires. Appl. Phys. Lett. 2012, 101, 71905. [Google Scholar] [CrossRef] [Green Version]
  21. Camacho-López, M.A.; Escobar-Alarcón, L.; Picquart, M.; Arroyo, R.; Córdoba, G.; Haro-Poniatowski, E. Micro-Raman Study of the m-MoO2 to α-MoO3 Transformation Induced by Cw-Laser Irradiation. Opt. Mater. 2011, 33, 480–484. [Google Scholar] [CrossRef]
  22. Vásquez, G.C.; Peche-Herrero, M.A.; Maestre, D.; Gianoncelli, A.; Ramírez-Castellanos, J.; Cremades, A.; González-Calbet, J.M.; Piqueras, J. Laser-Induced Anatase-to-Rutile Transition in TiO2 Nanoparticles: Promotion and Inhibition Effects by Fe and Al Doping and Achievement of Micropatterning. J. Phys. Chem. C 2015, 119, 11965–11974. [Google Scholar] [CrossRef]
  23. Costantini, I.; Lottici, P.P.; Bersani, D.; Pontiroli, D.; Casoli, A.; Castro, K.; Madariaga, J.M. Darkening of Lead- and Iron-Based Pigments on Late Gothic Italian Wall Paintings: Energy Dispersive X-Ray Fluorescence, μ-Raman, and Powder X-Ray Diffraction Analyses for Diagnosis: Presence of β-PbO2 (Plattnerite) and α-PbO2 (Scrutinyite). J. Raman Spectrosc. 2020, 51, 680–692. [Google Scholar] [CrossRef]
  24. Clark, G.L.; Schieltz, N.C.; Quirke, T.T. A New Study of the Preparation and Properties of the Higher Oxides of Lead. J. Am. Chem. Soc. 1937, 59, 2305–2308. [Google Scholar] [CrossRef]
  25. Greenwood, N.N.; Earnshaw, A. Chemistry of the Elements, 2nd ed.; Elsevier Butterworth-Heinemann: Oxford, UK, 1997. [Google Scholar]
  26. Bordalo, R.; Morais, P.J.; Gouveia, H.; Young, C. Laser Cleaning of Easel Paintings: An Overview. Laser Chem. 2006, 2006, 1–9. [Google Scholar] [CrossRef] [PubMed] [Green Version]
  27. Bordalo, R. Characterisation of Laser-Induced Physical Alterations of Pigmented Oil Layers. e-PS 2012, 9, 47–59. [Google Scholar]
  28. Pouli, P.; Emmony, D.C.; Madden, C.E.; Sutherland, I. Studies towards a Thorough Understanding of the Laser-Induced Discoloration Mechanisms of Medieval Pigments. J. Cult. Herit. 2003, 4, 271–275. [Google Scholar] [CrossRef]
  29. Cooper, M.I.; Fowles, P.S.; Tang, C.C. Analysis of the Laser-Induced Discoloration of Lead White Pigment. Appl. Surf. Sci. 2002, 201, 75–84. [Google Scholar] [CrossRef]
  30. Aze, S.; Delaporte, P.; Vallet, J.M.; Detalle, V.; Baronnet, A. Towards the restoration of darkened red lead containing mural paintings. In Lasers in the Conservation of Artworks, Proceedings of the International Conference Lacona VII, Madrid, Spain, 17–21 September 2007; Castillejo, P.M., Moreno, M., Oujja, R., Radvan, J.R., Eds.; CRC Press: Boca Raton, FL, USA, 2008; pp. 11–13. [Google Scholar]
  31. Bayne, J.M.; Butler, I.S. Variable-Temperature and High-Pressure Micro-Raman Spectra of Inorganic Artists’ Pigments: Crystalline Wulfenite, Lead(II) Molybdate(VI), PbMoO4. Spectrosc. Lett. 2014, 47, 616–620. [Google Scholar] [CrossRef]
  32. Bayne, J.M.; Butler, I.S. Effect of Temperature and Pressure on Selected Artists’ Pigments. New J. Chem. 2013, 37, 3833–3839. [Google Scholar] [CrossRef]
  33. Smith, G.D.; Firth, S.; Clark, R.J.H.; Cardona, M. First- and Second-Order Raman Spectra of Galena (PbS). J. Appl. Phys. 2002, 92, 4375–4380. [Google Scholar] [CrossRef]
  34. Zoellner, M.T.; Ziemann, M.A. Plattnerite-Scrutinyite in a Central Asian Wall Painting of a Buddhist Cave Temple of the Northern Silk Road. In Abstracts Conference Programme, Proceedings of the 10th International Congress on the Application of Raman Spectroscopy in Art and Archaeology, Potsdam, Germany, 3–7 September 2019; Institute of Geosciences at the University of Potsdam: Potsdam, Germany, 2019. [Google Scholar]
  35. Anderson, J.S.; Sterns, M. The Intermediate Oxides of Lead. J. Inorg. Nucl. Chem. 1959, 11, 272–285. [Google Scholar] [CrossRef]
Figure 1. Raman spectrum of the alteration product found on the wall painting surface (633 nm excitation laser).
Minerals 10 00468 g001
Figure 2. Thermal evolution of the Raman spectrum of a sample of frescoes containing plattnerite and scrutinyite while varying the laser power: low power D2 (a), increasing power D0.6 (b), D0.0 (c), and low laser power D2 (d).
Minerals 10 00468 g002
Figure 3. Raman spectra of red lead commercial powder collected with increasing laser power D2 (a), D1 (b), D0 (c), showing its insensibility to laser-induced heating with 633 nm excitation line.
Minerals 10 00468 g003
Figure 4. Raman spectra of red lead with increasing laser power (633 nm) from 0.05% to 50% (ag), analysed with 100% (h) and again with low laser power 0.05% after cooling, where a mixture of red lead (R) and massicot (M) is shown (i).
Minerals 10 00468 g004
Figure 5. Raman spectra collected on a sample of powdered commercial plattnerite (a) collected at low laser power, and its decay products massicot (b) and litharge (c) generated with increasing laser power. The features were shifted towards lower wavenumbers as a consequence of the heating caused by laser power.
Minerals 10 00468 g005
Figure 6. Raman bands of litharge (on the left) and massicot (on the right), generated from plattnerite degradation, with laser power increase: D2 (a), D1(b), D0.6 (c), D0.3 (d), D0.0 (e). Note: see Table 2 and Table 3 for bands of litharge and massicot, respectively.
Minerals 10 00468 g006
Figure 7. Value of the full width at half maximum (FWHM) of the main band of litharge (α-PbO) and massicot (β-PbO) as a function of the laser power.
Minerals 10 00468 g007
Figure 8. Phase transition of commercial plattnerite (785 nm line excitation) by varying the laser power from 0.05% up to 100%, and then with low laser power 0.1%. A mixture of red lead (R) and litharge (L) is shown in the spectra at low laser power.
Minerals 10 00468 g008
Figure 9. Raman spectrum of plattnerite after heating to 400 and 430 °C degrees in temperature-control stage, and analysed with 0.5% laser power. The asterisks in the spectrum (a) indicate the initial formation of the lead oxide shows in the spectrum (b).
Minerals 10 00468 g009
Figure 10. X-ray diffraction pattern of commercial plattnerite samples heated to 400 °C (a) and 450 °C (b). The magnification on the left shows the presence of the lead oxide PbO1.57 in the sample heated to 450 °C.
Minerals 10 00468 g010
Figure 11. 3D representation of Raman spectra shows the phase transition from red lead to litharge and then massicot, with increasing temperature (from 500 °C to 600 °C) using temperature-controlled stage.
Minerals 10 00468 g011
Figure 12. Raman spectra show the phase transition of plattnerite with increasing temperature (from 500 °C to 600 °C) using temperature-controlled stage. The vertical lines indicate the bands that undergo a change in intensity and position, while the boxes underline the spectra in which the transition from red lead to litharge (560 °C), the only presence of litharge (570 °C) and the final transition to massicot (590/595 °C) are visible.
Minerals 10 00468 g012
Table 1. Raman bands (cm−1) and correspondence found on the wall paintings samples while varying the laser power with the density of absorbing neutral filters D2, D0.6, D0.0 and D2.
CompoundsD2D0.6D0.0D2
Plattnerite (β- PbO2)515
Scrutiniyte (α-PbO2)82, 165, 228
Red lead Pb3O4 116 (shi), 534 (shi) 122, 548
Litharge (α-PbO) 77 (shi)77 (shi), 328 (shi)80, 146, 336
Massicot (β-PbO) 138 (br/shi)137 (br/shi), 81 (shi), 270 (shi)85, 142 (sh), 285
shoulder (sh), broad (br), shifted (shi).
Table 2. Raman bands of litharge, generated from plattnerite degradation, with laser power increase: D2 (a), D1 (b), D0.6 (c), D0.3 (d), D0.0 (e).
Litharge α-PbO-Tetragonal
D281 m146 vs340 w
D181 m145 vs338 w
D0.682 m145 vs337 w
D0.382 m144 vs335 w
D0.077 m140 vs325 w
vs, very strong; m, medium; w, weak.
Table 3. Raman bands of massicot, generated from plattnerite degradation, with increasing laser power: D2 (a), D1 (b), D06 (c), D03 (d), D0.0 (e).
Massicot β-PbO-Orthorhombic
D274 w91 m145 vs292 m
D173 w89 m143 vs290 m
D0.670 w84 m142 vs285 m
D0.367 w83 m138 vs 280 m
D0.066 w81 m 135 vs271 m
vs, very strong; m, medium; w, weak.

