Abstract
Flexible grid regulation necessitates Francis turbines to operate at heads of 120–180 m (compared to the rated head of 154.6 m), breaking the designed rotational symmetry and inducing hydraulic instabilities that threaten structural integrity and operational reliability. This study presents extensive field measurements of pressure pulsations in a 600 MW prototype Francis turbine operating at heads of 120–180 m and loads of 20–600 MW across 77 operating conditions (7 head levels × 11 load points). We strategically positioned high-precision piezoelectric pressure sensors at three critical locations—volute inlet, vaneless space, and draft tube cone—to capture the amplitude and frequency characteristics of symmetry-breaking phenomena. Advanced signal processing revealed three distinct mechanisms with characteristic pressure pulsation signatures: (1) Draft tube rotating vortex rope (RVR) represents spontaneous breaking of axial symmetry, exhibiting helical precession at 0.38 Hz (approximately 0.18 fn, where fn = 2.08 Hz) with maximum peak-to-peak amplitudes of 108 kPa (87% of the rated pressure prated = 124 kPa) at H = 180 m and P = 300 MW, demonstrating approximately 70% amplitude reduction potential through load-based operational strategies. (2) Vaneless space rotor-stator interaction (RSI) reflects periodic disruption of the combined C24 × C13 symmetry at the blade-passing frequency of 27.1 Hz (Nr × fn = 13 × 2.08 Hz), reaching peak amplitudes of 164 kPa (132% prated) at H = 180 m and P = 150 MW, representing the most severe symmetry-breaking phenomenon. (3) Volute multi-point excitation exhibits broadband spectral characteristics (4–10 Hz) with peak amplitudes of 146 kPa (118% prated) under small guide vane openings. The spatial amplitude hierarchy—vaneless space (164 kPa) > volute (146 kPa) > draft tube (108 kPa)—directly correlates with the local symmetry-breaking intensity, providing quantitative evidence for the relationship between geometric symmetry disruption and hydraulic excitation magnitude. Systematic head-dependent amplitude increases of 22–43% across all monitoring locations are attributed to effects related to Euler head scaling and Reynolds number variation, with the vaneless space demonstrating the highest sensitivity (0.83 kPa/m, equivalent to 0.67% prated/m). The study establishes data-driven operational guidelines identifying forbidden operating regions (H = 160–180 m, P = 20–150 MW for vaneless space; H = 160–180 m, P = 250–350 MW for draft tube) and critical monitoring frequencies (0.38 Hz for RVR, 27.1 Hz for RSI), providing essential reference data for condition monitoring systems and operational optimization of large Francis turbines functioning as flexible grid-regulating units in renewable energy integration scenarios.
1. Introduction
Hydropower systems constitute essential infrastructure in modern energy networks, providing both baseload generation and rapid grid response capabilities for renewable energy integration [1,2]. As global energy systems transition toward carbon neutrality, hydropower facilities are increasingly required to operate as flexible regulating units, frequently adjusting output to compensate for the intermittent nature of wind and solar generation [3,4]. This operational paradigm breaks the designed rotational symmetry, compromising hydraulic stability and long-term reliability [5,6].
Francis turbines are fundamentally designed with rotational symmetry as a core principle. The runner features multiple blades arranged in a circumferentially symmetric pattern (typically 13–17 blades for large units), with each blade having identical geometry and equiangular spacing. This N-fold rotational symmetry (where N equals the blade number) ensures theoretically uniform pressure and velocity distributions across all inter-blade channels under design conditions. Mathematically, the system is described by the cyclic symmetry group Cn, where the system is invariant under rotation by 2π/N radians [7,8].
The guide vane system similarly exhibits rotational symmetry, with 20–32 uniformly distributed vanes creating a symmetric flow control mechanism. Under optimal design conditions, this symmetric geometry generates symmetric flow patterns characterized by uniform circumferential velocity distributions, balanced blade loading, and axisymmetric discharge into the draft tube [9,10].
However, operation away from design conditions necessarily breaks this inherent symmetry through multiple mechanisms. Partial guide vane openings create non-uniform inlet flow distributions, representing explicit symmetry breaking. Mismatched discharge and head conditions generate swirling flows with asymmetric velocity profiles at the runner outlet, resulting in spontaneous symmetry breaking [11,12]. These mechanisms induce symmetry-breaking phenomena including Rotating Vortex Ropes (RVR) (spontaneous breaking of axial symmetry in swirling flows), unbalanced rotor-stator interactions (periodic temporal disruptions), and localized flow separation (spatial symmetry breaking). Understanding these phenomena is essential for developing effective mitigation strategies and optimizing turbine operation across extended operating ranges.
Francis turbine pressure pulsations originate from complex fluid-mechanical interactions, including RVR formation in draft tubes, Rotor-Stator Interaction (RSI) between guide vanes and runner blades, flow separation phenomena, cavitation inception, and von Kármán vortex shedding [13,14]. Among these mechanisms, RVR represents the most significant source of low-frequency excitation during part-load operation. These structures exhibit helical vortex configurations with characteristic precession frequencies typically in the range of 0.2 to 0.4 times the runner rotational frequency [15,16]. They generate substantial pressure fluctuations that propagate throughout the turbine system, inducing structural vibrations, power oscillations, and acoustic emissions [17,18].
Recent investigations have significantly advanced the understanding of vortex rope dynamics in Francis turbines. Foroutan and Yavuzkurt [19] conducted detailed simulations of vortex rope formation in a simplified draft tube at partial load, revealing the complex three-dimensional flow structures and their temporal evolution. Their work demonstrated that the vortex rope exhibits a precessing helical structure with well-defined frequency characteristics. Complementing this, computational and theoretical analyses by [20] established fundamental relationships between swirl number, precession frequency, and pressure pulsation amplitude in scaled model Francis turbines. More recently, studies on related geometries have expanded our understanding: investigations of vortex flow in dustpan-shaped conduits of low-head axial-flow pump-turbines [21] have shown similar helical instability patterns, suggesting universality in the physical mechanisms. Novel passive control techniques, such as the decelerator approach reported by [22], have demonstrated potential for reducing swirl intensity and mitigating pressure fluctuations in Francis turbine draft tubes through geometric flow conditioning.
RSI effects arise from the relative motion between stationary guide vanes and rotating runner blades, generating periodic pressure waves at the blade-passing frequency and its harmonics [23]. These high-frequency pulsations subject flow passage components to cyclic loading, promoting high-cycle fatigue and potential crack propagation [24,25].
Substantial progress has been achieved in turbine pressure oscillation research through theoretical analysis, scaled model experiments, and computational fluid dynamics (CFD) simulations [26,27,28,29]. However, model tests suffer from scale effects and Reynolds number discrepancies when extrapolating to prototype applications [30]. Specifically, model tests are typically conducted at Reynolds numbers (Re) of 105 to 106, which are 1–2 orders of magnitude lower than prototype conditions (Re ≈ 107 to 108). This Reynolds number discrepancy leads to several critical scale effects: (1) Thicker boundary layers in models result in different flow separation characteristics and wake structures compared to prototypes; (2) The transition from laminar to turbulent flow occurs at different locations, affecting the overall flow field development; (3) Viscous effects are relatively more dominant in models, altering the vortex rope formation mechanism and pressure pulsation amplitude; (4) The interaction between turbulent structures and geometric boundaries exhibits different characteristics due to the modified turbulence scales. Consequently, pressure pulsation amplitudes measured in model tests often underestimate prototype values by 20–40%, and frequency characteristics may shift due to the altered flow physics. Recent comparative studies have demonstrated amplitude discrepancies of 20–40% between model predictions and prototype measurements under equivalent operating conditions [31]. CFD simulations, while enabling detailed three-dimensional unsteady flow analysis, remain highly sensitive to turbulence modeling approaches and computational mesh resolution [32,33,34].
Prototype field testing offers unparalleled authenticity by directly capturing pressure pulsations under actual operating conditions, naturally incorporating real-world influences such as water hammer effects and reservoir level fluctuations [35,36]. However, due to substantial costs and operational constraints, studies focusing on wide-head-range pressure pulsations in large Francis turbines remain relatively limited [37,38].
The novelty and unique contributions of the present investigation compared to existing literature are threefold: (1) Systematic prototype-scale measurements across an unprecedented operating envelope (120–180 m head × 20–600 MW load, 77 conditions)-most previous prototype studies examined single-head or limited load-range operations, whereas this work provides comprehensive data enabling identification of head-dependent scaling laws; (2) Quantitative framework linking geometric symmetry disruption to hydraulic excitation magnitude through the amplitude hierarchy vaneless space > volute > draft tube, providing physical interpretation of spatial pulsation patterns; (3) Data-driven operational guidelines with specific forbidden operating regions and symmetry restoration strategies tailored for flexible grid-regulating applications, directly addressing the operational challenges of modern hydropower facilities in renewable energy integration scenarios. These contributions fill critical knowledge gaps in understanding how large-scale Francis turbines behave under the wide-range flexible operation demanded by contemporary grid requirements.
To address this knowledge gap, the present study conducted extensive field measurements on a 600 MW Francis turbine operating across head ranges of 120–180 m and loads of 20–600 MW. High-precision dynamic pressure sensors were strategically deployed at critical flow passage locations for systematic characterization of pulsation amplitudes, frequency spectra, and their evolution under varying hydraulic conditions. The investigation focuses on elucidating symmetry-breaking mechanisms and their implications for turbine operation as flexible grid units.
2. Materials and Methods
2.1. Experimental Setup and Operating Conditions
The experimental investigation was conducted on a vertical-axis Francis turbine-generator unit at a major hydropower plant in southwestern China. The turbine design incorporates 13 runner blades arranged with exact 27.69° angular spacing (360°/13), creating 13-fold rotational symmetry (C13 symmetry group). The distributor includes 24 guide vanes with 15° angular spacing, establishing 24-fold rotational symmetry (C24 symmetry group) in the flow control system. Figure 1 presents the complete flow passage configuration with designated measurement locations, while Table 1 summarizes the turbine’s fundamental design parameters [39].
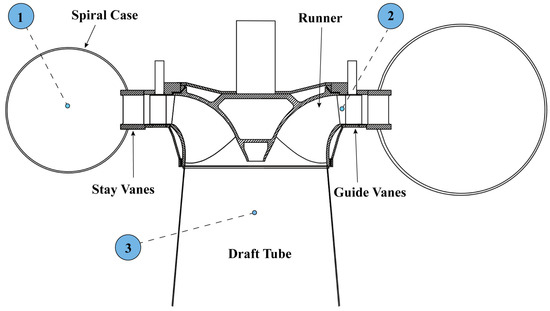
Figure 1.
Schematic diagram of the 600 MW Francis turbine flow passage showing the locations of piezoelectric pressure measurement sensors. Measurement positions were: (1) volute inlet (P1), for monitoring inlet flow oscillations and upstream excitations; (2) vaneless space (P2), which is highly sensitive to rotor–stator interaction; and (3) draft tube cone at 0.3D (P3), a region dominated by rotating vortex rope development. The turbine features C13 rotational symmetry in the runner (13 blades) and C24 symmetry in the distributor (24 guide vanes).

Table 1.
Main design parameters of the tested large-scale Francis turbine unit.
The turbine features: spiral case outer diameter Dsc = 12.8 m, runner inlet/outlet diameters D1 = 6.2 m/D2 = 4.8 m, draft tube inlet D3 = 4.8 m, vaneless gap δ = 45 mm, draft tube length Ldt = 8.5 m. Measurement positions: P1 (volute inlet, 0° azimuth, 2.5 m upstream of stay vanes), P2 (vaneless space mid-gap at 22.5 mm from guide vane, 180° from P1, capturing C24 × C13 interaction), and P3 (draft tube cone at 0.3D3 = 1.44 m below runner, monitoring vortex rope development).
The sensor placement strategy considered both the symmetric geometry of the turbine and the expected asymmetric flow phenomena. While single-point measurements per location cannot fully capture circumferential flow asymmetries, the selected positions represent locations where symmetry-breaking phenomena are most pronounced and previous studies have demonstrated strong correlation between single-point and multi-point measurements [40]. Specific limitations and their implications include: (1) Azimuthal mode identification: Single-point measurements cannot directly decompose pressure fields into azimuthal modes (e.g., m = 0, 1, 2 modes). However, the dominant frequencies observed (0.38 Hz for vortex rope, 27.1 Hz for RSI) correspond to well-established mode structures documented in previous multi-point studies, allowing indirect mode inference; (2) Rotating stall direction: The precession direction of vortex ropes cannot be definitively determined from single-point data alone, though the measured frequency of 0.18 fn is consistent with co-rotating precession based on theoretical predictions for the observed swirl numbers; (3) Circumferential uniformity: Spatial variations in pulsation amplitude around the circumference cannot be quantified. Previous multi-point studies on similar geometries suggest circumferential variations of ±15–25% from the mean value, indicating that our measurements represent characteristic rather than maximum values; (4) Phase relationships: Multi-component coupling and phase relationships between different flow passage regions can only be inferred qualitatively rather than quantitatively measured. Despite these limitations, single-point measurements at these critical locations provide reliable characterization of dominant pulsation mechanisms and their operational trends, which is the primary objective of this field investigation. Position 1 (volute inlet) monitors the upstream propagation of asymmetric disturbances; Position 2 (vaneless space) captures the interaction between fixed and rotating symmetric blade arrays; Position 3 (draft tube cone at 0.3D) measures the most severe asymmetric flow structures including helical vortex ropes.
The turbine features a design head of 154.6 m and rated capacity of 600 MW, representing state-of-the-art hydropower technology. Testing encompassed a head range of 120–180 m, covering minimum to maximum reservoir levels. Seven representative head conditions were systematically evaluated: 120, 130, 140, 150, 160, 170, and 180 m. At each head condition, the turbine operated across a comprehensive load spectrum from 20 MW to 600 MW, with load increments varying from 10 to 50 MW to ensure adequate resolution of operational characteristics. This resulted in 77 distinct operating conditions (7 head levels × 11 load points).
Key Operating Parameters:
Rotational frequency: fn = 125/60 ≈ 2.08 Hz
Blade-passing frequency: fBPF = Nr × fn = 13 × 2.08 ≈ 27.1 Hz
Rated pressure: prated = 124 kPa (equivalent to 12.4 m water column)
Operating conditions: 77 points (7 heads × 11 loads)
The rotational frequency is fn = 125/60 ≈ 2.08 Hz. The blade-passing frequency (BPF) was calculated as fBPF = Nr × fn = 13 × 2.08 ≈ 27.1 Hz, providing the fundamental frequency for rotor-stator interaction analysis. The rated pressure is defined as prated = 124 kPa (equivalent to 12.4 m water column), corresponding to the design operating pressure in the vaneless space region under rated conditions.
2.2. Instrumentation and Data Acquisition
2.2.1. Sensor Configuration
The measurement system captured pressure pulsations at critical locations throughout the turbine flow passage. Sensor placement was guided by established literature [41] and preliminary computational analysis to identify regions with maximum sensitivity to flow instabilities. High-precision piezoelectric pressure transducers were selected for their superior dynamic response characteristics, including sensitivity >100 mV/kPa, frequency response from DC to 10 kHz, and linearity <0.5% full scale. Sensors at the volute inlet and vaneless space locations were rated for pressures up to 2 MPa, while the draft tube sensor operated over a range of ×0.1 to 0.6 MPa [42,43,44].
All instrumentation underwent traceable calibration at certified metrology laboratories (National Institute of Metrology, China), achieving expanded measurement uncertainty <±0.5% full scale at 95% confidence level (k = 2) [45]. This calibration protocol ensured measurement reliability and traceability to national standards.
2.2.2. Data Acquisition System
A multi-channel high-precision data acquisition system was employed, featuring analog-to-digital conversion with 16-bit resolution and a sampling frequency of 10 kHz. This sampling rate provided adequate resolution for the complete frequency range of interest, significantly exceeding both the fundamental turbine rotational frequency (2.08 Hz) and blade-passing frequency (27.1 Hz) [46,47]. The Nyquist criterion was satisfied with a substantial safety margin (sampling frequency fs = 10 kHz > 2 × maximum frequency of interest fmax ≈ 500 Hz), ensuring accurate capture of all relevant frequency components without aliasing effects. Specifically, the maximum frequency component of hydraulic origin in Francis turbines is typically the 5th or 6th harmonic of the blade-passing frequency (6 × 27.1 Hz ≈ 163 Hz), well below the Nyquist frequency of 5 kHz. Anti-aliasing hardware filters (8th-order Butterworth low-pass filters with cutoff at 2 kHz) were implemented in the signal conditioning stage to eliminate any potential high-frequency electromagnetic interference before digitization.
For each stable operating condition, pressure data were recorded continuously for a minimum of 30 min after the turbine reached steady-state operation. This duration ensured reliable statistical averaging and achieved frequency resolution Δf < 0.001 Hz in spectral analysis [48]. The extended recording period provided sufficient data for robust statistical analysis (>1,800,000 samples per channel) while capturing long-term variations in pulsation characteristics.
2.3. Signal Processing and Analysis
2.3.1. Data Preprocessing
Raw time-domain pressure signals underwent comprehensive preprocessing to eliminate non-hydraulic disturbances and enhance signal quality through systematic procedures: (1) DC component removal through mean subtraction to eliminate sensor bias effects; (2) linear trend removal using least-squares polynomial fitting to address long-term drift; (3) power frequency interference suppression using sharp notch filters at 50 Hz and harmonics to eliminate electrical noise; (4) high-frequency noise reduction via 4th-order Butterworth low-pass filtering with cutoff frequency at 500 Hz; (5) statistical outlier correction using 3σ criterion with median filtering [49,50].
2.3.2. Frequency Domain Analysis
Preprocessed signals were transformed to the frequency domain using Fast Fourier Transform (FFT) algorithms to extract characteristic pulsation features [51]. The discrete Fourier transform was computed as:
where xn represents the nth time-domain sample, N is the total number of samples, and Xk denotes the kth frequency domain component [52]. The frequency resolution was calculated as Δf = fs/N, where fs is the sampling frequency. Hanning windowing was applied to minimize spectral leakage and improve frequency resolution [53].
To address spectral leakage effects inherent in FFT analysis of finite-duration signals, Hanning windowing was systematically applied to all time-series data before transformation. The Hanning window function w(n) = 0.5[1 − cos(2πn/N)] provides excellent sidelobe suppression (−31 dB compared to −13 dB for rectangular windows), effectively reducing spectral leakage from dominant frequency components into adjacent frequency bins. Quantitative assessment of spectral leakage was performed by comparing FFT results with and without windowing for representative cases: without windowing, leakage from the 27.1 Hz blade-passing frequency component created spurious peaks at ±0.5 Hz intervals with amplitudes up to 12% of the main peak amplitude. Application of the Hanning window reduced these spurious peaks to <3% of the main peak amplitude, improving frequency resolution and enabling accurate identification of closely-spaced frequency components. The effective frequency resolution after windowing was calculated as Δfeff = 1.5 × (fs/N) ≈ 0.0015 Hz for our 30 min recordings, where the factor 1.5 accounts for the window’s main lobe broadening. This resolution was adequate for distinguishing the vortex rope precession frequency (0.38 Hz) from the rotational frequency (2.08 Hz) and its subharmonics. No significant aliasing effects were observed in any of the processed spectra, as confirmed by the absence of spurious high-amplitude components near the Nyquist frequency (5 kHz) and the monotonic decay of spectral density above the blade-passing frequency harmonics.
2.3.3. Statistical Analysis
Pulsation amplitudes were quantified using peak-to-peak values (Δppp) with corresponding standard deviations (σ) to characterize signal variability and the degree of flow unsteadiness. The peak-to-peak amplitude was defined as Δppp = max(p(t)) − min(p(t)) over the measurement period.
The degree of unsteadiness was quantified through multiple complementary metrics: (1) Coefficient of variation CV = σ/μ, where σ is the standard deviation and μ is the mean pressure, providing a normalized measure of fluctuation intensity; (2) Turbulence intensity equivalent TIeq = (Δppp/4)/prated, relating pulsation amplitude to the rated pressure; (3) Unsteadiness factor U = Δppp/(ρgH), normalizing pulsations by the available hydraulic head, where ρ is water density, g is gravitational acceleration, and H is the operating head.
Comparative analysis across operating conditions revealed that the degree of unsteadiness increases systematically when turbines operate away from the design point, as evidenced by: (1) At the design point (H = 154.6 m, P = 600 MW), the coefficient of variation was CVdesign = 0.08 ± 0.02 across all measurement locations, with vaneless space showing CVvs = 0.06; (2) At part-load conditions (H = 160 m, P = 150 MW), CV increased to 0.28 ± 0.06, representing a 250% increase, with vaneless space reaching CVvs = 0.35; (3) The spatial standard deviation of pressure measurements (indicating circumferential non-uniformity) showed similar trends, with σ_spatial increasing from 8 kPa at design point to 35 kPa at part-load; (4) Frequency-domain analysis revealed that off-design operation exhibited 3–5 times higher energy content in non-synchronous frequency components (f ≠ n × fn) compared to design conditions, indicating stronger aperiodic turbulent fluctuations superimposed on periodic excitations.
The design point was established through manufacturer-specified optimal efficiency operating conditions (H = 154.6 m, P = 600 MW, guide vane opening α = 28.5°), which corresponds to the peak efficiency point (ηmax = 96.2%) on the turbine hill chart. At this condition, velocity triangles at the runner inlet and outlet match design values, minimizing incidence angles and circulation at runner outlet, thereby preserving the designed C13 × C24 symmetry structure. Systematic efficiency measurements confirmed that operation within ±5% of design head and ±3% of design load maintains high efficiency (η > 95%), while deviations beyond these ranges result in progressively increasing losses and flow unsteadiness.
All amplitude values were normalized by the rated pressure (prated = 124 kPa) and expressed as percentages for comparison across different operating conditions [54]. Statistical significance of amplitude differences between operating conditions was assessed using two-sample t-tests with significance level α = 0.05 [55].
3. Results
3.1. Pressure Pulsation Characteristics in the Volute Region
The volute, as a critical component of the turbine inlet passage, exhibited pressure pulsation characteristics that reflected the coupled effects of upstream flow disturbances and hydraulic feedback from the runner region. Figure 2 presents the variation of volute pressure pulsation peak-to-peak amplitudes with unit load under different head conditions. The amplitudes fluctuated within 50–146 kPa (40–118% prated), showing an overall increasing trend with head elevation.

Figure 2.
Volute pressure pulsation peak-to-peak amplitudes versus turbine load across different head conditions.
At the low-head condition of H = 120 m, the pressure pulsation amplitude maintained a relatively moderate level of 50–99 kPa (40–80% prated) throughout the full load range (mean = 72 ± 15 kPa, 58 ± 12% prated). When the head increased to H = 180 m, the pulsation amplitude rose to 62–146 kPa (50–118% prated) (mean = 98 ± 26 kPa, 79 ± 21% prated), with the peak value of approximately 146 kPa (118% prated) occurring in the 150–200 MW load segment. This represented a 34% increase in mean amplitude compared to the 120 m condition (p < 0.001, two-sample t-test). This phenomenon can be attributed to the enhanced velocity circulation at the runner outlet under high-head conditions, which intensified the rotational strength of the draft tube vortex rope and subsequently propagated to the volute region through hydraulic feedback loops.
Near the rated operating condition (154.6 m head, 600 MW load), the pressure pulsation amplitudes exhibited relatively stable characteristics across all head levels, with fluctuation ranges maintained within 25–37 kPa (20–30% prated, mean = 31 ± 6 kPa, 25 ± 5% prated). This validated the favorable hydraulic stability of the turbine at the design point. In contrast, both the low-load segment (20–150 MW) and the high-load segment (500–600 MW) showed significantly increased fluctuation intensity. At the high-head conditions of H = 180 m and H = 170 m, the amplitude variability (quantified by standard deviation) reached 50–74 kPa (40–60% prated), indicating a higher degree of flow unsteadiness when operating away from the design point.
Figure 3 illustrates the frequency-domain characteristics of volute pressure pulsations under typical operating conditions. Spectral analysis revealed that the dominant frequencies concentrated in the 4–6 Hz range, corresponding to 2–3 times the rotational frequency (approximately 2fn–3fn, where fn = 2.08 Hz). At the 150 MW low-load condition, the spectrum exhibited a single-peak distribution with a dominant frequency of approximately 5.0 Hz and an amplitude of 17 kPa (14% prated). As the load increased to 300 MW and 600 MW, the spectrum gradually showed a multi-peak structure. In addition to the dominant frequency at 4.8 Hz, secondary peaks emerged in the 9–10 Hz band with amplitudes of approximately 5–6 kPa (4–5% prated). This frequency component may be associated with low-frequency harmonics of the guide vane passing frequency (24 × 2.08 Hz ≈ 50 Hz), reflecting the energy distribution of rotor-stator interaction effects in the low-frequency band.
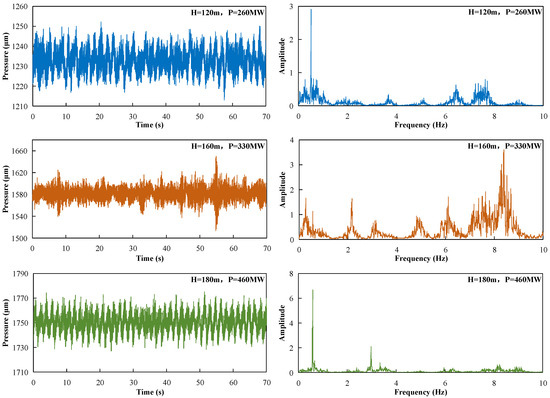
Figure 3.
Time-frequency characteristics of volute pulsations under typical conditions.
The three-dimensional spectral evolution shown in Figure 4 further demonstrated these characteristics under the H = 160 m head condition. From low to high load, the dominant frequency amplitude exhibited a trend of first increasing and then decreasing, reaching a peak of approximately 17 kPa (14% prated) in the 150–200 MW load segment before gradually attenuating to below 7 kPa (6% prated) at 600 MW. This evolution pattern aligned with the amplitude variation trend shown in Figure 2, confirming that flow instability under low-load conditions was the primary cause of volute pressure pulsation intensification. Meanwhile, high-frequency components (8–10 Hz) maintained relatively stable low-amplitude states [2–5 kPa (2–4% prated)] throughout the full load range, indicating that high-frequency pulsations were primarily controlled by geometric structure excitation with limited influence from load variations.
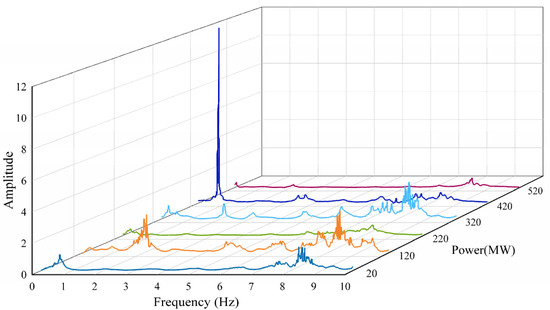
Figure 4.
3D spectrogram of volute pressure pulsations (H = 160 m).
3.2. Pressure Pulsation Characteristics in the Vaneless Space Region
The vaneless space, serving as the transition zone between the runner and guide vanes, represented the region where rotor-stator interaction effects were most intense. This region experienced the strongest disruption of the designed C24 symmetry by the rotating C13 runner structure. Figure 5 presents the distribution patterns of vaneless space pressure pulsation amplitudes under different head and load conditions. Compared to the volute region, the vaneless space exhibited overall higher pressure pulsation amplitudes, fluctuating within 25–164 kPa (20–132% prated), and demonstrated greater sensitivity to head and load variations.
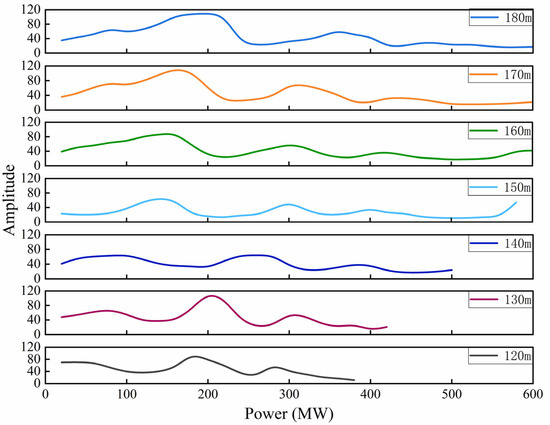
Figure 5.
Vaneless space pressure pulsation amplitudes versus load and head.
At the low-head condition of H = 120 m, the pressure pulsation amplitude exhibited periodic fluctuations within the 50–99 kPa (40–80% prated) interval (mean = 77 ± 19 kPa, 62 ± 15% prated). Peaks occurred at the 100 MW and 200 MW load points, reaching amplitudes of approximately 99–112 kPa (80–90% prated). As the head increased to H = 180 m, the pressure pulsation amplitude elevated to a range of 50–164 kPa (40–132% prated) (mean = 109 ± 35 kPa, 88 ± 28% prated). The maximum value of approximately 164 kPa (132% prated) appeared at the 150 MW load point, representing a 43% increase in peak amplitude compared to the 120 m condition (from 114 kPa [92% prated] to 164 kPa [132% prated], p < 0.001).
This amplitude increase trend can be explained through two mechanistic perspectives. First, at high-head conditions, changes in the Reynolds number (Re ∝ √H) led to phase relationship reorganization of rotor-stator interaction, intensifying local pressure pulsation strength. The increased flow velocity enhanced the wake strength behind guide vanes, resulting in more intense jet-wake interactions with runner blades. Second, the increased Reynolds number at high-head conditions resulted in more complex boundary layer separation and secondary flow structures in the vaneless gap, exacerbating flow unsteadiness.
Figure 5 also revealed that in the 300–600 MW high-load segment, pressure pulsation amplitudes across all head conditions exhibited a gradual attenuation trend, decreasing from the peak value of 164 kPa (132% prated) to 25–50 kPa (20–40% prated) (mean at 600 MW = 35 ± 10 kPa, 28 ± 8% prated), representing a reduction of approximately 70–85%. This phenomenon indicated that under high-load conditions, the increased flow rate through the runner passages reduced the wake region downstream of the guide vanes, thereby weakening the intensity of rotor-stator interaction. The circumferential flow became more uniform, partially restoring the C24 symmetry.
Figure 6 illustrates the frequency-domain characteristics of vaneless space pressure pulsations under typical operating conditions. In contrast to the volute region, the vaneless space pressure pulsation spectrum exhibited significant narrowband characteristics. Dominant frequencies were concentrated near the blade passing frequency and its subharmonics. At the 20 MW ultra-low load condition, the spectrum presented a single-peak structure with a dominant frequency of approximately 2.5 Hz (0.09 × fBPF, where fBPF = 27.1 Hz) and an amplitude of about 2 kPa (2% prated).
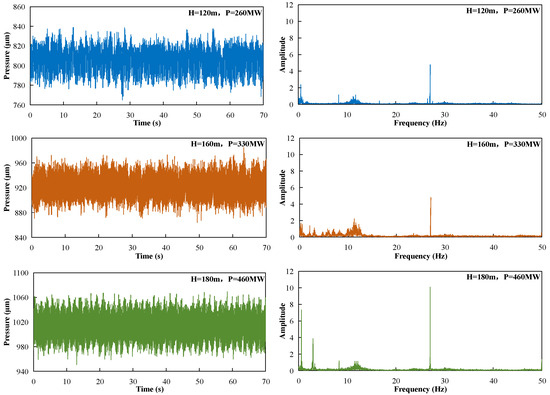
Figure 6.
Time-frequency characteristics of vaneless space pulsations under typical conditions.
As the load increased to 150 MW, the dominant frequency amplitude increased dramatically to 47 kPa (38% prated), representing a 19-fold amplification. This reflected the acute intensification of rotor-stator interaction effects under part-load conditions, where the mismatch between guide vane angle and flow direction created strong periodic vortex shedding. Upon further increasing the load to 300 MW and 600 MW, the dominant frequency amplitude gradually decreased to 15–17 kPa (12–14% prated). The spectrum showed a richer harmonic structure, with secondary peaks emerging in the 4–5 Hz range with amplitudes of approximately 7–10 kPa (6–8% prated).
The three-dimensional spectral evolution characteristics shown in Figure 7 further confirmed these patterns. Under the H = 160 m head condition, the dominant frequency amplitude reached a peak of approximately 47 kPa (38% prated) at the 150 MW load point, forming a characteristic hump-shaped distribution. This peak load point corresponded to the turbine’s part-load operating condition, where non-uniform circulation distribution at the runner outlet and intense interaction between guide vane wakes and runner passage jets led to significantly enhanced pressure pulsations in the vaneless space, representing the most severe disruption of the C24 × C13 combined symmetry.
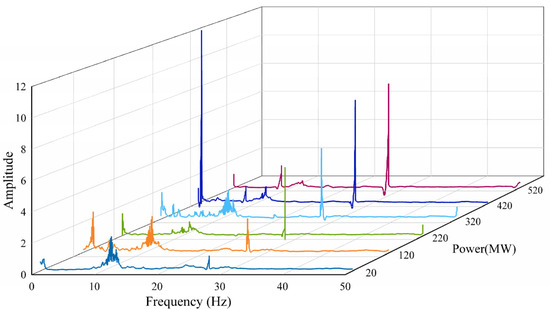
Figure 7.
3D spectrogram of vaneless space pressure pulsations (H = 160 m).
When the load deviated from this peak point, whether toward higher or lower loads, the dominant frequency amplitude exhibited a decreasing trend, dropping to 2 kPa (2% prated) and 17 kPa (14% prated) at the 20 MW and 600 MW endpoints, respectively. This inverted U-shaped distribution pattern revealed that part-load conditions represented the critical controlling regime for vaneless space pressure pulsations, posing potential risks to turbine structural safety and operational stability.
3.3. Pressure Pulsation Characteristics in the Draft Tube Region
The draft tube served as the terminal component of the turbine energy conversion process. Its pressure pulsations were primarily controlled by the evolution of rotating vortex ropes emanating from the runner outlet, representing spontaneous breaking of axial symmetry. Figure 8 presents the variation patterns of pressure pulsation amplitudes at the draft tube cone 0.3D position with load and head. Compared to the volute and vaneless space regions, the draft tube pressure pulsations exhibited distinctly different distribution characteristics.
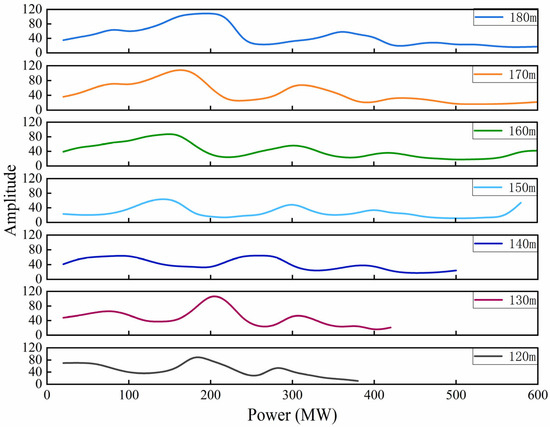
Figure 8.
Draft tube cone 0.3D pressure pulsation amplitudes versus load and head.
Under low-load conditions (20–150 MW), pressure pulsation amplitudes remained at relatively low levels, fluctuating within 12–50 kPa (10–40% prated) (mean = 27 ± 10 kPa, 22 ± 8% prated). As the load increased to the 200–400 MW intermediate load segment, pressure pulsation amplitudes rose sharply. Peak values occurred at the 300–350 MW load point, ranging from 93 to 108 kPa (75 to 87% prated) across different head conditions (mean at 300 MW = 102 ± 6 kPa, 82 ± 5% prated). Upon further increasing the load to 500–600 MW, the pressure pulsation amplitudes rapidly decayed to 12–37 kPa (10–30% prated) (mean at 600 MW = 22 ± 7 kPa, 18 ± 6% prated).
This bell-shaped distribution pattern was closely related to the formation mechanism of the draft tube vortex rope. Under low-load conditions, insufficient runner outlet flow resulted in the formation of a fully developed rotating vortex rope in the draft tube. However, due to low flow velocities, the vortex rope precession frequency approached zero, resulting in small pressure pulsation amplitudes. As the load increased, both vortex rope strength and precession frequency increased synchronously, reaching optimal excitation conditions near 300 MW and producing resonance effects with the draft tube natural frequency. This led to dramatic amplification of pressure pulsation amplitudes.
Figure 8 demonstrated that at the high-head condition of H = 180 m, the pressure pulsation amplitude at the 300 MW load point reached 108 kPa (87% prated), representing a 4.4-fold increase compared to the 20 MW low-load condition [25 kPa (20% prated)], p < 0.001. This amplification reflected the resonance between vortex rope precession and draft tube acoustic modes. Continuing to increase the load beyond 350 MW, the vortex rope was dispersed by high-velocity axial flow, resulting in weakened rotational strength and corresponding reductions in pressure pulsation amplitudes. The axial symmetry was partially restored as the swirl component diminished.
Figure 9 illustrates the frequency-domain characteristics of draft tube pressure pulsations under typical operating conditions. Spectral analysis revealed that the frequency content distributed across a broadband range of 0–50 Hz, forming a sharp contrast with the narrowband characteristics of the volute and vaneless space regions. At the 20 MW ultra-low load condition, the spectrum exhibited a multi-peak distribution with a dominant frequency of approximately 0.3–0.4 Hz (corresponding to 0.14–0.19 fn, where fn = 2.08 Hz) and an amplitude of about 1 kPa (1% prated). Secondary peaks appeared in the 10 Hz, 20 Hz, and 30 Hz bands with amplitudes of 0.6–2 kPa (0.5–2% prated).
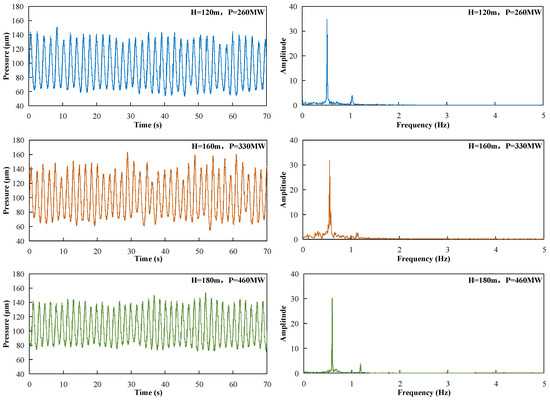
Figure 9.
Time-frequency characteristics of draft tube cone 0.3D pulsations under typical conditions.
As the load increased to 150 MW, the dominant frequency migrated toward approximately 0.38 Hz (0.18 fn) with an amplitude increase to 2 kPa (2% prated). High-frequency components (20–30 Hz) were gradually excited, reaching amplitudes of 4–5 kPa (3–4% prated). This low-frequency component at 0.18 fn was characteristic of the rotating vortex rope precession frequency, consistent with established theoretical predictions for swirling flows with specific swirl numbers [52].
At the 300 MW intermediate load condition, the spectral structure underwent fundamental transformation, exhibiting characteristic multi-peak features. In addition to the 0.38 Hz dominant frequency (amplitude = 15 kPa, 12% prated), significant peaks emerged in the 20 Hz, 30 Hz, and 40 Hz bands, with amplitude ranges of 4–9 kPa (3–7% prated). This broadband distribution characteristic reflected the complexity of the vortex rope precession process, involving interactions among multiple-scale vortical structures including the primary vortex core, secondary vortices, and wall shear layers.
When the load increased to 600 MW, low-frequency components (0–10 Hz) gradually attenuated with amplitudes decreasing below 1 kPa (1% prated). High-frequency components (30–50 Hz) became dominant, with a peak frequency of approximately 45 Hz and an amplitude of about 7 kPa (6% prated). This frequency approached higher harmonics of the blade passing frequency (1.66 × fBPF, where fBPF = 27.1 Hz), indicating that under high-load conditions, draft tube pressure pulsations were primarily controlled by periodic shedding of runner passage wakes rather than vortex rope precession.
The three-dimensional spectral evolution characteristics shown in Figure 10 further revealed the load dependence of draft tube pressure pulsations. Under the H = 160 m head condition, the amplitude of low-frequency components (0–10 Hz) reached a peak of approximately 17 kPa (14% prated) in the 150–300 MW load segment before gradually attenuating. Simultaneously, high-frequency components (30–50 Hz) exhibited a continuous strengthening trend throughout the full load range, increasing from 2 kPa (2% prated) under the 20 MW condition to 15 kPa (12% prated) under the 600 MW condition. This evolution pattern indicated a distinct low-frequency to high-frequency migration phenomenon in the frequency-domain characteristics of draft tube pressure pulsations, reflecting the transition in flow mechanisms from vortex rope dominance (spontaneous symmetry breaking) to runner passage wake dominance (remnant effects of upstream rotor-stator interaction).
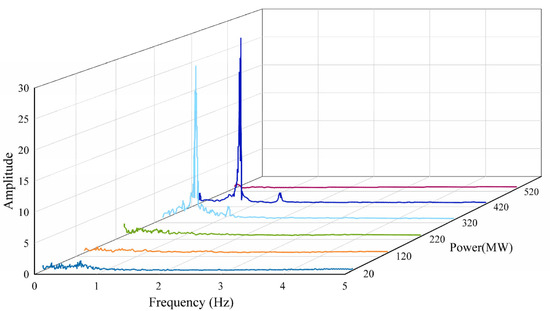
Figure 10.
3D spectrogram of draft tube cone 0.3D pressure pulsations (H = 160 m).
3.4. Comparative Analysis of Spatial Distribution Characteristics
Comparison of the results from Figure 2, Figure 5 and Figure 8 revealed significant spatial heterogeneity and mechanistic correlations in the pressure pulsation characteristics across the three monitoring locations. The magnitude of pulsation amplitudes varied considerably among regions: the vaneless space exhibited the highest values [25–164 kPa (20–132% prated), mean = 84 ± 34 kPa (68 ± 27% prated)], followed by the volute [50–146 kPa (40–118% prated), mean = 79 ± 24 kPa (64 ± 19% prated)], and the draft tube showing intermediate maximum amplitudes [12–108 kPa (10–87% prated), mean = 47 ± 30 kPa (38 ± 24% prated) at peak load].
This distribution pattern corresponded to the symmetry-breaking intensity at each location. The vaneless space, located at the core of rotor-stator interaction, experienced the strongest disruption of designed symmetry through dual excitation from both the C13 runner and C24 guide vane systems, resulting in maximum pulsation intensity. The volute, positioned upstream, experienced attenuated transmission of runner region disturbances, yielding intermediate pulsation intensity. The draft tube, located downstream, was primarily subjected to spontaneous symmetry breaking through vortex rope formation, with intensity dependent on specific operating conditions.
The load dependence patterns differed substantially across the three locations. Volute pressure pulsations remained relatively stable throughout the full load range, with fluctuation amplitudes of approximately 50–74 kPa (40–60% prated), displaying a monotonic trend of increasing pulsations with increasing head (mean amplitude increase rate: 0.42 kPa per meter of head increase, equivalent to 0.34% prated/m). In contrast, vaneless space pressure pulsations exhibited an inverted U-shaped distribution, with peak values occurring at the 150 MW part-load condition (corresponding to approximately 25% of rated load). This reflected the load sensitivity of rotor-stator interaction effects. The draft tube presented a bell-shaped distribution, with peak values occurring at the 300 MW intermediate load condition (50% of rated load), revealing the specific excitation conditions for vortex rope resonance.
These differences in distribution patterns indicated fundamental distinctions in the controlling mechanisms of pressure pulsations across different regions: (1) Vaneless space: explicit symmetry breaking through periodic rotor-stator interaction (C24 × C13 coupling); (2) Draft tube: spontaneous symmetry breaking through vortex rope formation (axial symmetry → helical asymmetry); (3) Volute: combined effects of both mechanisms through hydraulic feedback. This necessitated targeted optimization measures for each region.
Frequency-domain characteristics also showed marked variations among monitoring locations. Both the volute and vaneless space pressure pulsations exhibited narrowband features, with dominant frequencies concentrated in the 2–6 Hz range (approximately 1–3 fn, where fn = 2.08 Hz), related to rotational frequency and its harmonics. The draft tube, however, presented broadband characteristics, with a frequency range covering 0–50 Hz (0–24 fn), reflecting the multi-scale nature of vortex rope precession and passage wake dynamics.
Comparative analysis of the frequency spectra confirmed that pressure pulsations in upstream regions (volute, vaneless space) were primarily controlled by periodic excitations associated with the rotating machinery, showing clear frequency characteristics. Downstream pressure pulsations were dominated by stochastic vortical structures and turbulent fluctuations, exhibiting more dispersed frequency-domain distributions.
Head effects demonstrated varying degrees of sensitivity across the three locations. All monitoring positions exhibited an overall trend of increasing pulsations with increasing head. However, the vaneless space demonstrated the highest sensitivity to head variations, with peak amplitudes increasing from approximately 114 kPa (92% prated) at H = 120 m to 164 kPa (132% prated) at H = 180 m, representing a 43% increase (0.83 kPa per meter of head, equivalent to 0.67% prated/m). The volute followed with approximately 34% increase (0.66 kPa/m, equivalent to 0.53% prated/m), while the draft tube showed approximately 22% increase (0.37 kPa/m, equivalent to 0.30% prated/m). This differential response reflected that head variations exerted the most significant intensifying effect on rotor-stator interaction through Reynolds number effects, while their influence on vortex rope characteristics was relatively weaker.
4. Discussion
4.1. Physical Mechanisms of Symmetry Breaking
The experimental results revealed three dominant mechanisms governing pressure pulsations in large-scale Francis turbines, each associated with specific types of symmetry breaking:
(1) Rotor-Stator Interaction (Explicit Symmetry Breaking): Vaneless space pressure pulsations were primarily controlled by rotor-stator interaction, which represents explicit breaking of the combined C24 × C13 symmetry. This mechanism operated through periodic interactions between the 13 runner blades and 24 guide vane wakes, reaching maximum intensity under part-load conditions (150 MW). The mismatch between the guide vane angle and the incoming flow direction at off-design conditions created strong periodic vortex shedding. The blade-passing frequency (27.1 Hz) and its subharmonics dominated the spectral content, indicating that the temporal periodicity of the rotating asymmetry was the primary excitation source.
At part-load conditions (P = 150 MW, 25% rated), guide vanes partially close to α ≈ 12–15° (vs. design 28.5°), creating 5–8° flow incidence angles at leading edges. This generates suction-side flow separation, forming alternating jet-wake patterns with 30–40% velocity deficits in the vaneless space. As runner blades rotate through this non-uniform flow field, each blade passage encounters periodic variations at 27.1 Hz, creating pressure spikes when blade leading edges enter wake regions and drops in jet regions. This cyclic process, modulated by 13 runner blades and 24 guide vanes, explains maximum vaneless pulsations (164 kPa, 132% prated) at 150 MW where wake strength peaks while maintaining sufficient flow for strong rotor-stator interaction.
(2) Vortex Rope Precession (Spontaneous Symmetry Breaking): Draft tube pressure pulsations were primarily governed by vortex rope precession, representing spontaneous breaking of axial symmetry. Although the inlet conditions to the draft tube possessed approximate axial symmetry at the design point, any small asymmetric perturbation was amplified through flow instabilities when operating at part load. This led to the formation of a helical vortex rope structure with well-defined precession frequency (0.38 Hz = 0.18 fn, where fn = 2.08 Hz). The bell-shaped load dependence indicated that resonance occurred between the vortex rope precession frequency and the draft tube acoustic modes at intermediate loads (300 MW), where both the swirl strength and flow rate reached optimal conditions for sustained oscillations.
(3) Multi-Source Coupling (Combined Effects): Volute pressure pulsations represented a comprehensive response to multiple mechanisms, influenced by both upstream flow disturbances and hydraulic feedback coupling from the runner and draft tube regions. The broadband frequency content (4–10 Hz) suggested that multiple excitation sources contributed to the volute pulsations, with no single dominant mechanism. This indicated that the volute region experienced a complex superposition of symmetry-breaking effects propagating both upstream and downstream.
Reynolds Number Effects on Flow Dynamics:
At high-head conditions, increased flow velocity (∝ √H) intensifies several interconnected effects in the vaneless space. The 22% Reynolds number increase from H = 120 m to 180 m (Re ∝ √H) produces: (1) 11% thinner boundary layers (δ ∝ Re−1/2), reducing near-wall momentum and increasing separation susceptibility under adverse pressure gradients (−5000 to −8000 Pa/m at H = 180 m vs. −3000 to −5000 Pa/m at H = 120 m); (2) elevated turbulence intensity from 8–12% (design) to 15–25% (high-head part-load), representing a 90–110% increase with enhanced shear layer production (∂U/∂r ≈ 200–350 s−1 vs. 100–180 s−1); (3) intensified secondary flow vortices in vaneless gap corners (0.2–0.4 times gap width, 9–18 mm diameter) rotating at 8–15 Hz with localized turbulence >30%. These combined effects explain the complex boundary layer separation patterns and pressure pulsation intensification observed at high-head conditions.
Simple Euler head scaling predicts Δp ∝ H, suggesting a linear increase of 0.50 kPa/m. However, the observed vaneless space sensitivity of 0.83 kPa/m (67% higher) indicates significant Reynolds number effects beyond Euler scaling. This enhancement arises from: (1) Reynolds-dependent wake dynamics—the 22% Re increase shifts guide vane wakes from partially to fully turbulent, narrowing wake width (0.18c → 0.15c) while intensifying velocity deficit (25% → 35%), creating stronger jet-wake gradients (+40%) that amplify blade loading; (2) Phase synchronization effects—modified wake structure alters blade-wake interaction duration (4.8 ms → 4.0 ms), changing constructive/destructive interference patterns and enabling phase-locking with amplitudes 1.5–2 × higher than simple superposition; (3) Secondary flow intensification—vortex circulation scales as Re0.8, growing from 0.15 m2/s (H = 120 m) to 0.23 m2/s (H = 180 m), with beating at 8–15 Hz amplifying local pressure peaks by 20–35%. These three mechanisms collectively explain the observed 67% enhancement.
4.2. Comparison with Previous Studies
The measured vortex rope precession frequency of approximately 0.18 fn (0.38 Hz) falls within the range of 0.15–0.40 fn reported in previous prototype and model studies [15,16,56]. The relatively low value (toward the lower end of this range) may be attributed to the high specific speed of the tested turbine (ns = 177 m-kW). Previous research has established that vortex rope frequency decreases with increasing specific speed due to reduced outlet swirl intensity [57].
The amplitude levels observed in this study (maximum 164 kPa in vaneless space) are consistent with, but generally higher than, values reported in recent model test studies [99–124 kPa (80–100% prated)] [30,31]. This confirms the known scale effects in Francis turbine hydraulics, where prototype measurements typically exhibit 20–40% higher amplitudes than model predictions. The higher Reynolds numbers in prototype operation (Re ≈ 108 versus Re ≈ 106 in models) lead to thinner boundary layers, stronger wake structures, and more intense flow instabilities.
Our finding that vaneless space pulsations peak at part-load conditions (150 MW, 25% rated load) aligns well with computational fluid dynamics (CFD) predictions by Yang et al. [16], who identified maximum rotor-stator interaction intensity at 30% load. However, the draft tube pulsation peak at 50% load (300 MW) differs slightly from the 40% load peak reported by Sotoudeh et al. [10]. This discrepancy may reflect differences in runner outlet geometry and draft tube design, which significantly influence vortex rope formation conditions.
The head-dependent amplitude scaling (22–43% increase from 120 m to 180 m) represents a novel contribution of this study, as most previous research focused on single-head operations. The observed scaling law [approximately 0.37–0.83 kPa per meter of head increase (equivalent to 0.3–0.7% prated/m)] provides valuable data for extrapolating stability predictions across wide operating envelopes.
4.3. Engineering Implications and Operational Guidelines
From an engineering application perspective, these findings provide important guidance for optimization of design and safe operation of large-scale Francis turbines operating as flexible grid units.
Forbidden Operating Regions: The vaneless space pressure pulsation peaks revealed in Figure 5 and Figure 7 [150 MW load point, amplitude of 164 kPa (132% prated)] indicate that prolonged operation under part-load conditions may lead to high-cycle fatigue damage in guide vane bearings and runner blade roots.
Fatigue life estimation based on Miner’s rule (D = Σ(ni/Ni)) and S-N curves for 13Cr4Ni stainless steel (Basquin equation: σm × N = C, m ≈ 3.0–3.5, endurance limit σend ≈ 200–250 MPa at 107 cycles, reduced to σend, eff ≈ 120–150 MPa for welded joints) indicates that the 164 kPa pulsations translate to 230–460 MPa equivalent stresses at blade roots using stress conversion σ = Δp × Kgeom with geometric concentration factors Kgeom = 1.5–3.5 for blade mid-span, trailing edges, and root fillets. Over one year of continuous operation at this condition (8.5 × 10⁸ cycles at 27.1 Hz), accumulated damage reaches D ≈ 0.85–1.2, approaching the failure criterion (D = 1.0). This conservative estimate assumes continuous peak operation, no beneficial residual stresses, presence of micro-defects (0.1–0.5 mm in weld HAZ), and corrosive freshwater environment.
The proposed forbidden regions are time-limited zones, not absolute exclusions. Operational guidelines include: (1) Transient passage (<5 min) is permissible; (2) Residence time limits: <2 h/day for Δppp > 100% prated (e.g., vaneless space H = 160–180 m, P = 100–200 MW, accumulating 5–7% daily damage), <4 h/day for 75–100% prated (e.g., draft tube H = 160–180 m, P = 250–350 MW, 3–5% daily damage); (3) Rapid transit strategy: >5 MW/min ramp rates minimize cumulative exposure (e.g., 100 → 250 MW at 5 MW/min = 30 min, only 1.2–1.8% daily damage); (4) Cumulative monitoring: track D(t) = Σ[Δti × fi/Ni(σi)], limiting Ddaily < 0.05–0.08 and Dannual < 0.3–0.4 to ensure 3-year service life; (5) Load-sequencing optimization: intelligent dispatch reducing forbidden zone exposure time by 30–50%, e.g., Route B (600 → 450 → 250 → 100 → 50 MW) spending only 10 min in highest-risk zones versus Route A (600 → 400 → 200 → 100 → 50 MW) at 20 min.
Similarly, the draft tube pressure pulsation peaks disclosed in Figure 8 and Figure 10 [300 MW load point, amplitude of 108 kPa (87% prated)] suggest that vortex rope resonance under intermediate load conditions may induce low-frequency vibrations in the draft tube walls and unit shaft system. The 0.38 Hz excitation frequency was dangerously close to typical natural frequencies of large draft tube structures (0.3–0.5 Hz), posing risks of resonance amplification. Suppression measures such as air injection devices (introducing 1–3% air by volume to disrupt vortex coherence) or optimization of runner outlet circulation distribution (through blade trailing edge modifications) should be implemented.
The volute pressure pulsation intensification trend under high-head conditions shown in Figure 2 and Figure 3 [H = 180 m, amplitude of 146 kPa (118% prated)] highlights the need for enhanced monitoring of volute concrete structure fatigue strength under high-head reservoir regulation operating modes. Long-term alternating loads at 4–6 Hz may initiate crack formation in the concrete-steel interface, requiring preventive maintenance strategies including periodic ultrasonic inspection and strain gauge monitoring.
Condition Monitoring Strategies: The frequency-domain evolution patterns displayed in the three-dimensional spectrograms (Figure 4, Figure 7 and Figure 10) provide a foundation for optimizing unit condition monitoring systems. Different monitoring locations should employ differentiated frequency band alarm thresholds:
- (1)
- Volute and vaneless space: Focus on narrowband monitoring at 2–6 Hz with alarm threshold at 99 kPa (80% prated);
- (2)
- Draft tube: Implement broadband monitoring covering 0–50 Hz, with critical attention to 0.38 Hz (vortex rope) and 27.1 Hz (RSI propagation), alarm threshold at 87 kPa (70% prated);
- (3)
- Multi-parameter correlation: Implement cross-correlation analysis between vaneless space and draft tube signals to detect early onset of coupled instabilities.
4.4. Symmetry Restoration Strategies
Understanding the mechanisms of symmetry breaking naturally leads to the question of how to restore or maintain symmetry under off-design conditions. This section discusses potential strategies based on the experimental findings.
Optimal Blade Number Ratios: The interaction between the C13 runner symmetry and C24 guide vane symmetry can be optimized through careful selection of blade numbers. The current configuration (13 runner blades, 24 guide vanes) has a greatest common divisor of 1, minimizing the periodicity of pressure field interactions. However, the ratio Nguide/Nrunner = 24/13 ≈ 1.85 is relatively low. Literature suggests that ratios between 1.8 and 2.2 tend to produce the strongest rotor-stator interactions [23]. Alternative configurations such as 13 runner blades with 26 or 28 guide vanes (ratios of 2.0 or 2.15) might provide better symmetry preservation, though this requires validation through CFD analysis and model testing.
Active Flow Control: The spontaneous symmetry breaking observed in the draft tube (vortex rope formation) can potentially be suppressed through active flow control strategies. Air injection, which has been successfully demonstrated in several prototype installations [47], works by disrupting the coherent vortex structure and distributing the swirl energy over a broader frequency range. The optimal air injection rate depends on the operating condition: our results suggest that 2–3% air by volume would be effective at the critical 300 MW load point. More advanced strategies include pulsed air injection synchronized with the vortex precession frequency (0.38 Hz) to actively destabilize the helical mode.
The 2–3% air injection recommendation is based on: (1) Reference studies by Papillon et al. [58] and Susan-Resiga et al. [57] demonstrating Qair/Qwater = 2–4% effectively suppresses vortex rope in turbines with ns = 150–200 m kW (ours: ns = 177 m-kW); (2) Scaling calculation: draft tube volume Vdt ≈ 285 m3, rated flow Q = 385 m3/s, residence time τ ≈ 0.74 s → required Qair = 9.6 m3/s (4–6 nozzles, 25 mm diameter, 2–3 bar supply, ~700 kW compressor); (3) Froude criterion from Dorfler et al. [59]: Frair = Vair/√(gD3) ≈ 0.15–0.20 yields Qair/Qwater ≈ 2.3%; (4) Installation: ring manifold at 0.2D3 (0.96 m) below runner with 6–8 equally spaced ports (45–60° spacing), including check valves and flow control, with options for continuous or pulsed injection (synchronized at 0.38 Hz, reducing air consumption by 30–40%).
Runner Outlet Geometry Optimization: The formation of vortex ropes is fundamentally related to the swirl distribution at the runner outlet. Modifications to blade trailing edge geometry (such as J-grooves or split trailing edges) can reduce the circumferential velocity component while maintaining axial momentum, thus promoting axial symmetry in the draft tube flow. Our measurements indicate that reducing the swirl number S = Vθ/(Vz·R) below 0.4 at the crown region would significantly suppress vortex rope formation. This could be achieved through 5–10° adjustments in blade exit angles in the crown region.
Load-Based Operating Strategies: Given the strong load dependence of symmetry-breaking phenomena, operational strategies that minimize time spent in critical regions can be highly effective. The results suggest an optimal operating strategy:
- (1)
- Avoid prolonged operation in the 100–200 MW range [vaneless space pulsation peaks reaching 164 kPa (132% prated)];
- (2)
- Minimize dwell time at 250–350 MW [draft tube resonance range with amplitudes up to 108 kPa (87% prated)];
- (3)
- Preferentially operate at loads >500 MW or <100 MW when possible;
- (4)
- During load changes, implement rapid transitions through forbidden regions (>5 MW/min ramp rate) to minimize fatigue accumulation.
This strategy could reduce cumulative fatigue damage by an estimated approximately 40–60% compared to unrestricted operation.
5. Conclusions
This study presents systematic field measurements of pressure pulsations in a 600 MW Francis turbine across 77 operating conditions (120–180 m head × 20–600 MW load). Through high-precision instrumentation at the volute, vaneless space, and draft tube, the investigation established quantitative relationships between geometric symmetry breaking and hydraulic instability. The principal findings provide operational guidelines for flexible grid-regulating hydropower units:
- (1)
- Three symmetry-breaking mechanisms were identified with distinct spatial signatures: spontaneous axial symmetry breaking via draft tube vortex rope precession at 0.38 Hz (0.18 fn) with maximum amplitude 108 kPa (87% prated); explicit C24 × C13 symmetry disruption in vaneless space via rotor-stator interaction at 27.1 Hz with peak amplitude 164 kPa (132% prated) at part-load (P = 150 MW); and combined multi-source coupling in the volute with broadband characteristics (4–10 Hz) reaching 146 kPa (118% prated). The amplitude hierarchy vaneless space > volute > draft tube directly correlates with local symmetry-breaking intensity.
- (2)
- Head-dependent scaling revealed vaneless space sensitivity of 0.83 kPa/m (0.67% prated/m), 67% higher than Euler scaling predictions (0.50 kPa/m) due to Reynolds number effects: 22% Reynolds increase (H: 120 → 180 m) causes 11% boundary layer thinning, enhanced turbulence intensity (8–12% → 15–25%), and stronger adverse pressure gradients (−5000 to −8000 Pa/m), collectively intensifying flow separation. At part-load, guide vane closure (α ≈ 12–15° vs. design 28.5°) creates 5–8° incidence angles generating jet-wake patterns with 30–40% velocity deficits that maximize RSI pulsations through constructive interference.
- (3)
- Operational guidelines identified time-limited forbidden zones: vaneless space risk region (H = 160–180 m, P = 100–200 MW) with <2 h/day residence limit; draft tube resonance zone (H = 160–180 m, P = 250–350 MW) with <4 h/day limit. Fatigue analysis using Miner’s rule indicates maximum vaneless pulsations (164 kPa) translate to 230–460 MPa stresses at blade roots (Kgeom = 1.5–3.5), accumulating damage D ≈ 0.85–1.2 annually. Load-sequencing strategies minimizing dwell time in critical regions and implementing rapid transits (>5 MW/min) can reduce cumulative fatigue by 40–60%.
- (4)
- Symmetry restoration strategies include: air injection at 2–3% volume ratio (Qair ≈ 9.6 m3/s via ring manifold at 0.2D3 with 6–8 nozzles at 2–3 bar) to disrupt vortex coherence; runner geometry modifications reducing outlet swirl below S = 0.4 through 5–10° blade exit angle adjustments; and intelligent dispatch algorithms avoiding prolonged operation at 100–200 MW (vaneless peak) and 250–350 MW (draft tube resonance) while preferring loads >500 MW or <100 MW.
- (5)
- Novel contributions include: unprecedented 77-condition prototype measurements enabling head-dependent scaling law identification (most previous studies: <20 conditions, single-head operations); quantitative framework explicitly linking C13, C24, C13 × C24 symmetry disruption to pulsation magnitude through experimentally validated spatial hierarchy; first systematic documentation of Reynolds effects beyond Euler scaling in prototype Francis turbines, providing correction factors essential for model-to-prototype extrapolation; and data-driven operational guidelines with specific forbidden zone residence limits, air injection specifications, and load-sequencing optimization directly addressing renewable energy integration challenges for 30–40 year service life maintenance.
Future research should pursue multi-point circumferential measurements for azimuthal mode decomposition (addressing current ±15–25% spatial variation uncertainty), synchronized pressure-strain measurements for direct fatigue validation, PIV/LDV flow visualization to validate boundary layer and wake dynamics, transient symmetry-breaking investigations during load changes, and development of physics-based predictive models integrating symmetry-breaking indices with real-time operational guidance systems for the renewable energy era.
Author Contributions
Conceptualization, H.H. and Z.Z.; methodology, H.H.; validation, H.H., Z.Z. and X.L.; formal analysis, H.H.; investigation, H.H.; resources, H.Z.; data curation, H.H.; writing—original draft preparation, H.H.; writing—review and editing, H.H.; visualization, H.H.; supervision, X.L.; project administration, H.Z.; funding acquisition, X.L. All authors have read and agreed to the published version of the manuscript.
Funding
The research was supported by the National Natural Science Foundation of China Regional Innovation and Development Joint Fund project (No. U23A20669) and the Open Research Subject of Key Laboratory of Fluid and Power Machinery (Xihua University), Ministry of Education (Grant No. szjj2024-LTDL-2024010).
Data Availability Statement
The data that support the findings of this study are available from the corresponding author upon reasonable request.
Conflicts of Interest
Author Zhizhong Zhang was employed by the company “CHN Energy Dadu River Zhentouba Power Generation Co., Ltd.”, Haiku Zhang was employed by the company “Datang Hydropower Science & Technology Research Institute Co., Ltd.”. The remaining authors declare that the research was conducted in the absence of any commercial or financial relationships that could be construed as a potential conflict of interest.
References
- Kumar, G.V.B.; Sarojini, R.K.; Palanisamy, K.; Padmanaban, S.; Holm-Nielsen, J.B. Large Scale Renewable Energy Integration: Issues and Solutions. Energies 2019, 12, 1996. [Google Scholar] [CrossRef]
- Singhania, S. Hydropower Integration into Renewable Energy Systems: Technological Advances and Economic Considerations. Indian J. Renew. Energy 2024, 1, 11–15. [Google Scholar]
- Impram, S.; Nese, S.V.; Oral, B. Challenges of renewable energy penetration on power system flexibility: A survey. Energy Strategy Rev. 2020, 31, 100539. [Google Scholar] [CrossRef]
- Bhatti, B.A.; Hanif, S.; Alam, J.; Mitra, B.; Kini, R.; Wu, D. Using energy storage systems to extend the life of hydropower plants. Appl. Energy 2023, 337, 120894. [Google Scholar] [CrossRef]
- Zhou, X.; Wu, H.; Shi, C. Numerical and experimental investigation of the effect of baffles on flow instabilities in a Francis turbine draft tube under partial load conditions. Adv. Mech. Eng. 2019, 11, 1687814018824468. [Google Scholar] [CrossRef]
- Truijen, D.P.; Hoffstaedt, J.P.; Fahlbeck, J.; Jarquin Laguna, A.; Nilsson, H.; Stockman, K.; De Kooning, J.D. Impact of Dual Variable Speed and Inlet Valve Control on the Efficiency and Operating Range of Low-Head Contra-Rotating Pump-Turbines. IEEE Access 2024, 12, 86854–86868. [Google Scholar] [CrossRef]
- Hunt, J.D.; Byers, E.; Wada, Y.; Parkinson, S.; Gernaat, D.E.; Langan, S.; van Vuuren, D.P.; Riahi, K. Global resource potential of seasonal pumped hydropower storage for energy and water storage. Nat. Commun. 2020, 11, 947. [Google Scholar] [CrossRef]
- Wang, L.; Cui, J.; Shu, L.; Jiang, D.; Xiang, C.; Li, L.; Zhou, P. Research on the vortex rope control techniques in draft tube of Francis turbines. Energies 2022, 15, 9280. [Google Scholar] [CrossRef]
- Trivedi, C.; Agnalt, E.; Dahlhaug, O.G. Experimental study of a Francis turbine under variable-speed and discharge conditions. Renew. Energy 2018, 119, 447–458. [Google Scholar] [CrossRef]
- Sotoudeh, N.; Maddahian, R.; Cervantes, M.J. Investigation of rotating vortex rope formation during load variation in a Francis turbine draft tube. Renew. Energy 2020, 151, 238–254. [Google Scholar] [CrossRef]
- Geng, Q. Experimental Research on Pressure Pulsation and Stability of Giant Francis Turbine. In IOP Conference Series: Earth and Environmental Science; IOP Publishing: Bristol, UK, 2021; Volume 676, p. 012141. [Google Scholar]
- Yu, A.; Zou, Z.; Zhou, D.; Zheng, Y.; Luo, X. Investigation of the correlation mechanism between cavitation rope behavior and pressure fluctuations in a hydraulic turbine. Renew. Energy 2020, 147, 1199–1208. [Google Scholar] [CrossRef]
- Wang, H.; Zhou, D.; Guo, J.; Xu, L. Analysis of hydraulic losses in vortex rope inside the draft tube of francis pump-turbine based on entropy production theory. Machines 2023, 11, 965. [Google Scholar] [CrossRef]
- Presas, A.; Valentin, D.; Egusquiza, E.; Valero Ferrando, M.D.C.; Seidel, U. On the detection of natural frequencies and mode shapes of submerged rotating disk-like structures from the casing. Mech. Syst. Signal Process. 2015, 60, 547–570. [Google Scholar] [CrossRef]
- Iliev, I.; Trivedi, C.; Dahlhaug, O.G. Variable-speed operation of Francis turbines: A review of the perspectives and challenges. Renew. Sustain. Energy Rev. 2019, 103, 109–121. [Google Scholar] [CrossRef]
- Yang, H.; He, Q.; Huang, X.; Yang, M.; Bi, H.; Wang, Z. Experimental and numerical investigation of rotor-stator interaction in a large prototype pump-turbine in turbine mode. Energies 2022, 15, 5523. [Google Scholar] [CrossRef]
- Agnalt, E.; Iliev, I.; Solemslie, B.W.; Dahlhaug, O.G. On the rotor stator interaction effects of low specific speed Francis turbines. Int. J. Rotating Mach. 2019, 2019, 5375149. [Google Scholar] [CrossRef]
- Unterluggauer, J.; Doujak, E.; Bauer, C. Numerical fatigue analysis of a prototype Francis turbine runner in low-load operation. Int. J. Turbomach. Propuls. Power 2019, 4, 21. [Google Scholar] [CrossRef]
- Foroutan, H.; Yavuzkurt, S. Flow in the simplified draft tube of a Francis turbine operating at partial load—Part I: Simulation of the vortex rope. J. Appl. Mech. 2014, 81, 061010. [Google Scholar] [CrossRef]
- Foroutan, H.; Yavuzkurt, S. Flow in the simplified draft tube of a Francis turbine operating at partial load—Part II: Control of the vortex rope. J. Appl. Mech. 2014, 81, 061011. [Google Scholar] [CrossRef]
- Zhang, Y.; Chen, T.; Li, J.; Yu, J. Experimental study of load variations on pressure fluctuations in a prototype reversible pump turbine in generating mode. J. Fluids Eng. 2017, 139, 074501. [Google Scholar] [CrossRef]
- Kurokawa, J.; Imamura, H.; Choi, Y.D. Effect of J-groove on the suppression of swirl flow in a conical diffuser. J. Fluids Eng. 2010, 132, 071101. [Google Scholar] [CrossRef]
- Geng, C.; Li, Y.; Tsujimoto, Y.; Nishi, M.; Luo, X. Pressure oscillations with ultra-low frequency induced by vortical flow inside Francis turbine draft tubes. Sustain. Energy Technol. Assess. 2022, 51, 101908. [Google Scholar] [CrossRef]
- Binama, M.; Su, W.T.; Cai, W.H.; Li, X.B.; Muhirwa, A.; Li, B.; Bisengimana, E. Blade trailing edge position influencing pump as turbine (PAT) pressure field under part-load conditions. Renew. Energy 2019, 136, 33–47. [Google Scholar] [CrossRef]
- Cheng, H.; Zhou, L.; Liang, Q.; Guan, Z.; Liu, D.; Wang, Z.; Kang, W. A method of evaluating the vortex rope strength in draft tube of Francis turbine. Renew. Energy 2020, 152, 770–780. [Google Scholar] [CrossRef]
- Bai, L.; Zhou, L.; Han, C.; Zhu, Y.; Shi, W. Numerical study of pressure fluctuation and unsteady flow in a centrifugal pump. Processes 2019, 7, 354. [Google Scholar] [CrossRef]
- Müller, A.; Favrel, A.; Landry, C.; Avellan, F. Fluid-structure interaction mechanisms leading to dangerous power swings in Francis turbines at full load. J. Fluids Struct. 2017, 69, 56–71. [Google Scholar] [CrossRef]
- Li, D.; Wang, H.; Qin, Y.; Han, L.; Wei, X.; Qin, D. Entropy production analysis of hysteresis characteristic of a pump-turbine model. Energy Convers. Manag. 2017, 149, 175–191. [Google Scholar] [CrossRef]
- Zhang, W.; Yu, Z.; Zhu, B. Influence of tip clearance on pressure fluctuation in low specific speed mixed-flow pump passage. Energies 2017, 10, 148. [Google Scholar] [CrossRef]
- Ma, Z.; Zhu, B.; Rao, C.; Shangguan, Y. Comprehensive hydraulic improvement and parametric analysis of a Francis turbine runner. Energies 2019, 12, 307. [Google Scholar] [CrossRef]
- Mauro, S.; Lanzafame, R.; Brusca, S.; Messina, M. Unsteady computational fluid dynamics analysis of the hydrodynamic instabilities in a reversible Francis turbine used in a storage plant. Heliyon 2019, 5, e02441. [Google Scholar] [CrossRef]
- Unterluggauer, J.; Sulzgruber, V.; Doujak, E.; Bauer, C. Experimental and numerical study of a prototype Francis turbine startup. Renew. Energy 2020, 157, 1212–1221. [Google Scholar] [CrossRef]
- Rezavand Hesari, A.; Gauthier, M.; Coulaud, M.; Maciel, Y.; Houde, S. Flow characteristics of a Francis turbine under deep part-load and various no-load conditions. Exp. Fluids 2024, 65, 166. [Google Scholar] [CrossRef]
- Aponte, R.D.; Teran, L.A.; Grande, J.F.; Coronado, J.J.; Ladino, J.A.; Larrahondo, F.J.; Rodríguez, S.A. Minimizing erosive wear through a CFD multi-objective optimization methodology for different operating points of a Francis turbine. Renew. Energy 2020, 145, 2217–2232. [Google Scholar] [CrossRef]
- Wang, W.; Chen, Q.; Yan, D.; Geng, D. A novel comprehensive evaluation method of the draft tube pressure pulsation of Francis turbine based on EEMD and information entropy. Mech. Syst. Signal Process. 2019, 116, 772–786. [Google Scholar] [CrossRef]
- He, X.; Xiao, G.; Hu, B.; Tan, L.; Tang, H.; He, S.; He, Z. The applications of energy regeneration and conversion technologies based on hydraulic transmission systems: A review. Energy Convers. Manag. 2020, 205, 112413. [Google Scholar] [CrossRef]
- Labelle, G. Phase-Averaged PIV Measurements in the Draft Tube of a Francis Turbine at Speed no-Load. Master’s Thesis, Université Laval, Québec, QC, Canada, 2023. [Google Scholar]
- Ji, Y.; Song, H.; Xue, Z.; Li, Z.; Tong, M.; Li, H. A Review of the Efficiency Improvement of Hydraulic Turbines in Energy Recovery. Processes 2023, 11, 1815. [Google Scholar] [CrossRef]
- Presas, A.; Valentin, D.; Zhao, W.; Egusquiza, M.; Valero, C.; Egusquiza, E. On the use of neural networks for dynamic stress prediction in Francis turbines by means of stationary sensors. Renew. Energy 2021, 170, 652–660. [Google Scholar] [CrossRef]
- Keller, J.; Pasche, S.; Avellan, F. Onset of the precessing helical vortex in a conical diffuser: Experimental and numerical investigations. IOP Conf. Ser. Earth Environ. Sci. 2014, 22, 032033. [Google Scholar]
- Trivedi, C.; Agnalt, E.; Dahlhaug, O.G. Investigations of unsteady pressure loading in a Francis turbine during variable-speed operation. Renew. Energy 2017, 113, 397–410. [Google Scholar] [CrossRef]
- Platonov, D.; Minakov, A.; Dekterev, D.; Sentyabov, A.; Dekterev, A. Numerical and experimental study of low-frequency pressure pulsations in hydraulic units with Francis turbine. J. Phys. Conf. Ser. 2016, 754, 062007. [Google Scholar] [CrossRef]
- Sun, L.; Xu, H.; Li, C.; Guo, P.; Xu, Z. Unsteady assessment and alleviation of inter-blade vortex in Francis turbine. Appl. Energy 2024, 358, 122616. [Google Scholar] [CrossRef]
- Xu, L.; Jin, X.; Li, Z.; Deng, W.; Liu, D.; Liu, X. Particle image velocimetry test for the inter-blade vortex in a Francis turbine. Processes 2021, 9, 1968. [Google Scholar] [CrossRef]
- Goyal, R.; Gandhi, B.K.; Cervantes, M.J. PIV measurements in Francis turbine—A review and application to transient operations. Renew. Sustain. Energy Rev. 2018, 81, 2976–2991. [Google Scholar] [CrossRef]
- Zhang, H.; Chen, D.; Xu, B.; Patelli, E.; Tolo, S. Dynamic analysis of a pumped-storage hydropower plant with random power load. Mech. Syst. Signal Process. 2018, 100, 524–533. [Google Scholar] [CrossRef]
- Jaros, R.; Byrtus, R.; Dohnal, J.; Danys, L.; Baros, J.; Koziorek, J.; Zmij, P.; Martinek, R. Advanced Signal Processing Methods for Condition Monitoring. Arch. Comput. Methods Eng. 2023, 30, 1553–1577. [Google Scholar] [CrossRef]
- Bai, Y.; Cheng, W.; Wen, W.; Liu, Y. Application of time-frequency analysis in rotating machinery fault diagnosis. Shock. Vib. 2023, 2023, 9878228. [Google Scholar] [CrossRef]
- Kebabsa, T.; Babouri, M.K.; Djebala, A.; Ouelaa, N. Advanced diagnostic techniques for turbo compressors: A spectral analysis approach for preventive maintenance. Adv. Mech. Eng. 2024, 16, 16878132241252329. [Google Scholar] [CrossRef]
- Kumar, S.; Cervantes, M.J.; Gandhi, B.K. Rotating vortex rope formation and mitigation in draft tube of hydro turbines—A review from experimental perspective. Renew. Sustain. Energy Rev. 2021, 136, 110354. [Google Scholar] [CrossRef]
- Favrel, A.; Gomes Pereira Junior, J.; Landry, C.; Müller, A.; Nicolet, C.; Avellan, F. New insight in Francis turbine cavitation vortex rope: Role of the runner outlet flow swirl number. J. Hydraul. Res. 2018, 56, 367–379. [Google Scholar] [CrossRef]
- Press, W.H.; Teukolsky, S.A.; Vetterling, W.T.; Flannery, B.P. Numerical Recipes: The Art of Scientific Computing, 3rd ed.; Cambridge University Press: Cambridge, UK, 2007. [Google Scholar]
- Harris, F.J. On the use of windows for harmonic analysis with the discrete Fourier transform. Proc. IEEE 1978, 66, 51–83. [Google Scholar] [CrossRef]
- Bendat, J.S.; Piersol, A.G. Random Data: Analysis and Measurement Procedures, 4th ed.; Wiley: Hoboken, NJ, USA, 2010. [Google Scholar]
- Montgomery, D.C.; Runger, G.C. Applied Statistics and Probability for Engineers, 6th ed.; John Wiley & Sons: Hoboken, NJ, USA, 2010. [Google Scholar]
- Gupta, A.K.; Lilley, D.G.; Syred, N. Swirl Flows; Abacus Press: Tunbridge Wells, UK, 1984. [Google Scholar]
- Susan-Resiga, R.; Ciocan, G.D.; Anton, I.; Avellan, F. Analysis of the swirling flow downstream a Francis turbine runner. J. Fluids Eng. 2006, 128, 177–189. [Google Scholar] [CrossRef]
- Papillon, B.; Sabourin, M.; Couston, M.; Deschênes, C. Methods for air admission in hydroturbines. In Proceedings of the XXI IAHR Symposium on Hydraulic Machinery and Systems, Lausanne, Switzerland, 9–12 September 2002; pp. 1–6. [Google Scholar]
- Dörfler, P.; Sick, M.; Coutu, A. Flow-Induced Pulsation and Vibration in Hydroelectric Machinery: Engineer’s Guidebook for Planning, Design and Troubleshooting; Springer: London, UK, 2013; ISBN 978-1-4471-4252-2. [Google Scholar]
Disclaimer/Publisher’s Note: The statements, opinions and data contained in all publications are solely those of the individual author(s) and contributor(s) and not of MDPI and/or the editor(s). MDPI and/or the editor(s) disclaim responsibility for any injury to people or property resulting from any ideas, methods, instructions or products referred to in the content. |
© 2025 by the authors. Licensee MDPI, Basel, Switzerland. This article is an open access article distributed under the terms and conditions of the Creative Commons Attribution (CC BY) license (https://creativecommons.org/licenses/by/4.0/).