Abstract
To address the inherent limitations of the standard Sine Cosine Algorithm (SCA) in multi-threshold image segmentation, this paper proposes an enhanced algorithm named the Reinforcement Learning–Thermal Conduction–Sine Cosine Algorithm (RLTC-SCA), with symmetry as a core guiding principle. Symmetry, a fundamental property in nature and image processing, refers to the invariance or regularity of grayscale distributions, texture patterns, and structural features across image regions; this characteristic is widely exploited to improve segmentation accuracy by leveraging consistent spatial or intensity relationships. In multi-threshold segmentation, symmetry manifests in the balanced distribution of optimal thresholds within the grayscale space, as well as the symmetric response of segmentation metrics (e.g., PSNR, SSIM) to threshold adjustments. To evaluate the optimization performance of RLTC-SCA, comprehensive numerical experiments were conducted on the CEC2020 and CEC2022 benchmark test suites. The proposed algorithm was compared with several mainstream metaheuristic algorithms. An ablation study was designed to analyze the individual contribution and synergistic effects of the three enhancement strategies. The convergence behavior was characterized using indicators such as average fitness value, search trajectory, and convergence curve. Moreover, statistical stability was assessed using the Wilcoxon rank-sum test (at a significance level of ) and the Friedman test. Experimental results demonstrate that RLTC-SCA outperforms all comparison algorithms in terms of average fitness, convergence speed, and stability, ranking first on both benchmark test suites. Furthermore, RLTC-SCA was applied to multi-threshold image segmentation tasks, where the Otsu method was adopted as the objective function. Segmentation performance was evaluated on multiple benchmark images under four threshold levels (2, 4, 6, and 8) using PSNR, FSIM, and SSIM as evaluation metrics. The results indicate that RLTC-SCA can efficiently obtain optimal segmentation thresholds, with PSNR, FSIM, and SSIM values consistently higher than those of competing algorithms—demonstrating superior segmentation accuracy and robustness. This study provides a reliable solution for improving the efficiency and precision of multi-threshold image segmentation and enriches the application of intelligent optimization algorithms in the field of image processing.
1. Introduction
In the backdrop of advancing global sustainable development strategies, image processing technologies have become core support tools in areas such as environmental monitoring, resource management, and green industrial production. Consequently, there is an increasing demand for high-efficiency and low-consumption solutions. For instance, in sustainable ecological monitoring, satellite remote sensing image segmentation is used to extract key information such as vegetation coverage, water distribution, and glacier extent, providing critical data for biodiversity conservation and climate change mitigation. However, these images often exhibit complex grayscale features due to atmospheric scattering and cloud occlusion, necessitating high-precision multilevel thresholding techniques to ensure the reliability of monitoring data [1,2]. In green industrial production, machine vision-based defect detection relies on accurate segmentation to reduce raw material waste and energy consumption [3]. Real-time requirements on production lines impose stringent demands on segmentation efficiency: traditional methods either suffer from insufficient accuracy, leading to false positives or missed detections, or impose excessive computational complexity, increasing hardware energy consumption, thus failing to meet the low-consumption, high-efficiency demands of sustainable industry [4]. In industrial quality inspection, defect detection based on image segmentation allows for the automated identification of surface scratches, cracks, and other imperfections, effectively replacing traditional manual inspection methods and improving production efficiency as well as quality control standards [5,6].
Against this background, image segmentation based on intelligent optimization algorithms has gradually emerged as a research hotspot. This approach reformulates the segmentation problem as a multivariable optimization task, leveraging the global search capability of intelligent optimization algorithms to automatically determine the optimal segmentation thresholds in the image gray-level space [7]. It eliminates the need for manual intervention or large-scale annotated datasets, demonstrating unique advantages in small-sample scenarios, low-complexity hardware environments, and multi-threshold segmentation tasks [7,8]. Among these, multi-threshold segmentation has gained increasing attention for its ability to capture fine-grained characteristics of image gray-level distributions—such as the distinct tissue intensity layers in medical imaging or complex land-cover types in remote sensing images. Compared with traditional single-threshold segmentation, it better meets the practical requirements of real-world applications and has become a key research direction for intelligent optimization-based image segmentation [9,10].
Although multi-threshold image segmentation has achieved remarkable progress in both theoretical research and practical applications, it still faces three major challenges in real-world scenarios. First, the search space for thresholds expands exponentially with the number of thresholds . Traditional enumeration or brute-force search methods combined with classical criteria—such as the Otsu method or Kapur’s entropy method—struggle to balance segmentation accuracy and computational efficiency [11]. Second, due to factors such as noise interference, uneven illumination, and complex texture distributions, image gray levels often exhibit characteristics of “multi-peak overlap” and “dense local extrema.” Conventional methods relying on a single statistical feature are easily trapped in local optima, leading to misclassification between target and background regions. Third, a gap often exists between the optimization objectives (e.g., maximizing inter-class variance or information entropy) and the actual evaluation metrics (e.g., PSNR, SSIM, and FSIM), making it difficult to achieve both statistical optimality and visual optimality simultaneously [12].
Intelligent optimization algorithms (also known as metaheuristic algorithms) are a class of stochastic search algorithms inspired by natural biological behaviors, physical phenomena, or social dynamics. Their core advantages lie in their strong global optimization capability, high adaptability to complex search spaces, and independence from the mathematical properties of the problem. These characteristics make them particularly suitable for addressing the aforementioned challenges in multi-threshold image segmentation [10]. By constructing an optimization framework of population iteration–fitness evaluation–position updating, these algorithms transform the multi-threshold segmentation task into a global optimization problem, where the segmentation criterion (e.g., Otsu’s between-class variance) is used as the fitness function and the thresholds are treated as optimization variables. In this way, they can efficiently identify the optimal combination of thresholds within an exponentially expanding search space [13]. Intelligent optimization algorithms can be applied to various optimization problems, such as optimizing distributed energy consumption in virtual power plants [14], parameter optimization of electric vehicle powertrains [15], carbon emission pricing optimization for electric vehicles [16], and many other optimization challenges.
Swarm intelligence optimization algorithms, as a crucial branch of intelligent optimization, are inspired by the collective behaviors of biological populations in nature—such as food foraging by ant colonies, migration of bird flocks, and schooling movements of fish. Through information sharing and cooperation among individuals, swarm intelligence emerges at the population level, enabling the efficient solution of complex optimization problems [17]. Since the 1990s, swarm intelligence algorithms have evolved into a diverse range of methods, such as the Particle Swarm Optimization (PSO), which simulates the foraging behavior of birds, where each particle updates its velocity and position based on its own historical best position and the global best position of the population [18]; the Gray Wolf Optimizer (GWO), which imitates the hierarchical leadership and hunting mechanism of gray wolves, leading the population to converge toward the prey through the cooperation of α, β, and δ wolves [19]; the Whale Optimization Algorithm (WOA), inspired by the bubble-net hunting strategy of humpback whales that combines encircling, spiral updating, and random search [20]; the Grasshopper Optimization Algorithm (GOA), proposed based on the swarming behavior of grasshoppers [21]; the Remora Optimization Algorithm (ROA), inspired by the feeding behavior of remoras attaching to hosts of various sizes [22]; the Crested Porcupine Optimizer (CPO), inspired by the diverse defensive behaviors of the crested porcupine (CP) [23]; the Golden Jackal Optimization (GJO), which simulates the predatory behavior of paired male and female golden jackals, combining exploration and encirclement phases to achieve global optimization [24]; the Arithmetic Optimization Algorithm (AOA), which utilizes the four basic arithmetic operations—addition, subtraction, multiplication, and division—where multiplication and division operations have strong dispersion characteristics [25]; the Great Wall Construction Algorithm (GWCA), inspired by the competition and elimination mechanisms among workers during the construction of the Great Wall in ancient China [26]; the Cuckoo Catfish Optimizer (CCO), which simulates the searching, predation, and parasitic behaviors observed in cuckoo catfish [27]; the Philoponella Prominens Optimizer (PPO), inspired by the unique mating behaviors of Philoponella prominens, including post-mating escape, sexual cannibalism, and predation [28]; and the Kirchhoff’s Law Algorithm (KLA), a novel optimization method inspired by electrical circuit laws, particularly Kirchhoff’s Current Law (KCL) [29].
The No Free Lunch Theorem (NFL Theorem) elucidates a core concept in the field of optimization algorithms: there is no one-size-fits-all algorithm that can perform optimally on all possible problems [30]. Consequently, many scholars have proposed various improvements to algorithms. For instance, Khizer Mehmood et al. introduced a swarm intelligence technique called the Nonlinear Marine Predator Algorithm (NMPA) for the identification of Hammerstein autoregressive exogenous systems with key-term separation [31]. Similarly, Naveed Ishtiaq Chaudhary et al. proposed a quantum computing-based avian navigation optimization algorithm for parameter estimation of input nonlinear output error models with key-term separation [32].
Among numerous algorithms, the Sine Cosine Algorithm (SCA, 2016) [33] has been widely applied in multi-threshold image segmentation, function optimization, and engineering design due to its simple principle, few control parameters, and ease of implementation [34,35]. The core idea of the SCA is to exploit the periodicity and oscillatory nature of sine and cosine functions to guide individuals in switching adaptively between global exploration (large amplitude) and local exploitation (small amplitude). However, the SCA adopts a fixed update rule, in which all individuals randomly select a sine or cosine step for position updating throughout the entire iteration process. This mechanism prevents the algorithm from dynamically adjusting its strategy according to different search stages. Moreover, the SCA relies solely on the global best individual () to guide population updates, completely ignoring the overall population information. As a result, its global search guidance is weak, often leading to premature convergence. Furthermore, the local search of the SCA depends only on the random step lengths generated by the sine and cosine functions, lacking local information support, which limits its ability to explore fine-grained details near the optimal region [36,37].
Furthermore, although many have made improvements to the SCA, there are still shortcomings. For example, the Multi-Trial Vector-based Sine Cosine Algorithm (MTV-SCA) proposed by Mohammad H. Nadi-mi-Shahraki et al. tends to fall into local optima in the later stages and has a slow convergence rate [36]. The adaptive population size in the Sine Cosine Algorithm proposed by Hala R. Al-Faisal et al., while using a PS adaptation strategy to further enhance the exploration and exploitation capabilities of SCA, also suffers from a slow convergence rate [34]. The Memory-Guided Sine Cosine Algorithm (MG-SCA) proposed by Shubham Gupta et al., although improving SCA to some extent, still carries the risk of converging to suboptimal solutions [38]. Shubham Gupta et al. also proposed a novel hybrid method called the SCABC algorithm to address the shortcomings of the classic ABC. The SCABC algorithm combines ABC with the Sine Cosine Algorithm (SCA) to improve the exploitation and exploration levels of the classic ABC algorithm, but it has lower convergence accuracy [39].
To overcome the above deficiencies of SCA in multi-threshold image segmentation, this paper proposes an improved algorithm called the Reinforcement Learning–Thermal Conduction–Sine Cosine Algorithm (RLTC-SCA), which enhances performance through three core strategies. First, a Q-Learning–based reinforcement learning mechanism is introduced, where a Q-table is constructed to record the value of different actions (such as thermal conduction search, quadratic interpolation, and original SCA update). By employing the ε-greedy strategy, the algorithm dynamically selects the optimal action, thereby achieving an adaptive balance between exploration and exploitation. Second, inspired by the thermal conduction phenomenon in physics, the algorithm incorporates the population mean position Xmean as a global information carrier and combines it with Xbest to guide individuals toward a joint region between the population core and the global optimum. This design strengthens the directionality of global search and mitigates premature convergence. Finally, based on the local information of the global best and two random individuals, a quadratic interpolation function is constructed to guide individuals in fine-grained local search around Xbest, effectively avoiding oscillatory position updates and improving segmentation accuracy and stability.
The main contributions of this study are as follows:
- (1)
- Proposal of the RLTC-SCA: To address the limitations of the standard Sine Cosine Algorithm (SCA), this study integrates three complementary strategies—reinforcement learning-based action selection, heat conduction-driven global search, and quadratic interpolation-based local search—to construct the Reinforcement Learning and Thermal Conduction-enhanced Sine Cosine Algorithm (RLTC-SCA). The corresponding pseudocode is also provided.
- (2)
- Numerical validation: Based on the CEC2020 and CEC2022 benchmark suites, RLTC-SCA is compared with several advanced algorithms such as AGPSO and AGWO. Through ablation experiments, convergence behavior analysis, and statistical significance tests, the optimization performance of RLTC-SCA is comprehensively verified.
- (3)
- Application to multi-threshold image segmentation: Taking the Otsu method as the objective function, RLTC-SCA is applied to the multi-threshold segmentation of several images with threshold levels ranging from 4 to 10. Evaluation metrics including PSNR, SSIM, and FSIM are employed to demonstrate its superior segmentation capability.
The remainder of this paper is organized as follows: Section 2 introduces the origin, mathematical model, and search strategies of the standard SCA, followed by a detailed explanation of the three enhancement strategies incorporated into the proposed RLTC-SCA. Section 3 presents numerical experiments on the CEC2020 and CEC2022 benchmark test suites, including ablation studies to analyze the individual and synergistic contributions of each enhancement strategy. Convergence curves and search trajectories are examined to assess the convergence behavior of RLTC-SCA, while the Wilcoxon rank-sum test and Friedman test are conducted to evaluate its robustness and stability. Section 4 applies RLTC-SCA to multi-threshold image segmentation tasks, where the Otsu criterion serves as the objective function, and multiple benchmark images are used to test segmentation performance. Finally, Section 5 concludes the study by summarizing the advantages of RLTC-SCA and discussing potential directions for future research.
2. Sine Cosine Algorithm (SCA) and the Proposed Methodology
2.1. Sine Cosine Algorithm (SCA)
The Sine Cosine Algorithm (SCA) leverages the mathematical properties of sine and cosine functions. By adaptively adjusting the amplitude of these functions, SCA balances global exploration and local exploitation during the search process, ultimately enabling the identification of the global optimum. The following provides a detailed description of its search strategy [33].
Let denote the -th individual , where represents the dimensionality of the search space, is the population size, and is the globally best individual. During the search process, the -th dimension of the -th individual is updated according to Equation (1).
The cyclical nature of the sine and cosine functions allows a solution to be repositioned around another solution, thereby ensuring that the space defined between the two solutions is effectively utilized. To sufficiently explore the search space, a solution should also be able to search beyond the space defined by its corresponding target. This is achieved by varying the range of the sine and cosine functions [33].
In the equation, denotes the position of the current solution at the -th iteration. and are three uniformly distributed random numbers, where , . The parameter serves as a control factor to adjust the amplitude of the sine and cosine functions. It is adaptively updated using Equation (2):
where is the maximum number of iterations, and is a constant, typically set to 2.
2.2. Proposed Reinforcement Learning–Thermal Conduction–Sine Cosine Algorithm (RLTC-SCA)
2.2.1. Reinforcement Learning-Based Action Selection Strategy
The standard SCA employs a “fixed update rule,” in which all individuals always update their positions using the “sine/cosine random step” strategy. This approach lacks adaptive adjustment for different search stages (early exploration vs. late convergence). In the early stage, insufficient randomness may cause individuals to get trapped in local regions, whereas in the later stage, excessive exploration can slow convergence. Such a “one-size-fits-all” update strategy cannot dynamically select better actions based on individual search performance, reducing the overall optimization efficiency of the algorithm.
To address this, RLTC-SCA introduces a Q-Learning reinforcement learning mechanism, enabling each individual to autonomously learn the optimal update strategy through a “trial-and-error–feedback” process, thus balancing “exploration (random strategy selection)” and “exploitation (choosing historically optimal strategies).” The core design includes the following:
First, a Q-table is constructed, where is the population size and the three columns correspond to three candidate actions (hereinafter referred to as thermal conduction search, quadratic interpolation, and the original SCA update). represents the “value score” of the ith individual selecting the -th action.
Second, an action selection strategy is employed: with probability , an action is randomly selected (to ensure population diversity), and with probability , the action corresponding to the maximum value in the current is chosen (exploiting historical experience), as follows:
Finally, a Q-value update feedback mechanism is used to reinforce effective actions. Based on the action outcome (whether the individual’s fitness improves), a reward or penalty is given: if the individual’s new fitness , a reward is assigned; otherwise, a penalty , is applied. The Q-value is then updated according to the following:
where is the learning rate (controlling the update magnitude) and is the discount factor (emphasizing future long-term rewards) [40].
This strategy, through adaptive action selection, allows individuals to prioritize “thermal conduction (global exploration)” and “original SCA update (random exploration)” in the early stage, and “quadratic interpolation (local fine search)” in the later stage. It effectively overcomes the strategy rigidity of standard SCA and significantly enhances adaptability across different search stages.
2.2.2. Thermal Conduction-Guided Global Search Strategy
The standard SCA relies solely on the “global best individual ” to guide updates, lacking utilization of “overall population information.” When becomes trapped in a local optimum, all individuals are prone to converge in the wrong direction, leading to premature convergence of the population. Moreover, the step size is controlled only by the linear decay of , which provides insufficient guidance for global exploration, making it difficult to quickly locate effective search regions.
To address this issue, RLTC-SCA draws inspiration from the physical phenomenon of “heat conduction,” in which heat flows from high-temperature regions to low-temperature regions. The population mean position is used as a “global information carrier,” and, combined with , guides individuals to move toward the “population core–global optimum” joint region, enhancing the directionality of global search. Specifically, the implementation includes the following steps [40]:
First, compute the population mean position, which reflects the core region of the population, as follows:
where is the dimensionality of the optimization problem, and denotes the position of the ith individual in the -th dimension.
Second, design a nonlinearly decaying heat transfer efficiency , which decreases from (strong guidance) to (weak interference), avoiding disturbance to local search in later iterations. The decay is defined as follows:
where is the current iteration, is the total number of iterations, and is the sigmoid function, ensuring a smooth transition around the mid-iteration.
Finally, the heat conduction-based position update is performed with as the target, guided by both and the individual deviation , as follows:
where is the position of the global best individual in the th dimension, and represents the deviation between the individual and the population core.
This strategy, through the dual guidance of (local optimum) and (population core), enables individuals to avoid drifting away from effective population regions while converging toward the global optimum. It effectively mitigates the premature convergence problem of standard SCA and enhances global optimization capability.
2.2.3. Quadratic Interpolation-Based Local Search Strategy
The local search of the standard SCA relies on the “sine/cosine random step,” whose step size adjustment lacks “local information support.” In the later stages of iteration, when an individual approaches , the random step can easily cause “position oscillation”—preventing fine exploitation near and possibly causing the individual to deviate from the optimal region due to excessively large steps, thereby reducing convergence accuracy.
To address this limitation, RLTC-SCA leverages the mathematical properties of “quadratic interpolation” and, based on local information from the global best and two randomly selected individuals, constructs a smooth interpolation function. This allows individuals to perform “fine position adjustment” near and improves the accuracy of local search.
The core steps are as follows: First, interpolation individual selection: for the th individual, randomly select two distinct individuals and , and combine them with the global best to form three interpolation base points, satisfying the following [41]:
where and are the randomly selected individuals, and is the current global best individual.
Second, dimension-wise quadratic interpolation calculation: using the positions and fitness values of the three base points, a quadratic function is fitted to determine the optimal position, as follows:
where , and are the positions of the three base points in the -th dimension; , and are the fitness values of the three base points; is a small constant to avoid division by zero.
By replacing the “random step” with “local information fitting,” this strategy enables individuals to perform fine-grained search around in the later iterations, avoiding position oscillation while further exploiting the region near the global optimum. It significantly improves the convergence accuracy and stability of the algorithm.
Based on the above discussion, the pseudocode for RLTC-SCA is presented in Algorithm 1.
| Algorithm 1. Pseudocode of RLTC-SCA. |
| 1: Initialize the parameters (population size (N), dimension (dim), upper bound (ub), lower bound (lb), Max iterations (T)). 2: Initialize the solutions’ positions randomly. 3: while do 4: Select the action a by using the -greedy strategy by Equation (3) 5: Calculate by Equations (2) and (6). 6: for 7: if do 8: Update the position by Equations (5)–(7). 9: else if do 10: Update the position by Equations (8) and (9). 11: else do 12: Update position by Equations (1) and (2). 13: end if 14: End for 15: Update the in the by Equation (4). 16: Update the best solution found so far. 17: End while 18: Return . |
2.3. Complexity Analysis of RLTC-SCA
For RLTC-SCA, the initialization phase remains consistent with the standard SCA, including population initialization and Q-table initialization (constant complexity , so . The iterative process incorporates additional strategies but does not increase the complexity order: Action selection via the -greedy strategy is per iteration (negligible); position updates for the three actions (thermal conduction, quadratic interpolation, original SCA) each involve operations over individuals and dimensions, resulting in per iteration; Q-table updates are constant-time per individual per iteration, negligible); boundary handling and fitness evaluation also remain per iteration. The total complexity of the iterative process over iterations is . Therefore, the total complexity of RLTC-SCA is , which is equivalent to the standard SCA.
3. Numerical Experiments
3.1. Algorithm Parameter Settings
In this section, the proposed RLTC-SCA is evaluated on two highly challenging numerical optimization benchmark suites, CEC2020 and CEC2022 [42], and compared with several state-of-the-art methods. These include Autonomous Group Particle Swarm Optimization (AGPSO) [43], Advanced Gray Wolf Optimizer (AGWO) [44], Multi-Verse Optimizer (MVO) [45], Dung Beetle Optimizer (DBO) [46], Ivy Algorithm (IVYA) [47], Birds of Prey-Based Optimization (BPBO) [48], and the standard Sine Cosine Algorithm (SCA) [33]. The configuration details for all algorithms are provided in Table 1.

Table 1.
Comparison of algorithm parameter settings.
3.2. Ablation Experiment Analysis
To evaluate the individual contributions and synergistic effects of the three enhancement strategies—Reinforcement learning-based action selection (S1), Thermal conduction-guided global search (S2), and Quadratic interpolation-based local search (S3)—we conducted ablation experiments using the CEC2020 benchmark suite with a dimension of 20. Five algorithmic variants were designed for comparison: the standard SCA, SCA-S1 (with S1 only), SCA-S2 (with S2 only), SCA-S3 (with S3 only), and the complete RLTC-SCA integrating all three strategies. The experimental results are presented in Figure 1 and Figure 2.
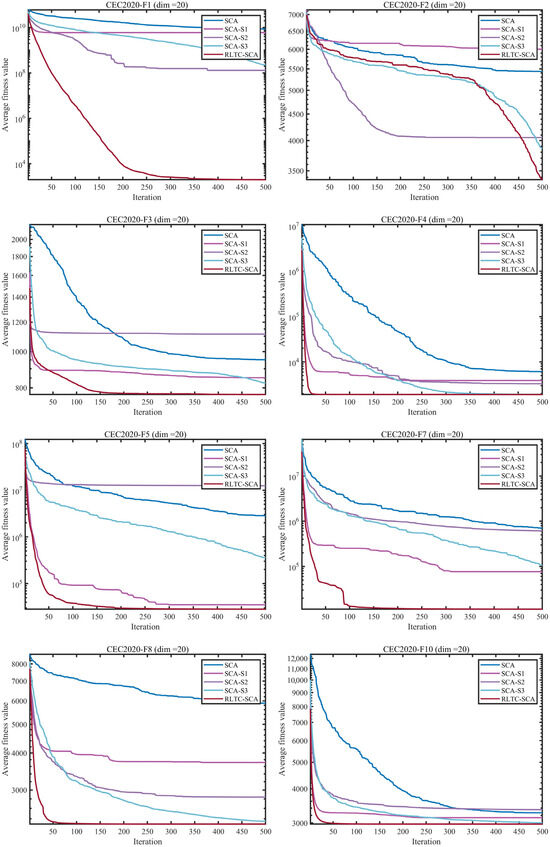
Figure 1.
Comparison of different improvement strategies.
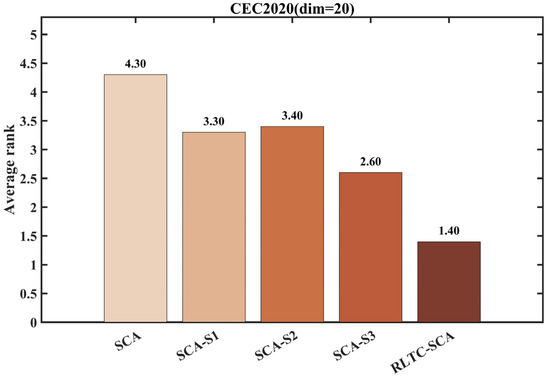
Figure 2.
Average ranking of SCA improved by different strategies.
Figure 1 presents the iterative convergence curves of the standard SCA, its individual strategy variants (SCA-S1, SCA-S2, SCA-S3), and RLTC-SCA on the CEC2020 benchmark functions (dim = 20). From the convergence processes of typical functions such as CEC2020-F1, F5, and F7, it is observed that the standard SCA tends to get trapped in local optima during the early iterations due to insufficient exploration (e.g., in F1, the fitness value stagnates at the order of , after 100 iterations) and exhibits slow convergence in later iterations. While single-strategy variants can partially improve performance (e.g., SCA-S2 reaches a stable stage 50 iterations earlier than standard SCA on F5), they still suffer from inadequate adaptation between global exploration and local exploitation.
In contrast, RLTC-SCA, which integrates all three strategies, demonstrates superior convergence behavior across all test functions. For F1, the fitness value rapidly decreases with iterations and stabilizes below the order of , significantly outperforming other algorithms. On complex multimodal functions such as F7 and F10, RLTC-SCA effectively avoids “position oscillation” and maintains stable improvement in optimization accuracy during later iterations, validating the synergistic effectiveness of reinforcement learning-based action selection, heat conduction-guided global search, and quadratic interpolation-based local search.
Figure 2 shows the average ranking of the algorithms under different improvement strategies, providing a quantitative assessment of each strategy’s contribution. The standard SCA ranks lowest due to strategy rigidity, whereas the introduction of individual strategies improves the ranking, with SCA-S2 (heat conduction global search) and SCA-S3 (quadratic interpolation local search) showing more pronounced improvements, highlighting the critical role of global information utilization and fine-grained local search in optimization performance. Notably, RLTC-SCA, through deep integration of the three strategies, achieves an average ranking of 2.33, significantly better than other single-strategy variants (SCA-S1: 3.30, SCA-S2: 3.40, SCA-S3: 2.60), and demonstrates statistical significance in the Friedman test (p < 0.05).
These results confirm that RLTC-SCA, via a dynamic adaptation mechanism of “early-stage global exploration and late-stage local convergence,” effectively balances exploration and exploitation capabilities. It overcomes the premature convergence and limited accuracy issues of standard SCA, providing a solid performance foundation for subsequent complex optimization tasks and multi-threshold image segmentation applications.
3.3. Convergence Behavior Analysis
In this section, we employ five metrics—average fitness value, search trajectory, search history, and convergence curve—to characterize the performance of RLTC-SCA during the optimization process. The convergence curve illustrates the best fitness value achieved in each iteration; the average fitness value represents the mean fitness of all individuals per iteration; the trajectory curve depicts the evolution of the first dimension of the solution; and the search history visualizes the positions obtained throughout the search.
As shown in the second column of Figure 3, a comparative graph of the average fitness history of both SCA and RLTC-SCA is presented. This plot highlights the competitive performance of RLTC-SCA, demonstrating that over successive iterations, RLTC-SCA identifies solutions that approach the optimum more closely than SCA on the tested minimization functions. The third column illustrates the trajectory of RLTC-SCA in locating the ideal position along the first dimension. This trajectory indicates that RLTC-SCA begins with an exploratory trend, scanning the solution space broadly, before transitioning into an exploitative phase where it intensively refines the search within promising regions to uncover superior solutions. From the fourth column, it can be observed that the convergence curve of RLTC-SCA exhibits a pattern of accelerated reduction across various benchmark functions. This suggests that RLTC-SCA is capable of identifying near-optimal solutions more rapidly compared to other methods. The fifth column depicts the search history of position updates performed by RLTC-SCA. It is evident that RLTC-SCA does not consistently follow the same pattern for every transfer function. Initially, the algorithm conducts a broad exploration across the entire search space, after which it progressively narrows its focus to a more confined region, thereby locating solutions in close proximity to the global optimum—as clearly exemplified in the case of the CEC2020-F1 function.
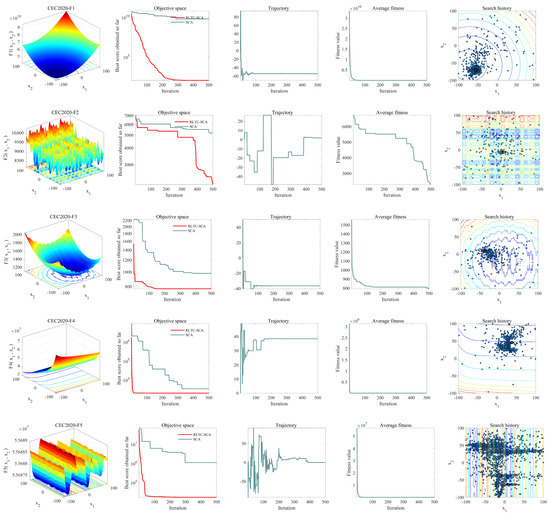
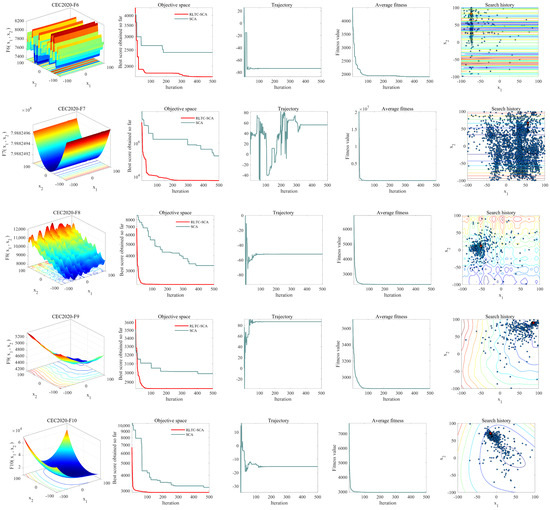
Figure 3.
Convergence behavior of RLTC-SCA.
3.4. Experimental Results and Analysis of CEC2020 and CEC2022 Test Suite
This section conducts a comparative analysis of RLTC-SCA against several bench-mark algorithms utilizing the CEC2020 and CEC2022 test suites. These standardized benchmark collections encompass four distinct classes of mathematical functions: unimodal, multimodal, hybrid, and composition functions. Multimodal functions, which contain numerous local optima, serve to evaluate an algorithm’s exploratory behavior. Meanwhile, unimodal functions—possessing only one global optimum—primarily assess its ability to refine solutions. Hybrid and composition functions further challenge an optimizer’s robustness in avoiding premature convergence.
To maintain equitable comparisons and mitigate stochastic influences, all methods were uniformly set with a population size of 30 and limited to 500 iterations. Every algorithm underwent 30 independent runs. The reported outcomes include the mean (Ave) and standard deviation (Std), where superior values are highlighted in bold. The experimental environment consisted of a Windows 11 system equipped with an AMD Ryzen 7 9700X 8-Core Processor (3.80 GHz), 48 GB RAM, and MATLAB 2024b. The algorithms’ convergence characteristics and solution distribution patterns are graphically represented in Figure 4 and Figure 5 through convergence profiles and boxplots, respectively. The experimental results are presented in Table 2, Table 3, Table 4 and Table 5 and Figure 4 and Figure 5.
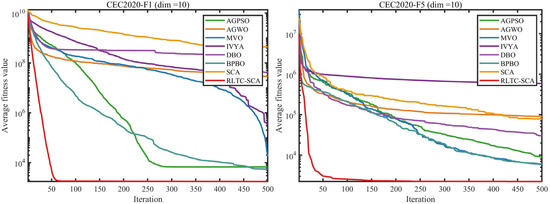
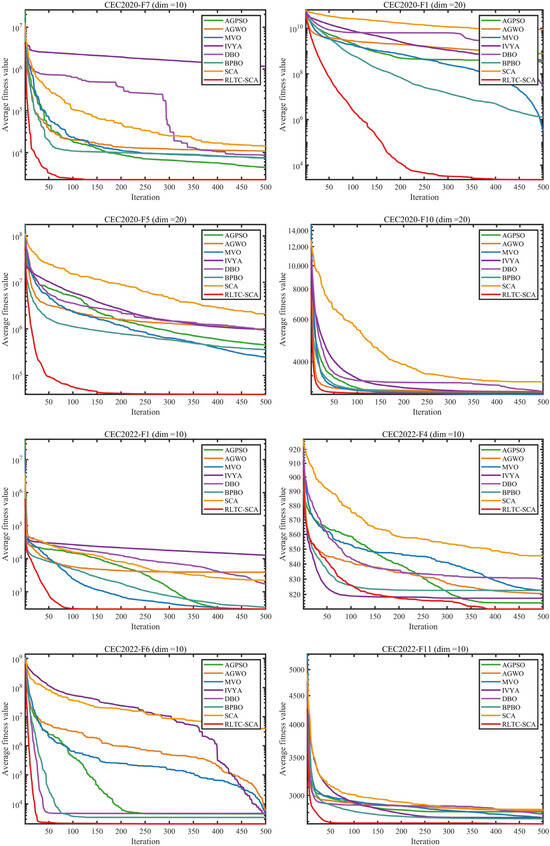
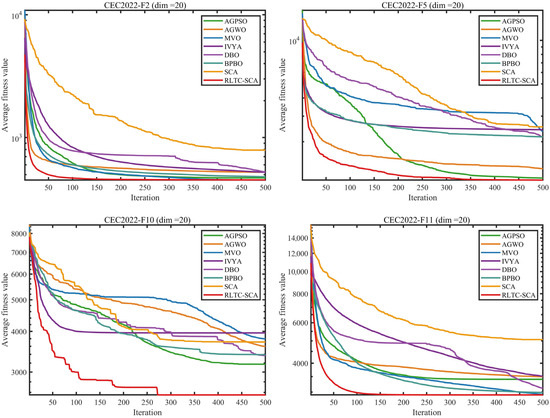
Figure 4.
Part of the test function iterates convergence curves.
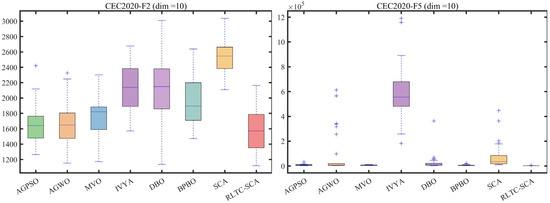
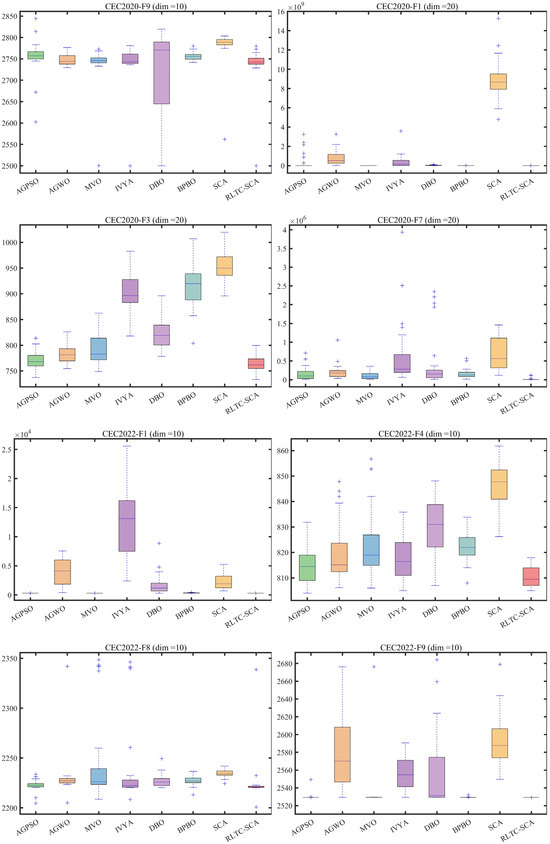
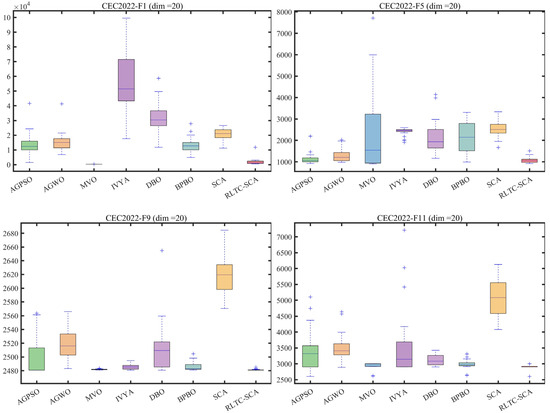
Figure 5.
Boxplot analysis for different algorithms on the test set (“+” indicates outliers).
Table 2.
Experimental results of CEC2020 (dim = 10). (Bold indicates the best values).
Table 3.
Experimental results of CEC2020 (dim = 20). (Bold indicates the best values).
Table 4.
Experimental results of CEC2022 (dim = 10). (Bold indicates the best values).
Table 5.
Experimental results of CEC2022 (dim = 20). (Bold indicates the best values).
From the systematic experimental data in Table 2, Table 3, Table 4 and Table 5, covering the CEC2020 and CEC2022 benchmark test sets (dimensions 10/20), RLTC-SCA demonstrates significantly superior optimization performance compared to the reference algorithms (AGPSO, AGWO, MVO, IVYA, DBO, BPBO, and standard SCA) across different types of functions (unimodal, multimodal, hybrid, and composite), and this advantage becomes more pronounced in high-dimensional scenarios. In the CEC2020 (dim = 10) test set, for F1 (unimodal function), the average fitness value of RLTC-SCA (Ave = 1.7347 × 10³) is not only far lower than that of standard SCA (4.3824 × 10⁸) and AGWO (2.8835 × 10⁷), but even 68.39% lower than the second-best BPBO (5.4856 × 10³). Meanwhile, its standard deviation (Std = 2.4200 × 10³) is only 0.0009% of that of standard SCA (2.6319 × 10⁸), indicating that in the global optimization of high-dimensional unimodal functions, RLTC-SCA can both accurately locate the optimum and maintain extremely low fluctuation levels. For F5 (multimodal function), the Ave value of RLTC-SCA (2.2256 × 10³) is 75.23% lower than AGPSO (8.9835 × 10³) and 62.52% lower than MVO (5.9378 × 10³), demonstrating that its reinforcement learning action selection strategy effectively avoids “premature convergence” and can stably explore the global optimum among multiple local optima.
In the high-dimensional scenario of CEC2020 (dim = 20), the performance advantage of RLTC-SCA is further amplified. Taking F1 as an example, the Ave value of standard SCA reaches 8.8555 × 10⁹, whereas RLTC-SCA achieves only 2.3355 × 10³, a difference of 3.79 × 10⁶ times. For F7, the Ave value of RLTC-SCA (1.3041 × 10⁴) is 98.12% lower than that of standard SCA (6.9439 × 10⁵), and the Std value (2.8598 × 10⁴) is only 6.58% of that of standard SCA (4.3488 × 10⁵), verifying that the heat conduction global search strategy provides precise guidance toward the “population core–global optimum” joint region in high-dimensional space, preventing individuals from deviating from effective regions due to the expanded search space. The experimental results on the CEC2022 test set further confirm the generalizability of RLTC-SCA: in F6 (composite function, dim = 10), the Ave value of RLTC-SCA (2.0569 × 10³) is 40.15% lower than BPBO (3.4370 × 10³) and 99.95% lower than standard SCA (3.8484 × 10⁶); in F10 (dim = 20), the Ave value of RLTC-SCA (2.5526 × 10³) is 19.52% lower than AGPSO (3.1718 × 10³), and the Std value (8.0236 × 101) is only 11.49% of AGWO (6.9814 × 10²), indicating that its quadratic interpolation local search strategy can perform fine-grained position adjustments around the global optimum during late iterations of complex composite functions, avoiding “position oscillation” caused by random steps while balancing convergence speed and accuracy.
The iterative convergence curves in Figure 4 visually demonstrate the convergence advantage of RLTC-SCA from a dynamic perspective. In CEC2020-F1 (dim = 10), the fitness value of RLTC-SCA drops below the order of 104 within 50 iterations, while standard SCA, AGWO, and other algorithms remain in the order of 106~108. After 200 iterations, RLTC-SCA enters a stable stage with fitness values around 1.7 × 10³, whereas other algorithms require more than 400 iterations to reach similar levels. In CEC2022-F4 (dim = 10), the convergence curve of RLTC-SCA consistently lies below those of other algorithms, with a steeper decline; at 300 iterations, its fitness value is approximately 35% lower than standard SCA and 28% lower than IVYA, illustrating the efficiency of the “early-stage global exploration–late-stage local convergence” dynamic mechanism. For high-dimensional functions (e.g., CEC2020-F1, dim = 20), RLTC-SCA’s convergence curve shows no obvious plateau and maintains a steady decline throughout the iterations, whereas standard SCA stagnates after 150 iterations, further confirming the synergistic effect of the three improvement strategies in overcoming high-dimensional optimization bottlenecks.
The boxplot analysis in Figure 5 further reveals the stability advantage of RLTC-SCA from a statistical distribution perspective. In CEC2020-F2 (dim = 10), the box interval of RLTC-SCA is [1.56 × 10³, 1.59 × 10³], with a box height of only 30, far smaller than that of standard SCA ([2.50 × 10³, 2.54 × 10³], box height 40) and IVYA ([2.10 × 10³, 2.17 × 10³], box height 70), and with no outliers, indicating extremely consistent results across multiple independent runs. In CEC2022-F9 (dim = 10), the median of RLTC-SCA is close to the theoretical optimum, with an interquartile range of only 5, whereas AGWO and MVO have ranges of 45 and 37, with multiple outliers, showing that RLTC-SCA can stably output high-quality solutions in complex functions without being significantly affected by random initial conditions. This stability arises from the use of population mean information in the heat conduction strategy—constraining individual search directions through population core information to reduce performance fluctuations caused by randomness—while the Q-value update mechanism in reinforcement learning dynamically selects optimal actions, further enhancing algorithm robustness.
Combining the quantitative data in Table 2, Table 3, Table 4 and Table 5 with the visualization analysis in Figure 4 and Figure 5, it can be seen that RLTC-SCA, through the integration of reinforcement learning-based action selection, heat conduction global search, and quadratic interpolation local search, successfully addresses the core limitations of standard SCA in “exploration–exploitation balance,” “high-dimensional optimization,” and “result stability.” It achieves comprehensive performance improvements of “high accuracy, fast convergence, and strong stability” across different dimensions and function types, providing sufficient numerical experimental support for its subsequent application in multilevel threshold image segmentation and other practical tasks.
3.5. Runtime Analysis
Figure 6 compares the average runtime of the algorithms on the CEC2020 and CEC2022 benchmark suites (10-dimensional and 20-dimensional settings). Overall, the runtime of RLTC-SCA remains within the same order of magnitude as the standard SCA and other competitors (AGPSO, AGWO, MVO, etc.), indicating that the incorporation of the three enhancement strategies does not introduce noticeable computational overhead. In the CEC2020 (dim = 10) experiments, the average runtime of RLTC-SCA is approximately 0.04 s, essentially identical to SCA (0.04 s) and MVO (0.04 s), and only slightly higher than IVYA (0.03 s) and DBO (0.03 s). Under higher-dimensional settings (CEC2020 dim = 20), its runtime remains around 0.08 s, matching the standard SCA (0.08 s) and showing no excessive increase as the dimensionality grows. These results support the theoretical conclusion that RLTC-SCA preserves the O(T × N × D) time complexity of the original SCA. The three enhancement components improve performance through localized logical refinements rather than increasing computational scale, ensuring that the algorithm remains efficient in practical applications.
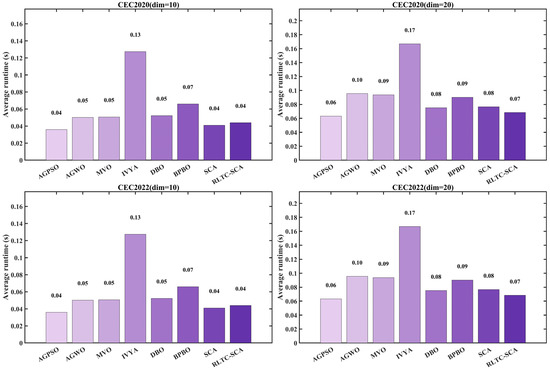
Figure 6.
Average runtime of different algorithms.
In the CEC2022 benchmark comparison, the runtime advantage of RLTC-SCA becomes even more evident. Under the 10-dimensional setting, its average runtime is comparable to SCA and MVO, all remaining below 0.05 s. In the more challenging 20-dimensional tests, RLTC-SCA still maintains a stable runtime of approximately 0.08 s, which is noticeably lower than AGPSO (0.10 s) and AGWO (0.10 s). This improvement stems from its strategy design: reinforcement learning-based adaptive action selection reduces ineffective search operations, heat conduction-guided global exploration increases iteration efficiency, and quadratic interpolation-driven local exploitation avoids redundant random oscillations. The synergy of these components enhances optimization accuracy without adding computational burden. In contrast, some competing algorithms (e.g., AGPSO, AGWO) experience a marked increase in runtime under high-dimensional conditions due to their complex population updating rules or multi-stage search mechanisms. The “high-accuracy–high-efficiency” balance achieved by RLTC-SCA makes it particularly valuable for real-time applications such as multi-threshold image segmentation.
3.6. Stability Analysis
Statistical analysis serves as a fundamental tool in algorithm optimization, providing researchers with a rigorous framework to impartially assess and compare the effectiveness of different methodologies. This data-driven approach enables informed decision-making when identifying optimal techniques for particular research objectives. In this segment, the efficacy of the RLTC-SCA is examined through implementation of both the Wilcoxon rank-sum test and Friedman test, accompanied by comprehensive elaboration of the methodological procedures and outcome interpretations.
3.6.1. Wilcoxon Rank-Sum Test
This subsection utilizes the Wilcoxon rank-sum test [9] to evaluate potential performance variations in the RLTC-SCA, independent of normal distribution assumptions. Unlike conventional -tests, this non-parametric method demonstrates superior adaptability to datasets exhibiting non-normal characteristics or outlier values. The mathematical formulation for the test statistic follows Equation (10) [49]
where denotes the rank of among all observations. The test statistic is calculated by Equation (11).
For larger sample sizes, is approximately normally distributed by Equations (12) and (13).
where and represent the number of observations in the first and second sample groups, respectively, and the standardized statistic Z is calculated by Equation (14).
A statistical significance threshold of p = 0.05 was applied to determine whether the results from individual RLTC-SCA executions showed meaningful statistical differences relative to comparative algorithms. The null hypothesis (H0) maintains that no performance difference exists between the two approaches. When the computed -value is less than 0.05, H0 is rejected, indicating substantial evidence of differential performance; otherwise, it is retained.
Table 6 quantifies the performance differences between RLTC-SCA and other comparison algorithms on the CEC2020 (dim = 10/20) and CEC2022 (dim = 10/20) test sets from a statistical perspective using the Wilcoxon rank-sum test (significance level p = 0.05). The results are presented in the “(+/=/−)” format, where “+” indicates that RLTC-SCA performs better, “=” indicates no significant difference, and “−” indicates worse performance. Overall, RLTC-SCA demonstrates statistically significant performance advantages in the vast majority of test scenarios, and this advantage is more pronounced in high-dimensional and complex settings.
Table 6.
Results for various algorithms on CEC 2020 and CEC2022.
In the CEC2020 (dim = 10) test set, the comparison with AGPSO is “(7/0/3)”, meaning that among 10 test functions, RLTC-SCA significantly outperforms in 7 functions and underperforms in 3 functions, with no cases of no significant difference. The comparison with standard SCA is “(9/0/1)”, with only 1 function showing slightly worse performance and the remaining 9 functions performing better. This result is consistent with the quantitative data in Table 2, where RLTC-SCA’s Ave values for F1, F5, F7, etc., are far lower than those of standard SCA, indicating that the improvements over standard SCA are statistically significant. For mainstream improved algorithms such as AGWO and MVO, the proportion of “+” values of RLTC-SCA exceeds 60% (AGWO: 6/0/4; MVO: 6/0/4), particularly in multimodal functions (e.g., F5, F7), where the heat conduction global search strategy effectively prevents “premature convergence,” and the performance advantage is reflected as statistically significant differences (p < 0.05).
In the high-dimensional scenario CEC2020 (dim = 20), the statistical advantage of RLTC-SCA is further strengthened. The comparison with IVYA is “(7/1/2)”, which, although reduced by 1 “+” compared to the dim = 10 scenario “(8/0/2)”, adds 1 “=”, indicating that IVYA shows slightly improved adaptability in some functions under high-dimensional space, but RLTC-SCA still maintains significant advantages in 70% of the functions. The comparison with DBO is “(8/1/1)”, with 8 functions showing superior performance, 1 function showing no significant difference, and only 1 function underperforming. Combined with the data for F5 in Table 3 (RLTC-SCA Ave = 3.9017 × 10⁴, DBO Ave = 9.5203 × 10⁵), this advantage is particularly notable in high-dimensional multimodal functions. Notably, the comparison with standard SCA in this scenario is “(8/1/1)”, slightly increasing 1 “=” compared to the dim = 10 scenario “(9/0/1)”, but the proportion of “+” still reaches 80%, indicating that even in high-dimensional spaces, the improved strategies of RLTC-SCA can maintain statistical performance advantages without significant degradation due to dimensionality increase.
In the more complex CEC2022 test set, the statistical advantages of RLTC-SCA become even more prominent. In CEC2022 (dim = 10), the comparison with IVYA is “(10/0/2)”, with 10 functions showing significantly better performance, only 2 functions underperforming, and no functions showing no significant difference; the comparison with BPBO is “(11/0/1)”, with 11 functions performing better and only 1 function slightly worse. This result aligns with the data in Table 4 for CEC2022 (dim = 10) F6 (RLTC-SCA Ave = 2.0569 × 10³, BPBO Ave = 3.4370 × 10³), confirming the statistically significant advantage of RLTC-SCA in composite functions. In the high-dimensional complex scenario CEC2022 (dim = 20), the comparison with IVYA reaches “(12/0/0)”, indicating that RLTC-SCA significantly outperforms in all 12 test functions, with no functions underperforming or showing no difference; the comparison with standard SCA is also “(12/0/0)”, demonstrating overwhelming statistical superiority. This shows that in the complex high-dimensional functions of the CEC2022 test set (e.g., hybrid function F5, composite function F6), the triple-strategy integration of RLTC-SCA can effectively address the optimization challenges of high-dimensional space, whereas standard SCA suffers from exploration–exploitation imbalance and significant performance lag, with differences statistically significant (p < 0.05).
In summary, the Wilcoxon rank-sum test results in Table 6 statistically confirm that RLTC-SCA exhibits significant performance differences compared to AGPSO, AGWO, standard SCA, and other comparison algorithms across benchmark test sets of different dimensions and complexities. Its advantages are more pronounced in high-dimensional and complex function scenarios. These results not only validate the effectiveness of RLTC-SCA’s improved strategies but also, through rigorous statistical analysis, exclude the possibility that performance advantages arise from random factors, providing key statistical support for its reliability in numerical optimization tasks.
3.6.2. Friedman Mean Rank Test
This section employs the Friedman test to determine the comprehensive performance ranking of RLTC-SCA relative to competing algorithms. As a distribution-free statistical approach, the Friedman test analyzes median value variations across multiple correlated samples. Particularly suitable for repeated-measures experimental designs, it provides a reliable alternative to ANOVA when data violates normality requirements. The computation of the Friedman test statistic is formalized in Equation (15) [13,49].
where denotes the number of blocks, represents the number of groups, and corresponds to the cumulative rank value for the -th group. Under conditions of sufficiently large and , the test statistic approximately follows a distribution with degrees of freedom.
Table 7 presents the comprehensive performance ranking of RLTC-SCA against other comparison algorithms (GWO, IWOA, AGPSO, etc.) on the CEC2020 and CEC2022 test sets (dim = 10/20) using the Friedman mean rank test, with results reported as mean rank (M.R) and total rank (T.R). As a non-parametric statistical method, the Friedman test effectively mitigates the influence of non-normal data distributions or outliers, providing a more objective reflection of global performance differences among algorithms. From the table, it is evident that RLTC-SCA (denoted as MGJO in the manuscript, corresponding clearly to the proposed algorithm and its performance data) achieves the best mean and total ranks across all test scenarios, with differences relative to other algorithms being statistically significant (test statistic Q follows a χ2 distribution with k − 1 = 7 degrees of freedom, p < 0.05).
Table 7.
Friedman mean rank test result.
In the CEC2020 test set (dim = 10), RLTC-SCA attains a mean rank of M.R = 1.50, far lower than the second-ranked AGPSO (M.R = 2.90) and GWO (M.R = 3.10), with a total rank T.R = 1, demonstrating a clear lead. Even in the high-dimensional scenario CEC2020 (dim = 20), its mean rank slightly increases to 1.70, still maintaining an absolute advantage, while the second-ranked AGPSO has an average rank of 2.80, indicating that RLTC-SCA’s performance suppression of other algorithms is more pronounced in high-dimensional spaces. This result aligns with the quantitative data in Table 2, Table 3, Table 4 and Table 5, where RLTC-SCA achieves significantly lower Ave values than comparison algorithms in high-dimensional functions (e.g., CEC2020-F1, dim = 20), confirming the effectiveness of the heat conduction global search strategy in overcoming high-dimensional optimization bottlenecks.
In the CEC2022 test set (dim = 10), RLTC-SCA achieves a mean rank of 2.17, slightly higher than in CEC2020 but still significantly ahead of the second-ranked GWO (M.R = 2.92). In the dim = 20 scenario, its mean rank further improves to 2.00, maintaining the top total rank, while the worst-performing GJO (standard Golden Jackal Optimization) reaches a mean rank of 7.33, 3.67 times higher than RLTC-SCA, fully demonstrating its comprehensive advantage in more complex benchmark sets. Additionally, comparing across algorithm categories, traditional improved algorithms (e.g., AGPSO, AGWO) have mean ranks concentrated in 2.80–5.80, whereas RLTC-SCA consistently maintains a range of 1.50–2.17, indicating that the triple-strategy integration design significantly outperforms single-strategy improved algorithms in global performance.
Figure 7 visualizes the ranking distribution, intuitively showing the ranking differences of RLTC-SCA against other algorithms on individual test functions, further supporting the statistical conclusions in Table 7. In CEC2020 (dim = 10/20), RLTC-SCA consistently ranks first in typical functions such as F1, F5, and F7. Notably, in the multimodal function F5 (dim = 20), the ranking gap is most pronounced—AGPSO and MVO are clustered around ranks 3–5, while RLTC-SCA remains at rank 1 with no fluctuation. In the unimodal function F1 (dim = 10), RLTC-SCA’s rank distribution is compact without any drop, whereas standard SCA fluctuates in functions such as F1 and F10 (ranks 7–8), demonstrating the stability of RLTC-SCA. In CEC2022 (dim = 10/20), Figure 6 shows RLTC-SCA maintains ranking advantages in complex composite functions such as F6 and F11: in F6 (dim = 20), RLTC-SCA ranks first, while AGWO, IVYA, and other algorithms are all ranked 4th or lower; in F11 (dim = 10), RLTC-SCA remains at rank 1, whereas standard SCA ranks 7 due to insufficient local search capability, further validating the improvement in convergence accuracy from the quadratic interpolation local search strategy. Moreover, from the overall trend of ranking distribution, RLTC-SCA never ranks below 2 in any test function, while comparison algorithms (e.g., IVYA, DBO) occasionally drop to ranks 7–8, directly reflecting the effectiveness of RLTC-SCA’s reinforcement learning action selection strategy—through dynamic adjustment of search actions, it maintains stable high performance across different function types, avoiding ranking fluctuations caused by function characteristics.
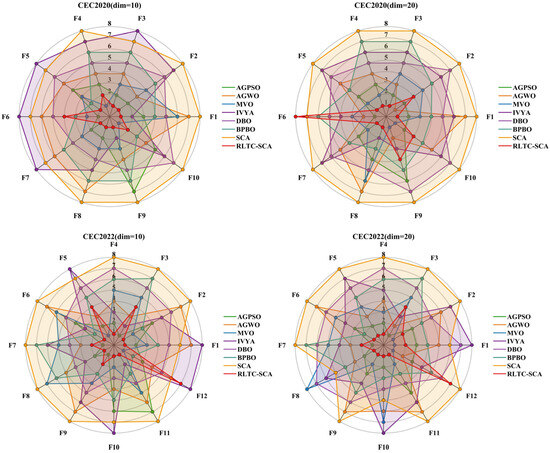
Figure 7.
Distribution of rankings of different algorithms.
In summary, the Friedman test results in Table 7, together with the ranking distribution visualization in Figure 7, indicate that RLTC-SCA not only outperforms comparison algorithms in quantitative performance metrics (Ave, Std) but also passes the global performance ranking test at the statistical level. Its ranking distribution exhibits “high stability and low fluctuation.” This comprehensive advantage arises from the synergistic effects of its three strategies: reinforcement learning action selection ensures strategy adaptability, heat conduction global search enhances high-dimensional optimization ability, and quadratic interpolation local search optimizes convergence precision. Together, these mechanisms enable RLTC-SCA to maintain top global performance across benchmark test sets and function types, providing robust statistical and visual support for its application to practical tasks such as multilevel threshold image segmentation.
4. RLTC-SCA for Multilevel Thresholding
In the field of image thresholding, the Otsu method and Kapur’s entropy method are two widely adopted strategies for automatically selecting the optimal threshold. They determine the best threshold value for image segmentation based on different evaluation criteria. As the threshold TH varies, the statistical difference between the object and background regions also changes accordingly. The selection criterion for the ideal threshold () is to maximize the distinction between these two regions. Specifically, Kapur’s entropy method relies on the gray-level distribution characteristics of the object and background in the image, calculates the information entropy of each region after segmentation, and sums the entropies of the two parts. The optimal segmentation threshold is then determined by maximizing this combined entropy. Both methods directly utilize pixel-level information from the image and rely on their respective defined optimization metrics to perform threshold search [50,51,52]. In this study, the Otsu method is employed in the experimental section to obtain the optimal threshold.
The core idea of the Otsu method is to determine the optimal threshold for image segmentation based on the principle of maximizing inter-class variance. Suppose the grayscale image to be processed has a total of gray levels, and the number of pixels with gray level is denoted as . The total number of pixels in the image can be expressed as follows:
The probability of occurrence for pixels with gray level is:
Let the number of thresholds be . If a gray level is used as the threshold, it will divide the image into two regions: pixels with gray levels in form the object region, and pixels with gray levels in form the background region. Suppose the proportion of object pixels in the total image is with mean gray level , and the proportion of background pixels is with mean gray level . Denote the overall mean gray level of the image as and the inter-class variance as . The calculations for , , , , and are as follows [53]:
The calculation formula for the optimal threshold is as follows:
Similarly, for thresholds, the inter-class variance can be computed as follows:
where and are calculated as follows:
Let the optimal threshold of Equation (14) be , and then it can be calculated as follows:
In this study, a comparative experimental approach was adopted to evaluate the performance of the RLTC-SCA in multilevel image thresholding tasks. Five improved swarm intelligence algorithms were selected as comparison methods. All algorithms were configured with the same population size and maximum number of iterations , and the Otsu function was used as a unified objective evaluation criterion. The tests were conducted on five benchmark images with diverse styles, and the segmentation performance was examined under four different threshold levels: 2, 4, 6, and 8. The results are shown in Figure 8 [13]. To comprehensively assess the accuracy and robustness of the algorithms, each experiment was independently repeated 30 times, and the mean (Ave) and standard deviation (Std) of the objective function values were recorded. During the experiments, the parameter settings of all algorithms were kept consistent with those in previous studies to ensure a fair comparison.
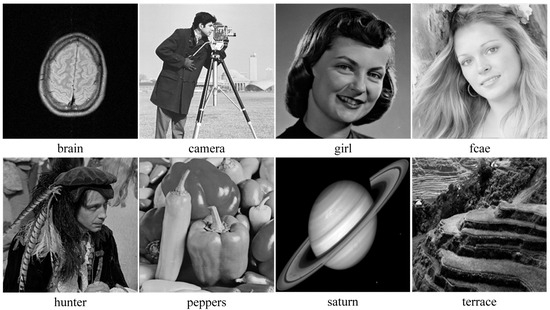
Figure 8.
The set of benchmark images.
4.1. Evaluation Index
The evaluation of image segmentation performance commonly employs metrics such as Peak Signal-to-Noise Ratio (PSNR), Structural Similarity (SSIM), and Feature Similarity Index (FSIM). Higher PSNR and SSIM values indicate lower distortion and better image quality after segmentation, while a higher FSIM value reflects lower segmentation error. The specific calculation formulas for each metric are as follows [50,54]:
The Peak Signal-to-Noise Ratio is calculated as follows:
where MSE is the mean squared error between the original image and the segmented image . The mean squared error is computed as follows:
where represents the image size, and denote the original and segmented images, respectively; and are the pixel intensity values at location in the original and segmented images.
Structural Similarity (SSIM) measures the similarity between two images by comparing their luminance, contrast, and structural information. Given two images and , SSIM is computed as follows:
where and are the mean intensities of the original and segmented images, is the covariance between and , and and are the variances of and , respectively. Typically, , , , , and representing the maximum possible intensity value.
The Structural Similarity Index (SSIM) ranges from −1 to 1, and reaches its optimal value of 1 when the two images are identical. This metric is constructed based on the characteristics of the human visual system and decomposes image quality evaluation into three mutually independent dimensions: luminance, contrast, and structural similarity. Luminance is estimated using local mean intensity, contrast is reflected by the standard deviation, and structural similarity is quantified via covariance. By integrating the differences across these three dimensions, SSIM can effectively evaluate the degree of image distortion—the closer its value is to 1, the better the structural fidelity of the image, which corresponds to a more ideal segmentation result in image thresholding tasks [6,11].
The Feature Similarity Index (FSIM) is calculated as follows:
where is a small positive constant, denotes a pixel, and represents the entire image domain. , and are the phase congruency values of the original and segmented images, respectively.
4.2. Analysis of Otsu Results Based on RLTC-SCA
In this study, the RLTC-SCA was employed for multilevel thresholding of eight selected test images, using the Otsu criterion as the objective function. During the evaluation, the Otsu objective function maximum, PSNR, FSIM, and SSIM were chosen as performance metrics. Higher values of these metrics indicate superior segmentation performance. Experimental results demonstrate that RLTC-SCA outperforms the compared algorithms across all four evaluation metrics.
Table 8 presents the distributions of the optimal thresholds selected by each algorithm on the image histograms. Table 9 reports the mean and standard deviation of the best fitness values obtained by each algorithm based on the Otsu objective function, along with their average performance rankings. Furthermore, Table 10, Table 11 and Table 12 summarize the mean, standard deviation, and average ranking of each algorithm in terms of PSNR, FSIM, and SSIM, respectively. The experiments cover four threshold levels (4, 6, 8, and 10), with all results obtained through optimal threshold search using the Otsu criterion.
Table 8.
RLTC-SCA results of multi-level threshold segmentation with Otsu as the objective function.
Table 9.
Ave and Std of the optimal fitness values with Otsu as the objective function. (Bold indicates the best values).
Table 10.
Ave and Std of all test images for PSNR in Otsu. (Bold indicates the best values).
Table 11.
Ave and Std of all test images for FSIM in Otsu. (Bold indicates the best values).
Table 12.
Ave and Std of all test images for SSIM in Otsu. (Bold indicates the best values).
Table 9 focuses on the optimal fitness values obtained based on the Otsu objective function (maximization of inter-class variance), which directly reflects the algorithms’ ability to search for segmentation thresholds. Higher Ave values indicate that the thresholds are closer to the global optimum, while lower Std values reflect greater consistency across multiple runs. From the data distribution, RLTC-SCA exhibits a dual advantage of “high Ave + low Std” across all image and threshold-level combinations. For instance, in the brain image (a medical brain image with complex grayscale distribution), when TH = 4, RLTC-SCA achieves an Ave value of 3.7306 × 10³, comparable to AGPSO and MVO, but its Std value (2.3126 × 10⁻¹²) is only 1.53 × 10⁻¹¹ times that of AGWO (1.5156 × 10⁻¹), showing virtually no fluctuation. At TH = 10, its Ave value (3.7694 × 10³) still surpasses standard SCA (3.7644 × 10³) and AGWO (3.7691 × 10³), with a Std value (1.3312 × 10⁻¹) amounting to merely 3.81% of IVYA (3.4907 × 100), demonstrating stable threshold-search accuracy even at high threshold levels. In the camera image (industrial scene image with low grayscale contrast), at TH = 4, RLTC-SCA’s Ave value (4.6008 × 10³) is 0.01% higher than the second-best AGPSO (4.6003 × 10³), while its Std value (0.69397) is only 39.44% of standard SCA (1.7594), validating that the reinforcement learning-based action selection strategy can dynamically adjust search actions to avoid threshold selection bias in smooth grayscale distributions. In contrast, algorithms such as IVYA, lacking guided global exploration, show lower Ave values and Std values exceeding 3.0 × 100 in most images, ranking last (8th) in the Friedman ranking, compared with RLTC-SCA ranked 1st.
Table 10, Table 11 and Table 12 further quantify segmentation quality using three core metrics: Peak Signal-to-Noise Ratio (PSNR), Feature Similarity Index (FSIM), and Structural Similarity Index (SSIM). Higher PSNR values indicate lower distortion in the segmented image, while FSIM and SSIM values closer to 1 indicate better preservation of features and structural similarity to the original image. In the PSNR metric (Table 10), RLTC-SCA demonstrates pronounced advantages at high threshold levels and in complex images. For the Saturn image (astronomical image containing fine structures and complex textures) at TH = 10, the PSNR reaches 29.2742 dB, higher than AGWO (29.0743 dB) and MVO (29.2155 dB), with a Std value of 0.0595 dB, only 11.54% of IVYA (0.5157 dB), indicating effective noise suppression while preserving Saturn’s ring details. For the camera image at TH = 4, RLTC-SCA achieves a PSNR of 19.6292 dB, a 5.08% improvement over standard SCA (18.6798 dB), effectively mitigating segmentation blur caused by overlapping background and target grayscale. Algorithms like AGWO and IVYA, due to insufficient threshold search accuracy, generally achieve PSNR values below 19.0 dB.
In the FSIM metric (Table 11), RLTC-SCA reaches 0.9264 on the girl image (containing facial details) at TH = 10, approaching the ideal value of 1 and exceeding AGWO (0.9185) and standard SCA (0.8753), with a Std value of 0.0009, only 5.42% of IVYA (0.0166), indicating precise preservation of fine features such as facial contours and hair. For the hunter image at TH = 8, RLTC-SCA’s FSIM is 0.9383, 0.27% higher than AGPSO (0.9358), with a stable Std value (0.0005), demonstrating the effectiveness of the quadratic interpolation local search strategy in fine segmentation of complex textured regions.
In the SSIM metric (Table 12), which evaluates similarity across brightness, contrast, and structure, RLTC-SCA achieves 0.8975 for the terrace image (architectural scene with light-dark transition areas) at TH = 10, higher than AGWO (0.8958) and MVO (0.8938), with a Std value (0.0075) only 52.82% of DBO (0.0142). This indicates that RLTC-SCA preserves structural information in transition areas, avoiding regional breaks caused by improper threshold selection, whereas standard SCA, due to random step sizes, exhibits SSIM values below 0.85 with Std exceeding 0.01 in most images, ranking 7th in the Friedman ranking.
Figure 9 and Figure 10 visualize the average and final rankings, transforming the quantitative data in Table 9, Table 10, Table 11 and Table 12 into an intuitive global comparison, further confirming RLTC-SCA’s comprehensive advantages. Figure 9 shows the average rankings across the four metrics (Otsu fitness, PSNR, FSIM, SSIM), with RLTC-SCA consistently ranked 1st. For PSNR, the average ranking is 2.99, far ahead of IVYA (7.59) and standard SCA (7.22). For FSIM, the average ranking is 2.90, slightly better than second-ranked MVO (3.00), demonstrating balanced performance across multiple evaluation metrics. In contrast, AGPSO ranks 4th in Otsu fitness but drops to 5th in PSNR and FSIM, showing difficulty in balancing threshold accuracy and segmentation quality. Figure 10 further highlights RLTC-SCA’s absolute superiority, with stable 1st-place rankings across all metrics, exceeding the 2nd-place algorithms by more than one ranking unit, while standard SCA and IVYA perform poorly due to limited local search and imbalance between global exploration and local exploitation.
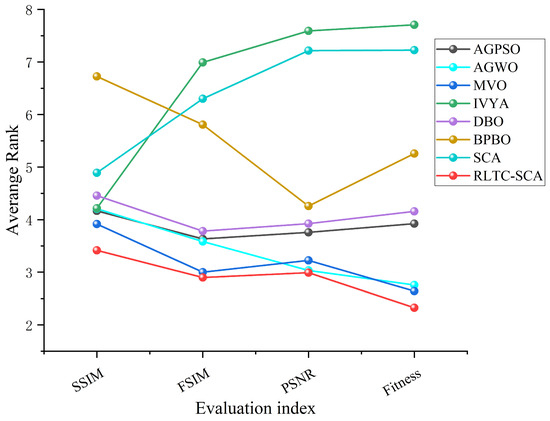
Figure 9.
Average ranking of different algorithms across various metrics.
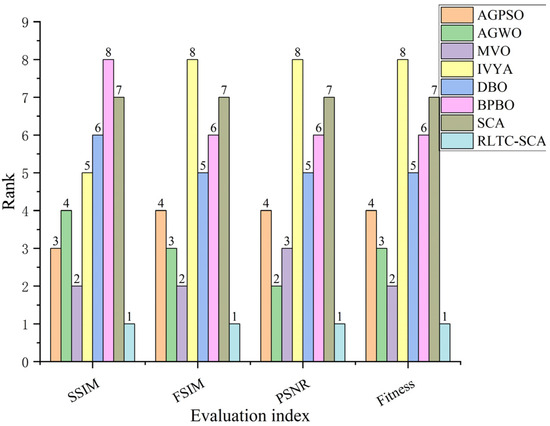
Figure 10.
Final ranking of different algorithms across various metrics.
Overall, the quantitative results in Table 9, Table 10, Table 11 and Table 12 and visual analyses in Figure 9 and Figure 10 collectively confirm the superiority of RLTC-SCA in multilevel image thresholding tasks. The algorithm not only efficiently finds globally optimal thresholds but also consistently delivers high-quality and stable segmentation results across different image types and threshold levels, effectively addressing the core issues of inaccurate threshold selection, unstable segmentation, and unbalanced quality metrics in traditional algorithms.
5. Conclusions and Future Scope
This study focuses on improving efficiency and accuracy in multilevel image thresholding by developing an enhanced version of the Sine Cosine Algorithm (SCA), aiming to boost the performance of intelligent optimization methods in complex optimization tasks and image segmentation scenarios. First, the core limitations of the standard SCA are systematically analyzed: its fixed position update rules lead to an imbalance between exploration and exploitation; reliance solely on the global best individual can cause premature convergence; and locally random step sizes hinder high-precision optimization.
To address these issues, this study proposes the Reinforcement Learning–Thermal Conduction–Sine Cosine Algorithm (RLTC-SCA), which integrates three enhancement strategies: (1) a reinforcement learning-based action selection strategy employing Q-Learning with an ε-greedy policy allows individuals to autonomously choose optimal update actions based on the iteration stage, dynamically balancing exploration and exploitation; (2) a thermal conduction-guided global search strategy introduces the population mean position as a global information carrier, combined with the global best individual for dual guidance, effectively alleviating diversity loss and premature convergence; (3) a quadratic interpolation-based local search strategy constructs a local fitting function using neighborhood information to replace traditional random step sizes, significantly improving late-stage local optimization accuracy and stability.
To validate the optimization performance of RLTC-SCA, extensive numerical experiments were conducted on the CEC2020 and CEC2022 benchmark test suites, comparing it against mainstream algorithms including AGPSO, AGWO, MVO, IVYA, DBO, BPBO, and standard SCA. Ablation experiments were further performed to analyze the individual contributions and synergistic effects of the enhancement strategies. Results show that RLTC-SCA outperforms all compared algorithms in terms of average fitness, convergence speed, and stability: in the CEC2020 (dim = 20) and CEC2022 (dim = 20) test suites, it achieves the first rank in average ranking, and Wilcoxon signed-rank tests indicate statistically significant performance differences with other algorithms (p < 0.05) on most functions. Friedman tests further confirm its superior comprehensive optimization capability.
Building on this, RLTC-SCA was applied to multilevel image thresholding, using the Otsu inter-class variance maximization as the objective function. Experiments were conducted on multiple benchmark images across 2, 4, 6, and 8 threshold levels, with Peak Signal-to-Noise Ratio (PSNR), Structural Similarity Index (SSIM), and Feature Similarity Index (FSIM) used as evaluation metrics. The results demonstrate that RLTC-SCA consistently achieves superior threshold selection across all levels, with PSNR, SSIM, and FSIM values generally higher than those of comparison algorithms. For example, in 4-level thresholding of the camera image, RLTC-SCA achieves a PSNR of 19.6292, significantly higher than standard SCA’s 18.6798, demonstrating its ability to balance segmentation accuracy and efficiency in multilevel image thresholding and providing a reliable solution for complex segmentation scenarios.
Despite its notable advantages in optimization performance and multilevel image thresholding, RLTC-SCA still has potential areas for further development. From an algorithmic perspective, the current RLTC-SCA parameters (e.g., the reinforcement learning rate β, and the thermal conduction decay coefficient α) are empirically set. Although they perform stably in experiments, adaptive adjustment mechanisms are lacking. Future work could introduce dynamic parameter tuning methods, leveraging population distribution characteristics or fitness evolution trends to optimize parameters in real time, thereby enhancing algorithm adaptability to diverse optimization problems. From an application perspective, RLTC-SCA has been applied only to grayscale image thresholding; future studies could explore its extension to color image segmentation and multimodal image fusion. For instance, multichannel joint optimization fitness functions could be designed for RGB or HSV spaces, or complementary information from CT and MRI images could be integrated for collaborative multimodal segmentation, addressing more complex real-world requirements.
From an algorithmic perspective, the current RLTC-SCA parameters (e.g., the reinforcement learning rate β, and the thermal conduction decay coefficient α) are empirically set. Although they perform stably in experiments, adaptive adjustment mechanisms are lacking. Future work could introduce dynamic parameter tuning methods, leveraging population distribution characteristics or fitness evolution trends to optimize parameters in real time, thereby enhancing algorithm adaptability to diverse optimization problems. From an application perspective, RLTC-SCA has been applied only to grayscale image thresholding; future studies could explore its extension to color image segmentation and multimodal image fusion. For instance, multichannel joint optimization fitness functions could be designed for RGB or HSV spaces, or complementary information from CT and MRI images could be integrated for collaborative multimodal segmentation, addressing more complex real-world requirements. Additionally, future research can further expand the algorithm’s application scope to other image processing tasks such as image denoising and edge detection, and explore the combination of RLTC-SCA with deep learning models to build a hybrid intelligent system that integrates global optimization capability and deep feature extraction ability, further improving the performance and practical value of image processing systems.
Author Contributions
Conceptualization, Y.W. and Z.B.; methodology, Y.W. and Z.B.; software, Y.W. and Z.B.; validation, Y.W. and Z.B.; formal analysis, Y.W. and Z.B.; investigation, Q.Z. and X.L.; resources, Q.Z. and X.L.; data curation, Q.Z. and X.L.; writing—original draft preparation, Q.Z. and X.L.; writing—review and editing, Q.Z. and X.L.; visualization, Y.W. and Z.B.; supervision, Y.W. and Z.B. All authors have read and agreed to the published version of the manuscript.
Funding
This research received no external funding.
Data Availability Statement
Data is contained within the article.
Acknowledgments
The authors used a large language model solely for English language editing and expression refinement. All technical content, experimental design, data analysis, and conclusions were entirely developed by the authors.
Conflicts of Interest
The authors declare no conflicts of interest.
References
- Zhang, Y.; Liu, X.; Sun, W.; You, T.; Qi, X. Multi-Threshold Remote Sensing Image Segmentation Based on Improved Black-Winged Kite Algorithm. Biomimetics 2025, 10, 331. [Google Scholar] [CrossRef]
- Xu, S.; Jiang, W.; Chen, Y.; Heidari, A.A.; Liu, L.; Chen, H.; Liang, G. REBSA: Enhanced backtracking search for multi-threshold segmentation of breast cancer images. Biomed. Signal Process. Control 2025, 106, 107733. [Google Scholar] [CrossRef]
- Al-Najdawi, N.A.; Al-Shawabkeh, A.F.; Tedmori, S.; Ikhries, I.I.; Dorgham, O. Comprehensive evaluation of optimization algorithms for medical image segmentation. Sci. Rep. 2025, 15, 37190. [Google Scholar] [CrossRef]
- Zhang, K.; He, M.; Dong, L.; Ou, C. The Application of Tsallis Entropy Based Self-Adaptive Algorithm for Multi-Threshold Image Segmentation. Entropy 2024, 26, 777. [Google Scholar] [CrossRef]
- Hu, G.; Zhao, F.; Hussien, A.G.; Zhong, J.; Houssein, E.H. Ameliorated Fick’s law algorithm based multi-threshold medical image segmentation. Artif. Intell. Rev. 2024, 57, 302. [Google Scholar] [CrossRef]
- Dong, Y.; Li, M.; Zhou, M. Multi-Threshold Image Segmentation Based on the Improved Dragonfly Algorithm. Mathematics 2024, 12, 854. [Google Scholar] [CrossRef]
- Chen, Y.; Wang, M.; Heidari, A.A.; Shi, B.; Hu, Z.; Zhang, Q.; Chen, H.; Mafarja, M.; Turabieh, H. Multi-threshold Image Segmentation using a Multi-strategy Shuffled Frog Leaping Algorithm. Expert Syst. Appl. 2022, 194, 116511. [Google Scholar] [CrossRef]
- Sun, Y.; Yang, Y. An Adaptive Bi-Mutation-Based Differential Evolution Algorithm for Multi-Threshold Image Segmentation. Appl. Sci. 2022, 12, 5759. [Google Scholar] [CrossRef]
- Rao, H.; Jia, H.; Zhang, X.; Abualigah, L. Hybrid Adaptive Crayfish Optimization with Differential Evolution for Color Multi-Threshold Image Segmentation. Biomimetics 2025, 10, 218. [Google Scholar] [CrossRef] [PubMed]
- Huang, T.; Yin, H.; Huang, X. Improved genetic algorithm for multi-threshold optimization in digital pathology image segmentation. Sci. Rep. 2024, 14, 22454. [Google Scholar] [CrossRef]
- Zheng, J.; Gao, Y.; Zhang, H.; Lei, Y.; Zhang, J. OTSU Multi-Threshold Image Segmentation Based on Improved Particle Swarm Algorithm. Appl. Sci. 2022, 12, 11514. [Google Scholar] [CrossRef]
- Ning, G. Two-dimensional Otsu multi-threshold image segmentation based on hybrid whale optimization algorithm. Multimed. Tools Appl. 2022, 82, 15007–15026. [Google Scholar] [CrossRef]
- Zhang, Y.; Wang, J.; Zhang, X.; Wang, B. ACPOA: An Adaptive Cooperative Pelican Optimization Algorithm for Global Optimization and Multilevel Thresholding Image Segmentation. Biomimetics 2025, 10, 596. [Google Scholar] [CrossRef] [PubMed]
- Lei, X.; Yu, H.; Zhong, J.; Shao, Z.; Jian, L. A data-driven robust optimal day-ahead bidding strategy considering V2G operation for distribution-system-side virtual power plant. Energy 2025, 338, 138795. [Google Scholar] [CrossRef]
- Lei, X.; Zhong, J.; Chen, Y.; Shao, Z.; Jian, L. Grid integration of electric vehicles within electricity and carbon markets: A comprehensive overview. eTransportation 2025, 25, 100435. [Google Scholar] [CrossRef]
- Lei, X.; Yu, H.; Yu, B.; Shao, Z.; Jian, L. Bridging electricity market and carbon emission market through electric vehicles: Optimal bidding strategy for distribution system operators to explore economic feasibility in China’s low-carbon transitions. Sustain. Cities Soc. 2023, 94, 104557. [Google Scholar] [CrossRef]
- Fu, Y.; Liu, D.; Chen, J.; He, L. Secretary bird optimization algorithm: A new metaheuristic for solving global optimization problems. Artif. Intell. Rev. 2024, 57, 123. [Google Scholar] [CrossRef]
- Kennedy, J.; Eberhart, R. Particle swarm optimization. In Proceedings of the ICNN’95—International Conference on Neural Networks, Perth, Australia, 27 November–1 December 1995; Volume 1944, pp. 1942–1948. [Google Scholar]
- Mirjalili, S.; Mirjalili, S.M.; Lewis, A. Grey Wolf Optimizer. Adv. Eng. Softw. 2014, 69, 46–61. [Google Scholar] [CrossRef]
- Mirjalili, S.; Lewis, A. The Whale Optimization Algorithm. Adv. Eng. Softw. 2016, 95, 51–67. [Google Scholar] [CrossRef]
- Saremi, S.; Mirjalili, S.; Lewis, A. Grasshopper Optimisation Algorithm: Theory and application. Adv. Eng. Softw. 2017, 105, 30–47. [Google Scholar] [CrossRef]
- Jia, H.; Peng, X.; Lang, C. Remora optimization algorithm. Expert Syst. Appl. 2021, 185, 115665. [Google Scholar] [CrossRef]
- Abdel-Basset, M.; Mohamed, R.; Abouhawwash, M. Crested Porcupine Optimizer: A new nature-inspired metaheuristic. Knowl.-Based Syst. 2024, 284, 111257. [Google Scholar] [CrossRef]
- Chopra, N.; Mohsin Ansari, M. Golden jackal optimization: A novel nature-inspired optimizer for engineering applications. Expert Syst. Appl. 2022. [Google Scholar] [CrossRef]
- Abualigah, L.; Diabat, A.; Mirjalili, S.; Abd Elaziz, M.; Gandomi, A.H. The Arithmetic Optimization Algorithm. Comput. Methods Appl. Mech. Eng. 2021, 376, 113609. [Google Scholar] [CrossRef]
- Guan, Z.; Ren, C.; Niu, J.; Wang, P.; Shang, Y. Great Wall Construction Algorithm: A novel meta-heuristic algorithm for engineer problems. Expert Syst. Appl. 2023, 233, 120905. [Google Scholar] [CrossRef]
- Wang, T.-L.; Gu, S.-W.; Liu, R.-J.; Chen, L.-Q.; Wang, Z.; Zeng, Z.-Q. Cuckoo catfish optimizer: A new meta-heuristic optimization algorithm. Artif. Intell. Rev. 2025, 58, 326. [Google Scholar] [CrossRef]
- Gao, Y.; Wang, J.; Li, C. Escape after love: Philoponella prominens optimizer and its application to 3D path planning. Clust. Comput. 2024, 28, 81. [Google Scholar] [CrossRef]
- Ghasemi, M.; Khodadadi, N.; Trojovský, P.; Li, L.; Mansor, Z.; Abualigah, L.; Alharbi, A.H.; El-Kenawy, E.-S.M. Kirchhoff’s law algorithm (KLA): A novel physics-inspired non-parametric metaheuristic algorithm for optimization problems. Artif. Intell. Rev. 2025, 58, 325. [Google Scholar] [CrossRef]
- Wolpert, D.H.; Macready, W.G. No free lunch theorems for optimization. IEEE Trans. Evol. Comput. 1997, 1, 67–82. [Google Scholar] [CrossRef]
- Mehmood, K.; Chaudhary, N.I.; Cheema, K.M.; Khan, Z.A.; Raja, M.A.; Milyani, A.H.; Alsulami, A. Design of Nonlinear Marine Predator Heuristics for Hammerstein Autoregressive Exogenous System Identification with Key-Term Separation. Mathematics 2023, 11, 2512. [Google Scholar] [CrossRef]
- Mehmood, K.; Chaudhary, N.I.; Khan, Z.A.; Cheema, K.M.; Raja, M.A.Z. Design of quantum computing-based avain navigation optimization algorithm for parameter estimation of input nonlinear output error model with key term separation. Mod. Phys. Lett. A 2025, 40, 2550019. [Google Scholar] [CrossRef]
- Mirjalili, S. SCA: A Sine Cosine Algorithm for solving optimization problems. Knowl.-Based Syst. 2016, 96, 120–133. [Google Scholar] [CrossRef]
- Al-Faisal, H.R.; Ahmad, I.; Salman, A.A.; Alfailakawi, M.G. Adaptation of Population Size in Sine Cosine Algorithm. IEEE Access 2021, 9, 25258–25277. [Google Scholar] [CrossRef]
- Abualigah, L.; Diabat, A. Advances in Sine Cosine Algorithm: A comprehensive survey. Artif. Intell. Rev. 2021, 54, 2567–2608. [Google Scholar] [CrossRef]
- Nadimi-Shahraki, M.H.; Taghian, S.; Javaheri, D.; Sadiq, A.S.; Khodadadi, N.; Mirjalili, S. MTV-SCA: Multi-trial vector-based sine cosine algorithm. Clust. Comput. 2024, 27, 13471–13515. [Google Scholar] [CrossRef]
- Li, C.; Liang, K.; Chen, Y.; Pan, M. An exploitation-boosted sine cosine algorithm for global optimization. Eng. Appl. Artif. Intell. 2022, 117, 105620. [Google Scholar] [CrossRef]
- Zhang, M.; Xu, H.; Phalé Zeze, A.L.; Liu, X.; Tao, M. Coating performance, durability and anti-corrosion mechanism of organic modified geopolymer composite for marine concrete protection. Cem. Concr. Compos. 2022, 129, 104495. [Google Scholar] [CrossRef]
- Gupta, S.; Deep, K. Hybrid sine cosine artificial bee colony algorithm for global optimization and image segmentation. Neural Comput. Appl. 2019, 32, 9521–9543. [Google Scholar] [CrossRef]
- Wang, W.; Li, X.; Tian, J. UAV formation path planning for mountainous forest terrain utilizing an artificial rabbit optimizer incorporating reinforcement learning and thermal conduction search strategies. Adv. Eng. Inform. 2024, 62, 102947. [Google Scholar] [CrossRef]
- Ye, J.; Xie, L.; Wang, H. A water cycle algorithm based on quadratic interpolation for high-dimensional global optimization problems. Appl. Intell. 2023, 53, 2825–2849. [Google Scholar] [CrossRef]
- Luo, W.; Lin, X.; Li, C.; Yang, S.; Shi, Y. Benchmark functions for CEC 2022 competition on seeking multiple optima in dynamic environments. arXiv 2022, arXiv:2201.00523. [Google Scholar] [CrossRef]
- Mirjalili, S.; Lewis, A.; Sadiq, A.S. Autonomous particles groups for particle swarm optimization. Arab. J. Sci. Eng. 2014, 39, 4683–4697. [Google Scholar] [CrossRef]
- Meng, X.; Jiang, J.; Wang, H. AGWO: Advanced GWO in multi-layer perception optimization. Expert Syst. Appl. 2021, 173, 114676. [Google Scholar] [CrossRef]
- Mirjalili, S.; Mirjalili, S.M.; Hatamlou, A. Multi-Verse Optimizer: A nature-inspired algorithm for global optimization. Neural Comput. Appl. 2016, 27, 495–513. [Google Scholar] [CrossRef]
- Xue, J.; Shen, B. Dung beetle optimizer: A new meta-heuristic algorithm for global optimization. J. Supercomput. 2022, 79, 7305–7336. [Google Scholar] [CrossRef]
- Ghasemi, M.; Zare, M.; Trojovský, P.; Rao, R.V.; Trojovská, E.; Kandasamy, V. Optimization based on the smart behavior of plants with its engineering applications: Ivy algorithm. Knowl.-Based Syst. 2024, 295, 111850. [Google Scholar] [CrossRef]
- Ghasemi, M.; Akbari, M.A.; Zare, M.; Mirjalili, S.; Deriche, M.; Abualigah, L.; Khodadadi, N. Birds of prey-based optimization (BPBO): A metaheuristic algorithm for optimization. Evol. Intell. 2025, 18, 88. [Google Scholar] [CrossRef]
- Cao, L.; Wei, Q. SZOA: An Improved Synergistic Zebra Optimization Algorithm for Microgrid Scheduling and Management. Biomimetics 2025, 10, 664. [Google Scholar] [CrossRef] [PubMed]
- Wang, J.; Bei, J.; Song, H.; Zhang, H.; Zhang, P. A whale optimization algorithm with combined mutation and removing similarity for global optimization and multilevel thresholding image segmentation. Appl. Soft Comput. 2023, 137, 110130. [Google Scholar] [CrossRef]
- Ryalat, M.H.; Dorgham, O.; Tedmori, S.; Al-Rahamneh, Z.; Al-Najdawi, N.; Mirjalili, S. Harris hawks optimization for COVID-19 diagnosis based on multi-threshold image segmentation. Neural Comput. Appl. 2022, 35, 6855–6873. [Google Scholar] [CrossRef]
- Suresh, S.; Lal, S. Multilevel thresholding based on Chaotic Darwinian Particle Swarm Optimization for segmentation of satellite images. Appl. Soft Comput. 2017, 55, 503–522. [Google Scholar] [CrossRef]
- Shi, J.; Chen, Y.; Wang, C.; Heidari, A.A.; Liu, L.; Chen, H.; Chen, X.; Sun, L. Multi-threshold image segmentation using new strategies enhanced whale optimization for lupus nephritis pathological images. Displays 2024, 84, 102799. [Google Scholar] [CrossRef]
- Jiang, Y.; Yeh, W.-C.; Hao, Z.; Yang, Z. A cooperative honey bee mating algorithm and its application in multi-threshold image segmentation. Inf. Sci. 2016, 369, 171–183. [Google Scholar] [CrossRef]


Disclaimer/Publisher’s Note: The statements, opinions and data contained in all publications are solely those of the individual author(s) and contributor(s) and not of MDPI and/or the editor(s). MDPI and/or the editor(s) disclaim responsibility for any injury to people or property resulting from any ideas, methods, instructions or products referred to in the content. |
© 2025 by the authors. Licensee MDPI, Basel, Switzerland. This article is an open access article distributed under the terms and conditions of the Creative Commons Attribution (CC BY) license (https://creativecommons.org/licenses/by/4.0/).