Abstract
This paper introduces the Marshall–Olkin unit-exponentiated-half-logistic (MO-UEHL) distribution, a novel three-parameter model designed to enhance the flexibility of the unit-exponentiated-half-logistic distribution through the incorporation of the Marshall–Olkin transformation. Defined on the unit interval , the MO-UEHL distribution is well-suited for modeling proportional data exhibiting asymmetry. The Marshall–Olkin tilt parameter explicitly controls the degree and direction of asymmetry, enabling the density to range from highly right-skewed to nearly symmetric unimodal forms, and even to left-skewed configurations for certain parameter values, thereby offering a direct mathematical representation of symmetry breaking in bounded proportional data. The resulting model achieves this versatility without relying on exponential terms or special functions, thus simplifying computational procedures. We derive its key mathematical properties, including the probability density function, cumulative distribution function, survival function, hazard rate function, quantile function, moments, and information-theoretic measures such as the Shannon and residual entropy. Parameter estimation is explored using maximum likelihood, maximum product spacing, ordinary and weighted least-squares, and Cramér–von Mises methods, with simulation studies evaluating their performance across varying sample sizes and parameter sets. The practical utility of the MO-UEHL distribution is demonstrated through applications to four real datasets from environmental and engineering contexts. The results highlight the MO-UEHL distribution’s potential as a valuable tool in reliability analysis, environmental modeling, and related fields.
1. Introduction
The Weibull distribution is widely used in reliability and survival analysis, renowned for its flexibility in modeling various hazard rate shapes. Its capacity to represent increasing, decreasing, and constant failure rates has made it one of the fundamental tools for analyzing lifetime data across diverse fields including engineering, medicine, and economics [1]. However, the Weibull distribution’s inability to adequately capture non-monotonic hazard rates, such as the bathtub-shaped curves frequently observed in human mortality, mechanical wear, and electronic component failures, has motivated statisticians to develop numerous extensions and generalizations [2,3].
Among the various methodologies for extending classical distributions, the Marshall–Olkin transformation has emerged as a flexible and computationally efficient approach [4]. This method introduces an additional shape parameter to an existing baseline distribution, thereby enhancing its flexibility without fundamentally altering its structural form. The Marshall–Olkin family has been successfully applied to numerous well-known distributions, including the exponential [5], Pareto [6], gamma [7], Lomax [8], and linear failure-rate distributions [9]. Each of these extensions has demonstrated superior performance in modeling complex data patterns that the original distributions could not adequately capture.
The Marshall–Olkin transformation has proven especially valuable for extending Weibull-related distributions. Ref. [6] introduced the Marshall–Olkin extended Weibull (MOEW) distribution and investigated its properties, while [10] explored its characterization based on Weibull probability plots. Ref. [11] conducted a comprehensive study of the MOEW distribution, demonstrating that its density function can be expressed as an infinite linear combination of Weibull density functions, which facilitated the derivation of various mathematical properties including moments, generating functions, mean deviations, and entropy measures. Their work provided explicit expressions for the moment generating function and established several representations for reliability measures and order statistics, significantly advancing the theoretical foundation of Marshall–Olkin extended distributions.
The Marshall–Olkin framework has also been applied to other Weibull extensions, such as the exponentiated Weibull [12], Kumaraswamy Weibull [13], and beta modified Weibull distributions [14], each demonstrating enhanced capability in modeling bathtub-shaped failure rates.
A significant development in unit interval distributions came with the introduction of the omega distribution by [15], which offers considerable flexibility in modeling hazard rates while maintaining computational simplicity. When the boundary parameter , the omega distribution reduces to the unit-exponentiated-half-logistic (UEHL) distribution, which has shown promising applications in reliability theory [16]. The UEHL distribution belongs to the class of proportional hazard rate models and exhibits several advantageous properties, including the absence of exponential terms and special functions in its density expression, which simplifies computational procedures in parameter estimation.
In this paper, we introduce the Marshall–Olkin unit-exponentiated-half-logistic (MO-UEHL) distribution, which combines the flexibility of the UEHL distribution with the extensibility of the Marshall–Olkin transformation. The proposed distribution builds upon the foundational work of [11] on Marshall–Olkin extended distributions and extends the univariate framework of [16] by incorporating the tilt parameter from the Marshall–Olkin transformation into the UEHL distribution. This synthesis creates a more flexible three-parameter distribution defined on the unit interval that can capture a wider range of distributional shapes while maintaining computational tractability.
The MO-UEHL distribution offers several advantages: it is defined on the unit interval , making it ideal for modeling proportional data; it contains neither exponential terms nor special functions, simplifying computational aspects; and it exhibits increased flexibility in capturing various data patterns, including positively skewed, reverse J-shaped, and unimodal configurations. The inclusion of the Marshall–Olkin tilt parameter provides additional shape flexibility beyond the original UEHL distribution, enabling better fit to diverse datasets.
We undertake a comprehensive study of the mathematical properties of the MO-UEHL distribution, deriving explicit expressions for its probability density function, cumulative distribution function, survival function, hazard rate function, and quantile function. Also, we investigate its moment properties and examine various reliability measures, including stress-strength reliability, inverse hazard rate, mean residual life, and information-theoretic measures such as the Shannon entropy and residual entropy.
For parameter estimation, we consider multiple classical methods, including maximum likelihood estimation, maximum product spacing, ordinary and weighted least-squares, and Cramér–von Mises estimation. We conduct extensive simulation studies to evaluate the performance of these estimators under various parameter configurations and sample sizes. The practical utility of the MO-UEHL distribution is demonstrated through applications in four real datasets from environmental and engineering contexts, where it is compared against several competing distributions using various goodness-of-fit criteria.
The remainder of the paper is organized as follows: Section 2 introduces the MO-UEHL distribution and derives its fundamental properties. Section 3 explores various reliability measures and information-theoretic properties. Section 4 discusses parameter estimation methods, while Section 5 presents the simulation results. Section 6 demonstrates real data applications, and finally, Section 7 provides the concluding remarks.
2. Description of the Model
Recently, Ref. [16] developed the UEHL distribution, grounded in the omega distribution and categorized within the proportional hazard rate model framework. The cumulative distribution function (CDF) of the UEHL distribution is defined as
with corresponding probability density function (PDF):
where and are the shape parameters. The UEHL distribution demonstrates multiple applications in reliability theory, leveraging the exponentiated half-logistic distribution [17,18].
In this section, the MO-UEHL distribution is introduced by integrating the CDF of the UEHL distribution into the Marshall–Olkin transformation framework. The survival function (SF) of the Marshall–Olkin family of distributions is defined as
where is the baseline CDF of a continuous distribution and denotes the SF of the baseline distribution. This approach can be used to leverage the transformation to enhance the adaptability of the baseline UEHL model. Applying the transformation to the CDF (1), the CDF of the MO-UEHL distribution can be expressed as follows:
where and are the shape parameters, and is the tilt parameter. A distinguishing feature of the MO-UEHL distribution is the explicit control exerted by the Marshall–Olkin tilt parameter over the symmetry properties of the density on the unit interval. When , the model coincides with the baseline UEHL distribution, which is generally right-skewed. As decreases towards 0, the density shifts progressively towards left-concentrated forms, while intermediate values of with proper and values yield nearly symmetric unimodal shapes. This smooth transition from pronounced asymmetry to near-symmetry arises directly from the Marshall–Olkin transformation, which introduces a tilt mechanism that systematically breaks or restores symmetry while preserving the bounded support. Consequently, the MO-UEHL family offers a flexible parametric framework for studying symmetry and symmetry-breaking phenomena in proportional data, rendering it especially suitable for research focused on asymmetry in statistical modeling.
The corresponding PDF of the MO-UEHL, derived from the Marshall–Olkin transformation, is given by
The SF and hazard rate function (HRF) of the MO-UEHL distribution are derived as
and
Figure 1 illustrates the PDF plots, CDF plots and HRF plots for various values of the distribution parameters. Specifically, the PDF of the MO-UEHL distribution represent positively skewed, reverse J-shaped, U-shaped, and unimodal configurations, making it a flexible model for fitting diverse data types.
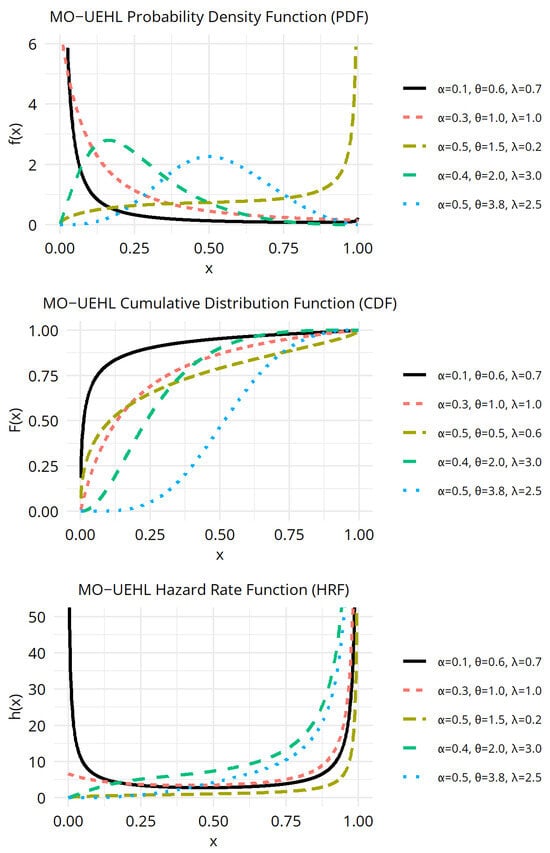
Figure 1.
PDF, CDF and HRF plots of the MO-UEHL distribution for various parameter values.
2.1. Quantile Function
The quantile function is a critical tool for generating random samples, computing critical values, and analyzing distributional properties in statistical modeling. For the MO-UEHL distribution, the quantile function is
Equation (6) facilitates the generation of random samples from the MO-UEHL distribution. It also enables the computation of key statistical measures, such as the median (when ) and other percentiles, which are essential for applications in reliability analysis and data modeling. The flexibility of the parameters , , and allows the quantile function of the MO-UEHL distribution to capture a wide range of distributional shapes within the unit interval .
To illustrate the behavior of the quantile function across different parameter settings, Table 1 presents numerical values for the quantiles , , , , , , and for the combinations of , , and .

Table 1.
Numerical values for the quantiles of the MO-UEHL distribution.
2.2. Moments
The moments of a distribution provide essential insights into its central tendency, dispersion, skewness, and kurtosis, which are crucial for statistical inference. For the MO-UEHL distribution, the r-th raw moment is defined as
where is the PDF given in (4). Based on Equation (2) the MO-UEHL PDF can be expressed using the PDF of the baseline UEHL distribution and SF as
By the binomial series, Equation (7) becomes
and the r-th moment of MO-UEHL is then
where with UEHL. The r-th moment of Y is given by
Applying the binomial series expansion, Equation (9) becomes
where is the beta function with , the gamma function. Finally, substituting the result from (10) back into the moment expression (8), the moments of the MO-UEHL distribution are obtained as
3. Reliability Analysis
The use of bounded-support distributions in reliability analysis is widespread in the literature, where proportional data are modeled to capture relative risk and performance metrics [19,20]. The MO-UEHL distribution enables a proportional interpretation of reliability concepts when applied to proportional data. The following subsections derive key reliability measures, such as stress-strength reliability, inverse hazard rate, and mean residual life, along with the Shannon and residual entropy as information-theoretic quantities.
3.1. Stress-Strength Reliability
The stress-strength reliability parameter, denoted as , is a key measure in reliability engineering, indicating the probability that a component with strength can withstand a stress . For the MO-UEHL distribution, we consider two independent random variables and , with PDF and CDF given by Equations (4) and (3), respectively. The reliability is expressed as
The PDF of the random variable is given by
and the CDF of the random variable evaluated at is
By substituting (12) and (13) to Equation (11), the stress-strength reliability becomes
where the integral is defined as
Applying Equation (15) to (14), the stress-strength reliability can be expressed as
3.2. Inverse Hazard Rate and Mean Residual Life
To further characterize the reliability properties of the MO-UEHL distribution, we derive the inverse hazard rate function (IHRF) and mean residual life (MRL). The IHRF is defined as , where is the PDF given by Equation (4) and is the CDF given by Equation (3). For the MO-UEHL distribution, the IHRF is
The function in Equation (16) quantifies the probability of immediate failure given survival up to time x, providing insights into the reliability dynamics of the MO-UEHL distribution for small time increments.
The MRL function represents the expected remaining lifetime of a component that has survived beyond time x. The function is defined as
where is the SF of the relevant distribution. To obtain the MRL function for the MO-UEHL distribution, we utilize the series expansion of the PDF of the form (12). Hence, the integral in Equation (17) becomes
Here, the integral term is evaluated as
where is the incomplete beta function and is the Gaussian hypergeometric function with . Thus, the MRL is
3.3. Information Measures
To analyze the uncertainty associated with the MO-UEHL distribution, we derive the Shannon entropy and residual entropy, providing insights into its information content.
The Shannon entropy, measuring the expected uncertainty, is defined as
where is the PDF given by Equation (4). Decomposing , we get
4. Estimation Methods
In this section, we explore various classical estimation techniques to estimate the parameters of the MO-UEHL distribution, namely, , , and . We investigate several methods, including maximum likelihood (ML), Anderson–Darling (AD), ordinary and weighted least-squares (OLS and WLS), and Cramér–von Mises (CVM), to provide a comprehensive framework for parameter estimation. Detailed derivations are provided to ensure clarity and applicability.
4.1. Maximum Likelihood Estimation
We estimate the MO-UEHL parameters using the maximum likelihood technique. Let be an observed sample of size n from the PDF given by Equation (4). The log-likelihood function is
The ML estimators are obtained by solving the partial differential equations with respect to , , and :
Due to the presence of nonlinear terms, Equations (20)–(22) have no explicit solutions. Numerical techniques, such as the Newton–Raphson algorithm, must be employed to determine the MLEs of the MO-UEHL parameters.
4.2. Maximum Product Spacing
In place of MLE for estimating the unknown parameters of continuous univariate distributions, the MPS approach is presented. Let be the order statistics of a random sample drawn from the MO-UEHL distribution. Subsequently, the uniform spacing is established by
where , , and . Hence, the following function is maximized with respect to , , and to obtain the MPS estimators (MPSEs) of the MO-UEHL.
It is also possible for assessing the MPSEs , , and of parameters , , and by solving the following nonlinear equation:
where
are the partial derivatives of the CDF of the MO-UEHL distribution and .
4.3. Ordinary and Weighted Least-Squares
4.4. Cramér–Von Mises
The CVM method minimizes the weighted sum of squared differences between the empirical distribution function and the theoretical CDF. The CVM estimators , , and are obtained by minimizing
or equivalently, by solving
These estimation methods provide an effective framework for fitting the MO-UEHL distribution to empirical data, with each method offering unique advantages in balancing computational efficiency and accuracy.
5. Numerical Simulation
This part evaluates the efficiency of different estimation approaches for determining the parameters of the MO-UEHL distribution. For the simulation study, random samples were produced using the MO-UEHL quantile function from Equation (6), with sample sizes of . The focus here is on examining the behavior of the estimators through five traditional methods: MLE, MPS, OLS, WLS, and CVM, as outlined in Section 4. The evaluation relies on key indicators such as average absolute bias (), mean squared error (MSE = ), standard deviation (SD), and mean absolute deviation (MAD = ), where denotes the parameter set, and represents the simulation repetitions. Three distinct parameter sets were selected for the MO-UEHL: , , and . These combinations allow for assessing estimator performance under varying shape and scale scenarios. For every set and sample size, 1000 samples were created via the quantile function in (6), followed by parameter estimation using the five techniques. The outcomes are compiled in Table 2 for , Table 3 for , and Table 4 for .
Table 2.
Simulation results for , , , .
Table 3.
Simulation results for , , , .
Table 4.
Simulation results for , , , .
In summary, MLE tends to deliver strong results across various scenarios, especially with larger samples (), showing reduced bias, MSE, MAD, and SD for most parameters. On the other hand, CVM estimators generally exhibited higher bias and MSE compared to MLE and MPS, particularly for larger values of . As the number of observations grows, accuracy measures improve markedly for all approaches, leading to more dependable outcomes, particularly where initial small-sample inaccuracies are pronounced. For bigger datasets, MLE aligns closely with WLS, providing solid performance alongside ease of computation. In practice, MLE and MPS are advisable for modest samples, where MLE shines in minimizing bias and MPS in achieving balanced error reduction (MSE). For large data, MLE achieves the lowest AIC. These observations emphasize how data volume and parameter scale critically affect estimator selection, positioning MLE and MPS as dependable options in diverse conditions.
Ordering the techniques by MSE sheds more light on their efficacy. For the combination in Table 2, MLE and MPS frequently lead for and , with MPS performing well in small samples () and MLE taking precedence in large ones (). OLS and CVM typically fall behind, especially regarding . In the case of in Table 3, MLE, MPS, and WLS dominate, with MPS excelling in small data and MLE prevailing in large data; OLS tends to rank at the bottom. For in Table 4, MLE and MPS yield optimal results in bigger samples, while MPS holds its ground in smaller ones, and OLS exhibits the least favorable outcomes, particularly for . In general, MLE and MPS prove most consistent across configurations, with MPS advantageous for restricted data and OLS regularly lagging.
Furthermore, the visual depictions of the simulation data in Figure 2, Figure 3 and Figure 4 effectively back the tabulated insights for the parameter groups , , and , respectively. These visuals effectively reinforce the findings presented in the tables, illustrating the trends of estimators for , , and across varying sample sizes.
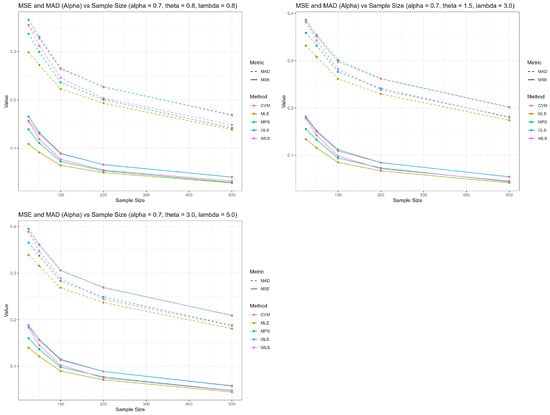
Figure 2.
MSE and MAD for across sample sizes.
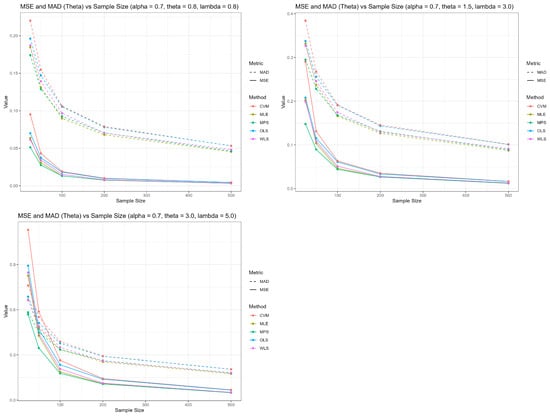
Figure 3.
MSE and MAD for across sample sizes.
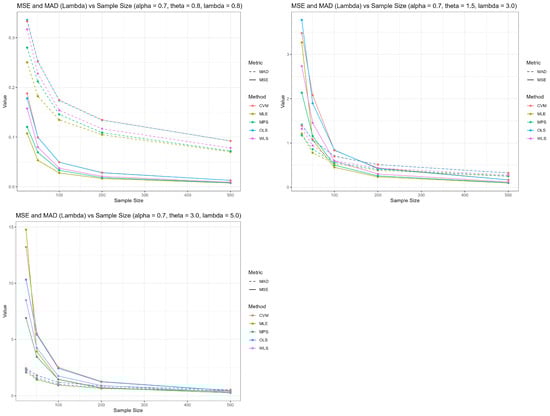
Figure 4.
MSE and MAD for across sample sizes.
6. Real Data Applications
To demonstrate the empirical applicability of the MO-UEHL distribution, we apply it to two real datasets from health and education contexts. These datasets consist of naturally bounded proportions in the unit interval (0, 1), aligning with the model’s design for modeling rates and proportions. The MO-UEHL is compared with several competing distributions, including the MO-Exponential, MO-Kumaraswamy, MO-Weibull, MO-Frechet, Kumaraswamy, and Weibull distributions, using goodness-of-fit measures such as AIC, AICc, BIC, HQIC, Anderson–Darling statistic ( with p-value ), and Kolmogorov–Smirnov statistic (KS with p-value KS).
6.1. COVID-19 Mortality Rate Dataset
The first dataset represents daily mortality rates (proportion of deaths relative to cumulative cases) for COVID-19 in the United Kingdom over 82 days, from 1 May to 16 July 2021 [21]. The data are: 0.0023, 0.0023, 0.0023, 0.0046, 0.0065, 0.0067, 0.0069, 0.0069, 0.0091, 0.0093, 0.0093, 0.0093, 0.0111, 0.0115, 0.0116, 0.0116, 0.0119, 0.0133, 0.0136, 0.0138, 0.0138, 0.0159, 0.0161, 0.0162, 0.0162, 0.0162, 0.0163, 0.0180, 0.0187, 0.0202, 0.0207, 0.0208, 0.0225, 0.0230, 0.0230, 0.0239, 0.0245, 0.0251, 0.0255, 0.0255, 0.0271, 0.0275, 0.0295, 0.0297, 0.0300, 0.0302, 0.0312, 0.0314, 0.0326, 0.0346, 0.0349, 0.0350, 0.0355, 0.0379, 0.0384, 0.0394, 0.0394, 0.0412, 0.0419, 0.0425, 0.0461, 0.0464, 0.0468, 0.0471, 0.0495, 0.0501, 0.0521, 0.0571, 0.0588, 0.0597, 0.0628, 0.0679, 0.0685, 0.0715, 0.0766, 0.0780, 0.0942, 0.0960, 0.0988, 0.1223, 0.1343, 0.1781. Table 5 summarizes the descriptive statistics for this dataset, indicating a positively skewed distribution with a mean of 0.0357 and kurtosis of 4.9781.
Table 5.
Descriptive statistics of the COVID-19 mortality rate dataset.
Table 6 presents the goodness-of-fit results. The MLE estimates are , , and . Table 6 shows that the MO-UEHL distribution outperforms with the lowest AIC of −387.15, supported by the highest p-values for (0.9998) and KS (0.9976), demonstrating a superior fit to the data. In contrast, Table 6 indicates that MO-Weibull has a high value of 14.50 and very low p-values (, KS), pointing to a poor fit. Kumaraswamy, with an AIC of −384.67 and lower p-values (0.7828 for , 0.9321 for KS), also falls short compared to MO-UEHL.
Table 6.
Goodness-of-fit results for the COVID-19 mortality rate dataset.
6.2. Reading Accuracy Scores Dataset
The second dataset consists of reading accuracy scores for 44 elementary school students, representing the proportion of words read correctly in a short story [22,23]. The data are naturally bounded in (0, 1) as they measure accuracy proportions. Table 7 summarizes the descriptive statistics for this dataset, indicating a nearly symmetric distribution with a mean of 0.7728 and negative kurtosis of −1.6278.
Table 7.
Descriptive statistics of the reading accuracy score dataset.
Table 8 presents the goodness-of-fit results. The MLE estimates are , , and . Table 8 shows that the MO-UEHL distribution achieves a competitive fit with an AIC of −53.35, supported by p-values for (0.0672) and KS (0.0492). While MO-Kumaraswamy has a slightly higher AIC of −50.61, MO-UEHL outperforms models like MO-Exponential (AIC 69.31, low p-values) and Weibull (AIC −23.94, low p-values), indicating better alignment with the data for this proportion-based dataset.
Table 8.
Goodness-of-fit results for the reading accuracy score dataset.
Figure 5 presents density plots with histograms comparing the performance of the proposed MO-UEHL distribution against several competing models. The findings depicted in Figure 5 effectively support the results from the real data analysis, confirming the superior fit of the MO-UEHL distribution across the analyzed datasets.
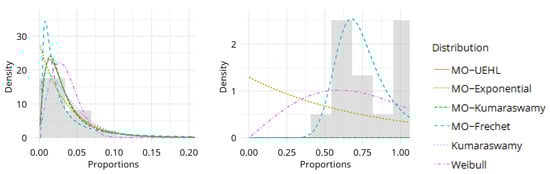
Figure 5.
Density plots and histograms of fitted distributions for real datasets.
To visually assess the goodness-of-fit of the MO-UEHL distribution, Figure 6 presents QQ plots for the two real datasets. In each panel, empirical quantiles are plotted against theoretical quantiles computed from the fitted MO-UEHL model using MLE estimates. The plots indicate a good fit for both datasets, with only minor deviations in the tails, which validates the MO-UEHL model’s alignment with the data.
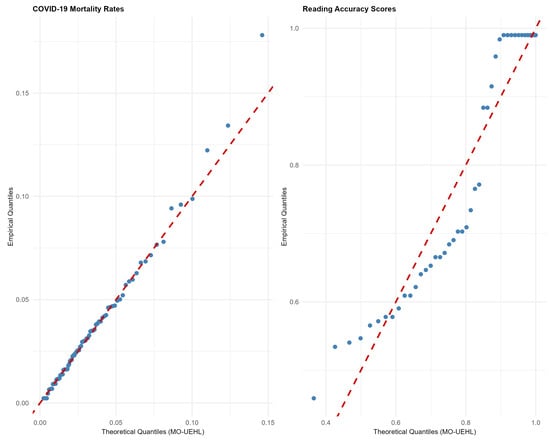
Figure 6.
QQ plots of the fitted MO-UEHL distribution against empirical quantiles for the two real datasets (blue dots: empirical quantiles; red dashed line: theoretical quantiles).
Across both datasets, the MO-UEHL distribution consistently achieves the best or a highly competitive fit, as evidenced by the lowest AIC, AICc, BIC, and HQIC values, alongside high and KS values, confirming its strong alignment with proportion-based data distributions. The adaptability of the MO-UEHL’s three parameters (, , ) enables it to model a wide range of distributional shapes effectively, making it a valuable tool for health modeling, educational analysis, and other fields requiring precise unit interval data modeling.
7. Conclusions
This study has introduced the MO-UEHL distribution, a novel extension of the UEHL distribution through the application of the Marshall–Olkin transformation. The proposed three-parameter model, defined on the unit interval (0, 1), offers enhanced flexibility in capturing a wide range of distributional shapes, including positively skewed, reverse J-shaped, and unimodal patterns, making it an effective tool for modeling proportional data in reliability and survival analysis. The comprehensive derivation of its mathematical properties—such as the PDF, CDF, SF, HRF, quantile function, moments, and information-theoretic measures like the Shannon and residual entropy—provides a solid theoretical foundation. Parameter estimation methods, including MLE and MPS, were evaluated through extensive simulation studies, revealing that MLE and MPS outperform other techniques, particularly for larger sample sizes, while offering computational efficiency.
The practical applicability of the MO-UEHL distribution was validated through its superior performance across four real datasets from environmental and engineering domains, as evidenced by lower AIC, BIC, and HQIC values, alongside high Anderson–Darling and Kolmogorov–Smirnov p-values compared to competing models. These results underscore the model’s ability to handle datasets with significant skewness, establishing it as a useful contribution in fields requiring precise unit interval data modeling.
The findings of this research demonstrate the MO-UEHL distribution’s utility for contributing to statistical modeling, providing a reliable framework for future applications in reliability engineering and related disciplines.
Funding
This research received no external funding.
Data Availability Statement
The four real datasets analyzed in this study are available within the article (Section 6 and the corresponding tables). All datasets are either publicly available in the cited references or are widely used benchmark datasets in the statistical literature. Numerical simulations can be fully reproduced using the explicit formulas provided in Section 2, Section 3, Section 4, Section 5 and Section 6.
Acknowledgments
The author thanks the Editor and the anonymous reviewers for their constructive comments that significantly improved the manuscript.
Conflicts of Interest
The author declares no conflicts of interest.
References
- Lai, C.D. Generalized Weibull Distributions; Springer: Berlin/Heidelberg, Germany, 2013. [Google Scholar]
- Xie, M.; Tang, Y.; Goh, T.N. A modified Weibull extension with bathtub-shaped failure rate function. Reliab. Eng. Syst. Saf. 2002, 76, 279–285. [Google Scholar] [CrossRef]
- Wang, F.K. A new model with bathtub-shaped failure rate using an additive Burr XII distribution. Reliab. Eng. Syst. Saf. 2000, 70, 305–312. [Google Scholar] [CrossRef]
- Marshall, A.W.; Olkin, I. A new method for adding a parameter to a family of distributions with application to the exponential and Weibull families. Biometrika 1997, 84, 641–652. [Google Scholar] [CrossRef]
- Marshall, A.W.; Olkin, I. A multivariate exponential distribution. J. Am. Stat. Assoc. 1967, 62, 30–44. [Google Scholar] [CrossRef]
- Ghitany, M.E. Marshall-Olkin extended Pareto distribution and its application. Int. J. Appl. Math. 2005, 18, 17–32. [Google Scholar]
- Ristić, M.M.; Jose, K.K.; Ancy, J. A Marshall-Olkin gamma distribution and minification process. Stress Anxiety Res. Soc. 2007, 11, 107–117. [Google Scholar]
- Ghitany, M.E.; Al-Awadhi, F.A.; Alkhalfan, L.A. Marshall-Olkin extended Lomax distribution and its application to censored data. Commun. Stat. Theory Methods 2007, 36, 1855–1866. [Google Scholar] [CrossRef]
- Ghitany, M.E.; Kotz, S. Reliability properties of extended linear failure-rate distributions. Probab. Eng. Inf. Sci. 2007, 21, 441–450. [Google Scholar] [CrossRef]
- Zhang, T.; Xie, M. Failure data analysis with extended Weibull distribution. Commun. Stat. Simul. Comput. 2007, 36, 579–592. [Google Scholar] [CrossRef]
- Cordeiro, G.M.; Lemonte, A.J. On the Marshall-Olkin extended Weibull distribution. Stat. Pap. 2012, 54, 333–353. [Google Scholar] [CrossRef]
- Mudholkar, G.S.; Srivastava, D.K. Exponentiated Weibull family for analyzing bathtub failure-rate data. IEEE Trans. Reliab. 1993, 42, 299–302. [Google Scholar] [CrossRef]
- Cordeiro, G.M.; Ortega, E.M.M.; Nadarajah, S. The Kumaraswamy Weibull distribution with application to failure data. J. Frankl. Inst. 2010, 347, 1399–1429. [Google Scholar] [CrossRef]
- Silva, G.O.; Ortega, E.M.M.; Cordeiro, G.M. The beta modified Weibull distribution. Lifetime Data Anal. 2010, 16, 409–430. [Google Scholar] [CrossRef] [PubMed]
- Dombi, J.; Jonas, T.; Toth, E.Z.; Arva, G. The omega probability distribution and its applications in reliability theory. Qual. Reliab. Eng. 2019, 35, 600–626. [Google Scholar] [CrossRef]
- Özbilen, Ö.; Genç, A.İ. A bivariate extension of the Omega distribution for two-dimensional proportional data. Math. Slovaca 2022, 72, 1605–1622. [Google Scholar] [CrossRef]
- Kang, S.B.; Seo, J.I. Estimation in an exponentiated half logistic distribution under progressively Type-2 censoring. Commun. Stat. Appl. Methods 2011, 18, 657–666. [Google Scholar] [CrossRef]
- Rastogi, M.K.; Tripathi, Y.M. Parameter and reliability estimation for an exponentiated half logistic distribution under progressive type II censoring. J. Stat. Comput. Simul. 2014, 84, 1711–1727. [Google Scholar] [CrossRef]
- Al-Omari, A.I.; Alanzi, A.R.; Alshqaq, S.S. The unit two parameters Mirra distribution: Reliability analysis, properties, estimation and applications. Alex. Eng. J. 2024, 92, 238–253. [Google Scholar] [CrossRef]
- Alzahrani, M.R.; Almohaimeed, M. Analysis, inference, and application of Unit Haq distribution to engineering data. Alex. Eng. J. 2025, 117, 193–204. [Google Scholar] [CrossRef]
- Abu El Azm, W.S.; Almetwally, E.M.; Naji AL-Aziz, S.; El-Bagoury, A.A.A.H.; Alharbi, R.; Abo-Kasem, O. A New Transmuted Generalized Lomax Distribution: Properties and Applications to COVID-19 Data. Comput. Intell. Neurosci. 2021, 2021, 5918511. [Google Scholar] [CrossRef]
- Pammer, K.; Kevan, A. The contribution of visual sensitivity, phonological processing, and nonverbal IQ to children’s reading. Sci. Stud. Read. 2007, 11, 33–53. [Google Scholar] [CrossRef]
- Smithson, M.; Verkuilen, J. A better lemon squeezer? Maximum-likelihood regress with beta-distributed dependent variables. Psychol. Methods 2006, 11, 54. [Google Scholar] [CrossRef] [PubMed]
Disclaimer/Publisher’s Note: The statements, opinions and data contained in all publications are solely those of the individual author(s) and contributor(s) and not of MDPI and/or the editor(s). MDPI and/or the editor(s) disclaim responsibility for any injury to people or property resulting from any ideas, methods, instructions or products referred to in the content. |
© 2025 by the author. Licensee MDPI, Basel, Switzerland. This article is an open access article distributed under the terms and conditions of the Creative Commons Attribution (CC BY) license (https://creativecommons.org/licenses/by/4.0/).