Abstract
The modernization of compressed air systems represents both a strategic challenge and an opportunity to achieve a balanced symmetry, understood as the equilibrium among energy efficiency, industrial optimization, and operational sustainability. This study combines the experimental validation of a centralized compressed air system operating under real industrial conditions with a bibliometric analysis that contextualizes the work within global research trends in energy efficiency and industrial optimization. The system, implemented at the Oleohidráulica Company in Cienfuegos, Cuba, consists of two BOGE C 22-2 screw compressors and a newly upgraded distribution network. The analysis involved calculating pressure drops using the methodology proposed by Atlas Copco and verifying the results in situ through measurements at the most distant point of the network. The obtained pressure drop of 0.059 bar, below the international threshold of 0.1 bar, confirms the adequacy and reliability of the design. Moreover, the discussion highlights future perspectives for improvement, where integrating a hybrid approach that combines computational fluid dynamics (CFD) simulations with experimental validation could enhance the accuracy of flow and pressure predictions and facilitate the optimization of the pipeline network design. Overall, the study demonstrates that while the current system complies with international standards, achieving symmetry as an operational balance among efficiency, reliability, and sustainability remains an ongoing process, guiding future optimization efforts.
1. Introduction
The modernization of compressed air systems is a critical requirement in industrial facilities, particularly when existing networks exhibit persistent leakages and operate under variable production loads [,,]. Despite their widespread application as a reliable source of pneumatic energy, rotary screw compressors are frequently characterized by low energy efficiency, especially when operated at partial loads or under poor maintenance conditions [,,]. Addressing these inefficiencies requires achieving a symmetry between installed capacity and actual demand, ensuring a balance that minimizes energy losses, reduces operational costs, and extends component lifetime [,].
Numerous studies have investigated the performance of compressed air systems, focusing on the influence of factors such as operating pressure, volumetric flow rate, distribution losses, and motor efficiency [,,]. Research highlights that inefficiencies can arise both from the mechanical compression process and from electrical consumption at the drive motor. Moreover, unaccounted reactive power can affect the overall power factor, leading to economic penalties or unnecessary transformer losses [,,].
A typical industrial compressed air system consists of compressor units, auxiliary equipment (dryers, filters, and condensate drains), a distribution pipeline network, and multiple end-use machines [,,]. The global efficiency of such systems depends not only on the compressor’s thermodynamic performance but also on distribution network design, leakage control, and system integration [,,]. In particular, maintaining low pressure drops across pipelines and minimizing idle compressor operation are decisive for reducing energy waste and securing sustainable operation [,,].
In recent years, several industrial studies have demonstrated concrete advances in the optimization and digital monitoring of compressed air systems. For example, [] report the implementation of a centralized master control system that integrates real-time monitoring to optimize energy efficiency in compressed air stations. Similarly, a case study in the pharmaceutical industry documented in 2024 shows a 23% reduction in electricity consumption through pressure adjustments, leak detection, and compressor performance optimization []. In the field of digital monitoring, a project at a petrochemical plant uses the APM 360™ platform to monitor industrial compressors through predictive analytics, improving operational availability and enabling more informed maintenance decisions [].
Within this context, the José Gregorio Martínez Oleohydraulic Company, located in Cienfuegos, Cuba, undertook a major modernization effort by installing a new centralized compressed air system. The installation included two BOGE C 22-2 (The BOGE C 22-2 equipment was manufactured by BOGE Kompressoren Otto Boge GmbH & Co. KG (Bielefeld, Germany)) rotary screw compressors, along with auxiliary components such as dryers, aftercoolers, condensate drains, and a fully renewed distribution pipeline with valves, tees, elbows, and branches. This upgrade replaced a deteriorated system with over twenty-five years of operation, characterized by recurrent leakages and poor efficiency, aiming to reduce energy consumption and enhance production reliability.
This study aims to evaluate the technical and energetic performance of a newly installed centralized compressed air system operating under real industrial conditions. The main objectives are to (i) calculate and experimentally validate the pressure drop across the distribution network, (ii) verify the efficiency and reliability of the pipeline design in accordance with international standards, and (iii) identify potential improvements through advanced methodologies such as computational modeling and intelligent control strategies. The research contributes to the literature by integrating empirical validation with a bibliometric analysis to highlight existing research gaps and propose a framework for achieving symmetry between energy efficiency, industrial optimization, and operational sustainability.
The main contributions of this work are as follows:
- A comprehensive experimental validation of a modernized centralized compressed air system operating under real industrial conditions, contributing empirical evidence to the limited body of research on energy efficiency in pneumatic networks.
- The integration of a bibliometric analysis that situates the study within global research trends, providing a novel framework that links experimental findings with the broader scientific landscape of industrial optimization and sustainability.
- A discussion of improvement strategies that includes the proposal of a hybrid empirical computational approach, where combining CFD simulations with experimental validation could enhance predictive accuracy and support pipeline network optimization.
- The introduction of the symmetry concept as a theoretical construct to represent the operational balance among energy efficiency, reliability, and sustainability, offering a new interpretative lens for evaluating industrial systems.
This paper is organized as follows: Section 1, Introduction, provides the background and motivation for modernizing compressed air systems in industrial environments. Section 2, Materials and Methods, describes the system configuration, measurement setup, and pressure drop calculation models. Section 3, Results, presents the experimental findings and their comparison with normative requirements. Section 4, Discussion, interprets the results in terms of energy efficiency and industrial best practices. Finally, Section 5, Conclusions, summarizes the key insights and recommendations for future optimization.
2. Materials and Methods
The calculation of pressure drops in the compressed air distribution network was carried out following the methodology proposed by Atlas Copco []. This approach provides standardized guidelines for estimating pressure losses across pipelines, fittings, and accessories under different operating conditions.
To validate the theoretical results, a manometer was installed at the farthest air consumption point from the compressor. This measurement allowed a direct comparison between calculated values and actual operating conditions, ensuring the accuracy and reliability of the pressure drop assessment.
The Scopus query was structured to identify documents containing the term “compressor” in combination with “air compressor*” or “motor*”, and referencing key concepts such as “efficiency”, “optimization”, or “system compressor”. These criteria aimed to focus the search on research related to the performance and optimization of compressor systems, where pressure losses, energy efficiency, and motor integration play a critical role in industrial operation.
To ensure thematic relevance, the search was limited to publications between 2020 and 2025 while excluding document types not directly associated with applied scientific research, such as conference papers, book chapters, reviews, and technical reports. Additionally, keywords associated with adjacent but unrelated fields were systematically excluded, including fuel cells, hydrogen, Brayton cycles, cooling, mass transfer, and waste heat utilization. This refinement ensured that the retrieved results were strictly concentrated on studies analyzing the technical and efficiency aspects of compressors and their motors within industrial applications.
The search string used was Listing 1.
The bibliometric analysis carried out with VOSviewer (1.6.20) reveals a consolidated thematic structure around compressor systems, electric motors and energy efficiency, shown in Figure 1. In the bibliometric network map (Figure 1a), clusters of terms reflect the main research lines. Among them, compressed air, energy efficiency, optimization, induction motors, and gas turbines emerge as central nodes with high co-occurrence. The interconnection of these terms highlights the cross-cutting relevance of compressors in various industrial applications, ranging from refrigeration and energy storage to electric traction and pumping systems. The presence of keywords such as machine design, aerodynamics, and performance confirms the growing interest in integrating mechanical design with energy optimization approaches.
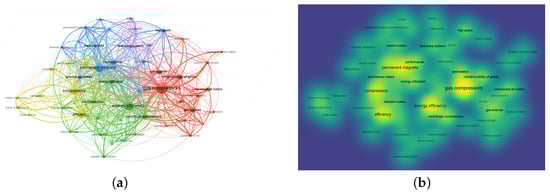
Figure 1.
Bibliometric analysis networks and density map. (a) Bibliometric network for the analysis of articles. (b) Bibliometric density for the analysis of articles on engines and air compressors.
| Listing 1. Scopus search string used. |
 |
The density map (Figure 1b) complements this analysis by visually emphasizing the areas with the highest research concentration. The densest regions correspond to the terms compressors, energy efficiency, optimization, and induction motors, reflecting not only their frequency of occurrence but also their central role in the literature. In contrast, other terms such as centrifugation, domestic appliances, or traction motors appear in less intense regions, indicating a more secondary or specialized interest. This distinction between dense cores and peripheral areas suggests that the scientific community has consolidated both theoretical and applied knowledge around the efficiency and performance of compressor and motor systems, while emerging fields remain in exploratory stages.
Taken together, both representations indicate that current research on compressors and related systems is primarily focused on energy efficiency, process optimization, and integration with electric motors, while areas such as applied aerodynamics, the use of specific gases, and hybrid technologies represent future opportunities for expansion. The complementarity between the network analysis and the density map reinforces the validity of these findings, providing a comprehensive overview of the evolution and direction of research in the field.
The bibliometric maps presented above reveal that research on compressor systems has predominantly focused on theoretical optimization, simulation models, and motor efficiency analysis, with comparatively fewer studies addressing large-scale experimental validation in real industrial settings. This finding underscores a clear research gap that motivated the methodological approach of the present work, which centers on the experimental validation of pressure losses in a real compressed air network. By connecting the bibliometric insights with the experimental design, the study reinforces the need to translate theoretical advances into practical, measurable improvements in industrial energy efficiency.
Description of the System Under Study
The centralized compressed air system consists of two (2) BOGE C 22-2 series compressors. The installation is complemented by auxiliary components, including dehumidifiers, aftercoolers, condensate drains, dryers, and a distribution network equipped with valves, joints, elbows, T-branches, and other elements required for efficient operation. The compressed air system at the Cienfuegos Oil and Gas Company has two compressors. The compressors are BOGE screw compressors with oil injection and air aftercooling [,] (Table 1).

Table 1.
Technical data of the BOGE C 22-2 air compressors.
3. Results
3.1. Pressure Drop Calculation Equation
In general, the pressure obtained immediately after the compressor decreases significantly, since the distribution of compressed air generates losses, mainly due to friction in the pipes and the presence of fittings. In valves, fittings, and elbows, throttling effects and flow direction changes occur. These losses are transformed into heat and result in a pressure drop which, for a straight pipe, can be calculated with Equation (1), provided by [,].
- —Pressure drop (bar).
- —Compressed air flow rate (l/s).
- l—Length of the straight section to be calculated (m).
- d—Internal diameter (mm).
- p—System pressure (bar).
The determining terms in Equation (1) are the compressed air flow rate () distributed through the straight section of length (l) in meters, since the system includes eleven (11) compressed air consumers distributed throughout the network, and the pipe diameters, as the system comprises four different diameters along its entire length. The compressed air pressure within the piping system is 5.2 bar [].
According to Atlas Copco, to accurately determine pressure drops in the pipeline network, it is necessary to know the exact lengths of the pipes and every fitting installed in the system []. Figure 2 shows a scaled schematic of the compressed air system modeled in Autodesk Inventor Professional 2017 [].
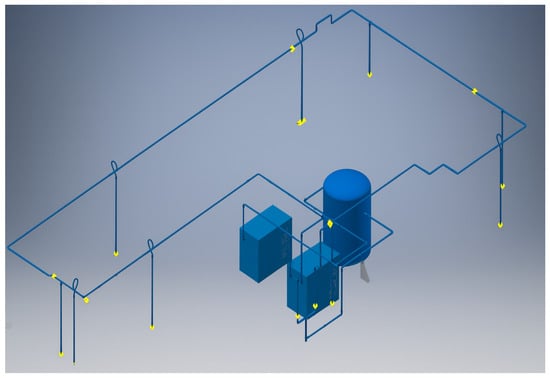
Figure 2.
Schematic diagram of the compressed air system.
The straight pipe sections shown in Table 2 were obtained from an interview with the engineer responsible for the design and installation of the distribution network []. These values serve as a reference for characterizing the system dimensions; however, for the calculation of pressure drops it was also necessary to consider the installed fittings and the compressed air flow circulating through each section. In this sense, relying exclusively on the total lengths reported in Table 2 would lead to inaccurate results, since the airflow is not constant throughout the system and the pipe diameters vary along the network.
Table 2.
Straight pipe lengths by diameter.
For the estimation of pressure drops, the scenario assumed that all compressed air consumers in the factory were operating simultaneously. Table 3 lists the consumer equipment and their respective flow values, as provided by M. Sc. Antonio Díaz, the plant’s energy specialist [].
Table 3.
Air flow consumption by equipment in the factory.
3.2. Calculation Methodology
The calculation of pressure drops was carried out using an equation and a table proposed by Atlas Copco in its compressed air manual []. Equation (1) and the table shown in the Figure 3 constitute the aforementioned methodology.
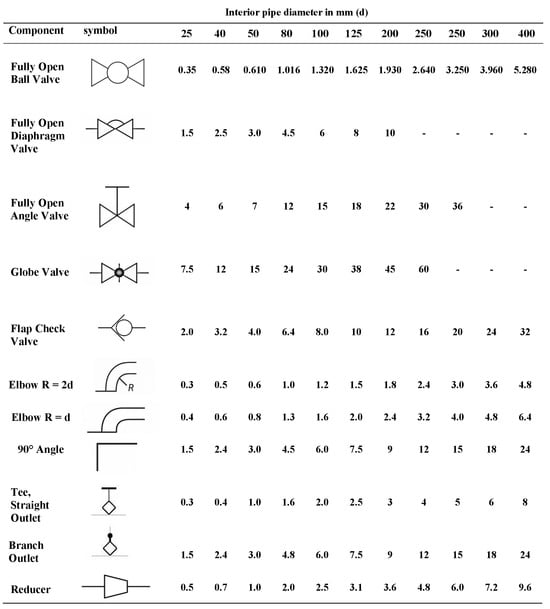
Figure 3.
Some fittings and their influence on pressure losses in pipes of different diameters. The losses are recalculated considering the corresponding equivalent pipe length (m) [].
The exact measurements of the compressed air system and all its corresponding accessories were obtained. The system includes pipes of four (4) different diameters: 50 × 46 mm, 40 × 37 mm, 32 × 29 mm, and 25 × 22 mm. The first number corresponds to the outside diameter, while the second corresponds to the inside diameter.
To determine the total length of the system, the total number of accessories for each section of pipe with different diameters was counted. Using the information provided in Figure 3, the equivalent length of each accessory in the pipe sections was calculated. Table 4, Table 5, Table 6 and Table 7 show these accessories by pipe section with their respective lengths.
Table 4.
Equivalent length of fittings for the 50 × 46 mm pipe section.
Table 5.
Equivalent length of fittings for the 40 × 37 mm pipe section.
Table 6.
Equivalent length of fittings for the 32 × 29 mm pipe section.
Table 7.
Equivalent length of fittings for the 25 × 22 mm pipe section.
Knowing the total length of the four (4) different sections, including the length of the pipes and the equivalent lengths, the calculation of pressure drops was performed. Table 2 shows the lengths of the system by section.
The consumers listed in Table 5, along with their respective compressed air consumptions, are distributed throughout the factory. The system branches out at the outlet of the compressor room, thus supplying the entire plant. It was assumed that the air was divided in such a way that it reached each consumer through the shortest possible path.
It was further considered that the consumers shown in Table 5 were operating simultaneously. The calculation based on Equation (1) was carried out by following both branches up to the farthest point of the factory. Whenever there was a change in pipe diameter or a reduction in flow due to air being drawn off by a consumer, the calculation was repeated for the corresponding pipe length. The results obtained are presented in Table 8 and Table 9.
3.3. Principles of Compressible Fluid Flow in Pipes
The accurate estimation of pressure losses in compressible fluid transport through pipelines requires a detailed understanding of the relationship between pressure and specific volume, which is often difficult to determine in practice. For this reason, two limiting cases are generally considered: adiabatic flowand isothermal flow [,].
The pressure drop is typically expressed using the Darcy–Weisbach equation (Equation (2)):
where is the pressure drop (Pa), is the fluid density (), f is the Darcy friction factor, V is the mean flow velocity (m/s), D is the internal pipe diameter (m), and L is the pipe length (m). This formulation is valid for laminar and turbulent flow of liquids and, under specific restrictions, may also be applied to gases and vapors.
The Darcy friction factor must be determined experimentally. For laminar flow (), it depends only on the Reynolds number, whereas for turbulent flow () it is also influenced by the pipe wall roughness.
In gases, density varies significantly with pressure, meaning that when the pressure drop is considerable, both density and velocity change notably. Accordingly, three practical criteria are used when applying Darcy’s equation to compressible fluids:
- For , the specific volume at either the inlet or outlet may be used.
- For , the mean specific volume between inlet and outlet conditions should be applied.
- For larger pressure drops, typical of long pipelines, alternative formulations are required.
Adiabatic flow is assumed in short, well-insulated pipelines, where no heat transfer occurs with the surroundings other than frictional heating. Conversely, isothermal flow represents a more realistic condition for long pipelines, such as in natural gas distribution networks []. In these cases, pressure drops often exceed the validity range of Darcy’s equation, and the fully isothermal model (Equation (3)) is employed:
where w is the mass flow rate (kg/s), A is the pipe cross-sectional area (), g is the gravitational acceleration (), is the specific volume (/kg), and , are the absolute inlet and outlet pressures (Pa), respectively.
This formulation is derived under restrictive assumptions: isothermal flow, no external mechanical work, steady flow velocity, ideal gas behavior, constant friction factor, and a straight, horizontal pipe.
Given the complexity of applying Darcy’s method for compressible fluids in real operating conditions, practical calculation methods provided by compressor manufacturers (e.g., Atlas Copco, Kaeser) are often preferred. In this study, theoretical predictions were validated experimentally by measuring pressure with a manometer at the point furthest from the compressor outlet, confirming the consistency of the results.
3.4. Features of the Piping System
The compressed air distribution system is composed of pipes with four different diameters: 50 × 46 mm, 40 × 37 mm, 32 × 29 mm, and 25 × 22 mm. The first dimension corresponds to the external diameter, while the second refers to the internal diameter of each pipe. The entire network extends to an approximate total length of 430 m.
According to the proposed calculation method, the losses generated by fittings are replaced by equivalent losses expressed as straight pipe sections, depending on the resistance that each component imposes on the flow. Atlas Copco, in its compressed air manual, provides reference tables with the corresponding equivalent values for each type of fitting [,].
3.5. Operating Principle of the Compressor
The compression stage in screw compressors is based on the principle of positive displacement. Inside the housing, two rotors are located—the main rotor, driven by an electric motor, and the secondary rotor—which rotate synchronously within the system [].
Both elements feature helical profiles that interlock precisely, forming compression chambers defined by the walls of the casing. As the rotors turn, these chambers move in the direction of the airflow and progressively decrease in volume, thereby producing a gradual increase in pressure until the required discharge level is reached. During this process, oil is continuously injected into the compression stage, serving multiple purposes: providing cooling, ensuring sealing between the chambers, and reducing friction through lubrication. This mechanism guarantees both thermal stability and the operational efficiency of the compressor [].
Figure 4 schematically illustrates the operating principle of the BOGE compressor, showing the stages from the initial suction to the final compressed air discharge. The compression process can be broken down into the following main stages and components:
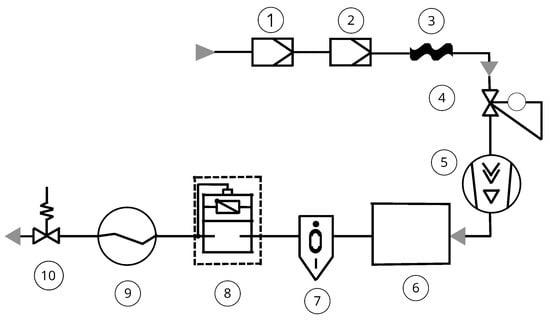
Figure 4.
Operating diagram of the BOGE compressor [].
- Filtering elements: Located at the air intake, these elements retain coarse particles from the ambient air, ensuring an initial cleaning stage.
- Suction filter: This component provides additional purification of the air before entering the compression stage, removing fine impurities that could affect system efficiency.
- Suction hose: Connects the suction filter with the intake regulator, enabling the transport of aspirated air to the compression chamber.
- Intake regulator: Controls the admission of air into the compressor by opening during load operation and closing during idle or shutdown, regardless of the operating state.
- Compression stage: The core of the process, where the aspirated air is gradually compressed until reaching the required discharge pressure.
- Oil and compressed air tank: In this tank, the injected oil is separated from the compressed air mainly by gravitational force.
- Oil separator: Completes the final separation of residual oil contained in the compressed air, improving the quality of the discharged flow.
- Minimum pressure retention valve: This valve opens when the system pressure reaches 3.5 bar, allowing rapid pressure build-up and ensuring lubrication during start-up. After shutdown, it prevents the return of compressed air from the network back into the compressor.
- Aftercooler (air- or water-cooled): Reduces the temperature of the compressed air, causing condensation of the water vapor contained within and improving system stability.
- Spring-loaded check valve: allows air to flow in one direction only, preventing backflow and protecting the compressor system.
3.6. Pressure Drop Results
According to the methodology proposed by Atlas Copco, Table 8 presents the permissible pressure drop values for a compressed air system [,]. Table 9 shows the results obtained from the calculation of pressure drops in the different pipe sections of the evaluated installation.
Table 8.
Permissible pressure drop values according to Atlas Copco.
Table 8.
Permissible pressure drop values according to Atlas Copco.
| System | Pressure Drop | Units |
|---|---|---|
| Service pipes | 0.03 | bar |
| Distribution pipes | 0.05 | bar |
| Vertical pipes | 0.02 | bar |
| Total drop in fixed installations | 0.10 | bar |
Table 9.
Calculated pressure drops by pipe diameter.
Table 9.
Calculated pressure drops by pipe diameter.
| Diameter (mm) | Pressure Drop (bar) | Pipe Type |
|---|---|---|
| 50 × 46 | 0.0057 | Distribution |
| 40 × 37 | 0.0061 | Distribution |
| Subtotal | 0.012 | |
| 32 × 29 | 0.018 | Service |
| 25 × 22 | 0.025 | Service |
| Subtotal | 0.043 | |
| All diameters | 0.0046 | Vertical pipes |
| Total Pressure Drop | 0.059 |
For the experimental verification, a manometer with a measurement scale in kg/cm2 was used. The device was connected at the farthest point of the factory’s network, corresponding to the nozzle of the paint spray gun, as shown in Figure 5a. The test was conducted with the machining center and the paint spray gun operating simultaneously. The compressor pressure ranged between 5.1 and 5.2 bar. Figure 5b shows the manometer connected and the measurement obtained from the test described above.
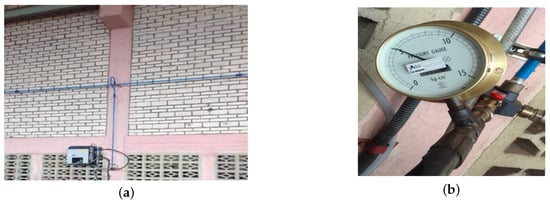
Figure 5.
Pressure gauge connected to the measurement obtained from the test performed previously described; (a) Pressure gauge connection point, and (b) Actual pressure measurement at the furthest point from the factory.
3.7. Verification of Pipe Diameters
The results obtained highlight the importance of calculating pressure losses in each pipe section. For this purpose, it is also necessary to consider specific components and closing devices within the network. Therefore, it is not sufficient to only include the length of straight conduits in the formulas or calculation tables; rather, the effective length must be determined by accounting for their flow capacity []. The pipe diameter can be determined using standard design diagrams, such as the one shown in Figure 6 [].
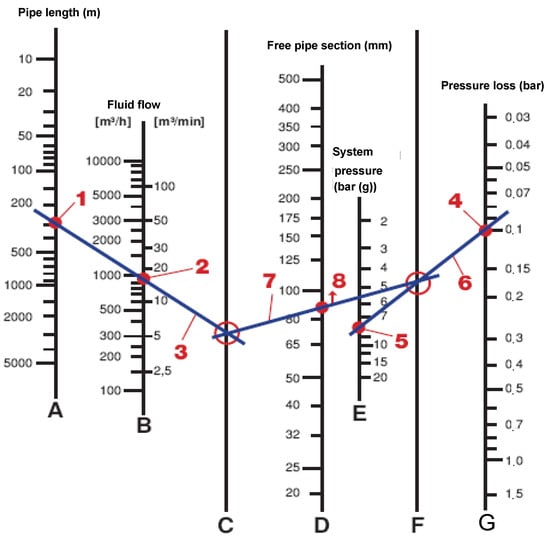
Figure 6.
Recommended pipe diameter design diagram. Red numbers indicate the calculated parameters obtained from the design diagram. The red circle highlights the selected operating zone, while the red dot marks the specific design point used to determine the pipe diameter.
The internal diameter of compressed air pipes can be calculated with the help of a nomogram as follows: first, mark the pipe length and the flow rate on axes A and B. Connect both points with a straight line that intersects axis C. Then, mark the minimum system pressure and the maximum allowable pressure drop on axes E and G. The straight line between these points intersects axis F. Finally, the line connecting the intersections on axes C and F cuts axis D at the point indicating the required pipe diameter.
According to Kaeser Compressors [], Equation (4) provides an approximate method for determining the necessary pipe diameter in a given straight section:
where:
- —Internal diameter of the pipe (m)
- —System pressure (absolute, Pa)
- L—Nominal length (m)
- V—Volumetric flow rate (/s)
- —Pressure drop (Pa)
Using the previously calculated pressure drops in each straight section and following the recommendations of Kaeser Compressors [], the sections were divided according to their pressure drop, and the diameters were recalculated using Equation (4).
The verification confirmed that the selected diameters for each section were correct. The internal diameters of the distribution pipes are 46 mm and 37 mm, the service pipes are 29 mm and 22 mm, and the vertical pipes in the system include all diameters.
3.8. Measurement of Consumed Flow
Table 10 shows the values of compressed air consumption for all machine tools in the factory. At present, only two of these consumers are active: the machining center and the paint spray gun. To determine the actual flow consumed by these devices, a real-time test was carried out.
Table 10.
Time measurements during tank filling test.
The test consisted of measuring the time required for the compressor to fill the storage tank from start-up, while simultaneously closing the air supply valves to the factory. The results of this test are summarized in Table 10.
Table 11 presents the pressure and temperature values recorded during compressor start-up and shut-down.
Table 11.
Pressure and temperature values at start up and shut down.
Using Equation (5) and the parameters shown in Table 12, the density of air was calculated for both conditions.
Table 12.
Values of constants R, , and M.
The air density under start-up and shut-down conditions was determined using Equation (5). Subsequently, the air mass contained in the storage tank was calculated according to:
where is the tank volume (). The mass flow rate of compressed air was obtained from the difference in tank mass divided by the average filling time, as expressed in Equation (8):
The volumetric flow rate was then derived from the mass flow rate and air density using Equation (9):
The following table summarizes all the calculated parameters, including air density, air mass, remaining mass, and both mass and volumetric flow rates under start-up and shut-down conditions. Additionally, the table includes the maximum flow rate delivered by the compressor, which serves as a reference for system comparison (Table 13).
Table 13.
Calculated parameters for compressed air system operation.
Finally, the comparison between the real air consumption, the effective compressor capacity, and the maximum plant demand confirms that the measured volumetric flow rate (/min) represents approximately 13% of the compressor’s maximum capacity, validating the design and operating efficiency of the system under real industrial conditions.
3.9. Experimental Analysis of Compressed Air Consumption
The measurement of compressed air consumption was carried out through a real-time experimental test. This consisted of determining the time required for the compressor to fill the storage tank from start-up, while simultaneously isolating the factory network by closing all supply valves. The average filling time, obtained from eight independent measurements (Table 10), was 80.25 s.
Pressure and temperature conditions during start-up and shut-down were recorded to characterize the thermodynamic state of the fluid. Using Equation (5) and the constants shown, the air density was calculated as at start-up and at shut-down. These values were then used to determine the mass of air stored in the tank, yielding 20.41 kg at start-up and 23.44 kg at shut-down.
The difference between these two conditions provided the net mass of compressed air delivered, which, when divided by the average filling time, resulted in a mass flow rate of 0.038 kg/s. The volumetric flow rate was subsequently obtained, giving a value of /s, equivalent to /min or /h.
Finally, a comparison was made between the actual consumption, the effective capacity of the BOGE compressor, and the maximum demand estimated for the plant. The results reveal a significant disparity: the real consumption of /s represents only 13.3% of the compressor’s effective output (/s).
This mismatch between installed capacity and actual operating demand highlights a clear inefficiency in system design. Operating the compressor under such low load conditions results in an oversized system with unnecessary energy losses. This finding underscores the potential for optimization through demand-side management, resizing of equipment, or the implementation of variable speed drive (VSD) technology, which would enable the air supply to adapt dynamically to real consumption profiles.
4. Discussion
The discussion of the obtained results is framed within the research trends identified through the bibliometric analysis. As revealed by the network and density maps, most studies on compressed air systems emphasize simulation and theoretical optimization, with limited documentation of full-scale experimental validation under industrial conditions. In this context, the present study contributes to bridging this research gap by providing an experimental validation of pressure losses in a real compressed air system, complemented by a comparative analysis with recent literature. This approach allows for a more comprehensive understanding of the relationship between theoretical predictions and practical performance, reinforcing the relevance of experimental evidence for achieving operational symmetry between energy efficiency, optimization, and sustainability.
The results obtained show that the compressed air distribution system meets the reference parameters established by Atlas Copco, with a total pressure drop of 0.059 bar, below the maximum limit of 0.1 bar. This finding confirms the adequacy of the design and the effectiveness of the modernization actions implemented in the plant, ensuring that the system operates within the efficiency margins recommended for industrial installations.
In addition, the overall efficiency of the system could be improved through the incorporation of advanced control technologies. The integration of variable speed drives in compressors would enable the air supply to be adjusted to real demand, reducing idle operation times and improving energy efficiency by up to 30–35%. Likewise, the use of intelligent controllers capable of synchronizing compressor operation with process requirements represents a promising strategy to further reduce energy losses and optimize operating costs.
In the context of energy optimization, it is important to clarify that the current system does not yet include variable speed drives (VSDs) or intelligent control strategies. Therefore, no direct measurement of energy savings was conducted in this study. However, several international studies and industrial reports consistently indicate that the integration of VSD-based control can substantially reduce unloaded or idle operation periods and improve the overall energy efficiency of compressed air systems. Depending on the system configuration, load variability, and control tuning, these technologies can achieve potential energy savings ranging from 15% to 35%, as documented by the U.S. Department of Energy [], the Carbon Trust [], and Vittorini and Cipollone []. This evidence reinforces the relevance of integrating adaptive control and demand-driven operation in future modernization stages of the system to maximize efficiency and ensure long-term sustainability.
From a methodological perspective, the application of computational fluid dynamics (CFD) tools represents a valuable complement to the analytical models used in this study. CFD would allow for a more detailed analysis of phenomena associated with local turbulence, secondary flows, and losses generated by specific fittings factors that empirical formulas cannot fully capture. A hybrid approach combining CFD simulations with experimental validation would increase calculation accuracy and facilitate the optimization of the pipeline network design.
From a methodological perspective, the incorporation of Computational Fluid Dynamics tools represents a valuable complement to the empirical approach adopted in this study. Through CFD modeling, it is possible to analyze with greater precision the phenomena of local turbulence, head losses in complex fittings, and pressure gradients within the distribution network—factors that empirical formulas cannot fully capture. Such simulations would allow the optimization of pipe layout, the experimental validation of flow uniformity, and the quantification of the symmetry in the system’s energy distribution. Recent studies have demonstrated the effectiveness of hybrid CFD–experimental models in improving the design accuracy of pneumatic and energy distribution systems [,,].
The results obtained position the studied system under more favorable conditions than those reported in previous research, reinforcing the relevance of the modernization undertaken. The low pressure drop observed not only complies with international standards but also creates a favorable scenario for the implementation of additional optimization measures, such as variable speed drives and intelligent controls, whose impact has been widely documented in the literature. Furthermore, the experimental validation conducted provides added value compared to studies based solely on theoretical models, ensuring the reliability of the results and offering a solid foundation for future applications of advanced modeling, such as CFD. In this way, the analyzed case not only confirms good design and operational practices but also opens clear opportunities for continuous improvement in efficiency and industrial sustainability. Table 14 presents a comparison of the results obtained, showing that the studied system is positioned under more favorable conditions than those reported in previous studies.
Table 14.
Comparative analysis highlighting the novelty and advantages of the present case study.
In this regard, the integration of intelligent control strategies and Variable Speed Drives (VSDs) constitutes a key innovation path for enhancing the energy efficiency of compressed air systems. The implementation of intelligent controllers based on predictive algorithms or neural networks would enable real-time adjustment of compressor speed according to actual demand, thus reducing idle operation time and associated energy consumption. This adaptive control logic reinforces the concept of operational symmetry, maintaining a constant balance between compressed air supply and process demand. Recent research has reported energy savings of up to 30–35% using such optimization strategies [,,].
It is important to consider that the energy optimization of compressed air systems has a direct impact on industrial profitability. Reducing pressure losses and implementing intelligent control strategies not only decrease electrical consumption but also extend equipment lifespan and minimize maintenance costs. Several authors have proposed integrated energy–economy assessment models that simultaneously evaluate technical and financial benefits derived from energy efficiency measures [,,]. From this perspective, the experimentally validated case presented in this work can serve as a foundation for developing economic evaluation models that complement technical symmetry with financial sustainability.
Regarding experimental accuracy, it is important to note that the pressure measurements were performed using a calibrated Nagano PI-602 B analog manometer, with a measurement range of 0–15 bar and a nominal accuracy class of ±1.6% of full scale (corresponding to ±0.24 bar). The device was independently calibrated by the National Institute of Metrology Research (INIMET) in Havana, Cuba, ensuring traceable measurement reliability. During the tests, steady-state operating conditions were maintained to minimize transient effects and random fluctuations. Given that the observed pressure drop was 0.059 bar, the instrument’s uncertainty represents only a small fraction of the measured value, confirming that the results are statistically consistent and experimentally robust. These metrological details and the associated uncertainty analysis have been incorporated into the Section 2 and Section 4 to reinforce the transparency and scientific rigor of this study.
Finally, it is important to highlight the adoption of comprehensive energy management strategies, including real-time leakage monitoring, the implementation of artificial intelligence algorithms for early fault detection, and the use of power factor correction systems. These measures, in addition to ensuring reliable system operation, would contribute to a more sustainable management of energy resources and to the reduction of the installation’s environmental footprint.
In recent years, the integration of digital technologies and computational fluid dynamics (CFD) has driven the development of advanced strategies for optimization and intelligent monitoring in industrial environments. These tools enable precise spatiotemporal reconstructions, predictive fault detection, and synchronized resource management through data-driven models and digital twins. Table 15 presents some recent studies (2023–2025) that illustrate the application of these technologies in various industrial contexts.
Table 15.
CFD and Digital Technologies in Industrial Environments.
5. Conclusions
The pressure drop calculations were conducted under the most demanding operating condition for both the compressor and the pipeline network, assuming the simultaneous operation of all compressed air consumers. This scenario enabled the estimation of the maximum pressure drop corresponding to the highest possible flow rate.
During the experimental verification, two of the main consumers were active, while the supply valves of the inactive equipment were opened to the atmosphere, resulting in a flow rate equivalent to the plant’s maximum demand. The measured pressure drop of 0.059 bar remained below the 0.1 bar limit established by Atlas Copco, confirming the validity of the design and the overall efficiency of the installation. Furthermore, the selected pipe diameters in each section of the network complied with the technical requirements for continuous operation and maintenance, ensuring compliance with international standards and guaranteeing reliable performance.
Beyond validating the current system, the findings suggest practical pathways for improvement. The company could benefit from the implementation of automated leak detection systems, real-time monitoring of flow and pressure, and digital twin-based simulations to support predictive maintenance and dynamic optimization. These strategies would not only enhance energy efficiency but also align the plant’s operations with emerging ISO 50001 [] energy management practices and Industry 4.0 standards, promoting long-term sustainability and cost reduction.
Author Contributions
Conceptualization, G.J.B.G. and L.A.I.C.; Methodology, L.A.I.C., C.D.C.-R. and J.P.M.Y.; Software, L.A.I.C. and G.J.B.G.; Validation, J.P.M.Y. and M.d.C.P.T.-F.; Formal analysis, L.A.I.C., G.J.B.G. and J.P.M.Y.; Investigation, G.J.B.G., C.D.C.-R. and A.F.-R.; Data curation, L.A.I.C. and J.P.M.Y.; Writing—original draft preparation, L.A.I.C. and G.J.B.G.; Writing—review and editing, J.P.M.Y., C.D.C.-R. and M.d.C.P.T.-F.; Visualization, L.A.I.C., C.D.C.-R. and J.R.-R.; Supervision, A.F.-R. and J.R.-R.; Project administration, M.d.C.P.T.-F. and J.R.-R. All authors have read and agreed to the published version of the manuscript.
Funding
The authors report that there is no funding associated with the work featured in this article.
Data Availability Statement
The original contributions presented in this study are included in the article. Further inquiries can be directed to the corresponding authors.
Conflicts of Interest
The authors declare no conflicts of interest.
References
- Saidur, R.; Rahim, N.; Hasanuzzaman, M. A review on compressed-air energy use and energy savings. Renew. Sustain. Energy Rev. 2010, 14, 1135–1153. [Google Scholar] [CrossRef]
- Nehler, T. Linking energy efficiency measures in industrial compressed air systems with non-energy benefits—A review. Renew. Sustain. Energy Rev. 2018, 89, 72–87. [Google Scholar] [CrossRef]
- Hernandez-Herrera, H.; Silva-Ortega, J.I.; Martínez Diaz, V.L.; García Sanchez, Z.; González García, G.; Escorcia, S.M.; Zarate, H.E. Energy savings measures in compressed air systems. Int. J. Energy Econ. Policy 2020, 10, 414–422. [Google Scholar] [CrossRef]
- Kostornoy, S.; Chaplygin, A.; Kostornoy, A. Automatized Design of the Centrifugal Pumps Setting on the Base of Mathematic Modeling of Fluid Flow. Procedia Eng. 2012, 39, 212–222. [Google Scholar] [CrossRef]
- Eras, J.J.C.; Gutiérrez, A.S.; Santos, V.S.; Ulloa, M.J.C. Energy management of compressed air systems. Assessing the production and use of compressed air in industry. Energy 2020, 213, 118662. [Google Scholar] [CrossRef]
- dos Santos Mascarenhas, J.; Chowdhury, H.; Thirugnanasambandam, M.; Chowdhury, T.; Saidur, R. Energy, exergy, sustainability, and emission analysis of industrial air compressors. J. Clean. Prod. 2019, 231, 183–195. [Google Scholar] [CrossRef]
- Zhang, B.; Liu, M.; Li, Y.; Wu, L. Optimization of an industrial air compressor system. Energy Eng. 2013, 110, 52–64. [Google Scholar] [CrossRef]
- Luther, M.B.; Horan, P.; Tokede, O.O. A case study in performance measurements for the retrofitting of a library. Energy Build. 2018, 169, 473–483. [Google Scholar] [CrossRef]
- Wasbari, F.; Bakar, R.; Gan, L.; Tahir, M.; Yusof, A. A review of compressed-air hybrid technology in vehicle system. Renew. Sustain. Energy Rev. 2017, 67, 935–953. [Google Scholar] [CrossRef]
- Rasmussen, B.D.; Jakobsen, A. Review of compressor models and performance characterizing variables. In Proceedings of the Fifteenth International Compressor Engineering Conference, West Lafayette, IN, USA, 25–28 July 2000. [Google Scholar]
- Benedetti, M.; Bonfa’, F.; Bertini, I.; Introna, V.; Ubertini, S. Explorative study on Compressed Air Systems’ energy efficiency in production and use: First steps towards the creation of a benchmarking system for large and energy-intensive industrial firms. Appl. Energy 2018, 227, 436–448. [Google Scholar] [CrossRef]
- Hu, X.; Huang, C. Design of Air Compressor Speed Control System Based on the Technology of Frequency Conversion. In Proceedings of the 2011 Fourth International Conference on Intelligent Computation Technology and Automation, Shenzhen, China, 28–29 March 2011; Volume 1, pp. 400–403. [Google Scholar] [CrossRef]
- Yu, X.; Zhang, Z.; Qian, G.; Jiang, R.; Wang, L.; Huang, R.; Li, Z. Evaluation of PCM thermophysical properties on a compressed air energy storage system integrated with packed-bed latent thermal energy storage. J. Energy Storage 2024, 81, 110519. [Google Scholar] [CrossRef]
- Nordal, H.; El-Thalji, I. Assessing the Technical Specifications of Predictive Maintenance: A Case Study of Centrifugal Compressor. Appl. Sci. 2021, 11, 1527. [Google Scholar] [CrossRef]
- Willie, J.; Sachs, R. Structural and torsional vibration and noise analysis of a dry screw compressor. Proc. Inst. Mech. Eng. Part E J. Process Mech. Eng. 2017, 231, 4–13. [Google Scholar] [CrossRef]
- Guo, Z.; Wei, W.; Chen, L.; Wang, Z.; Mei, S. Operation of Distribution Network Considering Compressed Air Energy Storage Unit and Its Reactive Power Support Capability. IEEE Trans. Smart Grid 2020, 11, 2954–2965. [Google Scholar] [CrossRef]
- Salomone-González, D. Advanced strategies for the efficient optimization and control of industrial compressed air systems. Results Eng. 2025, 26, 105429. [Google Scholar] [CrossRef]
- Coman, C.M.; Florescu, A.; Oancea, C.D. Improving the Efficiency and Sustainability of Power Systems Using Distributed Power Factor Correction Methods. Sustainability 2020, 12, 3134. [Google Scholar] [CrossRef]
- Li, J.; Hu, Y.; Zhang, X.; Xu, W.; Cai, M.; Jia, G. Energy Efficiency Analysis of the Pre-Cooling Air Compressor System. In Proceedings of the 2023 9th International Conference on Fluid Power and Mechatronics (FPM), Lanzhou, China, 18–21 August 2023; pp. 01–07. [Google Scholar] [CrossRef]
- Vittorini, D.; Cipollone, R. Financial analysis of energy saving via compressor replacement in industry. Energy 2016, 113, 809–820. [Google Scholar] [CrossRef]
- Medojevic, M.; Medojevic, M.M.; Petrovic, M.J. Energy Efficiency and Optimization Measures of Compressed Air Systems with Pneumatic Cylinders as an End Compressed Air Energy Users in the Large Exhibition Hall. In Proceedings of the 6th International Conference on Energy Research & Development (ICERD–6), Kuwait City, Kuwait, 14–16 March 2016. [Google Scholar]
- Chalén Aspiazu, H.V.; Pólit Bravo, J.A.; Tutiven, C. Rediseño de un Sistema de Aire Comprimido en una Planta de Alimentos. Ph.D. Thesis, Escuela Superior Politécnica del Litoral, Guayaquil, Ecuador, 2021. [Google Scholar]
- Candra, A.; Yandri, E.; Saiful, R.; Uhanto, U.; Hilmi, E.; Hamja, N.; Ariati, R. Optimizing Compressed Air Operations for Electrical Energy Savings: A Case Study in Pharmaceutical Packaging Manufacturing. Grimsa J. Sci. Eng. Technol. 2024, 2, 76–86. [Google Scholar] [CrossRef]
- Goryachikh, V.; Alghamdi, F.; Takrouni, A. Compressor Computerized Performance Monitoring System CPMS. In Proceedings of the SPE Middle East Oil and Gas Show and Conference SPE, Manama, Bahrain, 28 November–1 December 2021; p. D041S036R007. [Google Scholar]
- Atlas Copco Argentina. Atlas Copco Argentina. Obtenido de Atlas Copco. 2025. Available online: https://www.atlascopco.com/es-ar/compressors/air-compressor-blog/que-son-los-tanques-de-aire-comprimido-2 (accessed on 20 September 2025).
- Kompressoren, B. Operating Instructions for Screw Compressors Driven by V-Belts and Direct Coupling; Manual de operaciones; BOGE Kompressoren: Bielefeld, Germany, 2021. [Google Scholar]
- Atlas Copco España. Atlas Copco España. 2024. Available online: https://www.atlascopco.com/es-es/compressors/air-compressor-blog/filtros-para-compresores (accessed on 28 September 2025).
- Atlas Copco Airpower, NV. Atlas Copco Compressed Air Manual; Atlas Copco Airpower NV: Antwerp, Belgium, 2015. [Google Scholar]
- KAESER Compresores, S.L. Técnica de Aire Comprimido. 2020. Available online: https://kaesertalk.com.ar/wp-content/uploads/2019/10/TECNICA-DE-AIRE-COMPRIMIDO_L.pdf (accessed on 29 September 2025).
- Technologies, I. Autodesk Inventor Products. Available online: https://www.imaginit.com/software/autodesk-products/inventor (accessed on 13 September 2025).
- Díaz, A. (Atlas Copco, Cienfuegos, Cuba). Personal communication, 2025. General information gathering on the compressed air system. Personal interview by G. Barroso, 2025. Conducted on 24 February 2025.
- Díaz, A. (Atlas Copco, Cienfuegos, Cuba). Personal communication, 2025. Compressed air consumption flow values. Personal interview by G. Barroso, 2025. Conducted on 24 February 2025.
- Atlas Copco España. 2023. Available online: https://www.atlascopco.com/es-es/compressors/air-compressor-blog/red-de-aire-comprimido (accessed on 29 July 2025).
- Edition, F.; Çengel, Y.A.; Ghajar, A.J. Errata Sheet. McGraw-Hill Education. 2025. Available online: https://es.scribd.com/document/241954576/Errata-Secondprinting (accessed on 20 May 2025).
- U.S. Department of Energy (DOE). Improving Compressed Air System Performance: A Sourcebook for Industry. 2020. Available online: https://www.energy.gov (accessed on 29 July 2025).
- The Carbon Trust. Compressed Air Systems: Opportunities for Energy Saving. Guide CTG072. 2021. Available online: https://www.carbontrust.com (accessed on 15 May 2025).
- Wang, Z.; Xu, X.; Liu, Y.; Ma, B.J. Digital Twin-Based Spatiotemporal Global Reconstruction for Industrial Temperature Field: A Case Study of the Snap Curing Oven. Int. J. Prod. Res. 2025, 63, 2451–2466. [Google Scholar] [CrossRef]
- Liu, Y.; Huang, K.; Ma, B.J.; Wei, K.; Li, Y.; Yang, C.; Gui, W. Quality-Related Fault Detection for Dynamic Process Based on Quality-Driven Long Short-Term Memory Network and Autoencoder. Neural Netw. 2025, 181, 106819. [Google Scholar] [CrossRef]
- Jiang, Y.; Li, M.; Ma, B.J.; Zhong, R.Y.; Huang, G.Q. Data-Driven Out-of-Order Model for Synchronized Planning, Scheduling, and Execution in Modular Construction Fit-Out Management. Comput.-Aided Civ. Infrastruct. Eng. 2024, 39, 2457–2480. [Google Scholar] [CrossRef]
- ISO 50001:2018; Energy Management Systems—Requirements with Guidance for Use. International Organization for Standardization: Geneva, Switzerland, 2018.
Disclaimer/Publisher’s Note: The statements, opinions and data contained in all publications are solely those of the individual author(s) and contributor(s) and not of MDPI and/or the editor(s). MDPI and/or the editor(s) disclaim responsibility for any injury to people or property resulting from any ideas, methods, instructions or products referred to in the content. |
© 2025 by the authors. Licensee MDPI, Basel, Switzerland. This article is an open access article distributed under the terms and conditions of the Creative Commons Attribution (CC BY) license (https://creativecommons.org/licenses/by/4.0/).