Abstract
Dimazon is known to stimulate the proliferation of epithelial cells. The dimazon released from locally attached polymer foils could be efficient for the treatment of skin damage. So, knowledge on the characteristics of the dimazon released from polymer matrices is important in establishing the continuous and predictable delivery of drug to a target. The spectrum of dimazon released from PVA foils is analysed based on the empirical Korsmeyer–Peppas model. The influence of the drug’s concentration and the film’s anisotropy, induced by stretching, on the delivery mechanism is highlighted. The results of this study could help clinical researchers establish a protocol for using dimazon from PVA foils in skin therapy.
1. Introduction
Controlled drug release is an effective means to administrate one therapeutically agent, which focuses on delivering a drug in a precise, predictable and stained manner over an extended period [,]. Systems with controlled drug release offer advantages in establishing an optimal dosage of a therapeutic agent for local treatment. These systems are usually composed of a therapeutic agent embedded in excess in a biocompatible and biodegradable polymer matrix to assure the continuous and constant quantity of a drug directed towards a target. Local treatment is carried out by placing the system in a cavity of the organism or by attaching it to the skin []. The mechanism of drug release from the polymer matrix depends on the chemical structure of the therapeutic agent, the chosen polymer, and the interactions between them [,]. Knowledge of the characteristics of the drug released from the polymer matrix permit the predictable and reproducible delivery of a therapeutic agent towards the target [,,].
Diacetylaminoazotoluene, an orange crystalline powder commonly known as dimazon [], has the formula (CH3)C6H4N:NC6H3(CH3)N(CH3CO)2 or C18H19N3O2, and molecular weight of 309.42 g/mol. It melts at 75 °C. Dimazon is soluble in ethanol, ether, chloroform, acetone, benzene, fats, oil, and petroleum but is insoluble in water. Dimazon can be prepared by acylation of amidoazotoluene [].
Due to its noticeable effect on the proliferation of epithelial cells, dimazon is known to help heal burns, wounds, eczema of all kinds, and chronic ulcers [] by promoting the formation of the epithelium. In the First World War, dimazon was used in surgery due to its effect on epithelial cells []. Dimazon may also be used to treat diabetic ulcers, TB, ulcerating syphilis, and indolent various ulcers. Dimazon and a few of its substituted derivatives can decrease the toxicity of dioxin []. Dimazon is an antiseptic agent that has been used topically to promote wound healing. For this purpose, dimazon is prepared by dissolving 2% in fatty oi, or mixing with talcum (5% talcum and 95% dimazon powder). It does not stain and may be removed from linen using soap and water. Dimazon is also a therapeutic veterinary agent (it is used in injections for cattle, horse, cats, and dogs) as a diuretic. It is also indicated in the treatment of oedema associated with cardiac insufficiency, renal dysfunction, trauma, or parasitic diseases. The quantitative measurement of udder oedema in dairy cows treated with dimazon was monitored by ultrasound in order to establish the efficiency of diuretic treatment []. Dimazon is not classified as carcinogenic to humans, but all claims regarding the benefits of dimazon must be clinically studied in order to establish its toxicity.
We studied the dimazon released from polyvinyl alcohol (PVA) films with the goal of conducting a clinical analysis of its effect on skin, even if the evidence of its action still requires further proof.
PVA polymer was chosen to prepare foils containing dimazon due to its biodegradability and biocompatibility and due its simple and inexpensive processing [,,,]. This polymer has a very simple structure, is soluble in hot water, but is insoluble in a wide range of solvents and in cold water. PVA is used in pharmacological technology due its good tolerability and reduced toxicity towards patients [,]. The foils cast from PVA-water solutions are characterised by transparency, elasticity, and flexibility and their high tensile and tear resistance. PVA is frequently used in medicine for different devices. In dialyses, one uses PVA membranes with various penetrabilities []. PVA is used for producing cardiovascular devices [], obtaining systems with controlled drug release [,], for replacing some tissues [], for correcting human organ functionality [,,] such as in as immunological kits [], or treating cancer due to its high embolism []. Some medical devices based on PVA are very sensitive to electrical impulses [,].
PVA foils possess intrinsic anisotropy due to the interactions between the dipolar chains of the polymer. The foils are transparent in the visible range and are easily altered by outside forces [,,] due to their flexibility and elasticity. Foil stretching determines anisotropy that is supplemental to the initial one. Stretched PVA foils become anisotropic due to the uniaxial symmetry induced by stretching [,]. The increase in the degree of stretching determines the increase in the foil anisotropy. This property of PVA foils is very important when optical devices containing anisotropic foils are working in polarised light [].
The uniaxial symmetry of stretched PVA foils can influence the mechanism of drug delivery, depending on the degree of foil stretching and the chemical structure of the therapeutic agent.
Understanding the release process of dimazon from polymer foils could enhance the optimisation of the dosage of treatments for some skin illnesses. Further clinical studies are advisable.
2. Materials and Methods
2.1. Preparation of PVA Foils Containing Dimazon
Polymer with molecular weight 70,000–85,000 was used to prepare 20% mixture in distilled water in order to obtain PVA foils. After stirring for 6 h at a temperature of about 85 °C, the mixture became a viscous and transparent gel. Equal quantities of PVA gel were mixed by stirring with solutions of diacetylaminoazotoluene (concentrations 0.01–0.125 mg/mL) in ethanol. PVA foils mixed with dimazon were cast on glass plates by means of a doctor slide with a slit of 0.6 mm. The method is described in [,].
The drug release kinetics were examined at different degrees of stretching of the PVA foils containing dimazon. The dried PVA foils, which were equal in dimensions to hold the same quantity of dimazon, were placed in a drawing device and stretched simultaneously with slight heating using a 40 W light bulb positioned 10 cm in front of the foil. The stretched foils were kept in the drawing device for 24 h in order to prevent modifications to the polymer chain arrangement due to its elasticity. The degree of stretching was computed by dividing the large semi-axis to the small semi-axis of the: one initial circle was drawn on the PVA foil that degenerated during the stretching process []. The dimensions of the PVA foils were measured with a micrometre.
Because dimazon has reduced solubility in water, a binary solvent made from 75% water and 25% ethanol was used as liquid in which the drug release process was studied.
2.2. Spectral Measurements: Calibration Graph of Dimazon
A Specord UV–Vis Carl Zeiss Jena spectrophotometer equipped with data acquisition system was used to record the electronic absorption spectra of the dimazon solutions.
Dimazon shows an electronic absorption band (EAB) of the type π in the spectral range of 280–380 nm, as illustrated in Figure 1.
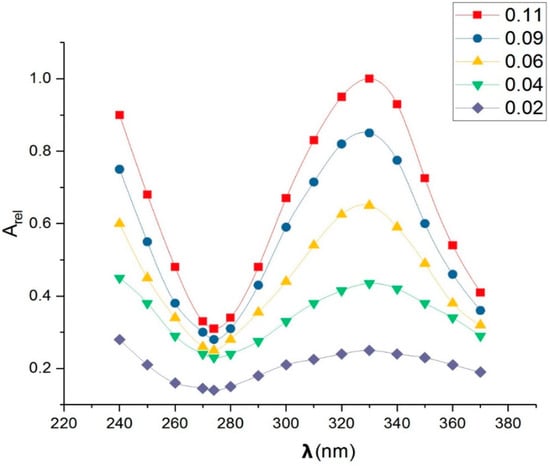
Figure 1.
Relative absorbance of dimazon (standard solutions had concentrations in the range of 0.02–0.11 mg/mL in binary solvent of 25% ethanol + 75% water).
The direct proportionality between the amount of spectrally active substance contained in each solution and the relative absorbance in the maximum of the electronic band, which arises from the Lambert–Beer law of absorption [], allowed for the spectral study of the dimazon released from PVA foils.
Initially, a calibration graph was created to estimate the amount of the drug released from the PVA foils containing dimazon. The absorbance was measured for each standard solution of dimazon in binary solvent with specified concentration in the range [0.01–0.11] mg/mL. Then the relative absorbance
was computed by dividing the absorbance value, A, measured at a given concentration by the corresponding value of the absorbance of the electronic absorption band, recorded according to the solution with the highest concentration. The relative absorbance, given by Equation (1), was plotted against the dimazon concentration of standard solutions to obtain the calibration graph in Figure 2.
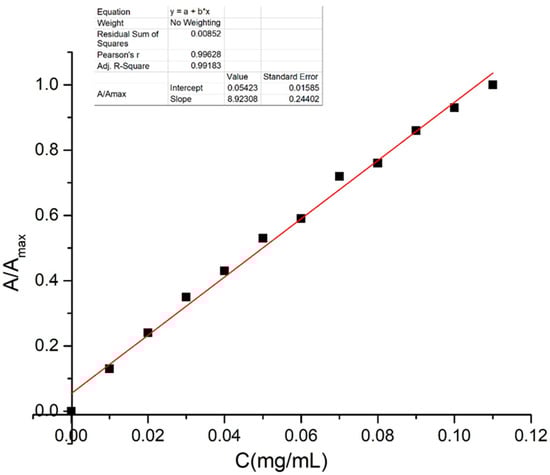
Figure 2.
Calibration graph for dimazon in binary solvent of 75% water + 25% ethanol.
2.3. Quantity of Dimazon Released in Each Step of Experiment
The calibration graph of dimazon was used to estimate the relative amount of drug released in each step of the experiment [,].
In order to estimate the released quantity of drug in a given interval of time, a sample of given dimensions was cut from the dried PVA foil containing dimazon. This sample was consecutively introduced for equal intervals of time, , in identical cuvette containing 20 mL of binary solvent (25% ethanol + 75% water), and the absorbance of each solution was measured. The electronic bands recorded at each step of experiment were normalised by dividing their absorbance by the absorbance of the band recorded for the maximum concentration of dimazon (obtained for one foil maintained for a long time in binary liquid). Then, by using the calibration graph, the relative dimazon quantity released from the corresponding sample was estimated. The total delivered dimazon in p intervals of time (t = p) was estimated by the sum of all results. The experiment was finished when the quantity of dimazon delivered by the sample was near zero.
To ensure the precision of the results, all determinations for the dimazon quantities delivered in time intervals from the non-stretched and stretched PVA foils containing dimazon were repeated three times, and the algebraic average was considered.
3. Theoretical Bases
3.1. Kinetics Model
Mathematical models are very useful in describing drug release profiles. Because semi-empirical model developed by Korsmeyer–Peppas [,,,] better adjusts the dimazon release profile from PVA matrix, this one is used below. This model establishes an experimental relationship between the quantity of drug released and time.
If one measures the amount of drug contained in a dosage cuvette at the final moment of release () and the amount of drug release over time t, (), one can compute the relative amount of drug release after time t:
Korsmeyer–Peppas model expresses the ratio as a function of time:
Constant K is named the release velocity constant, and n is the exponent of release, which is related to the mechanism of process.
The exponent of drug release gives information about the mechanisms implied in the delivery process [,]. According to Korsmeyer–Peppas model, drug release is governed by diffusion phenomena, which are greater than polymer chain relaxation when n ≤ 0.5. The kinetics of the drug release are characterised only by diffusivity for n = 0.5. For n = 1, the model characterises the zero-order kinetics of drug release for which the swelling and relaxation of the polymer chains become important. The rates of diffusion and swelling are comparable in the release process when , while the case corresponds to an extreme form of drug transfer.
In logarithmic form, Korsmeyer–Peppas model is described by relation (4).
When dependence (4) is satisfied, the constants characteristic to the drug release process can be determined from the graph lgf(t) vs. lgt, in which the slope is equal to the exponent of release,. The cut at origin is , where K is the release velocity constant.
The ratio , defined by relation (2), can be determined by spectrophotometric methods, which measures the relative absorbance as the ratio between the absorbance measured in the electronic absorption spectra at the end of release process and at time t, . The mass is estimated based on the calibration graph (Figure 2).
3.2. Dimazon Quantum Mechanical Characterisation
The Spartan14 modelling program [] was used to obtain the optimised structure and some theoretical properties. The method of computation was Density Functional Theory with B3LYP method (Becke’s three-parameter functional using the Lee–Young–Par correlation functional) in combination with 6–31G* basis set [].
From quantum–mechanical point of view, dimazon is a molecule containing two benzene cycles bonded by an azo atomic group N=N and two C=O groups of diacetyl substituents. The dimazon structure, optimized by the Spartan 14 program [], and its dipole moment in the ground electronic state are illustrated in Figure 3. Figure 3 shows that the vector dipole moment of dimazon is near perpendicular on the covalent bond N=N. The molecular symmetry relative to the median plane (perpendicular to the bond N=N, passing through the middle of this chemical bond) is broken by the substituents of the benzenic rings.
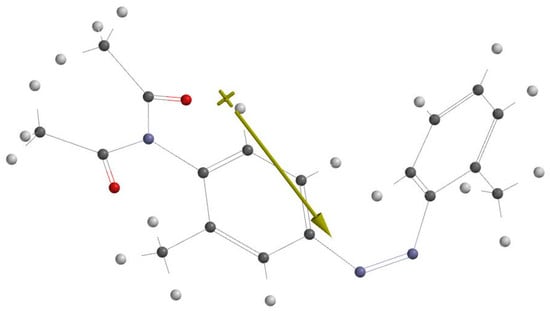
Figure 3.
Optimised structural formula of dimazon (Carbon—black, Nitrogen—blue, Oxygen—red, Hydrogen—white).
Figure 4 displays the benzene planes’ spatial orientation. In the figure plane, dimazon’s two benzene cycles are oriented perpendicularly. The plane of the benzene cycle substituted by the diacyl atomic group is a symmetry plane of the type for its substituent.
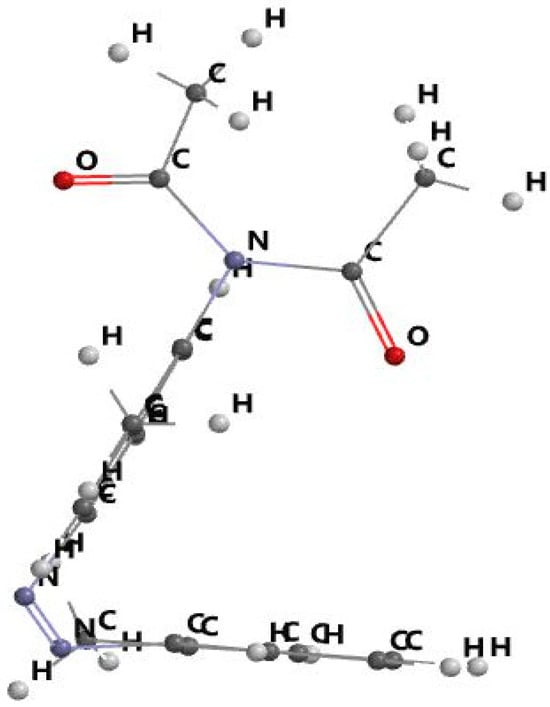
Figure 4.
Spatial orientation of benzene planes in dimazon molecule.
Table 1 lists a few molecular descriptors that were calculated with the Spartan 14 program []. Dimazon’s low total energy value suggests that the molecule is stable. According to Table 1, dimazon is a polar and polarisable molecule with a reduced solubility in water [] (lgP = 0.67) and an energy gap of roughly 3.73 eV for the isolated dimazon molecule and 3.64 eV for it in ethanol. With an HBA count of five, this molecule can add protons from the protic liquids in five different locations close to the nitrogen and oxygen atoms. Dimazon’s dipole moment rises from 5.30 D in its isolated state to 7.22 D in ethanol due to potential specific interactions. The dipole moment of dimazon rises with excitation, as demonstrated by the lowering of the energy gap in ethanol when compared to the isolated state [].

Table 1.
Molecular descriptors of dimazon computed with Spartan 14.
The polar surface area (PSA) is a parameter describing the transport properties used in medicine and chemical industry. The PSA value of less than 90 2 indicates that dimazone penetrates the blood–brain barrier [,].
Figure 5 shows the distribution of the atomic charge close to the dimazon atoms. Dimazon’s capacity to undergo a quasichemical reaction with protic solvents is shown by the negative charges on its nitrogen and oxygen atoms. The electrostatic potential map in Figure 6 emphasises the same point.
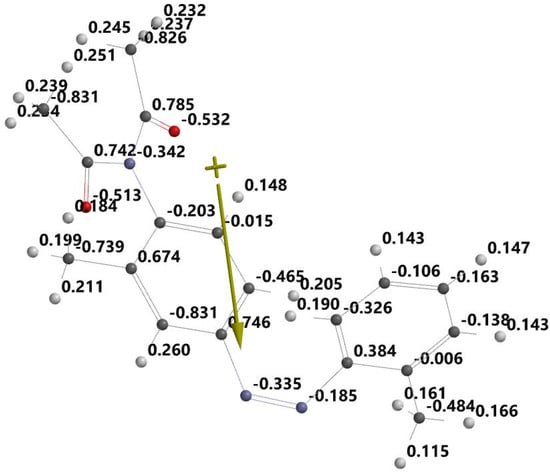
Figure 5.
Atomic charges and dipole moment of dimazon.
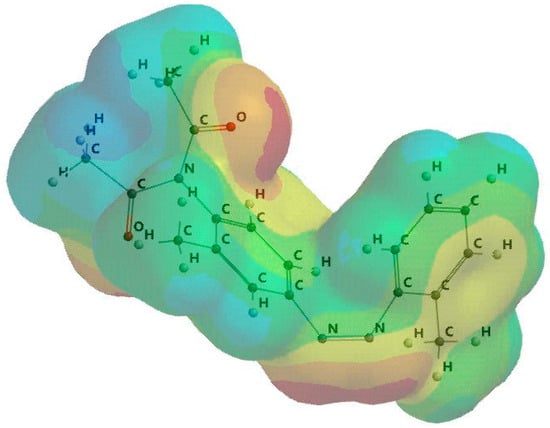
Figure 6.
Three-dimensional geometry of the electrostatic potential distribution (red—nucleophilic zone with excess of electrons, blue—electrophilic zone with electron deficient, green—relatively neutral zone, yellow/orange—slightly nucleophilic or electrophilic, depending on the hue).
In Figure 6 the red zones indicate the high electronegativity in which the oxygen and nitrogen atoms are involved in quasichemical bonds with the protons of polymer chains.
This information, which was obtained through quantum–mechanical analysis, suggests that the dimazon molecule interacts with the –OH chemical bonds of the polymer through quasichemical forces. This interaction has the potential to reduce the release velocity constant K of the dimazon contained in the polymer.
The HOMO and LUMO orbitals are shown in Figure 7 and Figure 8. As a result, the dimazon orbitals only redistribute across the benzene cycles during the transition between the HOMO and LUMO. The charge transfer is localised at the level of the benzene rings, while the distribution of the charges on the dimazon substituents remains unchanged. This fact demonstrates that the substituents of the benzene cycles, which stay in the same places with respect to the polymer chains, have no effect on the release process during the electronic transition due to light absorption.
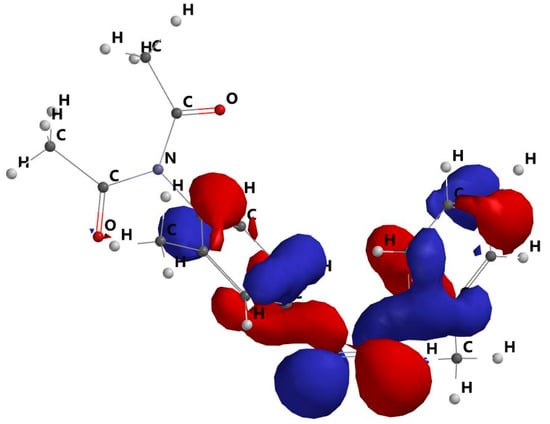
Figure 7.
HOMO molecular frontier orbital.
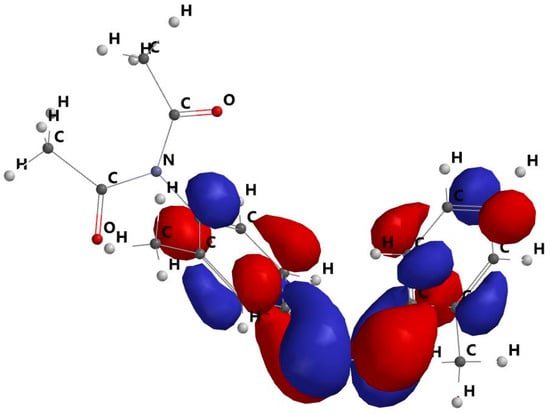
Figure 8.
LUMO molecular frontier orbital.
The red and blue areas show parts of the orbital with opposite sign, essential for: orbital symmetry, constructive or destructive overlap in reactions (e.g., pericyclic reactions), understanding the type of interaction with other orbitals.
Similar results were obtained for curcumin/piperine, other molecules known for healing wound, burns, eczema, and chronic ulcers [,].
The energetic gap computed by Spartan 14 for isolated dimazon molecule is near 3.73 eV, indicating the good reactivity of dimazon with other molecules. The electronic absorption band of dimazon is drawn in Figure 1. Its bandwidth is very large. The wavenumber in the maximum of the dimazon electronic absorption band corresponds to the transition between HOMO and LUMO (see Table 1). The electronic absorption band shifts towards higher wavelengths in polar solvents, which can be attributed to a transition. In ethanol the maximum of the absorption band is near 330 nm, corresponding to 3.52 eV. The distance between HOMO and LUMO levels is lower in ethanol than that of the isolated molecule, indicating an increase in the dimazon dipole moment in LUMO state compared with HOMO.
4. Results and Discussions
A preliminary analysis of the electronic absorption spectra recorded for dimazon release in binary solvent showed the time dependence of the relative absorbance, , measured for solutions in which the release occurred. The obtained dependence corresponds to relation (3) established in the Korsmeyer–Peppas model [,].
In relation (3) K represents the release velocity constant, and n is the exponent of release related to the mechanism of the process. The logarithmic form (4) of the Korsmeyer–Peppas model gives the possibility of establishing the values of constants K and n characterising the release process of dimazon from PVA foils.
The dependence of type (4) is illustrated in Figure 9 for the release process of dimazon from unstretched PVA foil containing the drug.
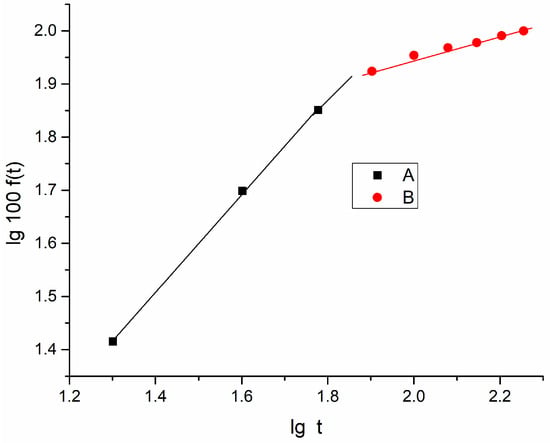
Figure 9.
lg100f(t) vs. lgt for unstretched PVA foil containing dimazon.
Due to the small values of log f(t), in the graphs in Figure 9, Figure 10 and Figure 11, one uses lg100f(t), and then lg K is computed by the difference between the intercept value of the obtained graphs and lg100 = 2.
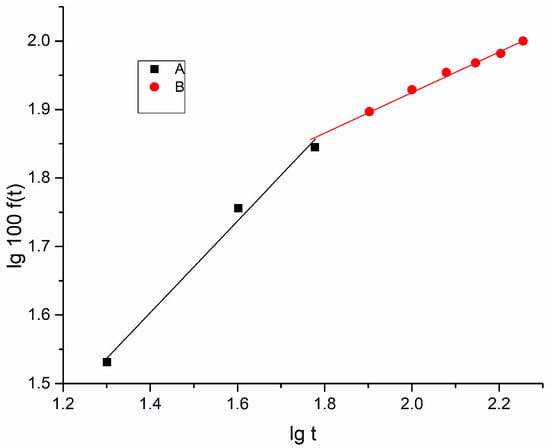
Figure 10.
lg100f(t) vs. lgt for the stretched PVA foil containing dimazon (stretching degree γ = 1.5).
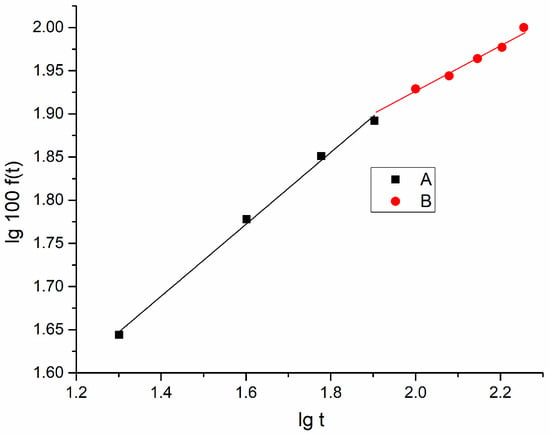
Figure 11.
lg100f(t) vs. lgt for the stretched PVA foil containing dimazon (stretching degree γ = 1.8).
After an hour (cumulative time of release), the slope of the dependence changes, as seen in Figure 9. The sample’s dimazon content decreased after an hour, which could account for the slope’s decline after this time frame. The exponent of the release process is close to unity in the first region of the graph (t < 60 min), suggesting that swelling and relaxation of the polymer chains are more significant than diffusion. In the second region of the graph, where n is small, diffusion phenomena are more common in the release process.
The release process was also analysed for the case of stretched polymer foils containing dimazon. The stretching action was conducted after dying the gel containing dimazon. For a degree of stretching near 1.5 in the graph of lg100f(t) vs. lgt, the two regions are also evidenced. The slope of the line in the first region A of the graph is (see Figure 10). For this case the Korsmeyer–Peppas model establishes equal importance of diffusion and swelling (the rates of diffusion and swelling are comparable).
For the second region B in the graph, where the line has a smaller slope (n = 0.283), in conformity with the Korsmeyer–Peppas model, one can consider the prevalence of the diffusive phenomenon for release times longer than 1 h.
The same results were obtained for a higher degree of stretching γ = 1.80, as shown in Figure 11.
As shown in Figure 11, for a degree of stretching higher than 1.5, the slopes of the linear dependences in the graph lg100f(t) vs. lgt are smaller than 0.5. In this case, the diffusion phenomenon becomes dominant in the release process, according to the Korsmeyer–Peppas model [].
The statistical data regarding the dimazon released from unstretched and stretched PVA foils are listed in Table 2.
There is a strong association between the spectral data and the release time, according to Table 2’s data. Because little is known about dimazon’s toxicity, this study was conducted at low dosages of the drug. Origin calculated a low standard deviation. Only the third decimal place in the experimental data was impacted.
Table 3 provides information on the constants K (constant of release velocity) and n (exponent of release velocity).
Table 3.
Constant K of release velocity and exponent n of release of dimazon in binary solvent containing 25% ethanol and 75% water for different degrees of stretching of PVA films.
According to Table 3’s data, the release velocity constant, K, rises for the stretched foils in the first stage of release (line A) and falls for the second stage of release (line B). The diffusive phenomenon is more common for the highest degree of stretching and for small amounts of dimazon in PVA foils, as shown by the exponent of release, n, decreasing for line A and becoming almost constant and smaller than 0.5 for line B. Only for the unstretched PVA foils containing dimazon, in the first hour of release, does the exponent of release approach unity, suggesting that the swelling and relaxation mechanisms are prevalent during the release process. The product nK listed in Table 3 informs us about the velocity of the delivery process, as it results from the derivative of the Korsmeyer–Peppas model:
The product nK, written in the last two columns in Table 3, which inform us about the velocity of dimazon release, increases with the stretching degree in the case of the first stage of dimazon release (line A). In the second stage of dimazon release (line B), the product nK is relatively constant.
The stretching process of polymer foils determines the increase in the order of PVA chains. The foils become uniaxial, with their axis of symmetry parallel to the stretching direction, and the degree of order of dimazon molecules with their dipole moment parallel to the symmetry axis also increases. The increase in the orientation degree facilitates drug delivery by diffusive effects. The asymmetry of the molecular structure of dimazon facilitates the release process by diffusion.
5. Conclusions
The spectrum of dimazon release from PVA foils can be described by the Korsmeyer–Peppas model.
When the polymer foils are dried and unstretched, for intervals of time shorter than 1 h, the swelling and relaxation of polymer chains have comparable rates to the diffusion in the release process (n = 0.917), but for longer time intervals, the diffusive phenomena become prevalent in the delivery process (n = 0.208).
If the polymer foils containing dimazon are stretched, the importance of swelling and relaxation phenomena decreases (n = 0.417 for γ = 1.8 and time shorter than 1 h), and the diffusion becomes predominant in the release process (n = 0.273 for γ = 1.8 and interval of time longer than 1 h). The increase in order between the polymer chains, by stretching the foils, determines the decrease in the release exponent but increases the velocity of delivery process of dimazon from the polymer foils.
Quantum mechanical analysis indicates that the dimazon molecule can form hydrogen bonds with the OH group belonging to the PVA chains. In the stretching process, the number of the hydrogen bonds increases, determining the decrease in the exponent of drug delivery.
The results of this study can help therapists in establishing a treatment procedure for skin damage using dimazon introduced in a polymer matrix.
Author Contributions
Conceptualisation, D.O.D. and P.G.; methodology, D.B.; software, D.B. and A.V.; validation, P.G. and D.O.D.; formal analysis, P.G. and A.V.; investigation, D.O.D. and A.V.; resources, D.O.D.; data curation, P.G. and D.B.; writing—original draft preparation, D.O.D. and D.B.; writing—review and editing, D.O.D. and P.G.; visualisation, P.G. and D.B.; supervision, D.O.D. and P.G.; project administration, D.O.D. All authors have read and agreed to the published version of the manuscript.
Funding
This research received no external funding.
Data Availability Statement
The data presented in this study are available on request from the corresponding author.
Conflicts of Interest
The authors declare no conflicts of interest.
References
- Swarnalatha, K.M.; Iswariya, V.T.; Akash, B.; Bhandari, S.; Shirisha, R.; Ramarao, T. A Comprehensive Review of Controlled Drug Release Delivery Systems: Current Status and Future Directions. Int. J. Pharm. Phytopharm. Res. 2024, 14, 24–30. [Google Scholar] [CrossRef]
- Barbara, A.A.; Bochicchio, S.; Dalmoro, A.; Coccavo, D.; Cascone, S.; Lamberti, G. Polymer and Lipid-Based Systems for Controlled Release: An Engineering Point of View. In Nanomaterials and Drug Delivery and Therapy; Elsevier: Amsterdam, The Netherlands, 2019; Chapter 10; pp. 267–304. [Google Scholar] [CrossRef]
- Schroeder, I.Z.; Franke, U.F.; Schafer, C.U. Development and characterization of film forming polymeric solutions for skin drug delivery. Eur. J. Pharm. Biopharm. 2007, 65, 111–121. [Google Scholar] [CrossRef] [PubMed]
- Flores-Arriaga, J.C.; Chavarria-Bolanos, D.; Pozos-Guillen, A.J.; Escobar-Barrios, V.A.; Cerda-Cristerna, B.J. Synthesis of PVA drug delivery system for controlled release of a tramadol-dexketoprofen combination. J. Mater Sci. Med. 2021, 3251, 56–67. [Google Scholar] [CrossRef]
- Das, S.; Subudhi, V. Controlled delivery of ibuprofen from poly (vinyl alcohol)-poly (ethylene glycol) interpenetrating polymeric network hydrogels. J. Pharm. Anal. 2019, 9, 108–116. [Google Scholar] [CrossRef]
- Zelinschi, B.C.; Dorohoi, D.O. In vitro release of 2-[1-benzyl-4-piperidyl-methyl]-5,6-dimethoxy—2,3-dihydroinden-1-one (BPMDMHI) included in PVA matrix. Rev. Chim. 2021, 63, 811–814. [Google Scholar]
- Nechifor, C.D.; Zelinschi, C.B.; Stoica, I.; Closca, V.; Dorohoi, D.O. Spectral study of Donepezil release from PVA polymer films. J. Mol. Struct. 2013, 1044, 262–267. [Google Scholar] [CrossRef]
- Nechifor, C.D.; Barzic, A.I.; Stoica, I.; Closca, V.; Dorohoi, D.O. Study of glucose release ability from hydroxypropyl cellulose films. Polym. Bull. 2015, 72, 549–563. [Google Scholar] [CrossRef]
- Puckner, W.A. New and nonofficial remedies in Therapeutics. JAMA 1916, LXVI, 273–275. [Google Scholar] [CrossRef]
- Blind, E. Dimazon and Its Effects Upon Surgery in the War; Hilkraft Med. Company: Boston, MA, USA, 1916. Available online: https://catalog.nlm.nih.gov/discovery/search?vid=01NLM_INST:01NLM_INST&query=lds04,exact,101164549 (accessed on 18 July 2025).
- Suh, P.G.; Ryu, S.H.; Kim, S.H.; Kim, Y.H. Compound Having Activity for Inhibiting Dioxin Toxicity. Pharmaceutical Composition Comprising the Compound and Method for Treating Disease Resulting from Dioxin Toxicity Using the Compound. U.S. Patent 2027/0032458A1, 8 February 2007. [Google Scholar]
- Gundling, N.; Drummer, C.; Lupke, M.; Hoedemaker, M. Quantitative measurement of udder oedema in dairy cows using ultrasound to monitor the effectiveness of diuretic treatment with furosemide. SAT/ASMV 2021, 163, 767–777. [Google Scholar] [CrossRef] [PubMed]
- Aslam, M.; Kalyar, M.A.; Raza, Z.A. Polyvinyl alcohol: A review of research status and use of poly vinyl alcohol based nanocomposites. Polym. Eng. Sci. 2018, 58, 2119–2132. [Google Scholar] [CrossRef]
- Rogojanu, A.; Rusu, E.; Olaru, N.; Dobromir, M.; Dorohoi, D.O. Development and characterization of poly (vinyl) alcohol matrix for drug release. Dig. J. Nanomater. Biostruct. 2018, 6, 809–818. [Google Scholar]
- Urushizaki, F.; Yamaguchi, H.; Namajiri, S.; Sugibayanschi, K.; Morimoto, Y. Swelling and mechanical properties of Poly (vinyl alcohol) hydrogels. Int. J. Pharm. 1990, 58, 135–142. [Google Scholar] [CrossRef]
- Quispe-Siccha, R.M.; Medina-Sandoval, O.I.; Estrada-Tinoco, A.; Pedroza-Pérez, J.A.; Martínez-Tovar, A.; Olarte-Carrillo, I.; Cerón-Maldonado, R.; Reding-Bernal, A.; López-Alvarenga, J.C. Development of PVA hydrogels for controlled glucose release, Biomedical applications. Gels 2024, 10, 668. [Google Scholar] [CrossRef]
- Speight, J.G.; Lange, N.A. Lange’s Handbook of Chemistry, 16th ed.; McGraw-Hill: Columbus, OH, USA, 2005; p. 2807. [Google Scholar]
- Welbanks, L. Compendium of Pharmaceuticals and Specialities, 25th ed.; Canadian Pharmaceutical Association: Ottawa, ON, Canada, 2000. [Google Scholar]
- Azhar, O.; Jahan, Z.; Farooq Sher, F.; Niazi, M.B.K.; Kakar, S.J.; Shahid, M. Cellulose acetate-polyvinyl alcohol blend haemodialysis membranes integrated with dialysis performance and high biocompatibility. Mat. Sci. Eng. C 2021, 126, 112127. [Google Scholar] [CrossRef]
- Tetali, S.S.V.; Fricker, A.T.R.; van Domburg, Y.A.; Roy, I. Intelligent biomaterials for cardiovascular applications. Curr. Opin. Biomed. Eng. 2023, 28, 100474. [Google Scholar] [CrossRef]
- Holloway, J.L.; Spiller, K.L.; Lowman, A.M.; Palmese, G.R. Analysis of the in vitro swelling behavior of poly(vinyl alcohol) hydrogels in osmotic pressure solution for soft tissue replacement. Acta Biomater. 2011, 7, 2477–2482. [Google Scholar] [CrossRef] [PubMed]
- Yu, D.G.; Lin, W.C.; Lin, C.H.; Chang, L.M.; Yang, M.C. An in situ reduction method for preparing silver/poly(vinyl alcohol) nanocomposite as surface-enhanced Raman scattering (SERS)-active substrates. Mat. Chem. Phys. 2007, 101, 93–98. [Google Scholar] [CrossRef]
- Kim, M.D.; Kim, N.K.; Kim, H.J.; Lee, M.H. Pregnancy Following Uterine Artery Embolization with Polyvinyl Alcohol Particles for Patients with Uterine Fibroid or Adenomyosis. Cardiovasc. Inter. Rad. 2005, 28, 611. [Google Scholar] [CrossRef]
- De Groot, J.H.; Spans, C.J.; Van Calk, R.V.; Van Bejma, F.J.; Norrby, S.; Pennings, A.J. Hydrogels for an Accommodating Intraocular Lens. An Explorative Study. Biomacromolecules 2003, 4, 608. [Google Scholar] [CrossRef] [PubMed]
- Nishimura, T.; Hsua, I.; Martinez-Kramsa, D.C.; Nakauchia, Y.; Majetia, R.; Satoshi Yamazakie, S.; Nakauchia, H.; Wilkinson, A.C. Use of polyvinyl alcohol for chimeric antigen receptor T-cell expansion. Exp. Hematol. 2019, 80, 16–20. [Google Scholar] [CrossRef]
- Rivera-Hernández, G.; Antunes-Ricardo, M.; Martínez-Morales, P.; Mirna, L.; Sánchez, M.N. Polyvinyl alcohol based-drug delivery systems for cancer treatment. Int. J. Pharm. 2021, 600, 120478. [Google Scholar] [CrossRef]
- Wang, X.L.; Oh, I.K.; Lee, S. Electroactive artificial muscle based on cross-linked PVA/SPTES. Sens. Actuators B Chem. 2010, 150, 57–64. [Google Scholar] [CrossRef]
- Wang, F.; Kim, S.S.; Kee, C.D.; Shen, Y.D.; Oh, I.K. Novel electroactive PVA-TDCN actuator that is extremely sensitive to low electrical inputs. Smart. Mater. Struct. 2014, 23, 074006. [Google Scholar] [CrossRef]
- Nechifor, C.D.; Postolache, M.; Albu, R.M.; Barzic, A.I.; Dorohoi, D.O. Induced birefringence of rubbed and stretched poly vinyl alcohol foils as alignment layers for nematic molecules. Polym. Adv. Technol. 2019, 30, 2143–2153. [Google Scholar] [CrossRef]
- Lim, J.G.; Kwak, K.; Song, J.K. Computation of refractive index and optical retardation in stretched polymer films. Opt. Express 2017, 25, 16409–16418. [Google Scholar] [CrossRef]
- Dorohoi, D.O. Fundamental Optics; Addleton Academic Publisher: Woodside, NY, USA, 2010; Chapter IV; p. 2. [Google Scholar]
- Pop, V.; Dorohoi, D.O.; Cringeanu, E. A new method for determining birefringence dispersion. J. Macromol. Sci. Physis. B 1994, 33, 373–385. [Google Scholar] [CrossRef]
- Bruschi, M.L. Strategies to Modify the Drug Release from Pharmaceutical Systems; Series in Biomedicine, Nr.85; Wood Head Publishing: Cambridge, UK, 2015. [Google Scholar]
- Wu, I.I.; Bala, S.; Skalko-Basnet, N.D.; Cango, M.P. Interpreting Non-linear diffusion data using Korsmeyer-Peppas model to study drug release from liposomes. Eur. J. Pharm. Sci. 2019, 138, 105026. [Google Scholar] [CrossRef] [PubMed]
- Costa, P.; Lobo, J.M.S. Modelling and comparison of dissolution profiles. Eur. J. Pharm. Sci. 2001, 13, 123–133. [Google Scholar] [CrossRef] [PubMed]
- Hehre, W.; Ohlinger, S. Spartan’14 for Windows, Macintosh and Linux, Tutorial and User’s Guide; Wavefunction Inc.: Irvine, CA, USA, 2014. [Google Scholar]
- Becke, A.D. A new mixing of Hartree-Fock and local density -functional theories. J. Chem. Phys. 1993, 98, 1372–1377. [Google Scholar] [CrossRef]
- Parthasarathi, R.; Subramanian, V.; Roy, D.R.; Chattaraj, P.K. Electrophilicity index as a possible descriptor of biological activity. Bioorganic Med. Chem. 2004, 12, 5533–5543. [Google Scholar] [CrossRef]
- Hehre, W.J. A Guide to Molecular Mechanisms and Quantum Chemistry Calculations; Wavefunction: Irvine, CA, USA, 2013. [Google Scholar]
- Hitchcock, S.A.; Pennington, L.D. Structure-Brain exposure relationships. J. Med. Chem. 2006, 49, 7559–7583. [Google Scholar] [CrossRef]
- Benchea, A.C.; Babusca, D.; Podlipnik, C.; Dimitriu, D.G. Solvatochromic and quantum mechanical characterization of methyl-red. Anal. Lett. 2017, 50, 2711–2724. [Google Scholar] [CrossRef]
- Balasubramanian, K. Molecular orbital basis for yellow curry spice curcumins prevention of Alzheimer s disease. J. Agric. Food Chem. 2006, 54, 3512–3520. [Google Scholar] [CrossRef] [PubMed]
- Patil, V.M.; Das, S.; Balasubramanian, K. Quantum Chemical and Docking insights into bioavailability enhancement of curcumin by piperine in pepper. J. Phys. Chem. A 2016, 120, 3643–3653. [Google Scholar] [CrossRef] [PubMed]
Disclaimer/Publisher’s Note: The statements, opinions and data contained in all publications are solely those of the individual author(s) and contributor(s) and not of MDPI and/or the editor(s). MDPI and/or the editor(s) disclaim responsibility for any injury to people or property resulting from any ideas, methods, instructions or products referred to in the content. |
© 2025 by the authors. Licensee MDPI, Basel, Switzerland. This article is an open access article distributed under the terms and conditions of the Creative Commons Attribution (CC BY) license (https://creativecommons.org/licenses/by/4.0/).