
New Combined Metric for Full-Reference Image Quality Assessment


Abstract
1. Introduction
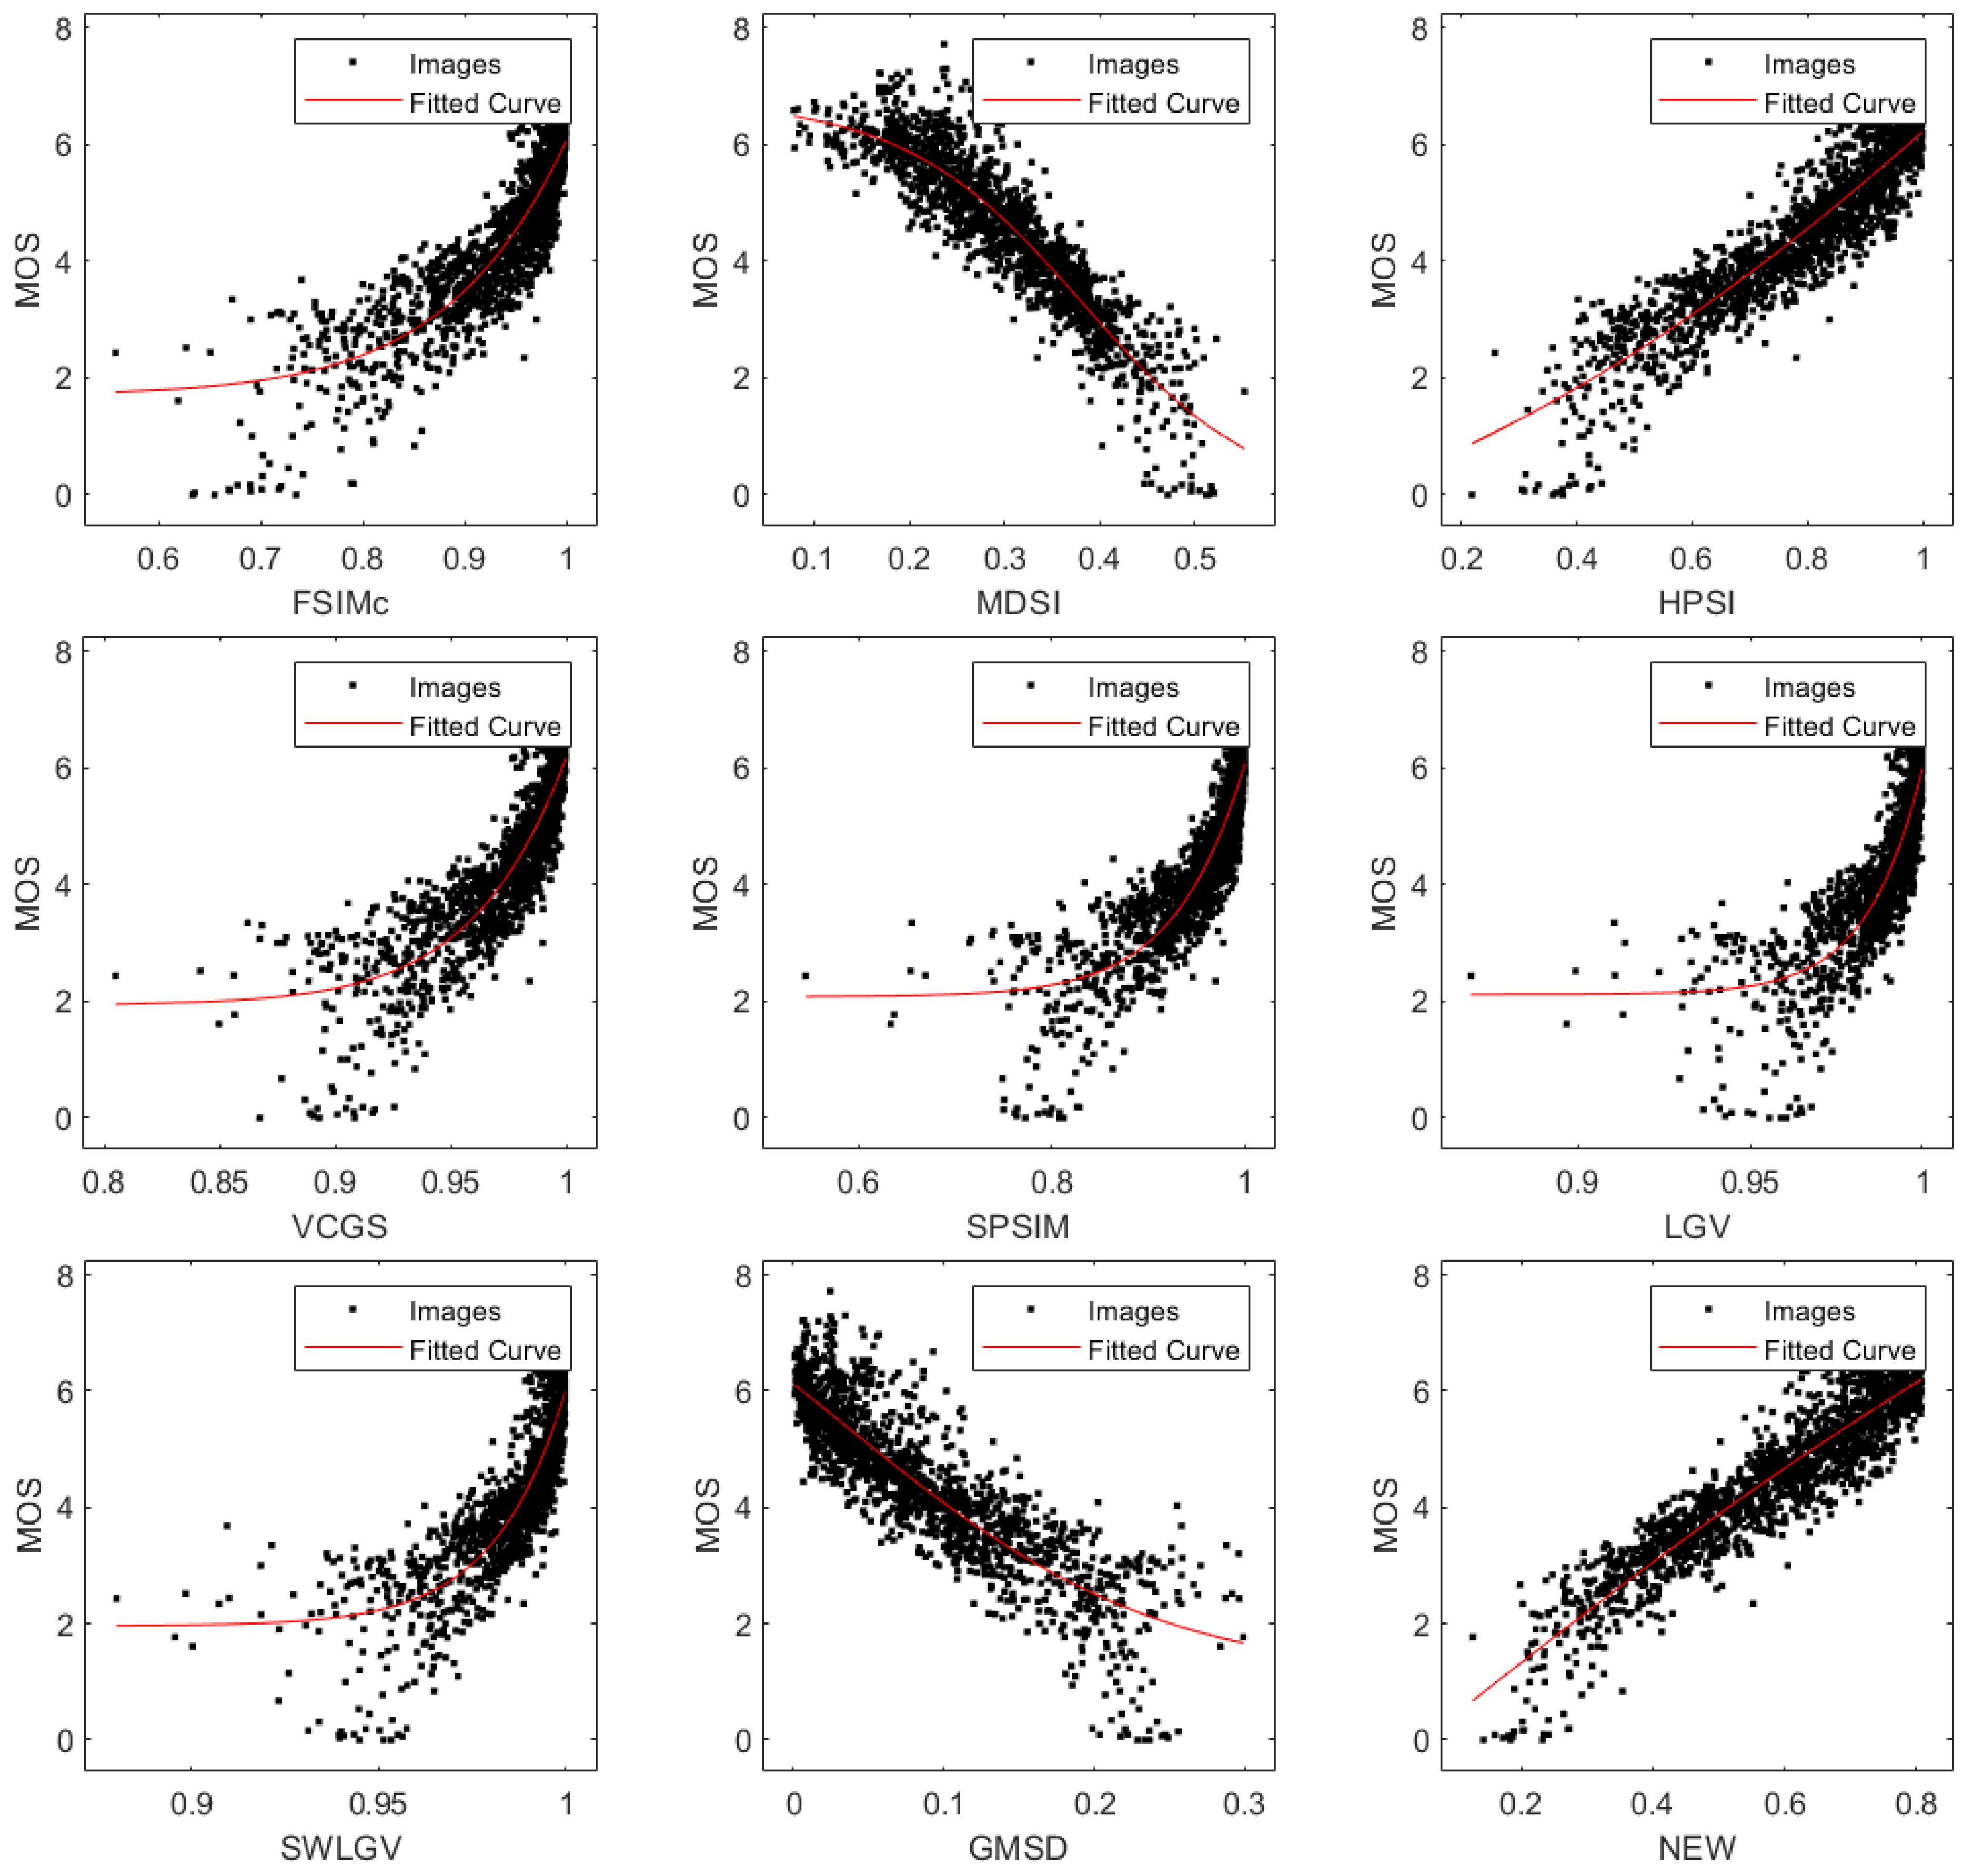
2. Overview of Highly Correlated FR-IQA Metrics
2.1. Feature SIMilarity Index FSIMc (Color Version)
2.2. Mean Deviation Similarity Index MDSI
2.3. Haar Wavelet Perceptual Similarity Index HPSI
2.4. Visual Saliency with Color Appearance and Gradient Similarity Index VCGS
2.5. SuperPixel SIMilarity Index SPSIM
2.6. Local Global Variation Index LGV and Saliency Weighted Local Global Variation Index SWLGV
2.7. Gradient Magnitude Similarity Deviation Index GMSD
2.8. Evaluation Criteria for IQA
3. The New Combined Metric (NCM) and Its Experimental Research
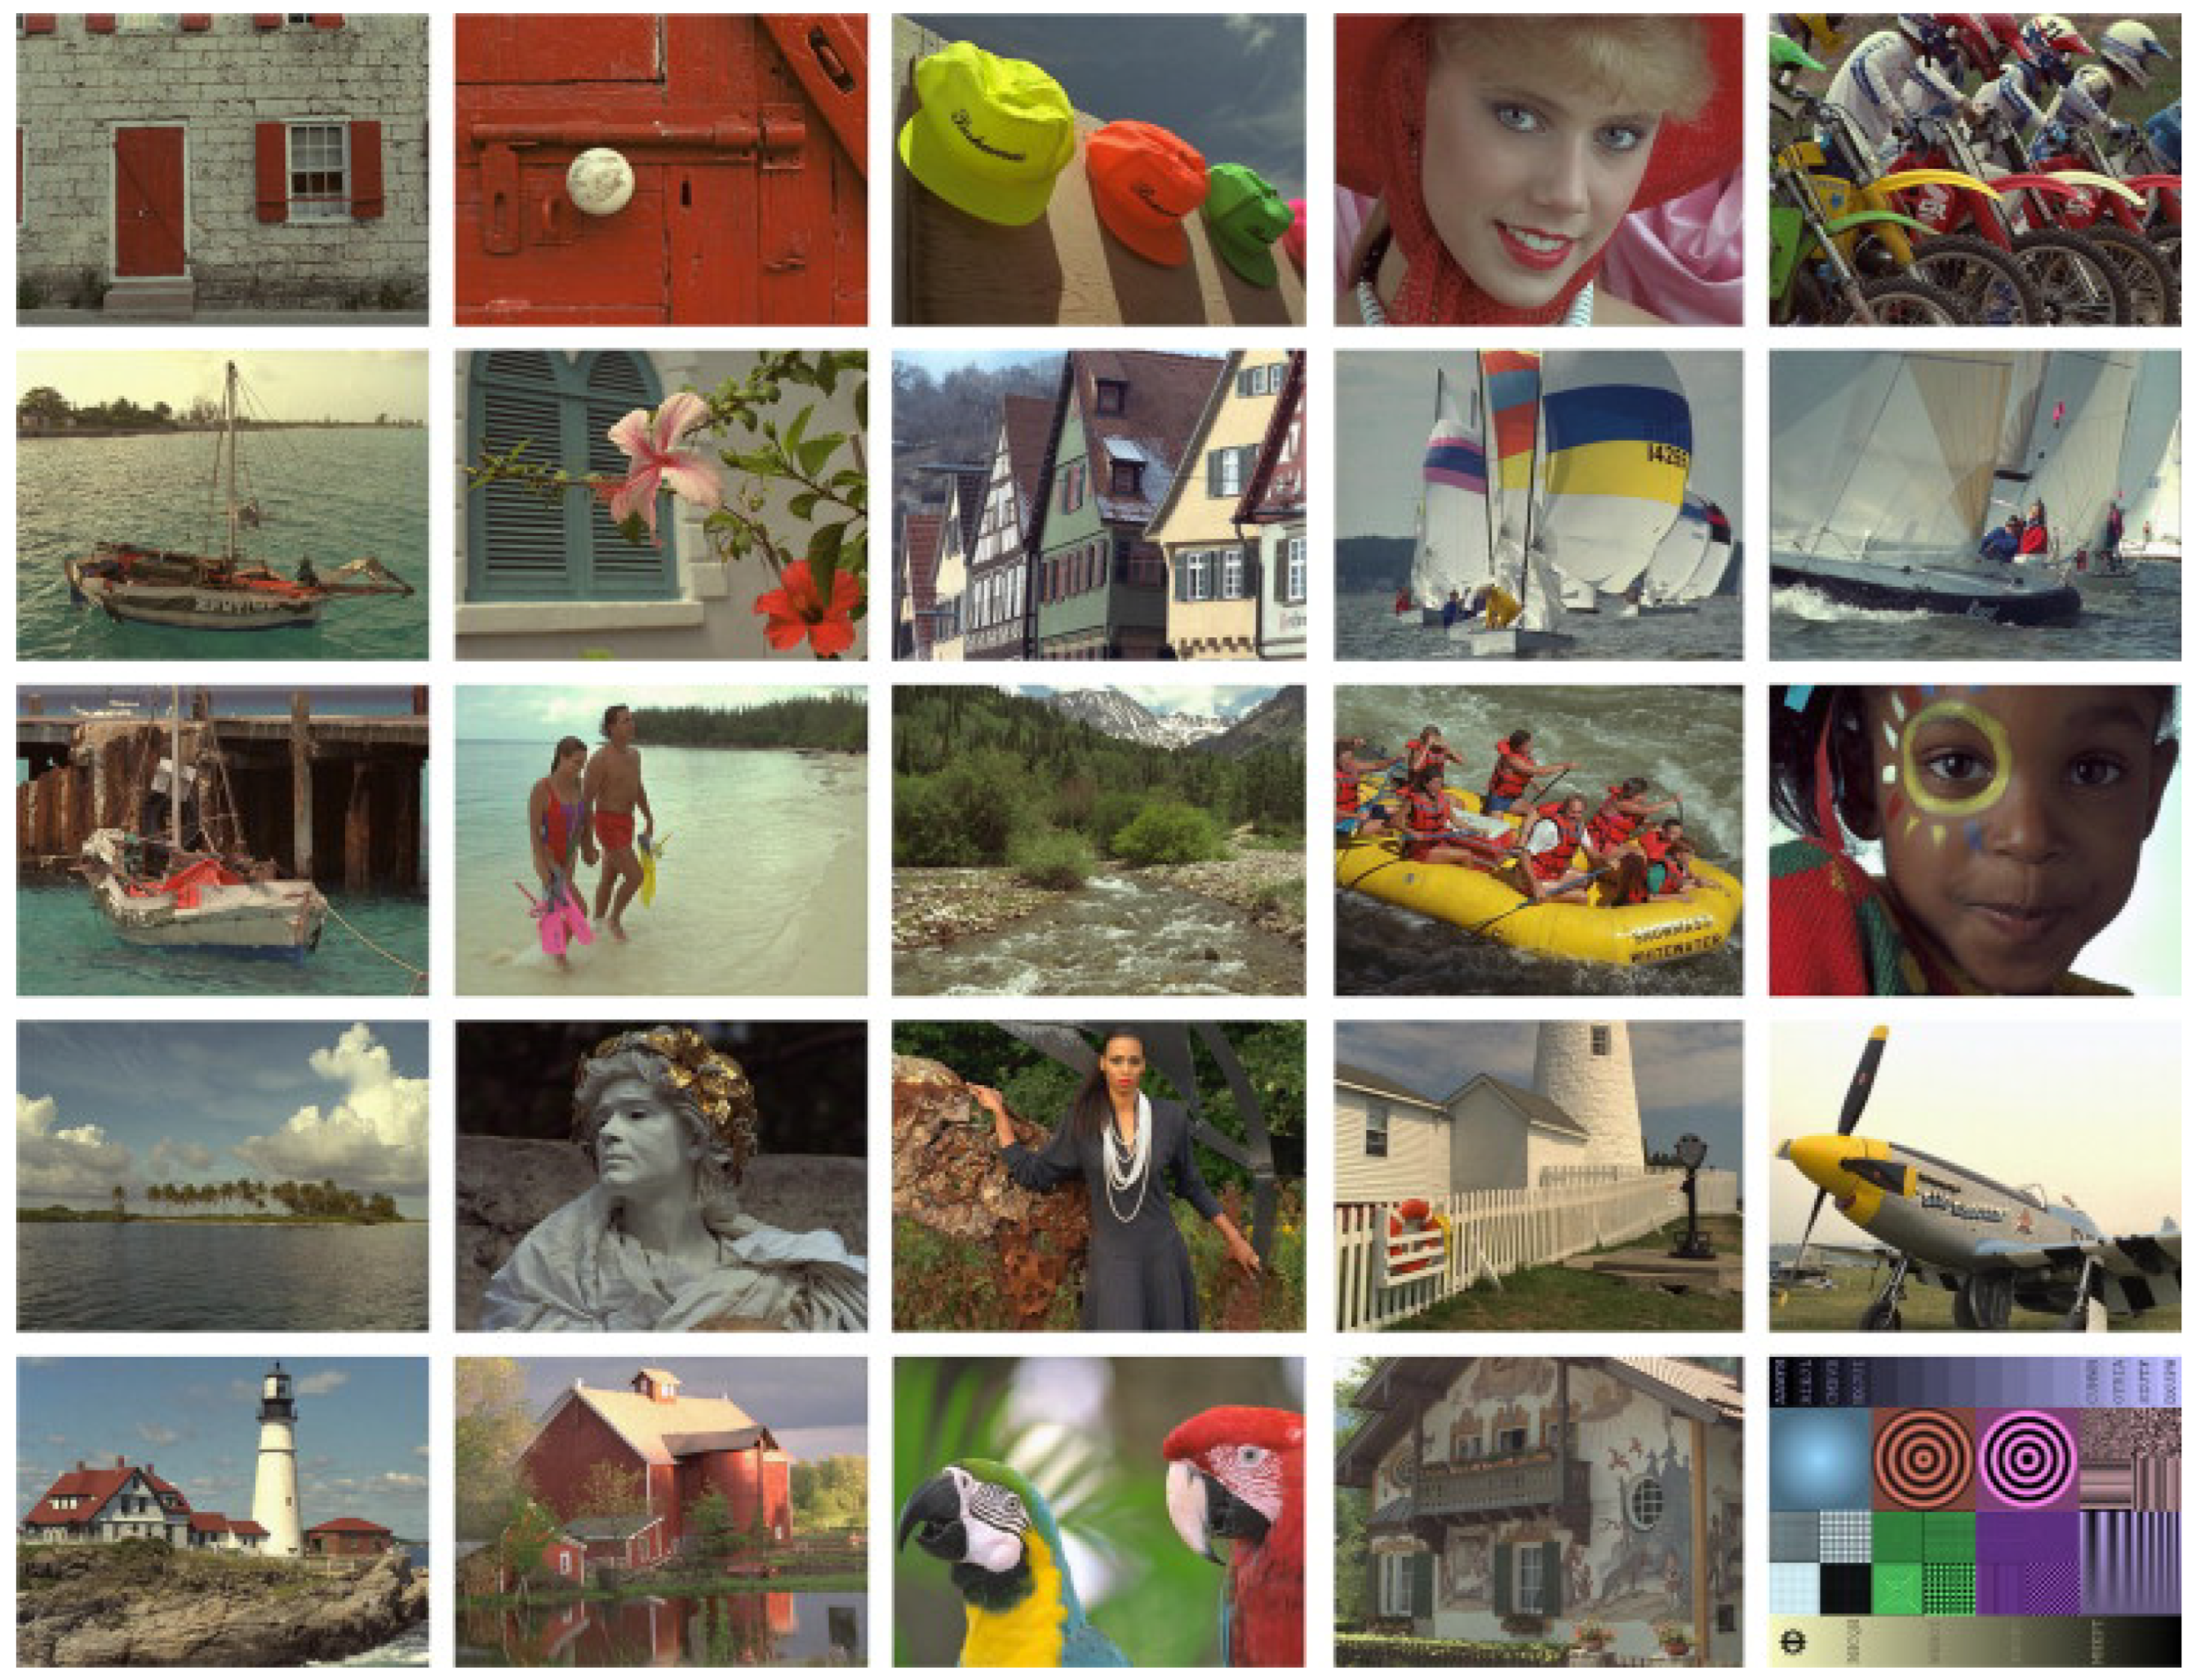
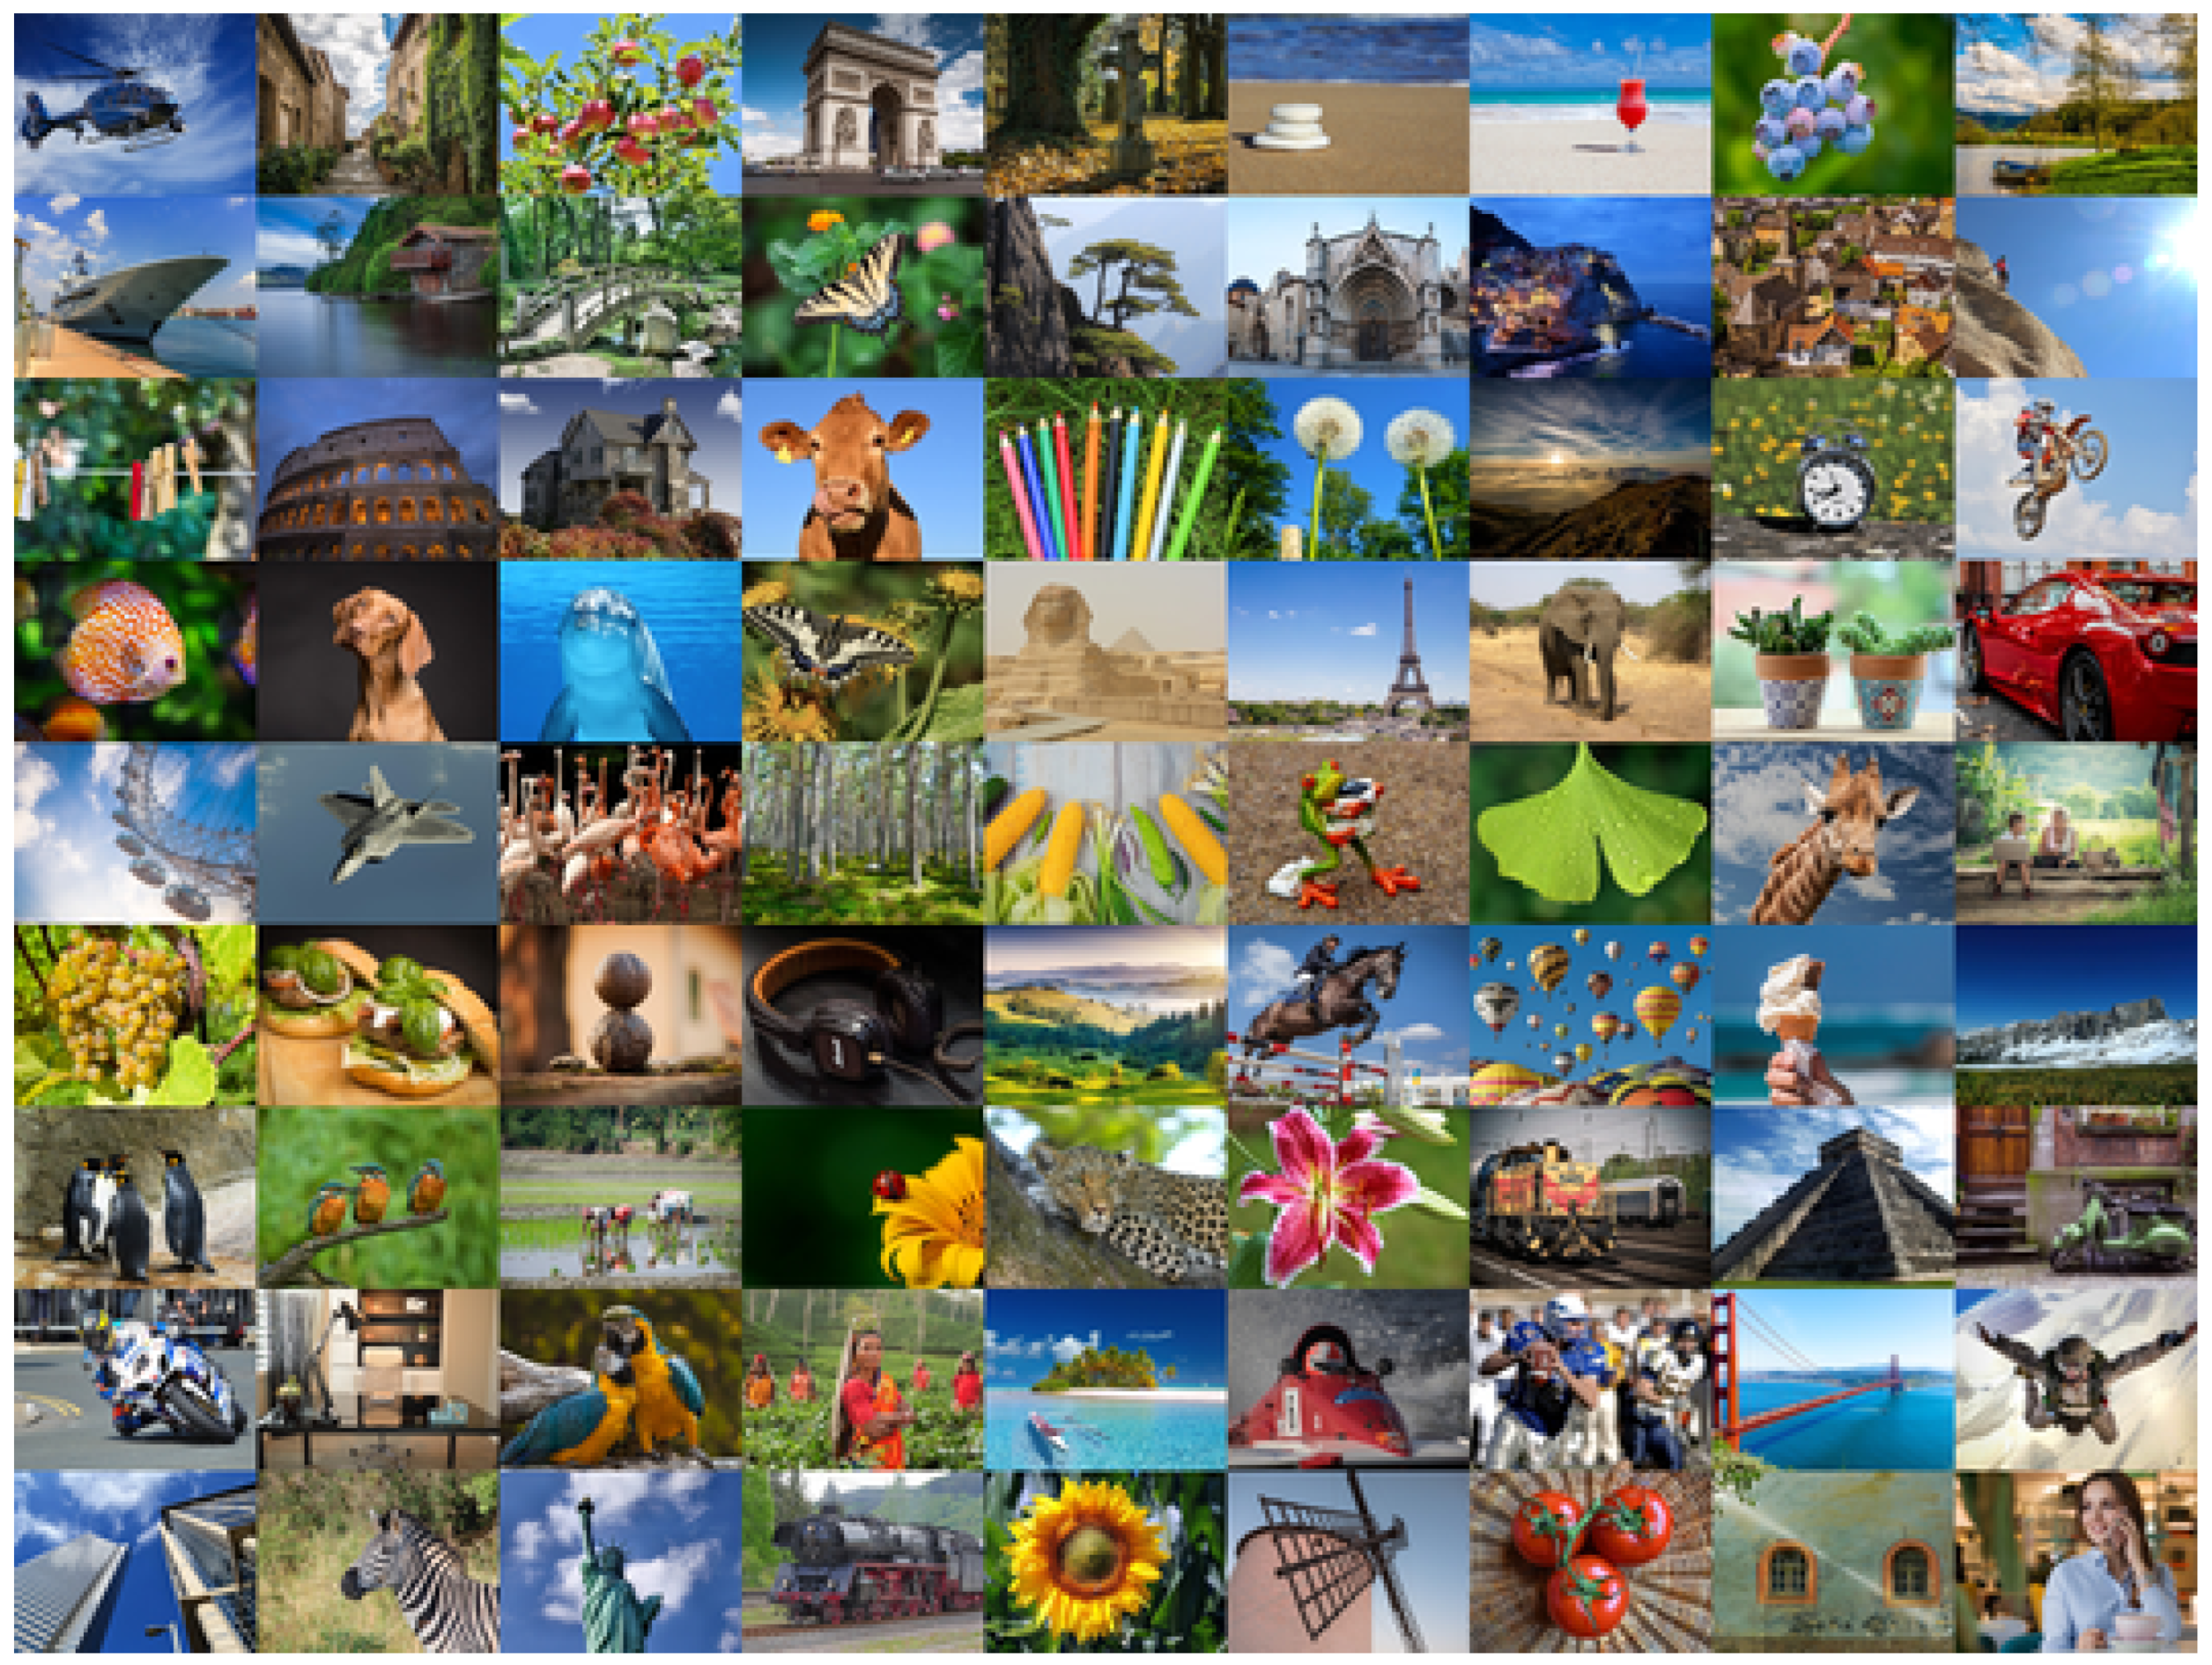
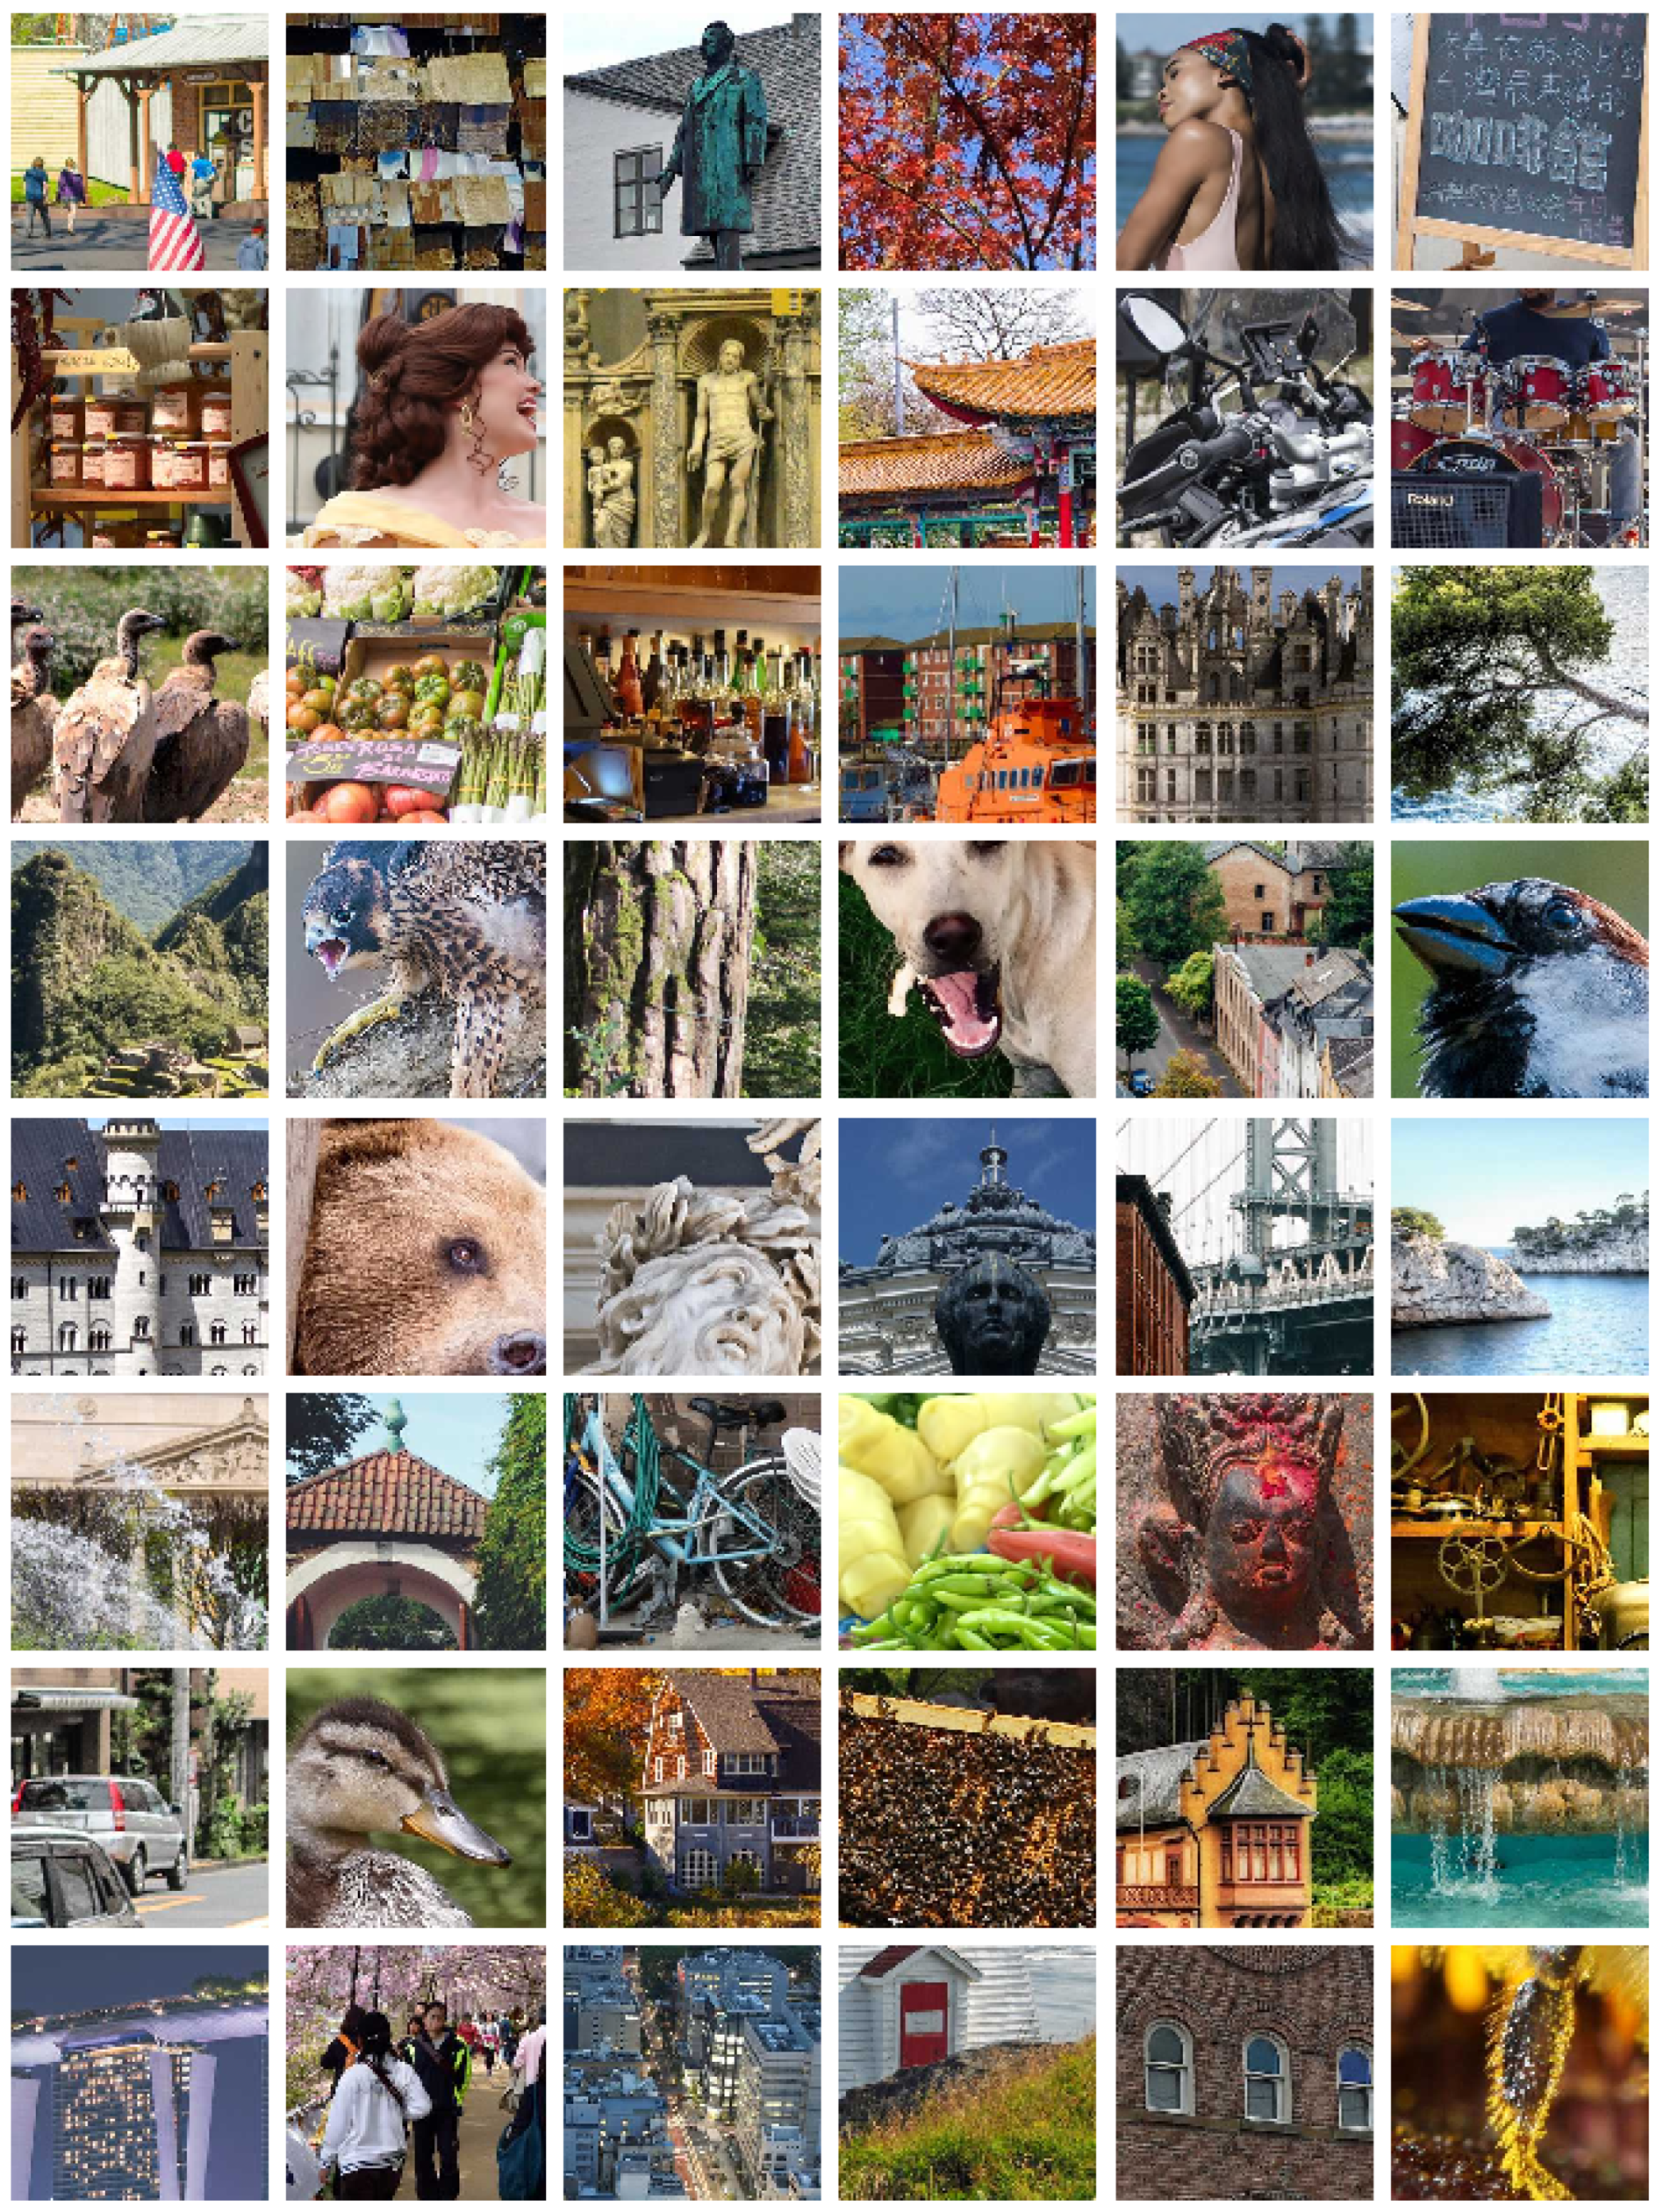
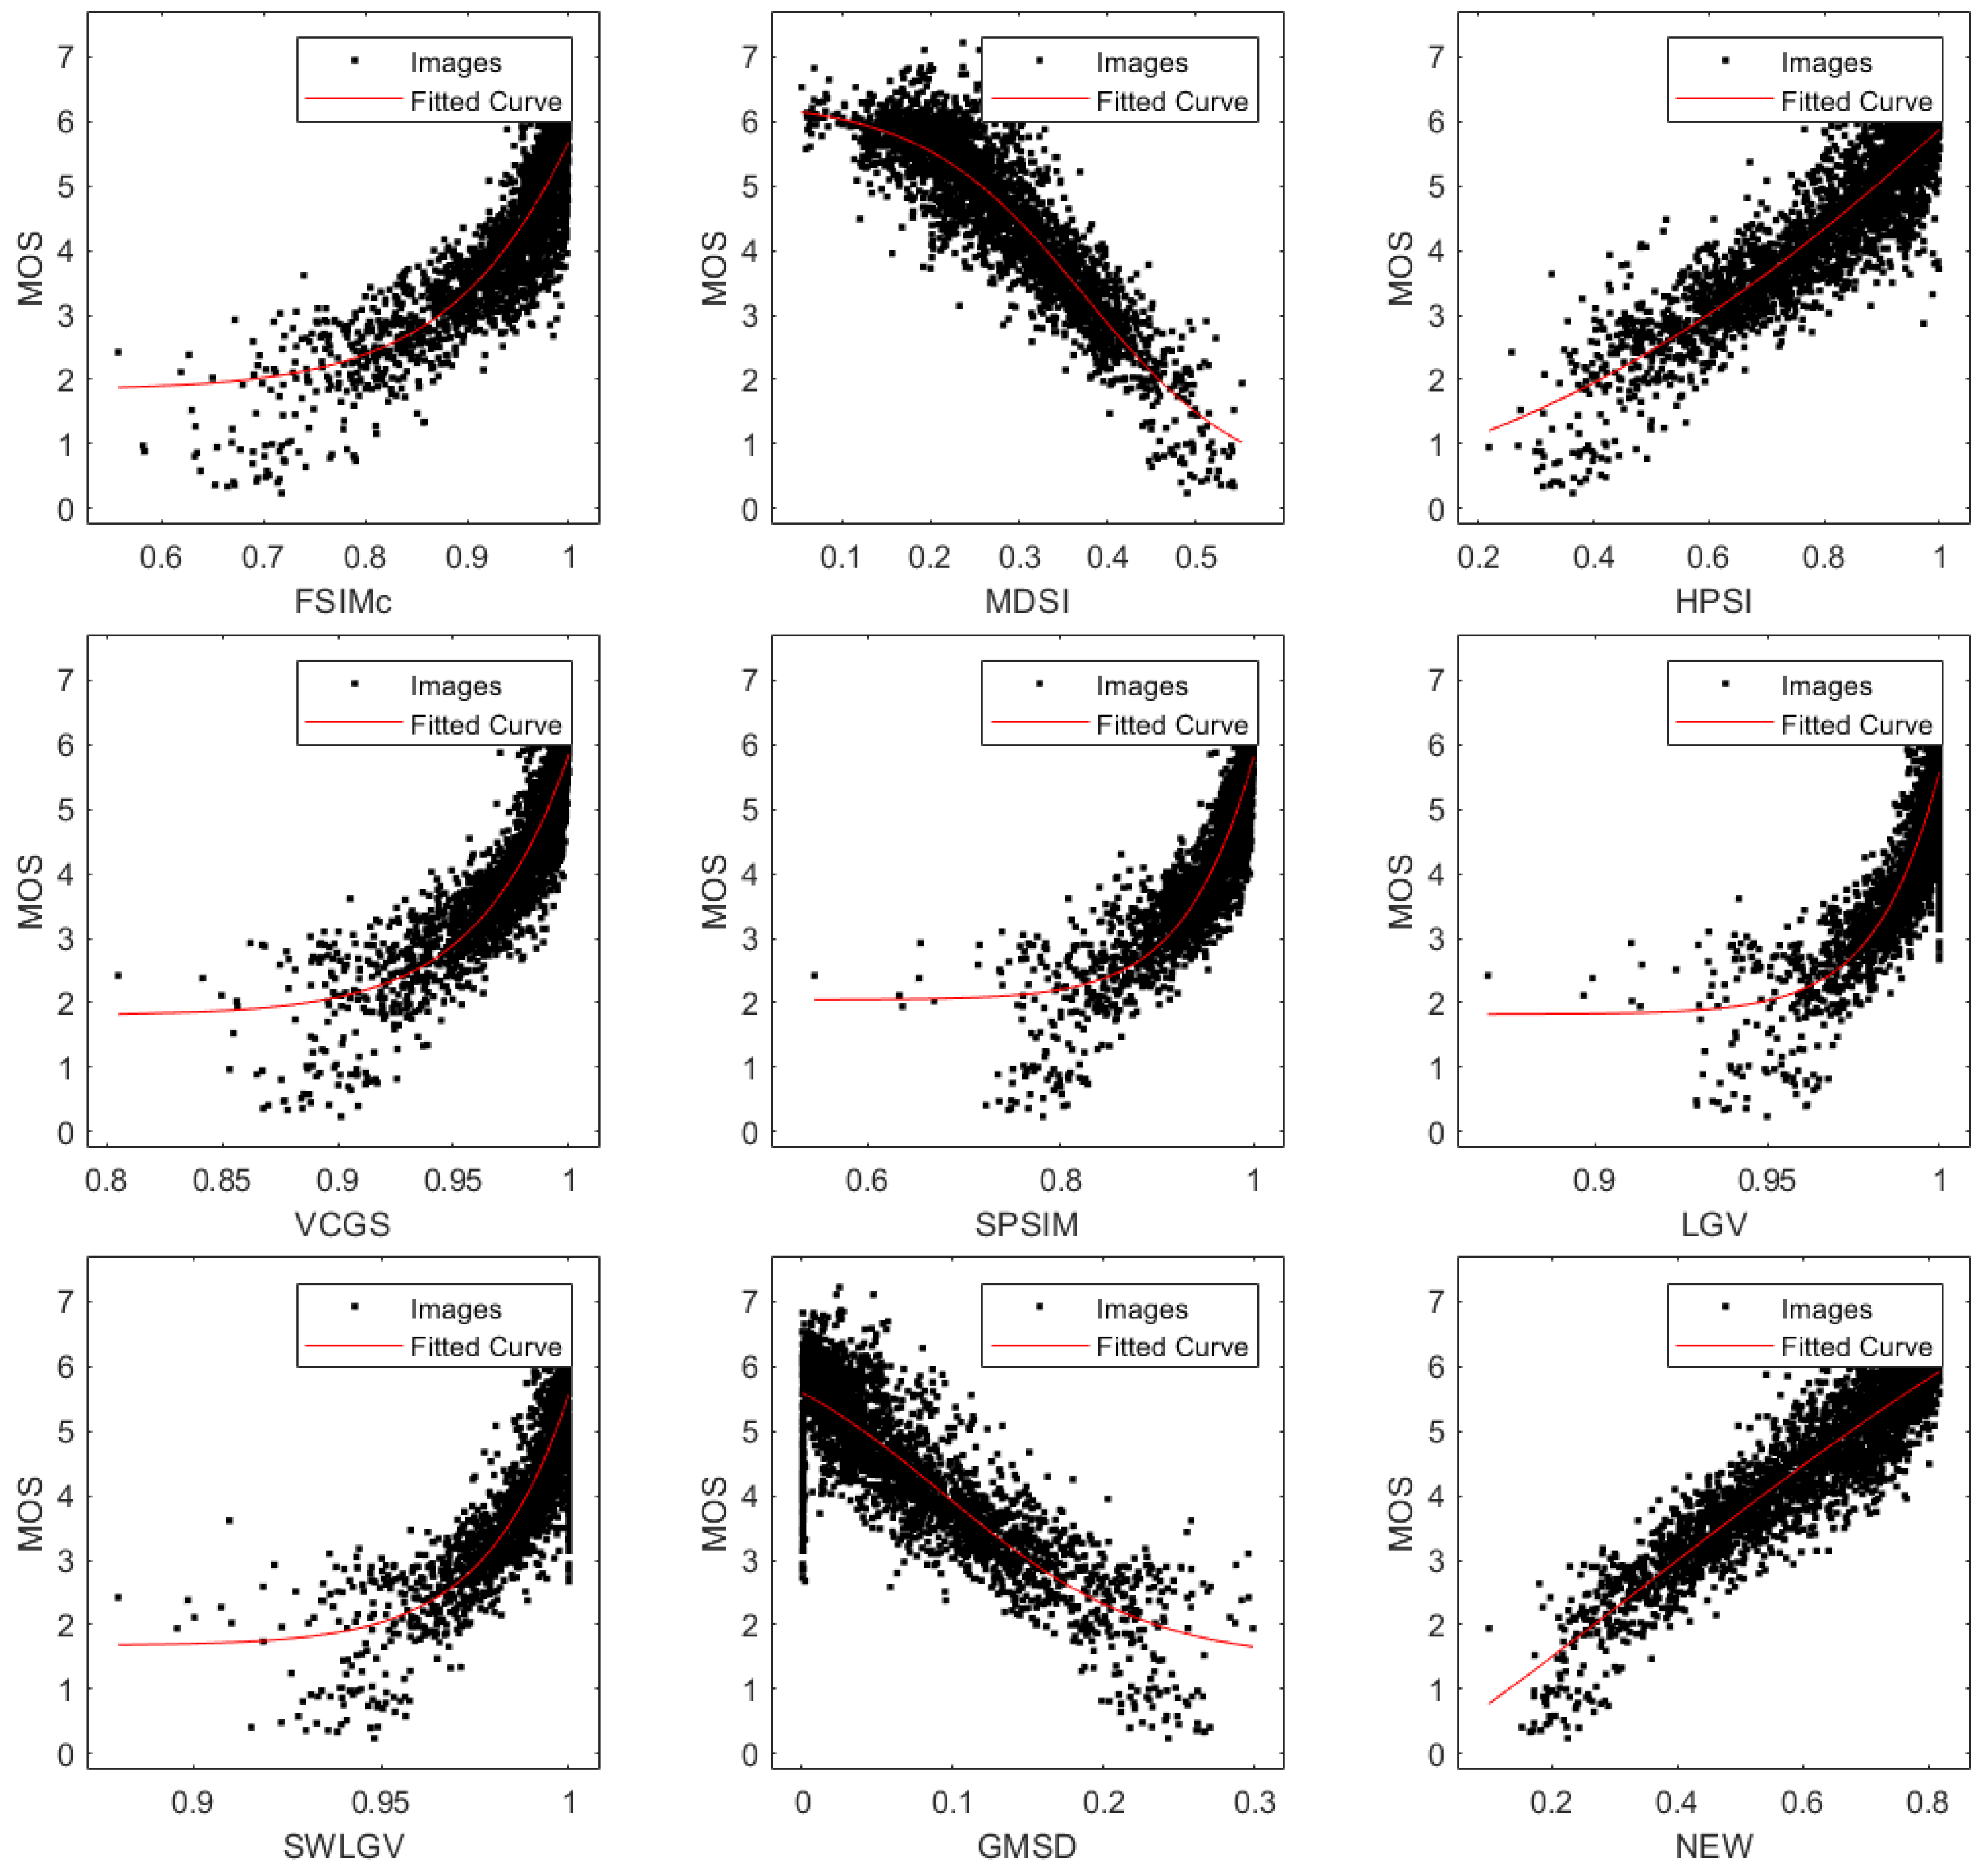
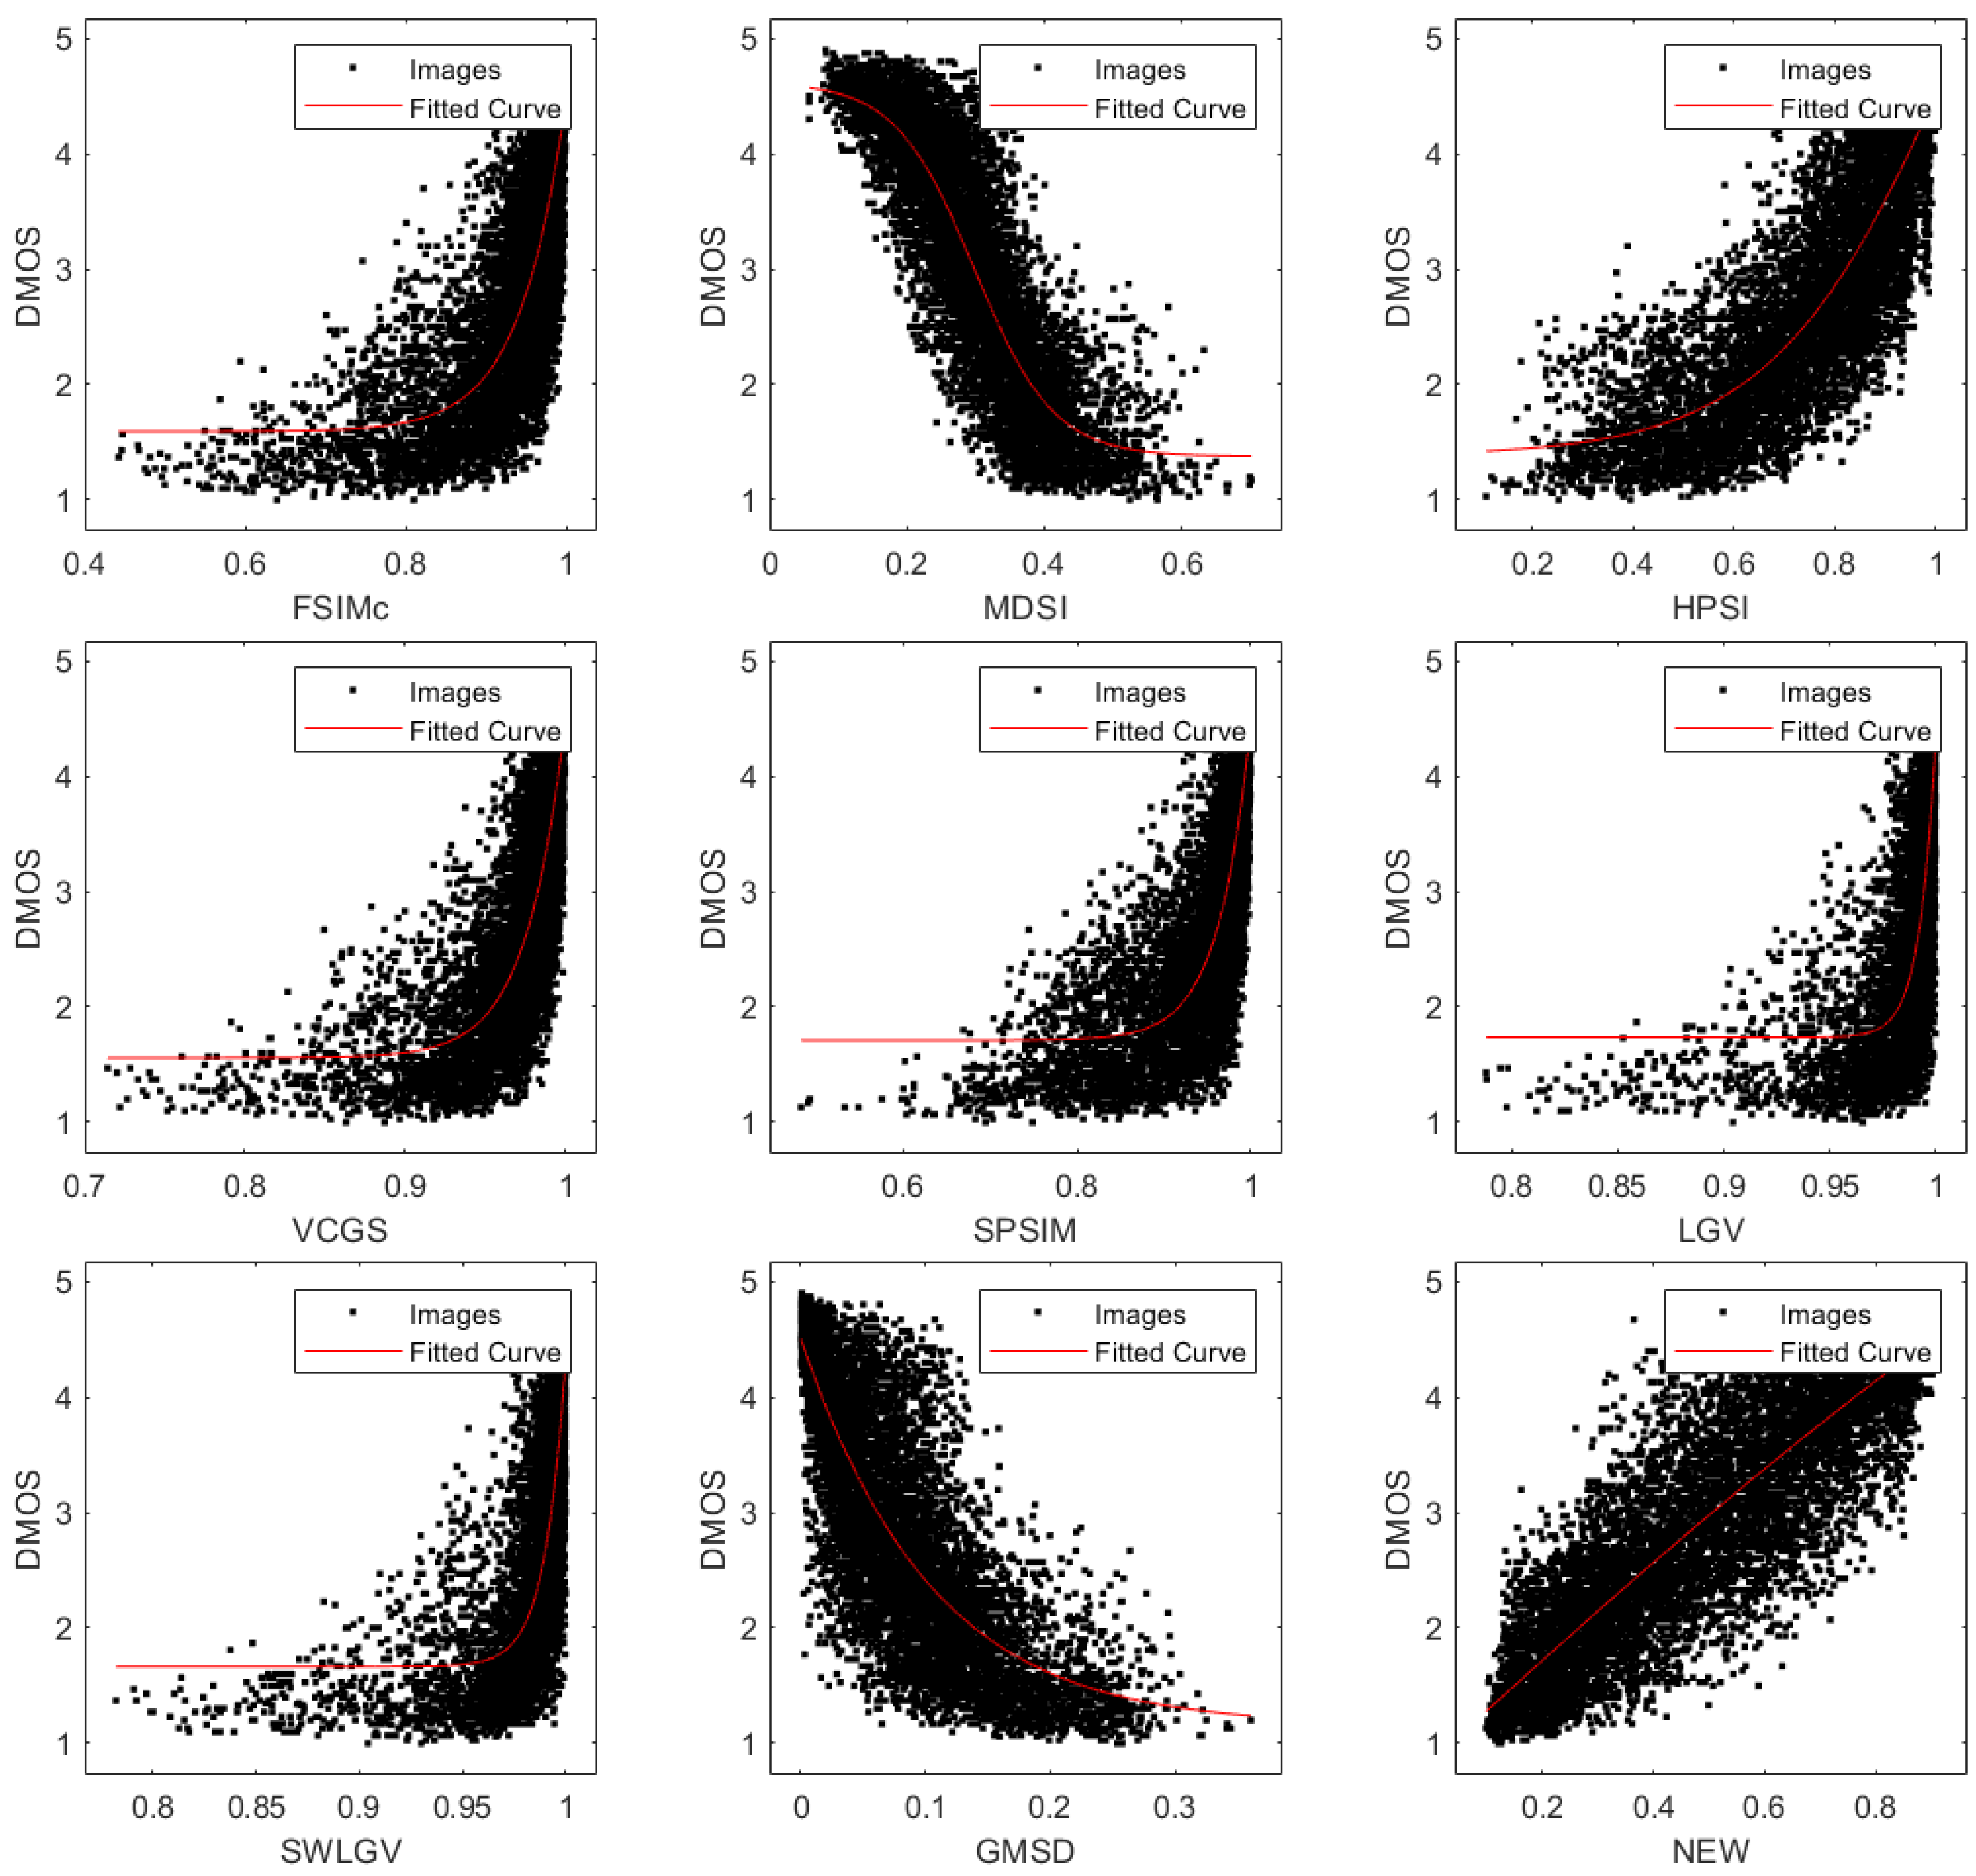
3.1. Selected IQA Databases
3.2. Experimental Tests
4. Conclusions
Author Contributions
Funding
Data Availability Statement
Conflicts of Interest
Abbreviations
| IQA | Image Quality Assessment |
| FR-IQA | Full-Reference Image Quality Assessment |
| MOS | Mean Opinion Score |
| FSIMc | Feature SIMilarity (color version) |
| MDSI | Mean Deviation Similarity Index |
| HPSI | Haar wavelet Perceptual Similarity Index |
| VCGS | Visual saliency with Color appearance and Gradient Similarity |
| SPSIM | SuperPixel SIMilarity |
| LGV | Local Global Variation |
| SWLGV | Saliency Weighted Local Global Variation |
| GMSD | Gradient Magnitude Similarity Deviation |
| NCM | New Combined Metric |
| PSNR | Peak Signal-to-Noise Ratio |
| VSNR | Visual Signal-to-Noise Ratio |
| VIF | Visual Information Fidelity index |
| MS-SSIM | Multi Scale Structural SIMilarity index |
| PLCC | Pearson Linear Correlation Coefficient |
| SROCC | Spearman Rank Order Correlation Coefficient |
| KROCC | Kendall Rank Order Correlation Coefficient |
| RMSE | Root Mean Squared Error |
| SVD | Singular Value Decomposition |
| HVS | Human Visual System |
| DMOS | Differential Mean Opinion Score |
| TID | Tampere Image Database |
| KADID-10k | Konstanz Artificially Distorted Image quality Database |
| PIPAL | Perceptual Image Processing ALgorithms database |
| WFSIMc | Weighted FSIM (color version) index |
| RFSIM | Riesz-transform-based Feature SIMilarity index |
| CQM | Combined Quality Metric |
| CISI | Combined Image Similarity Index |
| LCSIM | Linearly Combined Similarity Measures |
References
- Liu, M.; Yang, X. A new image quality approach based on decision fusion. In Proceedings of the 2008 Fifth International Conference on Fuzzy Systems and Knowledge Discovery, Jinan, China, 18–20 October 2008; Volume 4, pp. 10–14. [Google Scholar]
- Okarma, K. Combined full-reference image quality metric linearly correlated with subjective assessment. In Proceedings of the Artificial Intelligence and Soft Computing: 10th International Conference, ICAISC 2010, Zakopane, Poland, 13–17 June 2010; Part I 10. Springer: Berlin/Heidelberg, Germany, 2010; pp. 539–546. [Google Scholar]
- Okarma, K. Combined image similarity index. Opt. Rev. 2012, 19, 349–354. [Google Scholar] [CrossRef]
- Okarma, K. Extended hybrid image similarity–combined full-reference image quality metric linearly correlated with subjective scores. Elektron. Ir Elektrotech. 2013, 19, 129–132. [Google Scholar] [CrossRef]
- Oszust, M. Full-reference image quality assessment with linear combination of genetically selected quality measures. PLoS ONE 2016, 11, e0158333. [Google Scholar] [CrossRef] [PubMed]
- Lukin, V.; Ponomarenko, N.; Ieremeiev, O.; Egiazarian, K.; Astola, J. Combining full-reference image visual quality metrics by neural network. In Proceedings of the Human Vision and Electronic Imaging XX, San Francisco, CA, USA, 9–12 February 2015; Volume 9394, pp. 172–183. [Google Scholar]
- Bosse, S.; Maniry, D.; Müller, K.R.; Wiegand, T.; Samek, W. Deep neural networks for no-reference and full-reference image quality assessment. IEEE Trans. Image Process. 2017, 27, 206–219. [Google Scholar] [CrossRef] [PubMed]
- Varga, D. A combined full-reference image quality assessment method based on convolutional activation maps. Algorithms 2020, 13, 313. [Google Scholar] [CrossRef]
- Zhang, L.; Zhang, L.; Mou, X.; Zhang, D. FSIM: A feature similarity index for image quality assessment. IEEE Trans. Image Process. 2011, 20, 2378–2386. [Google Scholar] [CrossRef]
- Kovesi, P. Image features from phase congruency. Videre J. Comput. Vis. Res. 1999, 1, 1–26. [Google Scholar]
- Nafchi, H.Z.; Shahkolaei, A.; Hedjam, R.; Cheriet, M. Mean deviation similarity index: Efficient and reliable full-reference image quality evaluator. IEEE Access 2016, 4, 5579–5590. [Google Scholar] [CrossRef]
- Reisenhofer, R.; Bosse, S.; Kutyniok, G.; Wiegand, T. A Haar wavelet-based perceptual similarity index for image quality assessment. Signal Process. Image Commun. 2018, 61, 33–43. [Google Scholar] [CrossRef]
- Shi, C.; Lin, Y. Full Reference Image Quality Assessment Based on Visual Salience with Color Appearance and Gradient Similarity. IEEE Access 2020, 8, 97310–97320. [Google Scholar] [CrossRef]
- Sun, W.; Liao, Q.; Xue, J.H.; Zhou, F. SPSIM: A superpixel-based similarity index for full-reference image quality assessment. IEEE Trans. Image Process. 2018, 27, 4232–4244. [Google Scholar] [CrossRef] [PubMed]
- Stutz, D.; Hermans, A.; Leibe, B. Superpixels: An evaluation of the state-of-the-art. Comput. Vis. Image Underst. 2018, 166, 1–27. [Google Scholar] [CrossRef]
- Achanta, R.; Shaji, A.; Smith, K.; Lucchi, A.; Fua, P.; Süsstrunk, S. SLIC superpixels compared to state-of-the-art superpixel methods. IEEE Trans. Pattern Anal. Mach. Intell. 2012, 34, 2274–2282. [Google Scholar] [CrossRef] [PubMed]
- Varga, D. Full-Reference Image Quality Assessment Based on Grünwald–Letnikov Derivative, Image Gradients, and Visual Saliency. Electronics 2022, 11, 559. [Google Scholar] [CrossRef]
- Imamoglu, N.; Lin, W.; Fang, Y. A saliency detection model using low-level features based on wavelet transform. IEEE Trans. Multimed. 2012, 15, 96–105. [Google Scholar] [CrossRef]
- Xue, W.; Zhang, L.; Mou, X.; Bovik, A.C. Gradient magnitude similarity deviation: A highly efficient perceptual image quality index. IEEE Trans. Image Process. 2013, 23, 684–695. [Google Scholar] [CrossRef]
- Sheikh, H.R.; Sabir, M.F.; Bovik, A.C. A statistical evaluation of recent full reference image quality assessment algorithms. IEEE Trans. Image Process. 2006, 15, 3440–3451. [Google Scholar] [CrossRef]
- Ponomarenko, N.; Lukin, V.; Zelensky, A.; Egiazarian, K.; Carli, M.; Battisti, F. TID2008—A database for evaluation of full-reference visual quality assessment metrics. Adv. Mod. Radioelectron. 2009, 10, 30–45. [Google Scholar]
- Ponomarenko, N.; Jin, L.; Ieremeiev, O.; Lukin, V.; Egiazarian, K.; Astola, J.; Vozel, B.; Chehdi, K.; Carli, M.; Battisti, P.; et al. Image database TID2013: Peculiarities, results and perspectives. Signal Process. Image Commun. 2015, 30, 57–77. [Google Scholar] [CrossRef]
- Lin, H.; Hosu, V.; Saupe, D. KADID-10k: A large-scale artificially distorted IQA database. In Proceedings of the 2019 Eleventh International Conference on Quality of Multimedia Experience (QoMEX), Berlin, Germany, 5–7 June 2019; pp. 1–3. [Google Scholar]
- Gu, J.; Cai, H.; Chen, H.; Ye, X.; Ren, J.; Dong, C. PIPAL: A large-scale image quality assessment dataset for perceptual image restoration. In European Conference on Computer Vision (ECCV); Springer: Cham, Switzerland, 2020; pp. 633–651. [Google Scholar]
- Varga, D. Composition-preserving deep approach to full-reference image quality assessment. Signal Image Video Process. 2020, 14, 1265–1272. [Google Scholar] [CrossRef]
- Merzougui, N.; Djerou, L. Multi-measures fusion based on multi-objective genetic programming, for full-reference image quality assessment. arXiv 2017, arXiv:1801.06030. [Google Scholar]
- Varga, D. An optimization-based family of predictive, fusion-based models for full-reference image quality assessment. J. Imaging 2023, 9, 116. [Google Scholar] [CrossRef]


| No. of | No. of | No. of Dist. | |||
|---|---|---|---|---|---|
| Database | Year | Ref. | Dist. | Environment | Images |
| TID2008 | 2008 | 25 | 17 | lab | 1700 |
| TID2013 | 2013 | 25 | 24 | lab | 3000 |
| KADID-10k | 2019 | 81 | 25 | crowdsourcing | 10,125 |
| PIPAL | 2020 | 250 | 40 | crowdsourcing | 29,000 |
| Database | Metric | FSIMc [9] | MDSI [11] | HPSI [12] | VCGS [13] | SPSIM [14] | LGV [17] | SWLGV [17] | GMSD [19] |
|---|---|---|---|---|---|---|---|---|---|
| TID2008 | PLCC | 0.876 | 0.916 | 0.907 | 0.878 | 0.893 | 0.865 | 0.874 | 0.879 |
| SROCC | 0.884 | 0.921 | 0.910 | 0.897 | 0.910 | 0.881 | 0.889 | 0.891 | |
| KROCC | 0.699 | 0.751 | 0.737 | 0.717 | 0.730 | 0.696 | 0.711 | 0.709 | |
| RMSE | 0.647 | 0.538 | 0.566 | 0.643 | 0.605 | 0.674 | 0.652 | 0.640 | |
| TID2013 | PLCC | 0.877 | 0.909 | 0.893 | 0.900 | 0.909 | 0.778 | 0.797 | 0.855 |
| SROCC | 0.851 | 0.890 | 0.873 | 0.893 | 0.904 | 0.807 | 0.807 | 0.804 | |
| KROCC | 0.667 | 0.712 | 0.692 | 0.717 | 0.725 | 0.638 | 0.641 | 0.634 | |
| RMSE | 0.596 | 0.518 | 0.557 | 0.541 | 0.517 | 0.779 | 0.749 | 0.642 | |
| KADID-10k | PLCC | 0.851 | 0.864 | 0.885 | 0.868 | 0.874 | 0.815 | 0.835 | 0.805 |
| SROCC | 0.854 | 0.885 | 0.885 | 0.871 | 0.874 | 0.820 | 0.840 | 0.847 | |
| KROCC | 0.665 | 0.702 | 0.699 | 0.683 | 0.687 | 0.630 | 0.655 | 0.664 | |
| RMSE | 0.568 | 0.544 | 0.505 | 0.538 | 0.525 | 0.627 | 0.595 | 0.643 | |
| PIPAL | PLCC | 0.615 | 0.598 | 0.641 | 0.554 | 0.578 | 0.529 | 0.543 | 0.629 |
| SROCC | 0.589 | 0.585 | 0.589 | 0.534 | 0.562 | 0.519 | 0.536 | 0.583 | |
| KROCC | 0.416 | 0.408 | 0.417 | 0.370 | 0.391 | 0.359 | 0.372 | 0.414 | |
| RMSE | 0.104 | 0.106 | 0.101 | 0.110 | 0.108 | 0.112 | 0.111 | 0.103 |
| Database | Metric | FSIMc [9] | MDSI [11] | HPSI [12] | VCGS [13] | SPSIM [14] | LGV [17] | SWLGV [17] | GMSD [19] |
|---|---|---|---|---|---|---|---|---|---|
| TID2008 | PLCC | 3 | 8 | 7 | 4 | 6 | 1 | 2 | 5 |
| SROCC | 2 | 8 | 6 | 5 | 7 | 1 | 3 | 4 | |
| KROCC | 2 | 8 | 7 | 5 | 6 | 1 | 4 | 3 | |
| RMSE | 3 | 8 | 7 | 4 | 6 | 1 | 2 | 5 | |
| TOTAL | 10 | 32 | 27 | 18 | 25 | 4 | 11 | 17 | |
| TID2013 | PLCC | 4 | 7 | 5 | 6 | 8 | 1 | 2 | 3 |
| SROCC | 4 | 6 | 5 | 7 | 8 | 3 | 2 | 1 | |
| KROCC | 4 | 6 | 5 | 7 | 8 | 2 | 3 | 1 | |
| RMSE | 4 | 7 | 5 | 6 | 8 | 1 | 2 | 3 | |
| TOTAL | 16 | 26 | 20 | 26 | 32 | 7 | 9 | 8 | |
| KADID-10k | PLCC | 4 | 5 | 8 | 6 | 7 | 2 | 3 | 1 |
| SROCC | 4 | 8 | 7 | 5 | 6 | 1 | 2 | 3 | |
| KROCC | 4 | 8 | 7 | 5 | 6 | 1 | 2 | 3 | |
| RMSE | 4 | 5 | 8 | 6 | 7 | 2 | 3 | 1 | |
| TOTAL | 16 | 26 | 30 | 22 | 26 | 6 | 10 | 8 | |
| PIPAL | PLCC | 6 | 5 | 8 | 3 | 4 | 1 | 2 | 7 |
| SROCC | 8 | 6 | 7 | 2 | 4 | 1 | 3 | 5 | |
| KROCC | 7 | 5 | 8 | 2 | 4 | 1 | 3 | 6 | |
| RMSE | 6 | 5 | 8 | 3 | 4 | 1 | 2 | 7 | |
| TOTAL | 27 | 21 | 31 | 10 | 16 | 4 | 10 | 25 |
| Criterion: | Three Best | Three Fast | |||
|---|---|---|---|---|---|
| Database | Weight | Value | Metrics | Value | Metrics |
| TID2008 | 0.578 | MDSI [11] | 0.618 | MDSI [11] | |
| 0.285 | HPSI [12] | 0.372 | HPSI [12] | ||
| 0.136 | SPSIM [14] | 0.010 | GMSD [19] | ||
| TID2013 | 0.459 | MDSI [11] | 0.680 | MDSI [11] | |
| 0.086 | VCGS [13] | 0.310 | HPSI [12] | ||
| 0.455 | SPSIM [14] | 0.010 | GMSD [19] | ||
| KADID-10k | 0.386 | MDSI [11] | 0.342 | MDSI [11] | |
| 0.404 | HPSI [12] | 0.486 | HPSI [12] | ||
| 0.210 | SPSIM [14] | 0.172 | GMSD [19] | ||
| PIPAL | 0.320 | FSIMc [9] | 0.317 | MDSI [11] | |
| 0.507 | HPSI [12] | 0.584 | HPSI [12] | ||
| 0.174 | GMSD [19] | 0.099 | GMSD [19] | ||
| Db. | Met. | FSIMc [9] | MDSI [11] | HPSI [12] | VCGS [13] | SPSIM [14] | LGV [17] | SWLGV [17] | GMSD [19] | NCM | , , |
|---|---|---|---|---|---|---|---|---|---|---|---|
| TID2008 | PLCC | 0.876 | 0.916 | 0.907 | 0.878 | 0.893 | 0.865 | 0.874 | 0.879 | 0.924 | SPSIM [14] |
| SROCC | 0.884 | 0.921 | 0.910 | 0.897 | 0.910 | 0.881 | 0.889 | 0.891 | 0.924 | MDSI [11] | |
| KROCC | 0.699 | 0.751 | 0.737 | 0.717 | 0.730 | 0.696 | 0.711 | 0.709 | 0.759 | HPSI [12] | |
| RMSE | 0.647 | 0.538 | 0.566 | 0.643 | 0.605 | 0.674 | 0.652 | 0.640 | 0.514 | ||
| TID2013 | PLCC | 0.877 | 0.909 | 0.893 | 0.900 | 0.909 | 0.778 | 0.797 | 0.855 | 0.922 | SPSIM [14] |
| SROCC | 0.851 | 0.890 | 0.873 | 0.893 | 0.904 | 0.807 | 0.807 | 0.804 | 0.906 | MDSI [11] | |
| KROCC | 0.667 | 0.712 | 0.692 | 0.717 | 0.725 | 0.638 | 0.641 | 0.634 | 0.732 | VCGS [13] | |
| RMSE | 0.596 | 0.518 | 0.557 | 0.541 | 0.517 | 0.779 | 0.749 | 0.642 | 0.481 | ||
| KADID-10k | PLCC | 0.851 | 0.864 | 0.885 | 0.868 | 0.874 | 0.815 | 0.835 | 0.805 | 0.896 | SPSIM [14] |
| SROCC | 0.854 | 0.885 | 0.885 | 0.871 | 0.874 | 0.820 | 0.840 | 0.847 | 0.897 | MDSI [11] | |
| KROCC | 0.665 | 0.702 | 0.699 | 0.683 | 0.687 | 0.630 | 0.655 | 0.664 | 0.717 | HPSI [12] | |
| RMSE | 0.568 | 0.544 | 0.505 | 0.538 | 0.525 | 0.627 | 0.595 | 0.643 | 0.480 | ||
| PIPAL | PLCC | 0.615 | 0.598 | 0.641 | 0.554 | 0.577 | 0.529 | 0.543 | 0.629 | 0.653 | GMSD [19] |
| SROCC | 0.589 | 0.585 | 0.589 | 0.534 | 0.562 | 0.519 | 0.536 | 0.583 | 0.608 | FSIMc [9] | |
| KROCC | 0.416 | 0.408 | 0.417 | 0.370 | 0.391 | 0.359 | 0.372 | 0.414 | 0.432 | HPSI [12] | |
| RMSE | 0.104 | 0.106 | 0.101 | 0.110 | 0.108 | 0.112 | 0.111 | 0.103 | 0.100 |
| Database | FSIMc [9] | MDSI [11] | HPSI [12] | VCGS [13] | SPSIM [14] | LGV [17] | SWLGV [17] | GMSD [19] |
|---|---|---|---|---|---|---|---|---|
| TID2008 | 0.089 | 0.014 | 0.028 | 0.212 | 0.128 | 0.435 | 5.986 | 0.019 |
| TID2013 | 0.104 | 0.016 | 0.037 | 0.214 | 0.113 | 0.339 | 6.130 | 0.019 |
| KADID-10k | 0.136 | 0.026 | 0.046 | 0.299 | 0.143 | 0.451 | 5.890 | 0.028 |
| PIPAL | 0.172 | 0.011 | 0.012 | 0.091 | 0.176 | 0.619 | 2.628 | 0.009 |
| Db. | Met. | FSIMc [9] | MDSI [11] | HPSI [12] | VCGS [13] | SPSIM [14] | LGV [17] | SWLGV [17] | GMSD [19] | NCM | , , |
|---|---|---|---|---|---|---|---|---|---|---|---|
| TID2008 | PLCC | 0.876 | 0.916 | 0.907 | 0.878 | 0.893 | 0.865 | 0.874 | 0.879 | 0.922 | GMSD |
| SROCC | 0.884 | 0.921 | 0.910 | 0.897 | 0.910 | 0.881 | 0.889 | 0.891 | 0.923 | MDSI | |
| KROCC | 0.699 | 0.751 | 0.737 | 0.717 | 0.730 | 0.696 | 0.711 | 0.709 | 0.757 | HPSI | |
| RMSE | 0.647 | 0.538 | 0.566 | 0.643 | 0.605 | 0.674 | 0.652 | 0.640 | 0.519 | ||
| TID2013 | PLCC | 0.877 | 0.909 | 0.893 | 0.900 | 0.909 | 0.778 | 0.797 | 0.855 | 0.912 | GMSD |
| SROCC | 0.851 | 0.890 | 0.873 | 0.893 | 0.904 | 0.807 | 0.807 | 0.804 | 0.892 | MDSI | |
| KROCC | 0.667 | 0.712 | 0.692 | 0.717 | 0.725 | 0.638 | 0.641 | 0.634 | 0.716 | HPSI | |
| RMSE | 0.596 | 0.518 | 0.557 | 0.541 | 0.517 | 0.779 | 0.749 | 0.642 | 0.508 | ||
| KADID-10k | PLCC | 0.851 | 0.864 | 0.885 | 0.868 | 0.874 | 0.815 | 0.835 | 0.805 | 0.897 | GMSD |
| SROCC | 0.854 | 0.885 | 0.885 | 0.871 | 0.874 | 0.820 | 0.840 | 0.847 | 0.897 | MDSI | |
| KROCC | 0.665 | 0.702 | 0.699 | 0.683 | 0.687 | 0.630 | 0.655 | 0.664 | 0.719 | HPSI | |
| RMSE | 0.568 | 0.544 | 0.505 | 0.538 | 0.525 | 0.627 | 0.595 | 0.643 | 0.479 | ||
| PIPAL | PLCC | 0.615 | 0.598 | 0.641 | 0.554 | 0.577 | 0.529 | 0.543 | 0.629 | 0.655 | GMSD |
| SROCC | 0.589 | 0.585 | 0.589 | 0.534 | 0.562 | 0.519 | 0.536 | 0.583 | 0.608 | MDSI | |
| KROCC | 0.416 | 0.408 | 0.417 | 0.370 | 0.391 | 0.359 | 0.372 | 0.414 | 0.432 | HPSI | |
| RMSE | 0.104 | 0.106 | 0.101 | 0.110 | 0.108 | 0.112 | 0.111 | 0.103 | 0.100 |
| Processor | Intel(R) Core(TM) i5-7400 CPU @ 3.00 GHz (4 cores) |
| RAM | 32 GB |
| OS | Windows 10 |
| Env. | Matlab 2024a |
| Database | Metric | MFMOGP3 [26] | MFMOGP4 [26] | OFIQA [27] | NCM |
|---|---|---|---|---|---|
| TID2008 | PLCC | 0.925 | 0.902 | 0.910 | 0.922 |
| SROCC | 0.923 | 0.911 | 0.915 | 0.923 | |
| KROCC | 0.757 | 0.727 | 0.738 | 0.757 | |
| RMSE | 0.511 | 0.580 | 0.557 | 0.519 | |
| TID2013 | PLCC | 0.883 | 0.914 | 0.906 | 0.922 |
| SROCC | 0.868 | 0.902 | 0.890 | 0.923 | |
| KROCC | 0.688 | 0.725 | 0.713 | 0.757 | |
| RMSE | 0.581 | 0.503 | 0.526 | 0.519 |
Disclaimer/Publisher’s Note: The statements, opinions and data contained in all publications are solely those of the individual author(s) and contributor(s) and not of MDPI and/or the editor(s). MDPI and/or the editor(s) disclaim responsibility for any injury to people or property resulting from any ideas, methods, instructions or products referred to in the content. |
© 2024 by the authors. Licensee MDPI, Basel, Switzerland. This article is an open access article distributed under the terms and conditions of the Creative Commons Attribution (CC BY) license (https://creativecommons.org/licenses/by/4.0/).
Share and Cite
Frackiewicz, M.; Machalica, Ł.; Palus, H. New Combined Metric for Full-Reference Image Quality Assessment. Symmetry 2024, 16, 1622. https://doi.org/10.3390/sym16121622
Frackiewicz M, Machalica Ł, Palus H. New Combined Metric for Full-Reference Image Quality Assessment. Symmetry. 2024; 16(12):1622. https://doi.org/10.3390/sym16121622
Chicago/Turabian StyleFrackiewicz, Mariusz, Łukasz Machalica, and Henryk Palus. 2024. "New Combined Metric for Full-Reference Image Quality Assessment" Symmetry 16, no. 12: 1622. https://doi.org/10.3390/sym16121622
APA StyleFrackiewicz, M., Machalica, Ł., & Palus, H. (2024). New Combined Metric for Full-Reference Image Quality Assessment. Symmetry, 16(12), 1622. https://doi.org/10.3390/sym16121622