Abstract
Solar radiation data play a pivotal role in harnessing solar energy. Unfortunately, the availability of these data is limited due to the sparse distribution of meteorological stations worldwide. This paper introduces and simulates three models designed for estimating and predicting global solar radiation at ground level. Furthermore, it conducts an in-depth analysis and comparison of the simulation results derived from these models, utilizing measured data from selected sites in Algeria where such information is accessible. The focus of our study revolves around three empirical models: Capderou, Lacis and Hansen, and Liu and Jordan. These models utilize day number and solar factor as input parameters, along with the primary site’s geographical coordinates—longitude, latitude, and altitude. Additionally, meteorological parameters such as relative humidity, temperature, and pressure are incorporated into the models. The objective is to estimate global solar radiation for any given day throughout the year at the specified location. Upon simulation, the results highlight that the Capderou model exhibits superior accuracy in approximating solar components, demonstrating negligible deviations between real and estimated values, especially under clear-sky conditions. However, these models exhibit certain limitations in adverse weather conditions. Consequently, alternative approaches, such as fuzzy logic methods or models based on satellite imagery, become essential for accurate predictions in inclement weather scenarios.
1. Introduction
1.1. Motivations
Photovoltaic panels (PV) stand as groundbreaking devices, tapping into solar energy to generate electricity. The widespread adoption of solar energy has surged due to its global abundance and accessibility. However, the implementation of photovoltaic (PV) system-based electrical networks encounters two significant challenges. The first pertains to the failures of PV systems and their ensuing economic implications. In reference to [1], a comprehensive review on the maintenance and analysis of PV system failures was conducted to evaluate the techno-economic performance of photovoltaic installations. The second challenge lies in the sporadic nature of solar irradiance, posing a hurdle to the reliability of PV systems. Hence, precise solar irradiance data are imperative to ensure consistent energy output [2,3,4,5,6].
Indeed, information regarding solar radiation availability is a prerequisite for the development of any solar energy system or the assessment of solar energy potential in a specific location. While solar radiation on the Earth’s surface can be theoretically calculated under clear-sky conditions, the challenge intensifies in overcast or partially cloudy areas. In such circumstances, environmental factors such as temperature, humidity, pressure, altitude, latitude, and longitude of the site become crucial in determining long-term averages of global irradiation on a horizontal surface [7,8,9,10,11,12,13,14,15].
In countries like Algeria, the insufficient coverage of meteorological stations across the vast expanse of the country poses a challenge in obtaining comprehensive solar irradiation measurements (see Appendix A). Moreover, not all meteorological stations measure solar radiation. Consequently, the utilization of models capable of calculating and estimating solar radiation components at ground level proves indispensable in such countries.
1.2. State of the Art
The anticipation of solar irradiance has become a focal point of significant attention and research across various interconnected domains [13]. The determination of global solar radiation stands as the primary and pivotal step in PV power prediction systems. Forecasting models are categorized based on the input data they employ, influencing the forecast horizon. The exploration into the estimation and forecasting of solar radiation components at ground level traces back to Liu and Jordan [16] in 1960. Their model, relying solely on coefficients characterizing the state of the sky, paved the way. Subsequently, in 1974, Lacis and Hansen [17] introduced a model incorporating meteorological parameters, such as humidity and temperature, for calculating the extinction coefficients of various atmospheric constituents (water vapor, ozone, aerosols, etc.) to determine solar radiation components at ground level. Models developed by Bird and Hulstrom [18], Paltridge and Platt [19], Atwater and Ball [20], Perez et al. [21], and Muneer et al. [22] further expanded on this foundation, extending the applicability to inclined surfaces. These models have garnered widespread usage and validation globally, yielding satisfactory results in estimating solar radiation at ground level. For instance, Muneer’s model demonstrated success in Bahrain, Spain, India, Japan, and the UK.
However, a notable limitation lies in their validity only under clear-sky conditions. This limitation prompts the necessity to devise additional mathematical models for solar radiation based on meteorological data, enabling the estimation of global radiation at ground level under varying sky conditions. Over the years, numerous studies have been conducted, and ongoing research persists to precisely quantify solar deposition. Capderou [23] and Brichambaut [24] introduced a model utilizing the turbidity factor of LINKE to calculate the global solar radiation component received on the horizontal plane. This model facilitates a comparison between the real atmosphere and an ideal atmosphere with only Rayleigh scattering by nitrogen and oxygen molecules, along with ozone absorption. The turbidity factor’s value is contingent on the geographical area (rural or urban) and exhibits significant seasonal variations. Understanding this factor’s value becomes crucial in determining solar radiation for any sky state. Maghouchi et al. [25,26] delved into the development and assessment of ten models to calculate global solar radiation in Tetuan city, situated in the northern part of Morocco near Algeria. Their findings unveiled variations in the accuracy of the studied models, suggesting certain models are more suitable for estimating solar radiation at the specific site under investigation.
1.3. Contribution
In this work, our focus revolves around the implementation, simulation, analysis, and comparison of three models: Liu and Jordan, Lacis and Hansen, and Capderou. The objective is to assess their estimation performance in Algerian sites concerning global solar radiation. These models leverage specific geographic coordinates, including the altitude, longitude, and latitude of the site, along with radiometric parameters such as humidity and temperature, to estimate global solar radiation on a horizontal surface. Furthermore, the obtained results from these models are rigorously evaluated and discussed in comparison with provided measurements, employing various statistical parameters.
1.4. Methodology
This paper comprises six sections. Section 2 elucidates various astronomical parameters pertinent to solar radiation models. In Section 3, we expound upon the models employed for estimating global solar radiation. Section 4 is dedicated to the materials utilized in the measurement of global solar radiation. Section 5 delineates statistical error parameters. Moving on to Section 6, we present the results and engage in a comprehensive discussion of the models. The paper culminates with a succinct general conclusion.
2. Astronomical Parameters
In this section, all astronomical parameters used in models for estimating and predicting global solar radiation at ground level are presented.
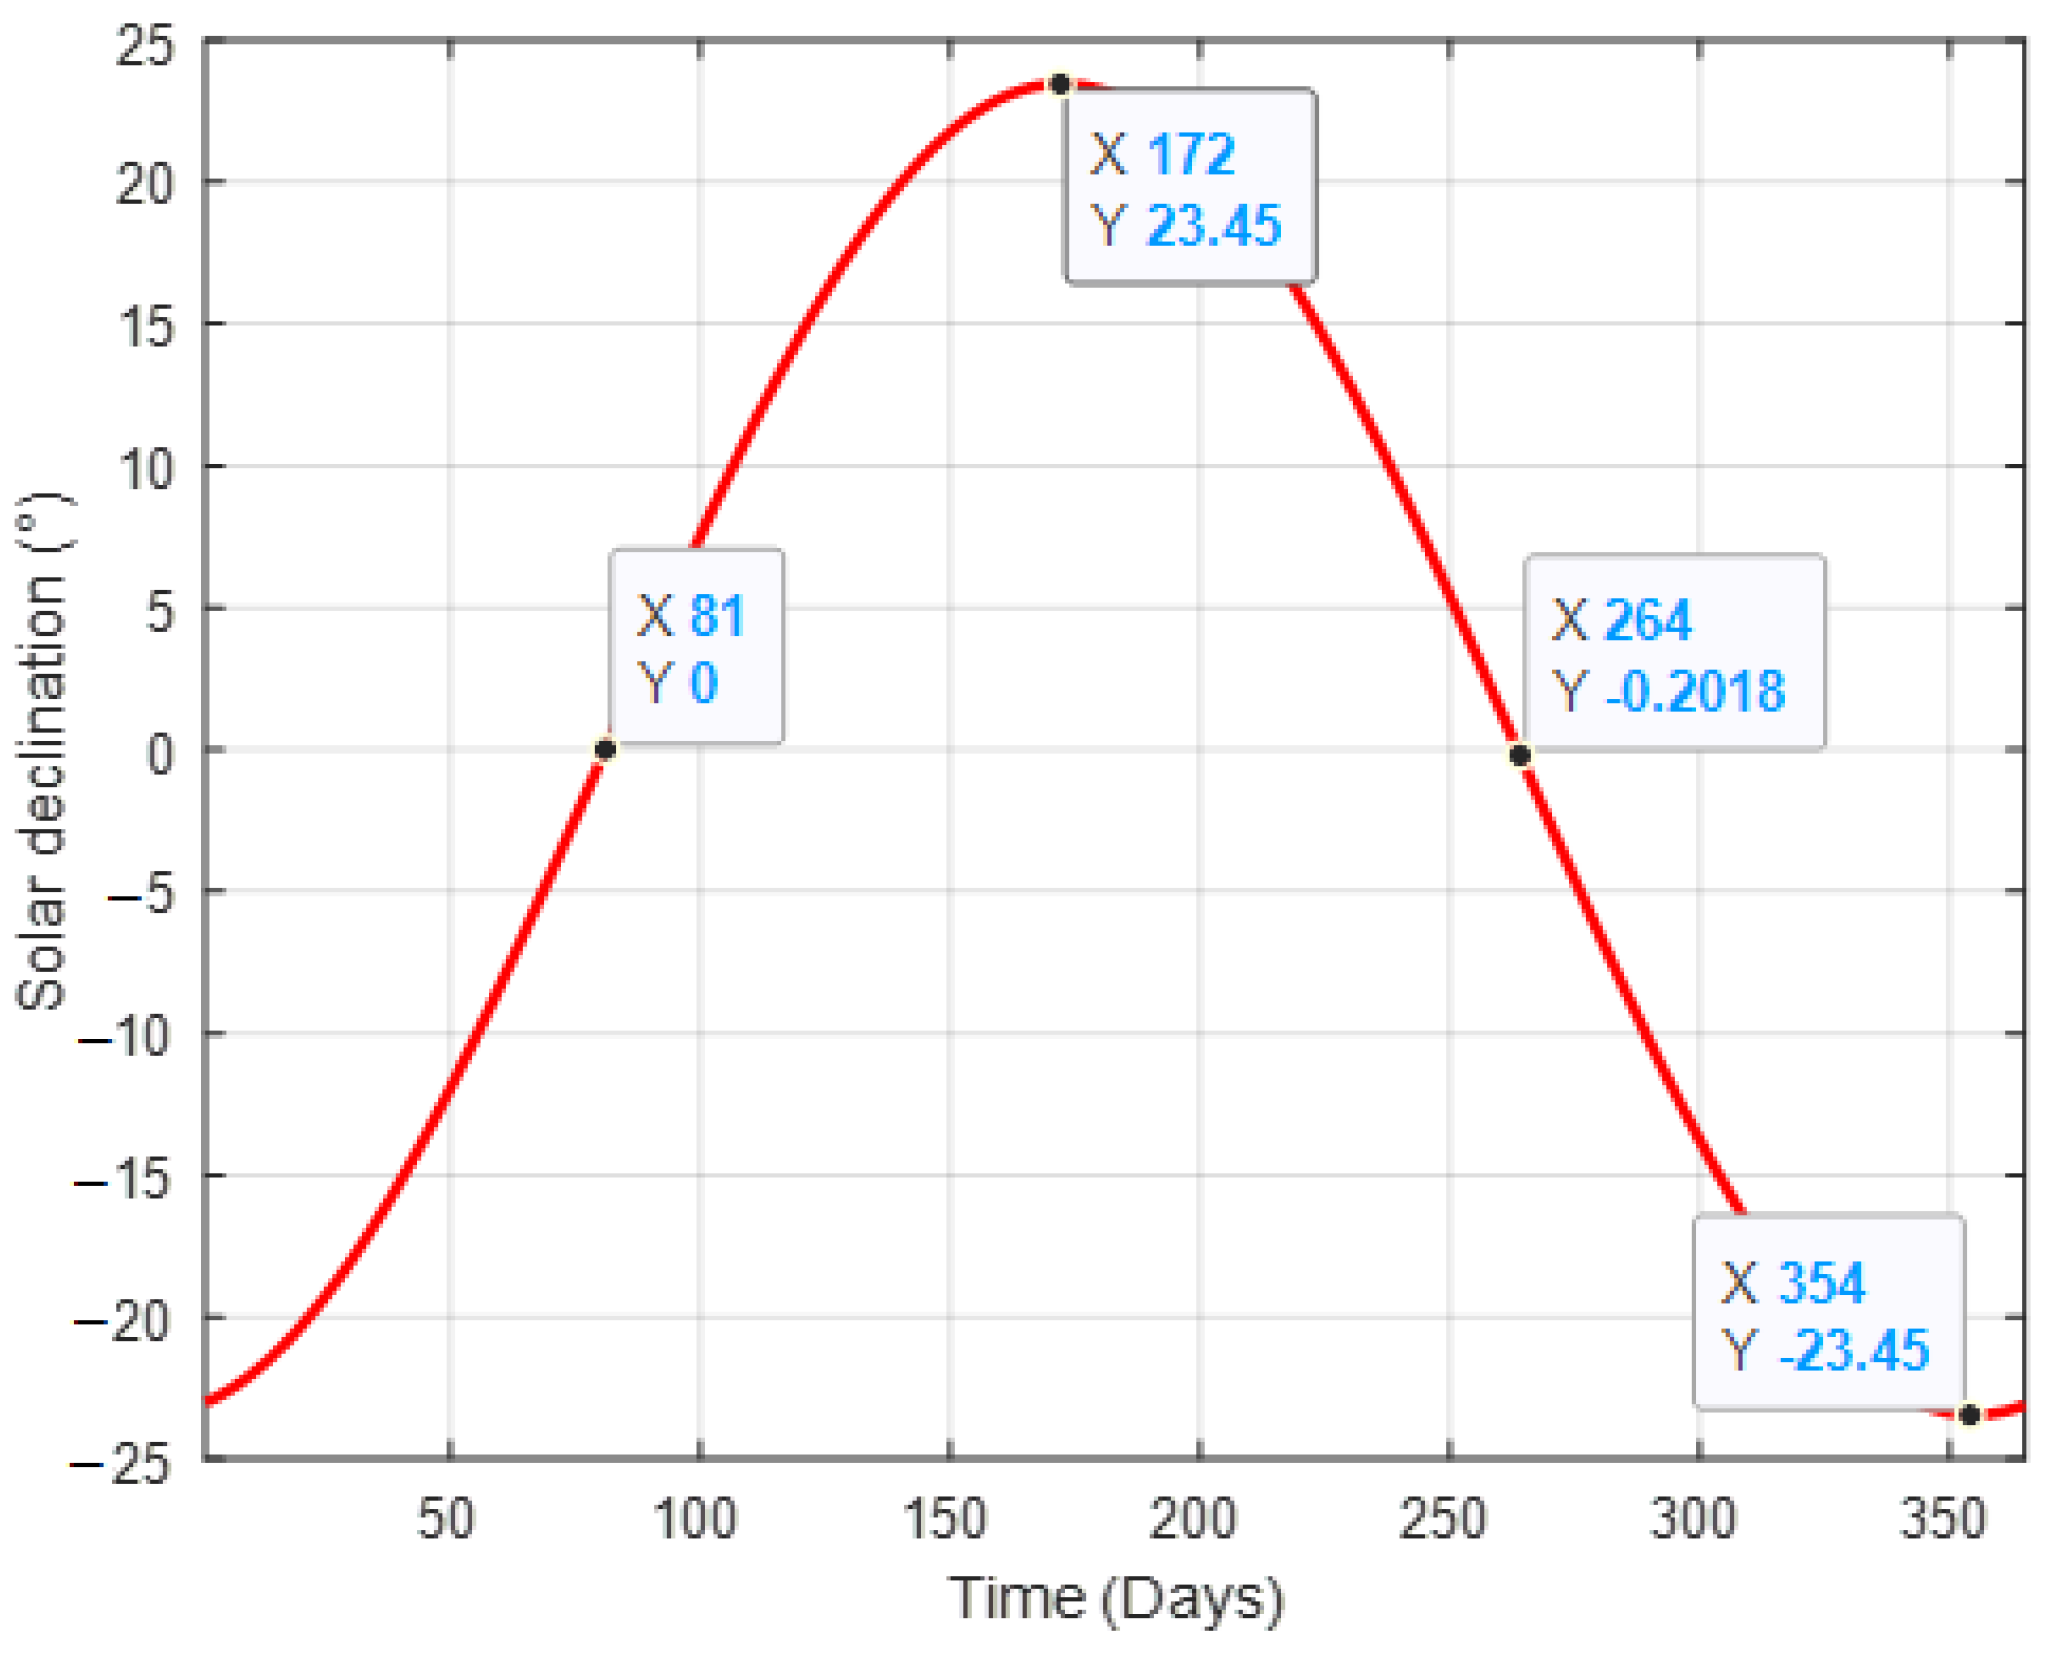
2.1. Solar Declination
Solar declination stands for the angle between the Sun’s direction and its projection on an equatorial plane [7,13,16]; it is calculated using Equation (1):
is the day number of the year varying from 1 (1 January) to 365 (31 December).
The solar declination is equal to 0 on 21 March and 21 September (spring and autumn equinoxes); its value is minimal at 21 December (winter solstice), −23.45°, and maximal at 21 June (summer solstice), 23.45°.
Figure 1 shows symmetrical behavior with respect to the ordinate axis centered at the 172nd day (21 June), which is validated for example on 21 March and 21 September where the value of solar declination is zero.

Figure 1.
Variation in solar declination.
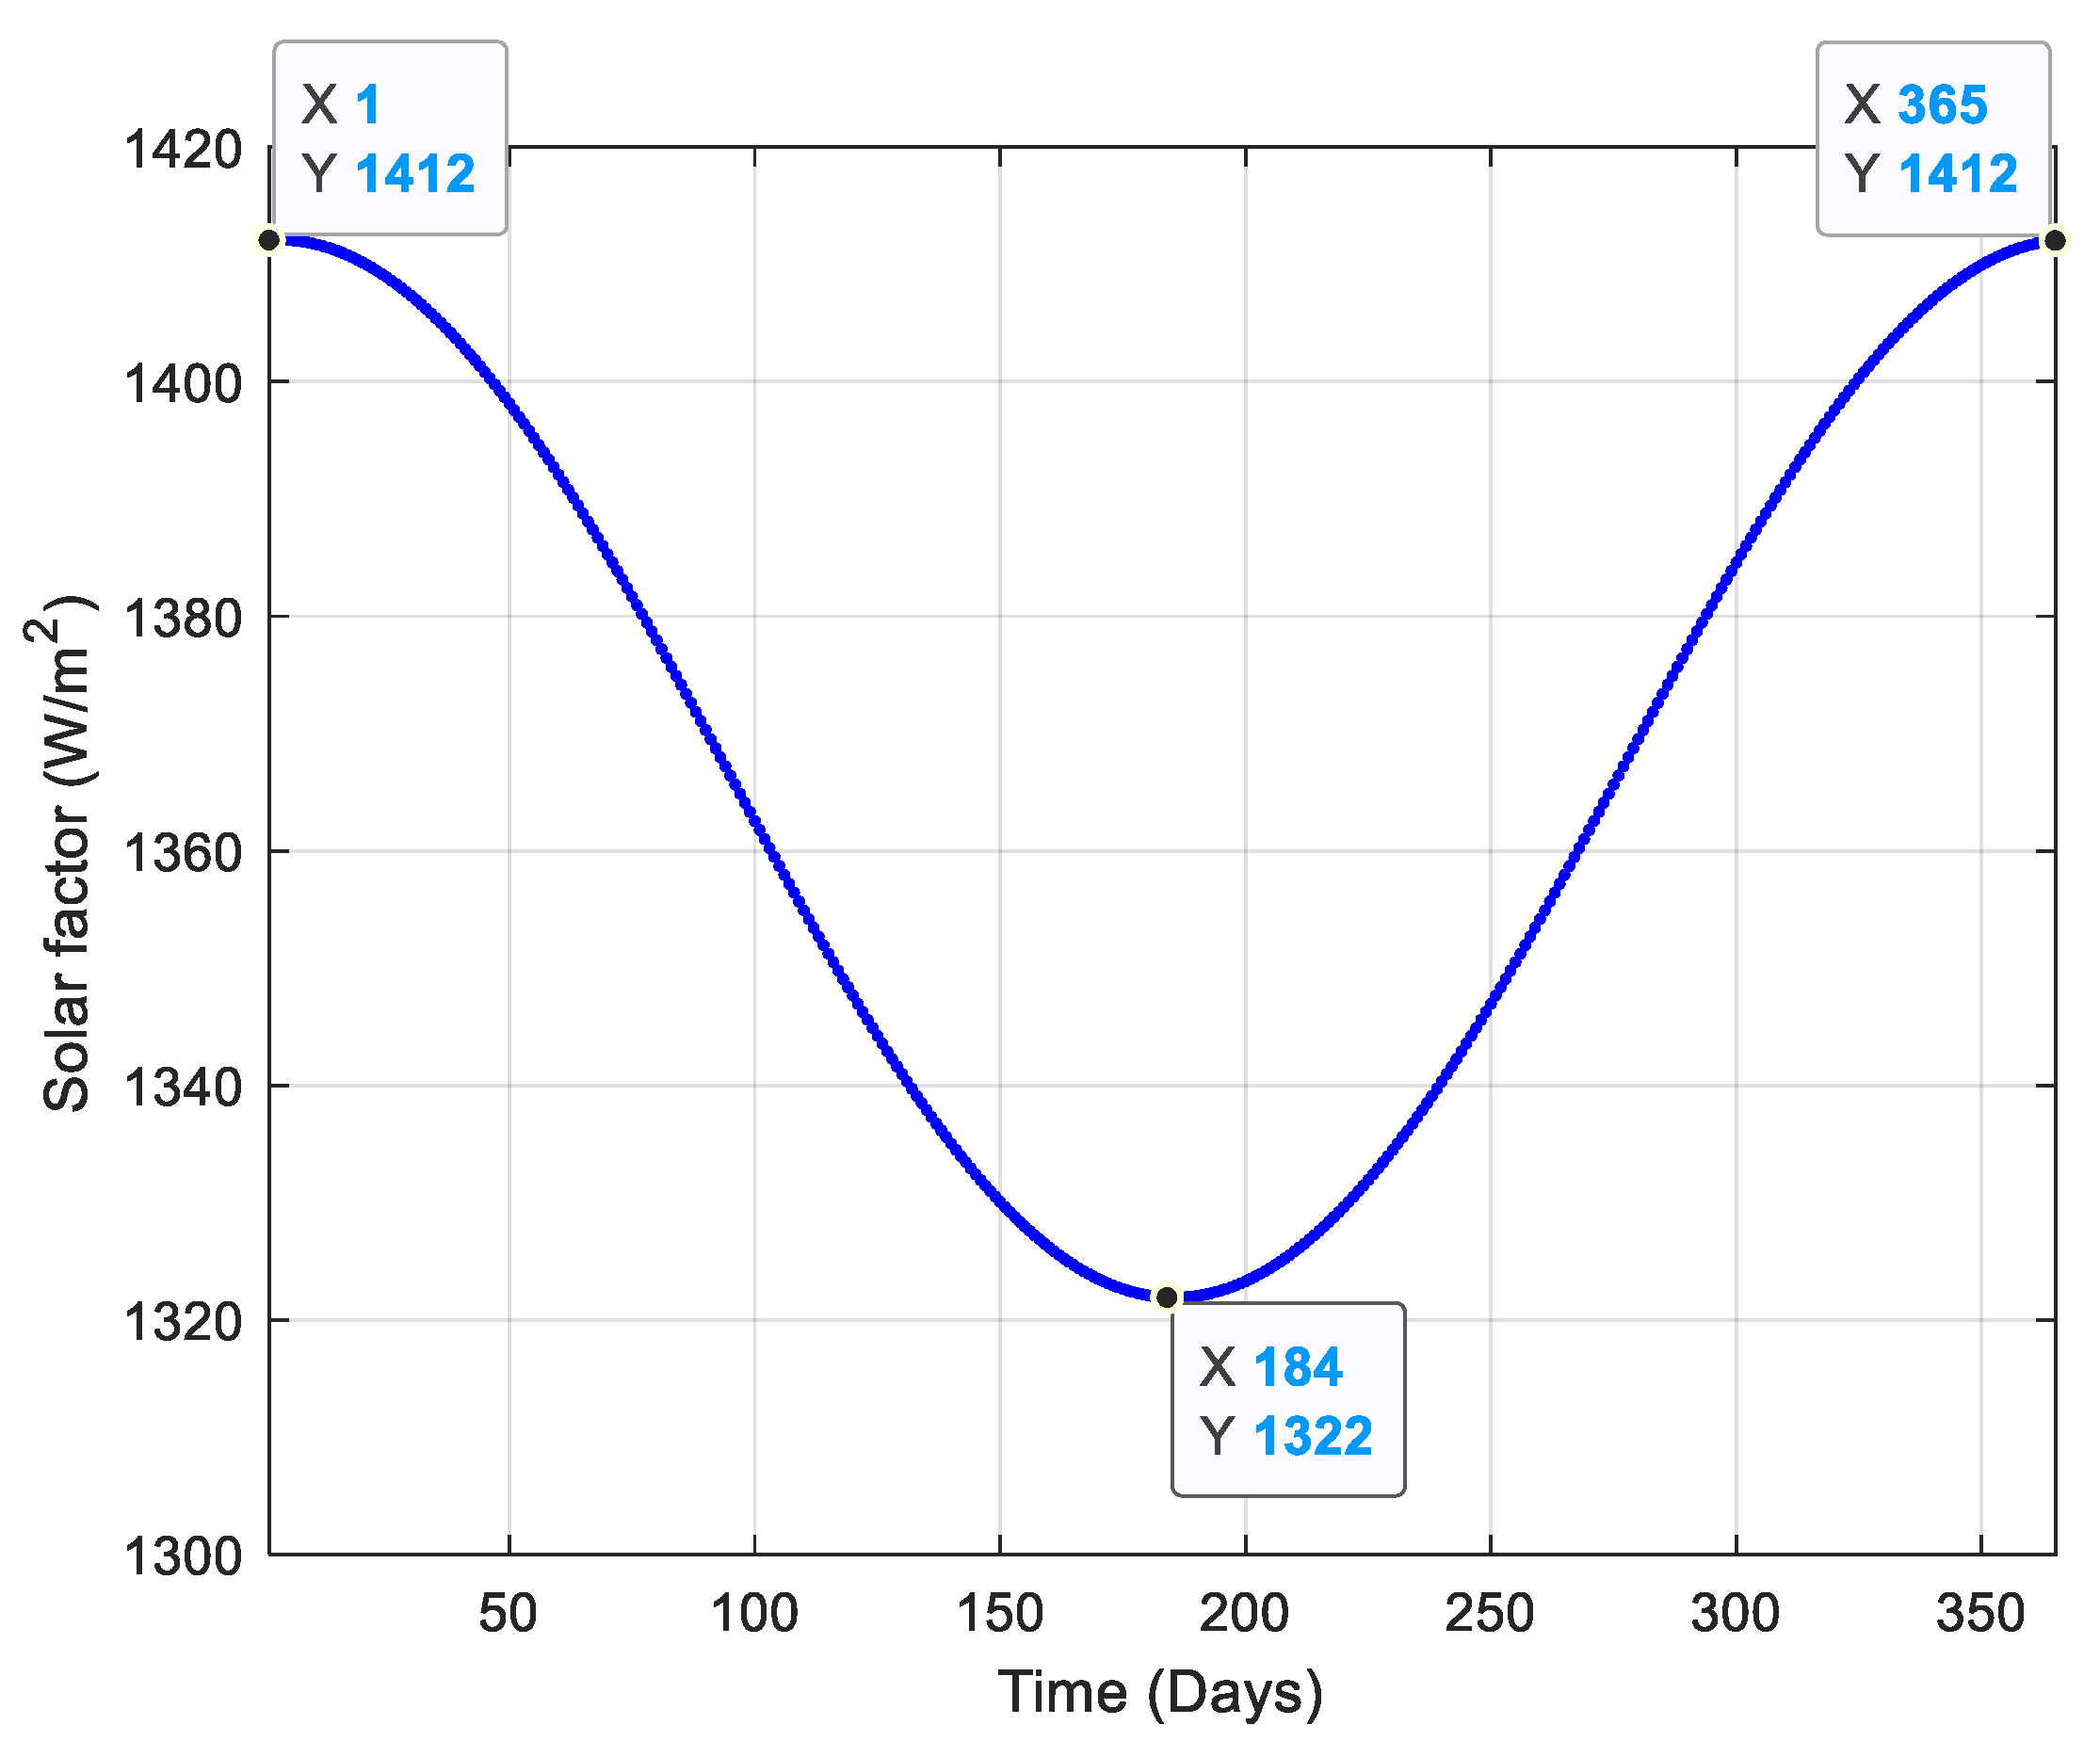
2.2. Solar Factor
The solar factor is a power of solar radiation incident normally to a ray of the Sun outside the atmosphere in a unit area, at an average distance of 150 million Km between the Earth and the Sun; it is equal to 1367 W/m2. Furthermore, its value can be calculated using Equation (2) [7,27,28]:
As shown in Figure 2, a symmetrical behavior of the solar factor value is noticed around , which corresponds to 3 July where the Earth–Sun distance is at its maximum.

Figure 2.
Variation in solar factor.
2.3. Solar Altitude
The solar altitude (or sun elevation) stands for the angle created between the direction of the sun’s radiation and the horizontal plane; it has shown to be maximal at midday and has a value of zero at sunset and sunrise. Its value is determined via the following Equation [7]:
the solar altitude in degrees
: is the latitude of the local area studied; is the hour angle whereby
TST is the true solar time, which varies between 1 and 24 h.
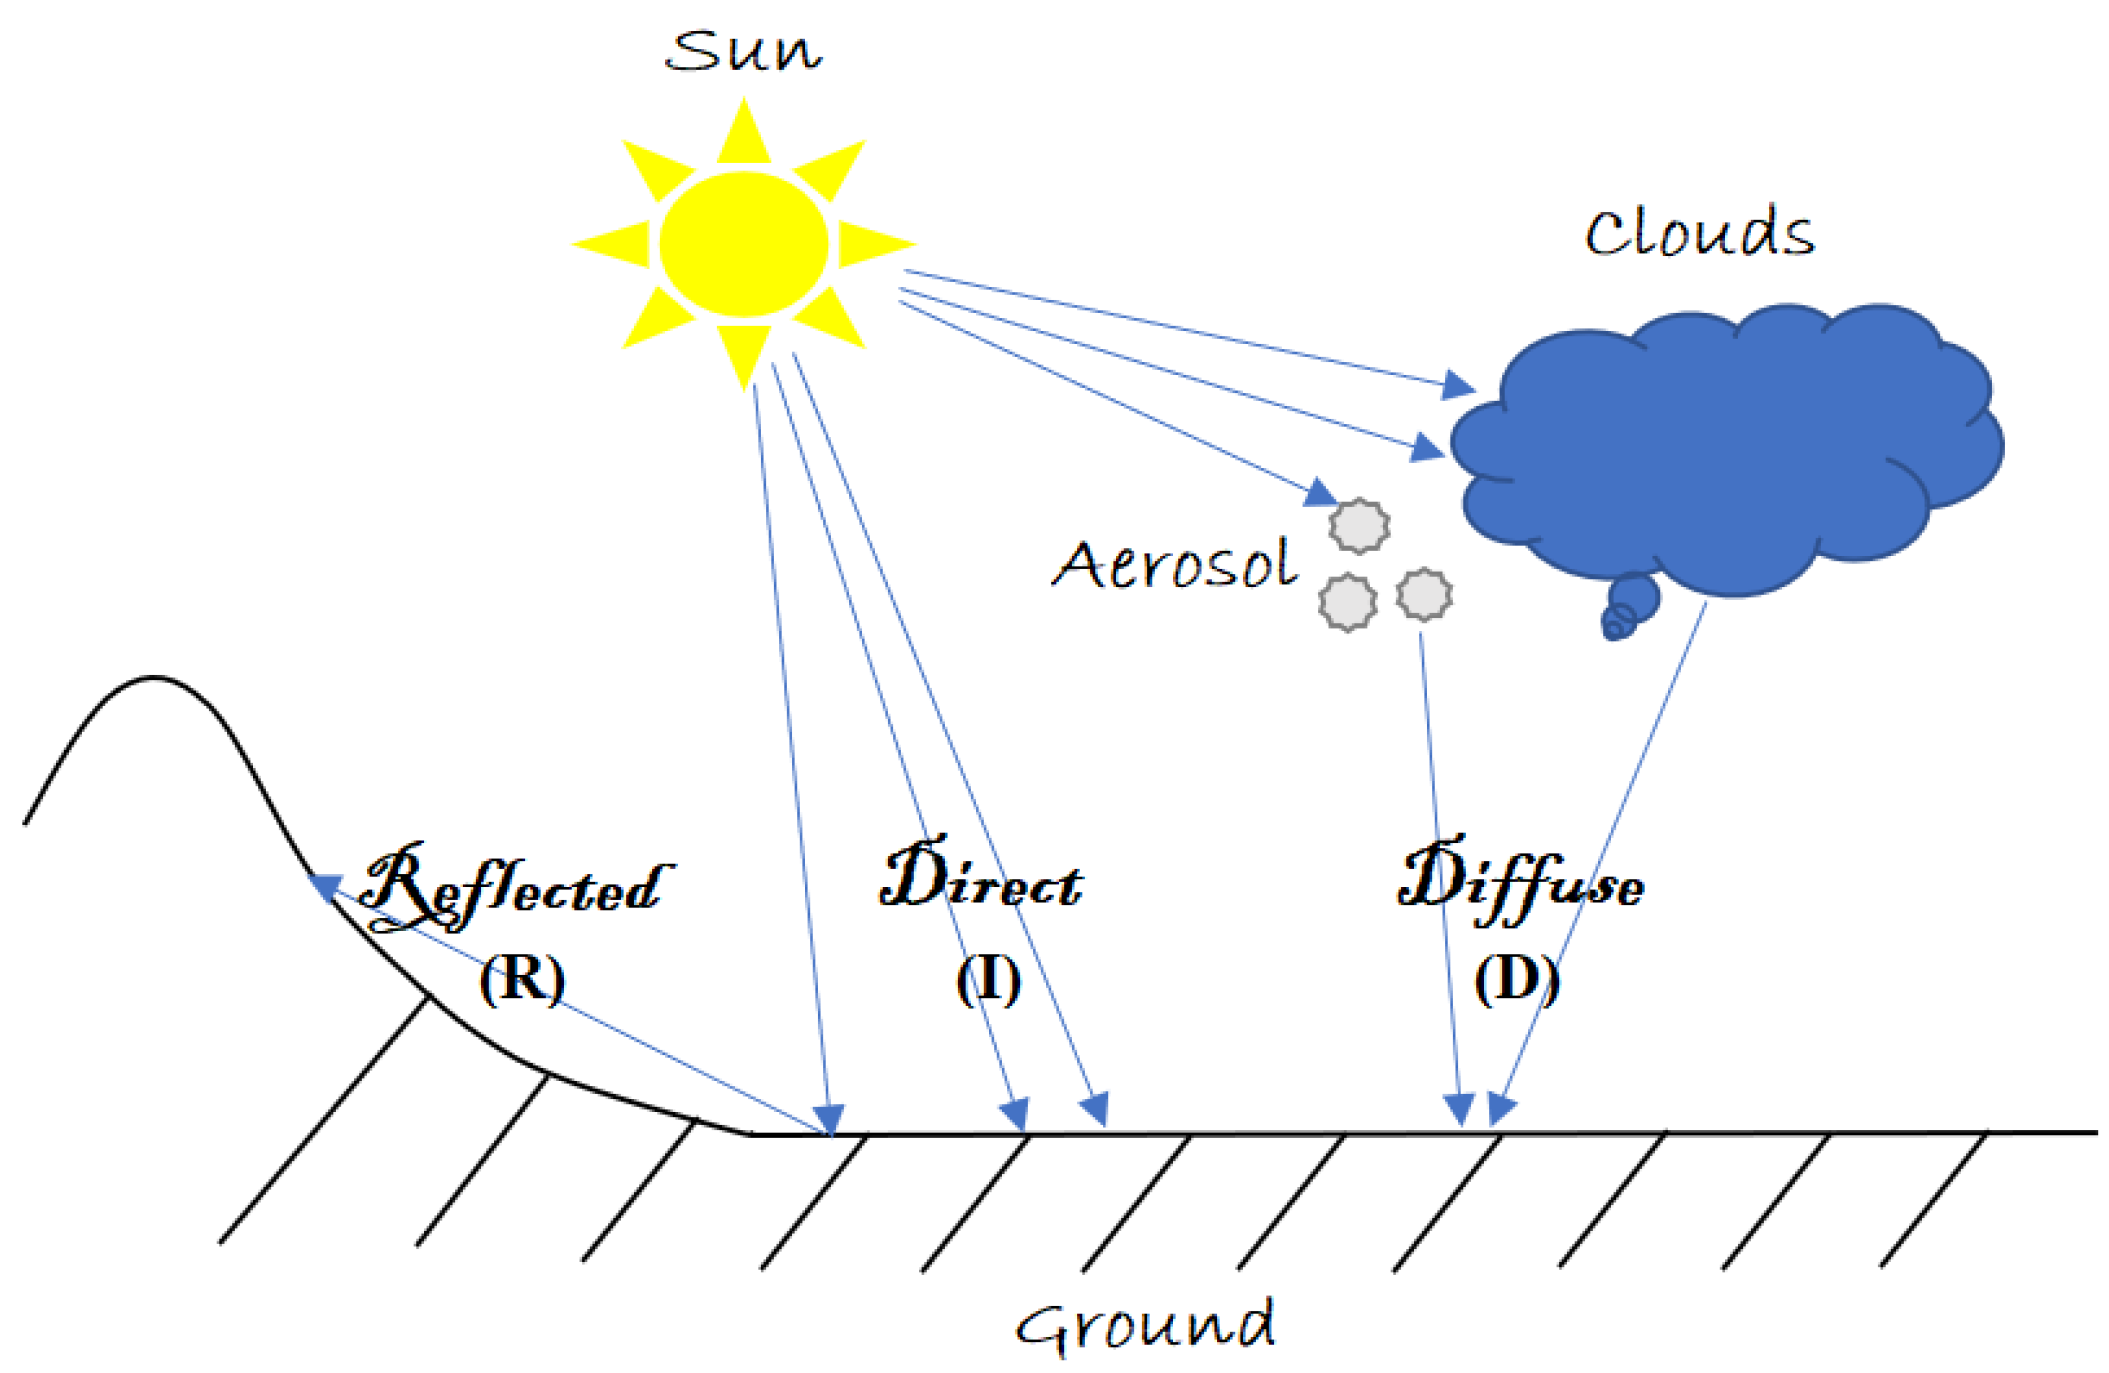
2.4. Solar Radiation Components
Solar radiation incident on a horizontal or inclined surface is divided into three components: a direct component (I), which travels unobstructed from the sun to the ground; a diffuse component (D), scattered by various atmospheric elements such as clouds, aerosols, and dust; and lastly, a component reflected by the ground surface, which is typically negligible (R). Collectively, these three components constitute the global radiation (G).
Figure 3 shows the different Solar radiation components: a direct (I), a diffuse and a reflected (R), the sum of these components constitutes the global (G).

Figure 3.
Solar radiation components on ground.
3. Description of Models
A survey of the existing literature on empirical models reveals three types of models; models incorporating absorption and diffusion coefficients for various atmospheric constituents, including water vapor, oxygen, aerosols, and gases, are prevalent in the scientific literature. Noteworthy among these models are those proposed by Lacis and Hansen [17], Bird and Hulstrom [18], Paltridge and Platt [19], Davies and Hay [29], and Hoyt [30,31]. For our investigation, we specifically selected the Lacis and Hansen model due to its demonstrated efficacy across multiple global sites.
For models based on the turbidity factor of LINKE instead of using the absorption and diffusion coefficients, these coefficients are shown to be obtained from pyrheliometric measurements of direct solar radiation; their value depends on the state of the sky and varies between 2 and 8. Among these models, we will cite the Capderou model and the Brichambaut model [24], and the model of Capderou [23]; this last one is well adopted in Morocco [25,26].
Models that use constants characterizing the state of the sky are very simple models and neither require the values of the absorption coefficients nor the meteorological parameters such as temperature and humidity. Among the models of Liu and Jordan [31], Ashrae [32] and Cooper [27], in our study, we chose the model recommended by Liu and Jordan.
3.1. Capderou Model
Capderou uses the turbidity factor of LINKE (dimensionless) for estimating the diffuse, direct, and global solar radiation components at ground level. Furthermore, the turbidity factor of LINKE is defined as the number of pure and dry atmospheres (in the absence of water vapor and aerosols) that would cause the same attenuation as the real atmosphere. Likewise, it has shown to be obtained from pyrheliometric measurements of direct solar radiation; it is equal to 2 for a clear sky, and it is equal to 8 for a polluted or humid sky [10,11,12].
The direct component is calculated via the following [23,33]:
z: represents the altitude of place (m).
The diffuse component is given by the following [33]:
with
The global component is the sum of direct and diffuse components:
3.2. Lacis and Hansen Model
Lacis and Hansen have proposed a model that uses absorption coefficients from ozone and water vapor for forecasting the purpose of the quantity of global solar radiation reaching the ground (horizontal surface) [17,34]:
and represent the absorption coefficients of direct solar radiation by ozone and water vapor, as it stands for a function of temperature and humidity. is the coefficient of absorption by the ozone layer; the values of these coefficients are less than 1, and they are detailed in Appendix B [17,25].
is the albedo ( = 0.2).
3.3. Liu and Jordan Model
This model was proposed by Liu and Jordan for the estimation of the components of solar radiation under different states of sky, as it merely uses the latitude of place, the day number and the solar altitude [31].
The direct component is calculated via the following:
The diffuse component is given by the following:
The global component is the sum of direct and diffuse components.

Table 1.
Liu and Jordan model constants [31].
4. Materials and Data Collection
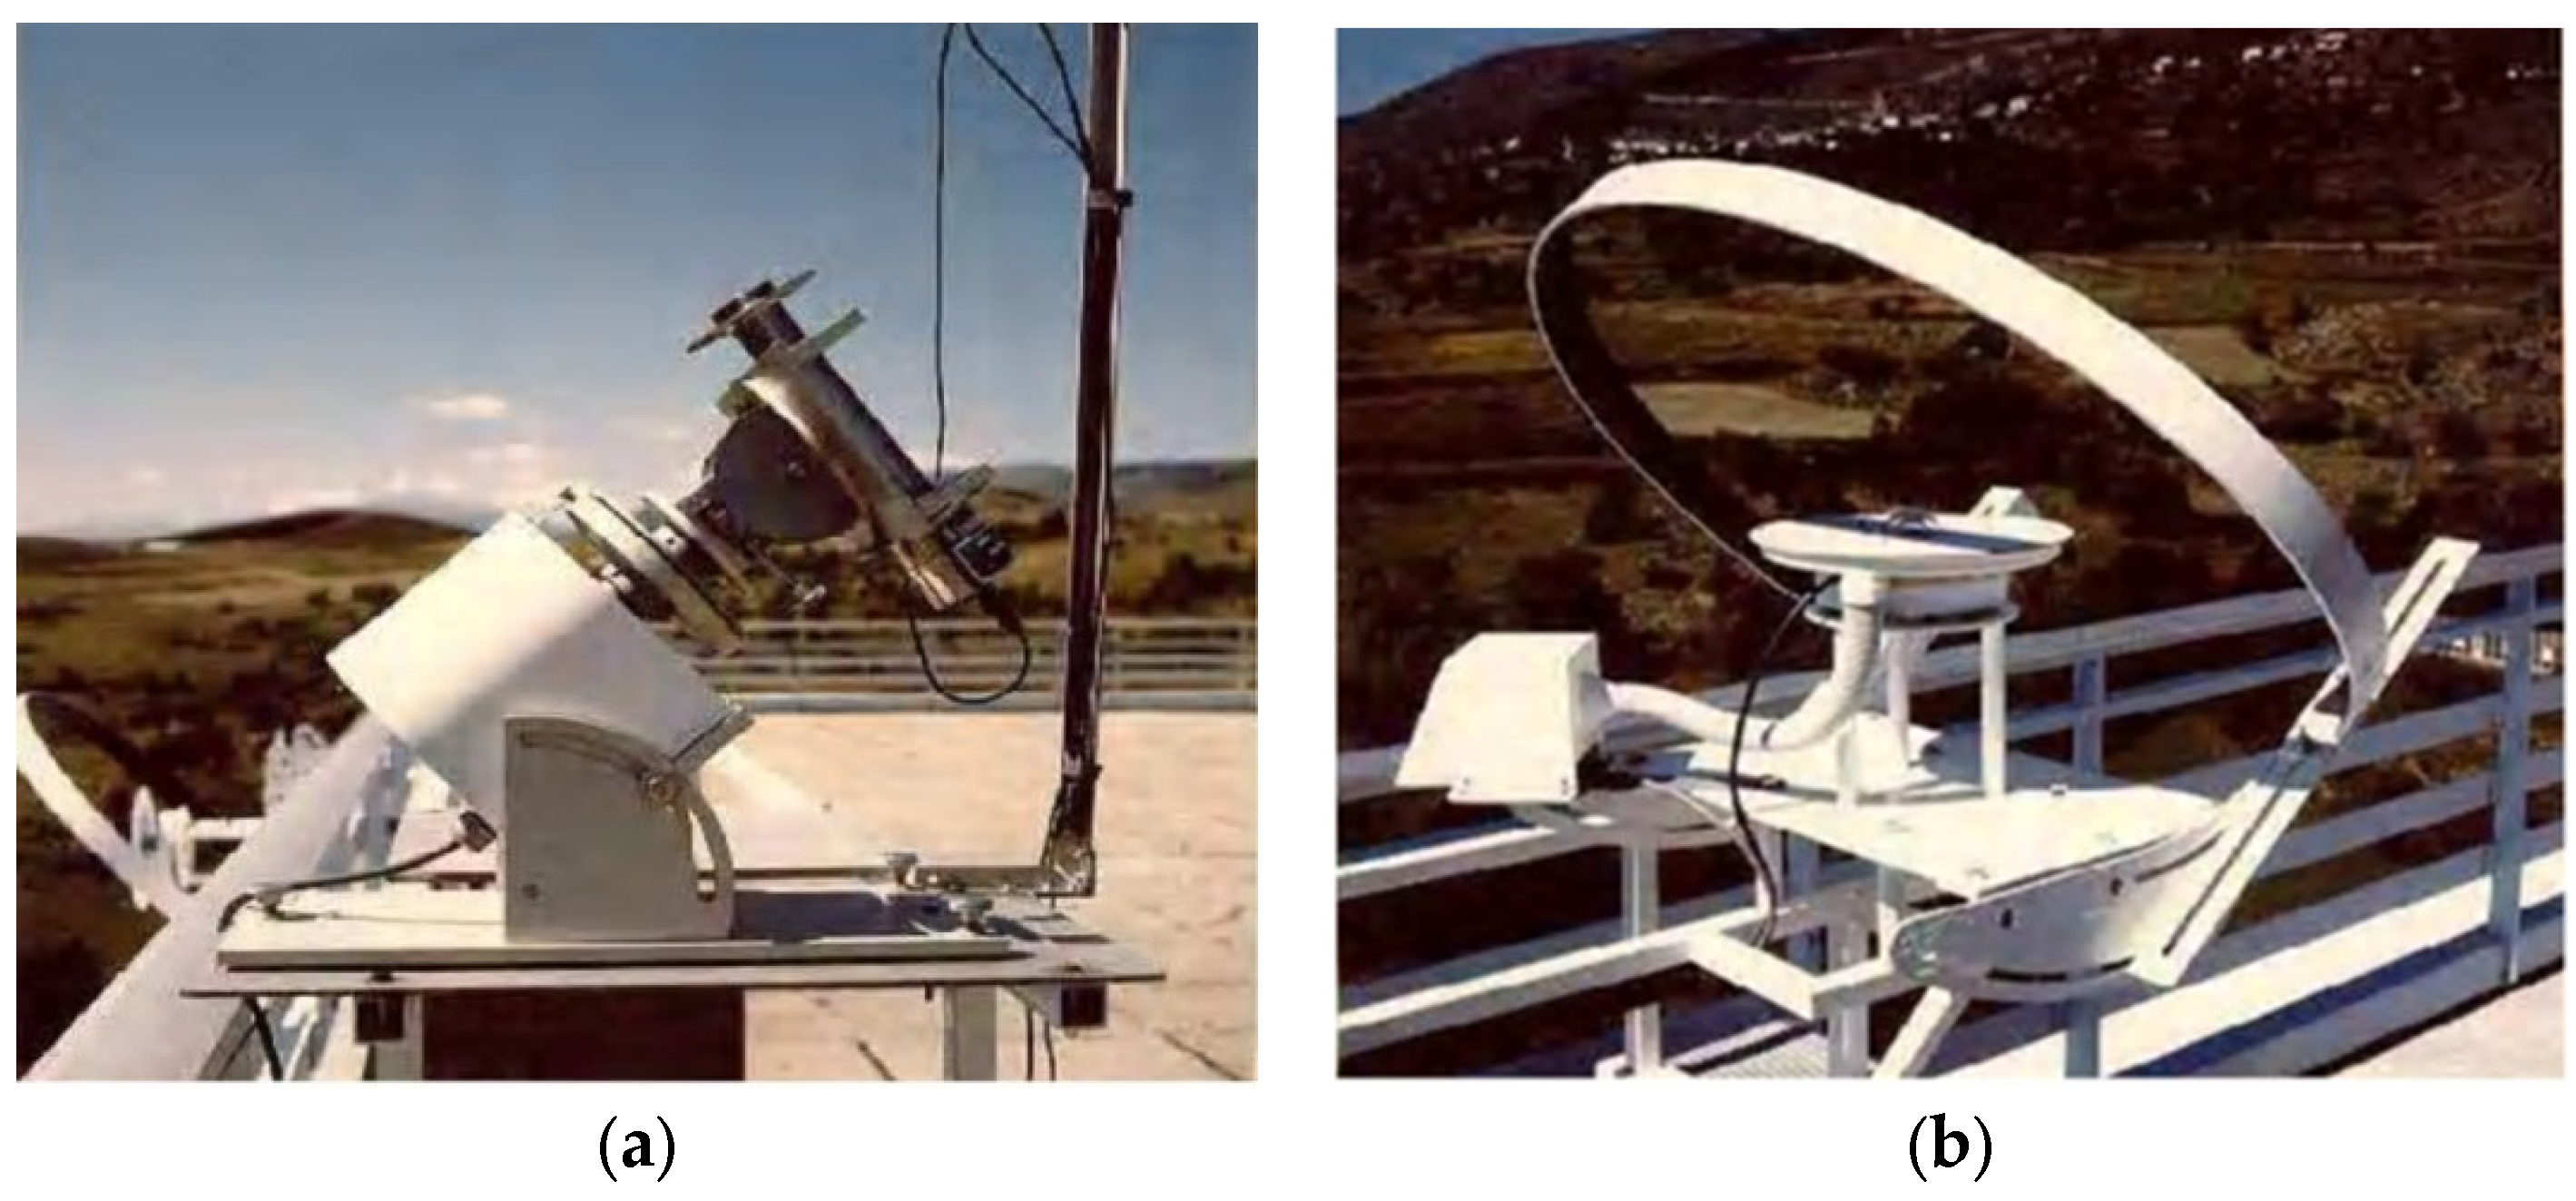
At the Renewable Energy Research Center in Algiers, a high-precision radiometric station was installed. This station incorporates a TECNOEL-type thermo-hygrometer (TECNOEL, Ferrara, Italy) for accurate temperature and humidity measurements. Additionally, a pyrheliometer, aligned with the solar disk, was utilized to measure direct solar radiation integrated across all wavelengths (between 0.2 and 0.4 μm) received on a normal plane. Complementing this, a pyranometer of the EKO type was employed to measure diffuse radiation on a horizontal plane. The cumulative result of these two measurements (diffuse + direct) provides the global radiation. Figure 4 illustrates the instruments utilized within this radiometric station.

Figure 4.
Instruments for measuring solar radiation: (a) pyrheliometer; (b) pyranometer.
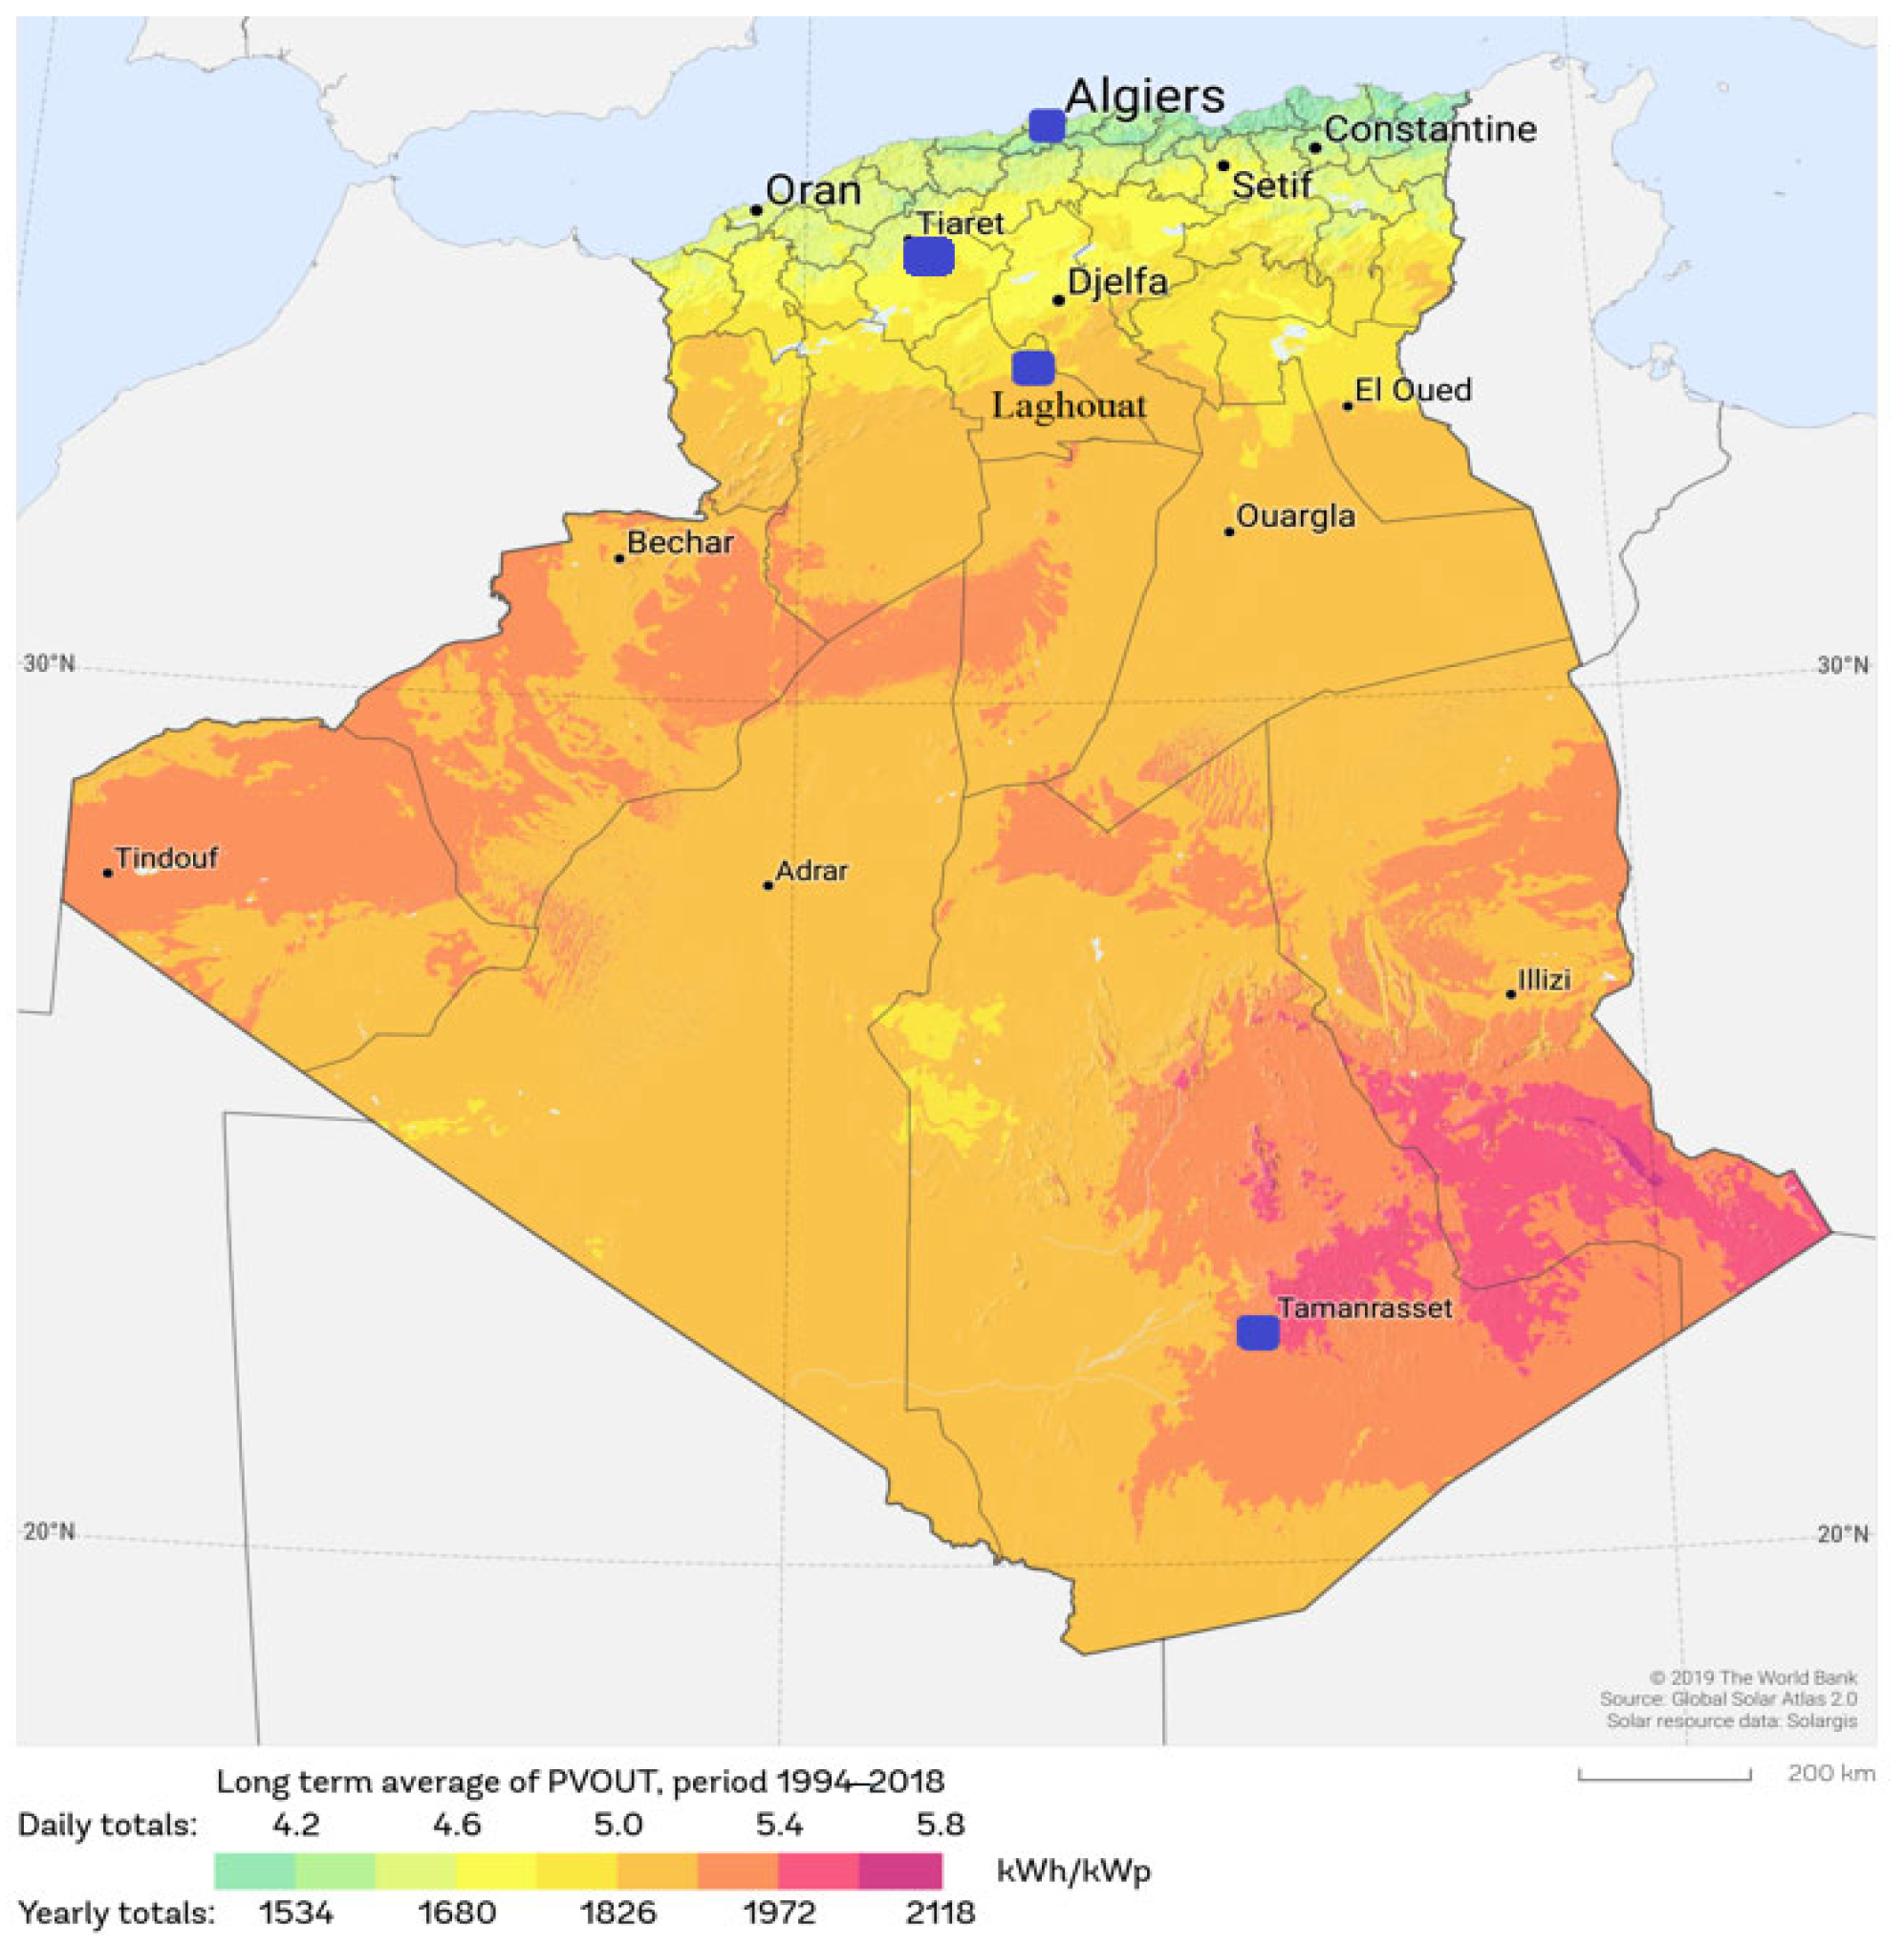
Algeria is situated in Northern Africa, positioned between the longitudes of 8° E and 12° W, and latitudes of 18° and 37° in the north. It encompasses an expansive area of 2,381,741 square kilometers. Upon closer examination of Figure 5, the Algerian landscape reveals itself as comprising four distinct zones: coastal cities where the daily solar irradiation equals 4.2 kWh (green regions), highlands where daily solar irradiation equals 4.6 kWh (yellow regions), the north of the Sahara where daily solar irradiation exceeds 5 kWh (orange regions) and finally the Sahara where daily solar irradiation varies between 5.4 and 5.8 kWh (red regions).

Figure 5.
Daily and annual global horizontal irradiation in Algeria [31,35].
Data used in this work appertain to the Algerian sites: ALGIERS as a coastal city, TIARET, which represents the highlands, LAGHOUAT in the interior of the country and the North of the Sahara and TAMANRASSET in the South of ALGERIA (big Sahara). In this respect, the data collected (global solar radiation, temperature, humidity, etc.) cover the period of the year 2020, for each location, and we will select four days: a day in summer (28 June), a day in autumn (15 October), a day in winter (7 February) and a day in spring (23 April) to assess the precision and efficacy of the tested models.
In Table 2, the geographical coordinates of the studied sites (ALGIERS, TIARET, LAGHOUAT and TAMANRASSET) are represented.
Table 2.
Geographical coordinates of the chosen sites.
5. Method of Evaluation
To validate the efficacy of the studied models, a meticulous evaluation approach was employed. This involved a comparison between the measured values of solar radiation components at ground level and the values obtained through the simulation of these models using MATLAB (2020a).
The assessment of model performance was conducted through the calculation of key statistical error parameters, namely MBE (W/m²), RMSE (W/m²), MAPE (%) and the correlation coefficient R (dimensionless). The following equations allow us to calculate the statistical error parameters between the estimated and measured values [2,3,4,5,6,26,31,36,37].
The MAPE (mean absolute percentage error) calculates the accuracy of the forecast; it is always positive and can thus be calculated via the following equation:
N is the total number of observations.
The MBE (mean bias error) indicates the average deviation of the estimated values from the measured data. A positive MBE value signifies an overestimation of the estimated global solar radiation, while a negative MBE value denotes an underestimation. Mathematically, the MBE is defined as follows:
The RMSE (root mean square error) is used to measure the variation in estimated values around the measured data, and has shown to be at all times positive. Thus, it is defined as follows:
R2 is the correlation coefficient, which illustrates how well the estimated values reflect the reel values. Furthermore, a correlation coefficient value that approaches 1 suggests a better prediction, and can be defined as follows:
These parameters are widely used to evaluate the performances of studied models and accordingly offer a standard against which to compare models from the literature. Furthermore, the model which has the lowest MAPE and RMSE has been shown to be the most effective.
6. Results and Discussion
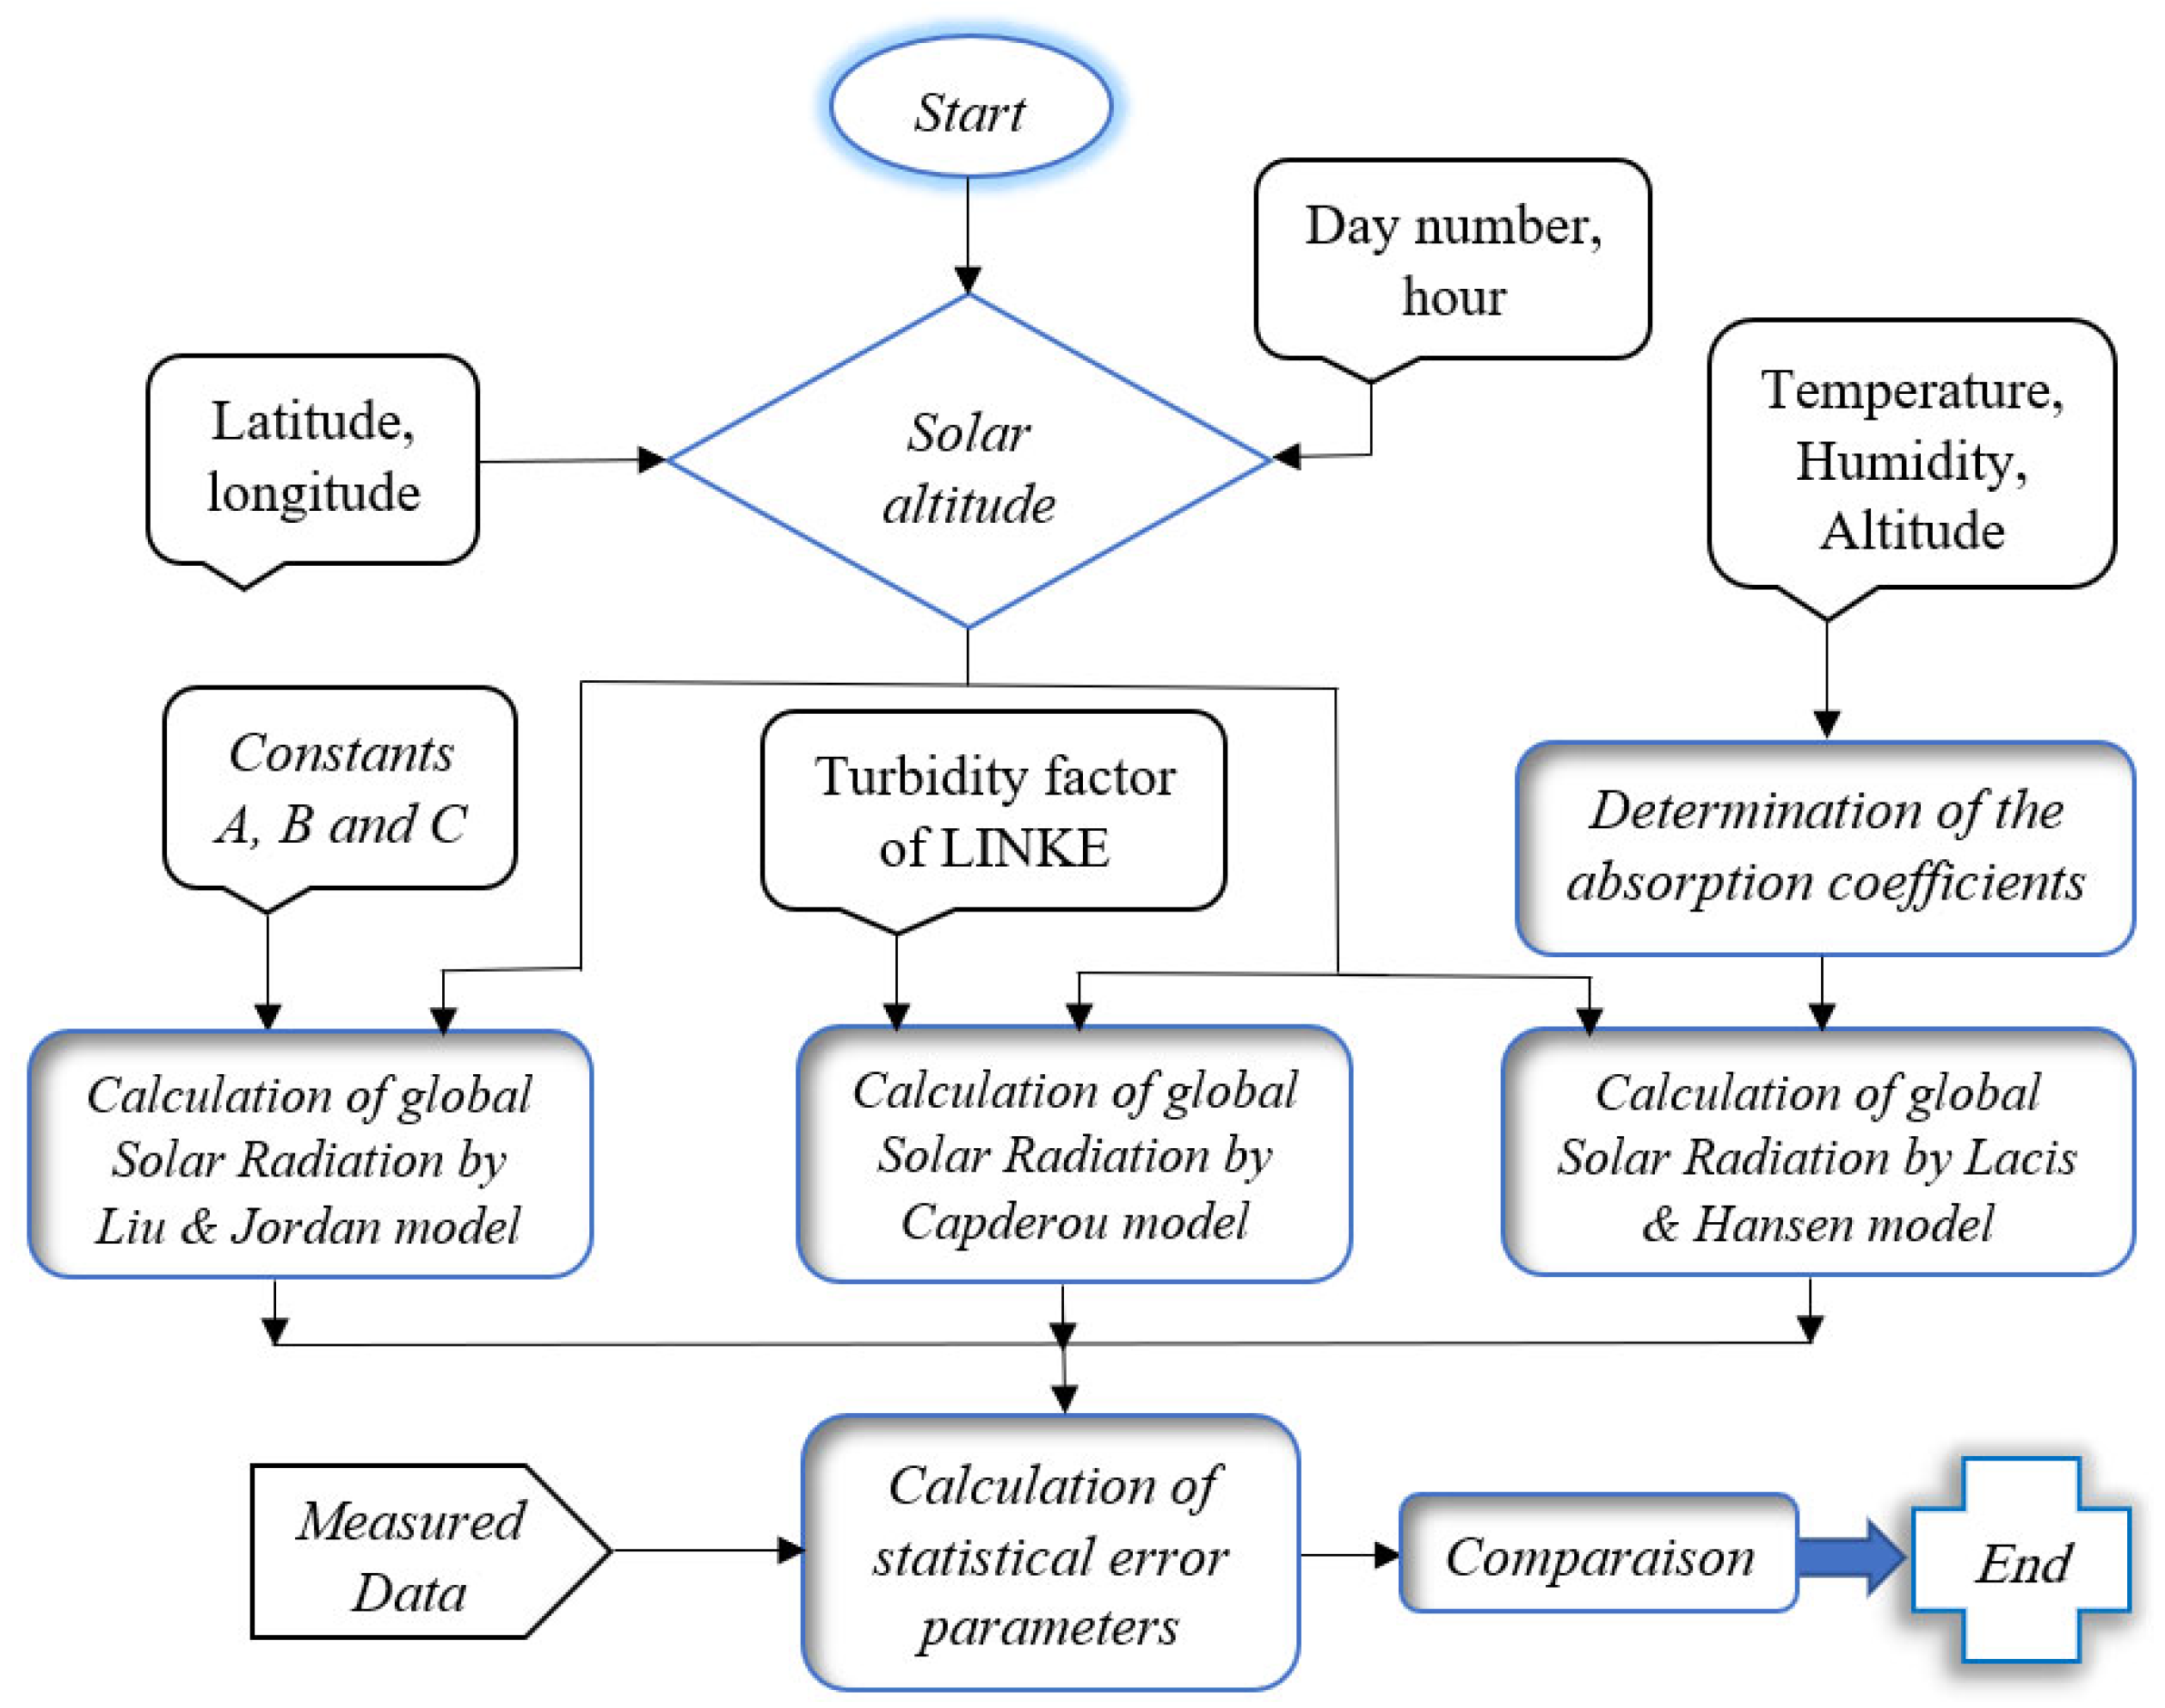
The simulation and performance evaluation of the studied models are depicted in the flowchart presented in Figure 6.

Figure 6.
Flowchart of the proposed models.
In our initial step, we input the latitude and longitude of the site, along with the day number of the year and the time loop (ranging from 1 to 24 h). This information is pivotal for computing the solar altitude, a parameter universally applied in all models. Subsequently, in the calculation of global solar radiation at ground level, additional inputs such as temperature and humidity are required for the Lacis and Hansen model, the turbidity factor of LINKE for the Capderou model, and constants characterizing the state of the sky for the Liu and Jordan model. Finally, a comparison between the measured and estimate values is obtained by calculation of statistical error parameters to determinate the best model.
Following the simulations, we compare the results derived from these models with real measurements obtained from meteorological stations across the country. Through a meticulous assessment involving the calculation of various statistical parameters, we can deduce the model that most accurately estimates solar radiation at ground level.
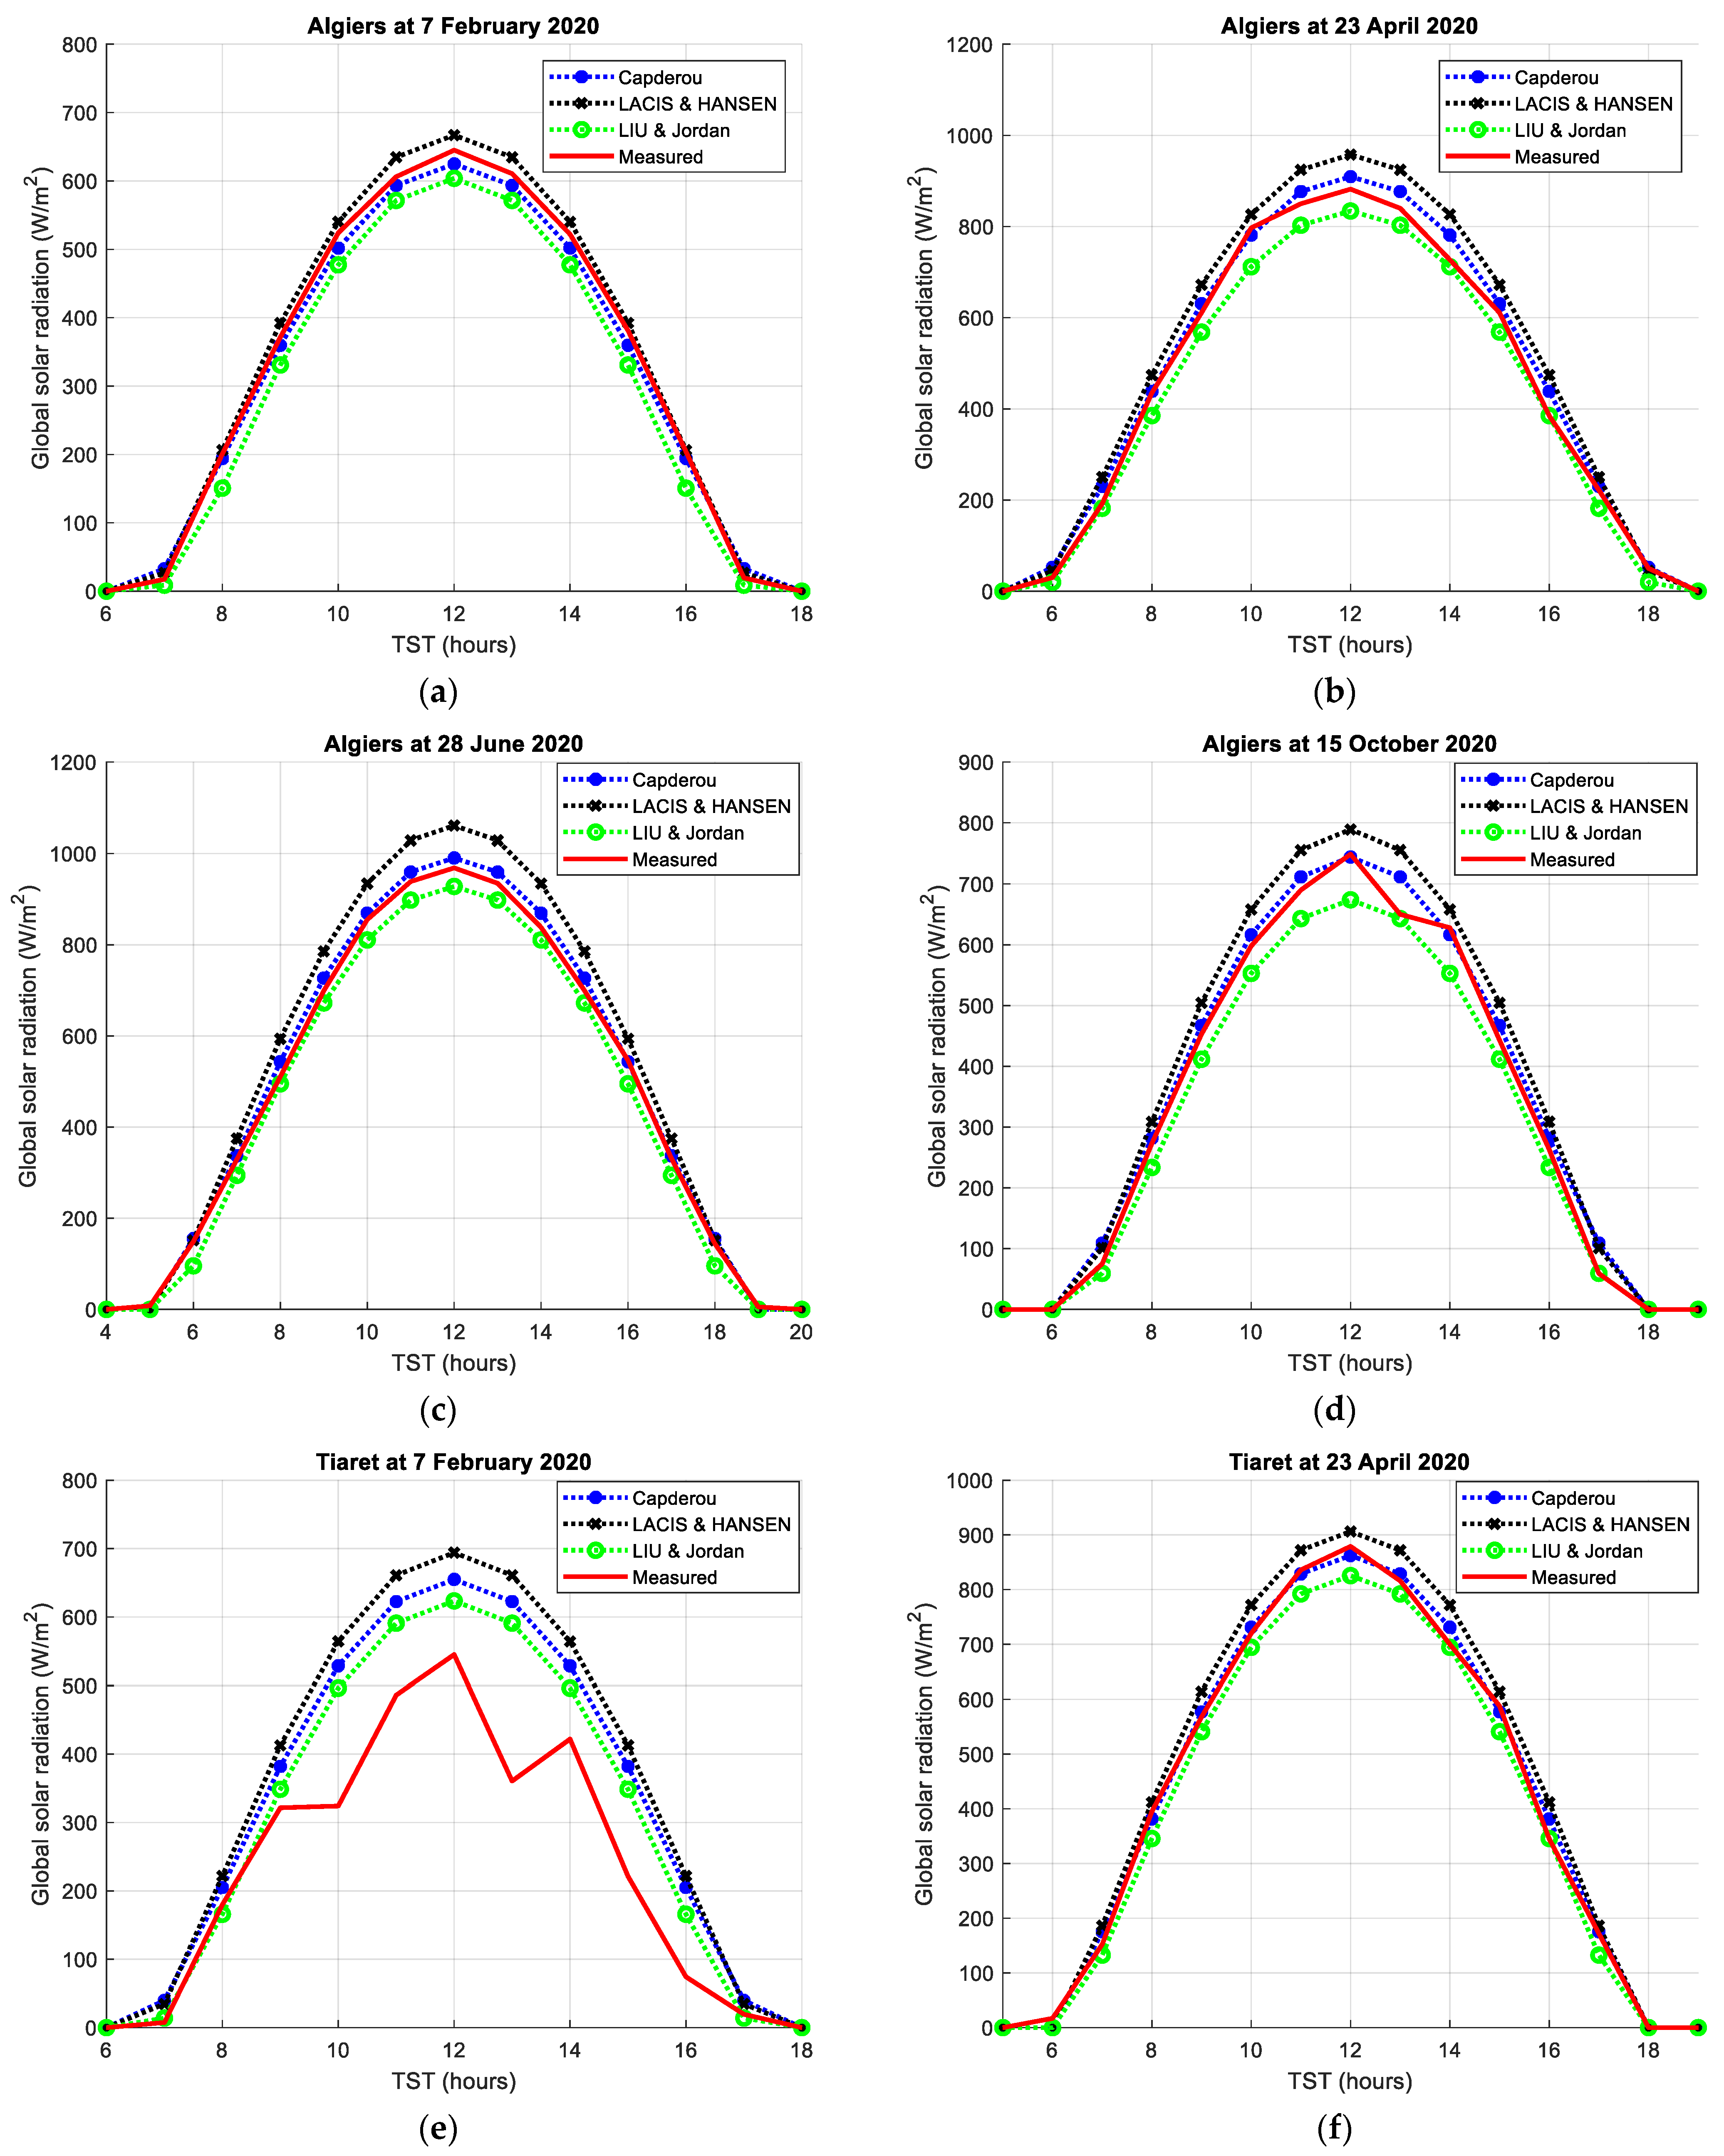
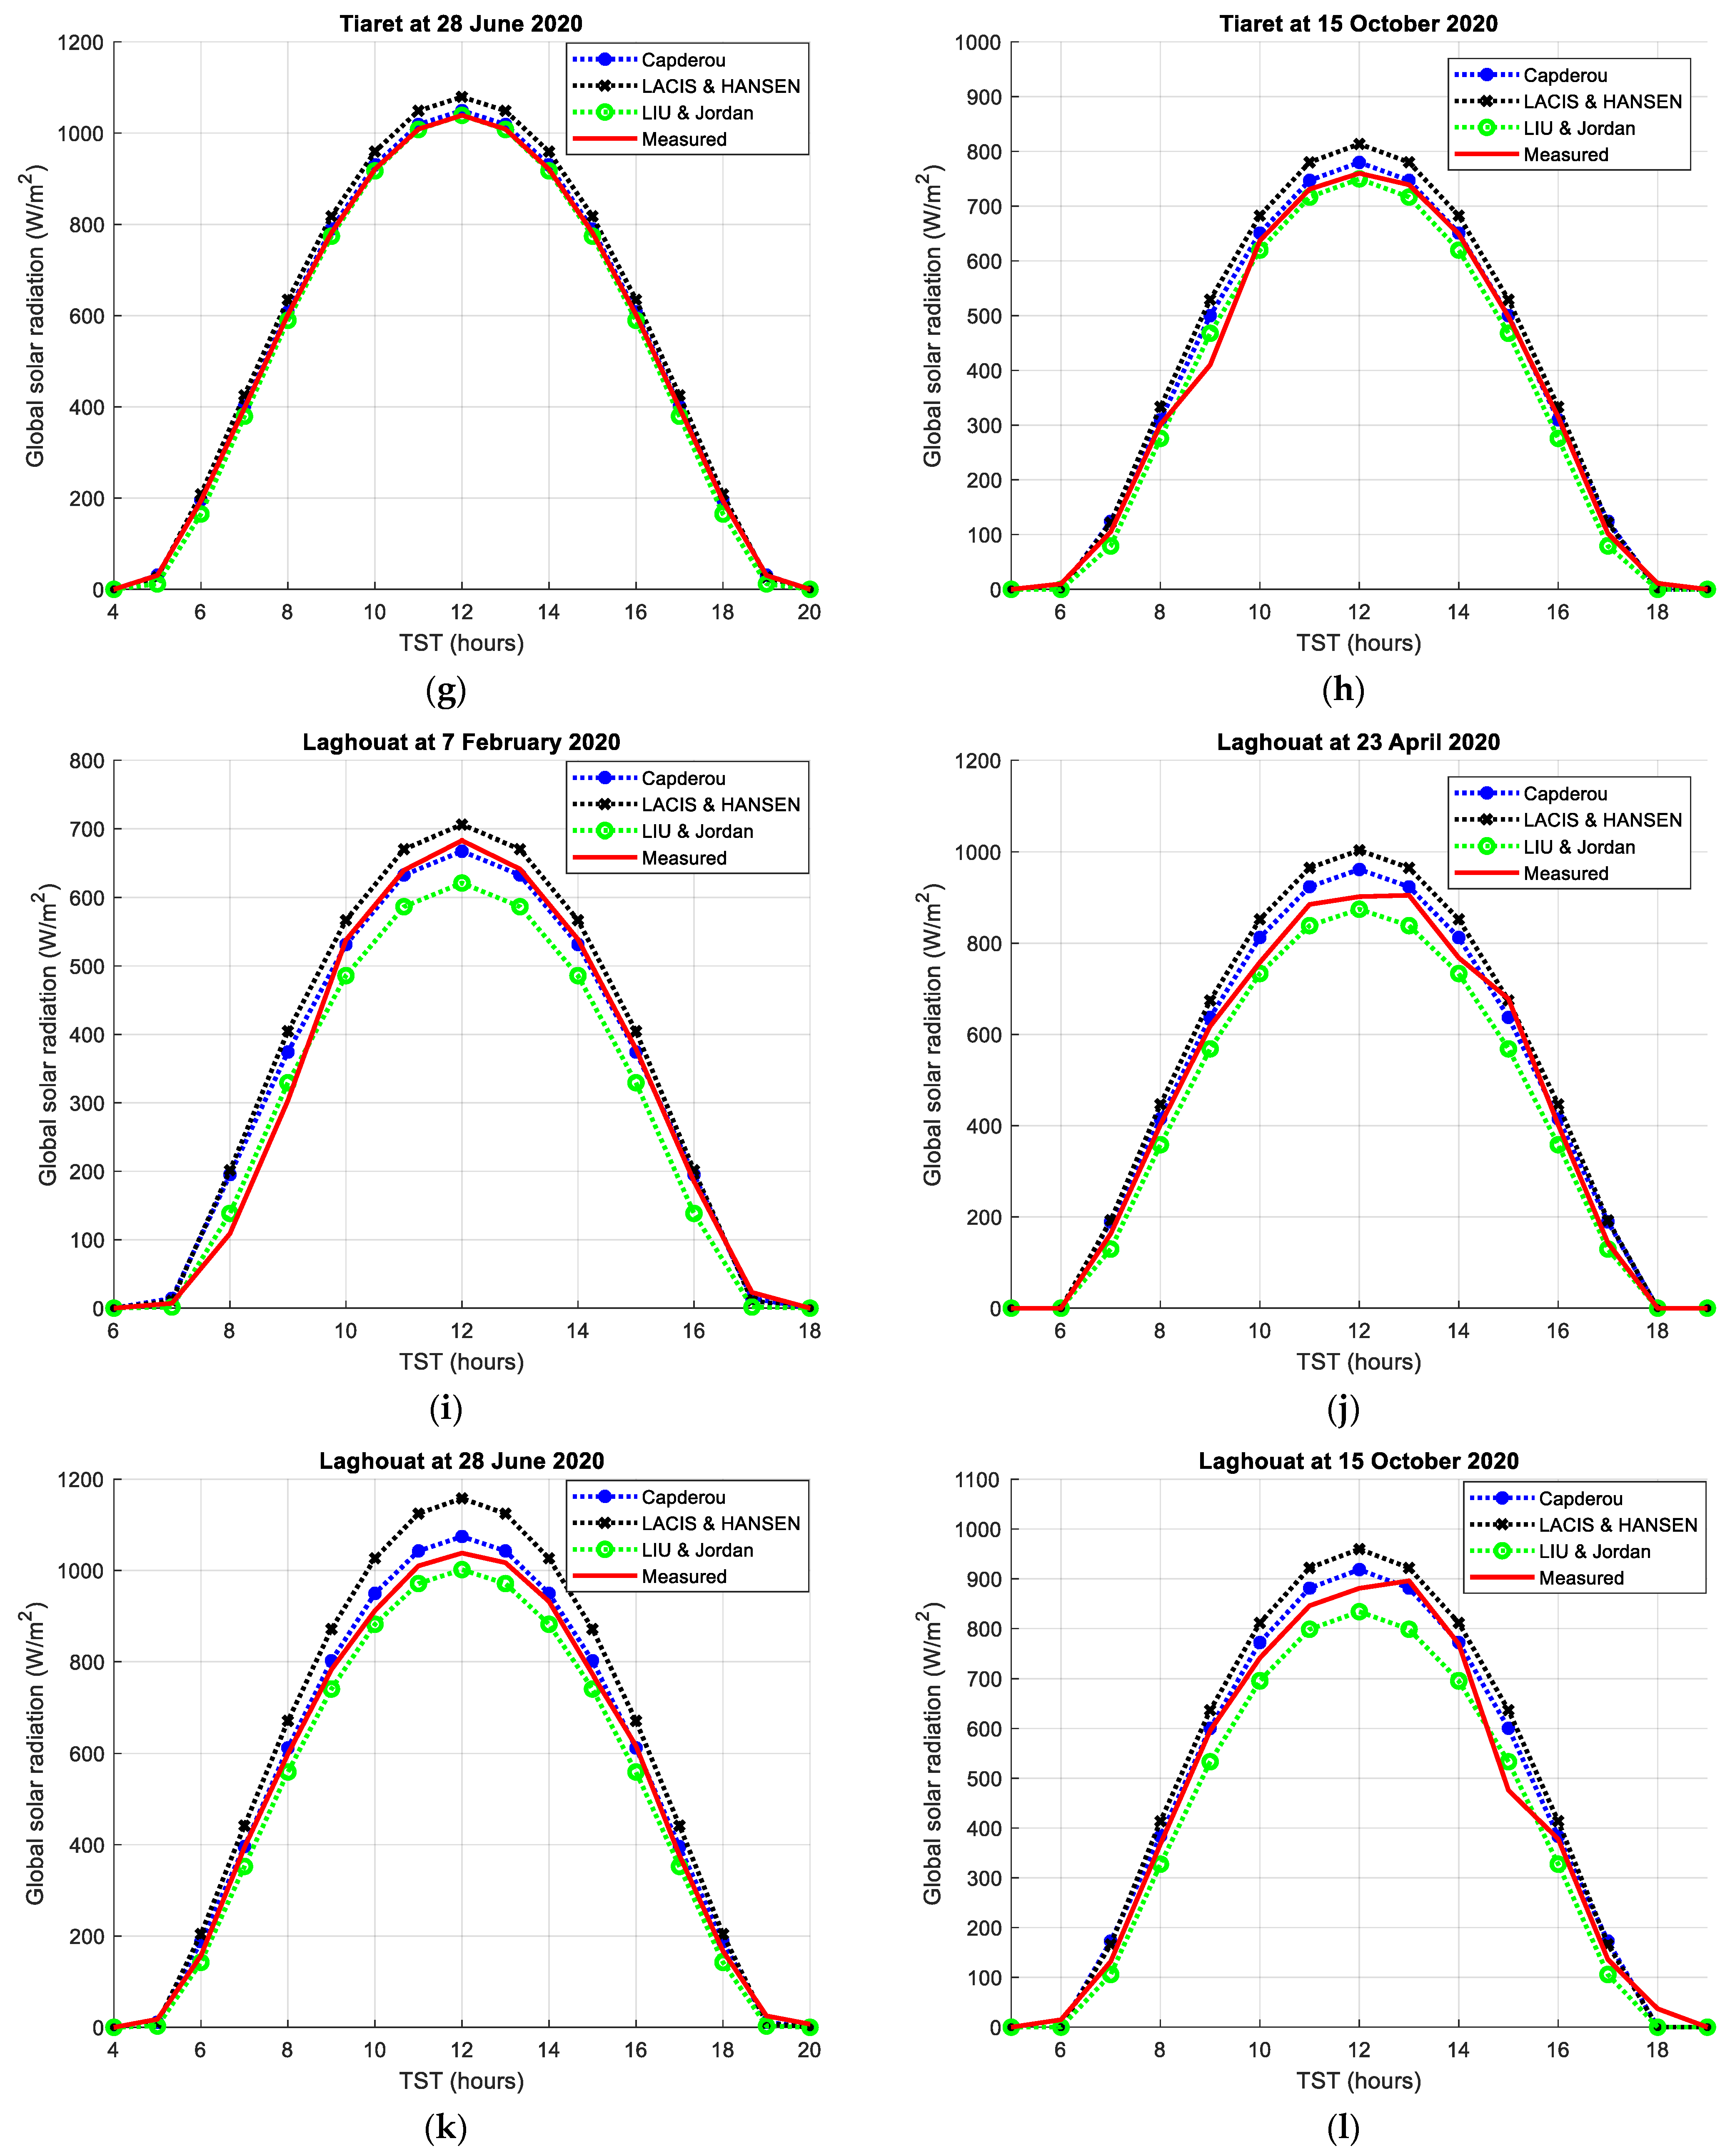
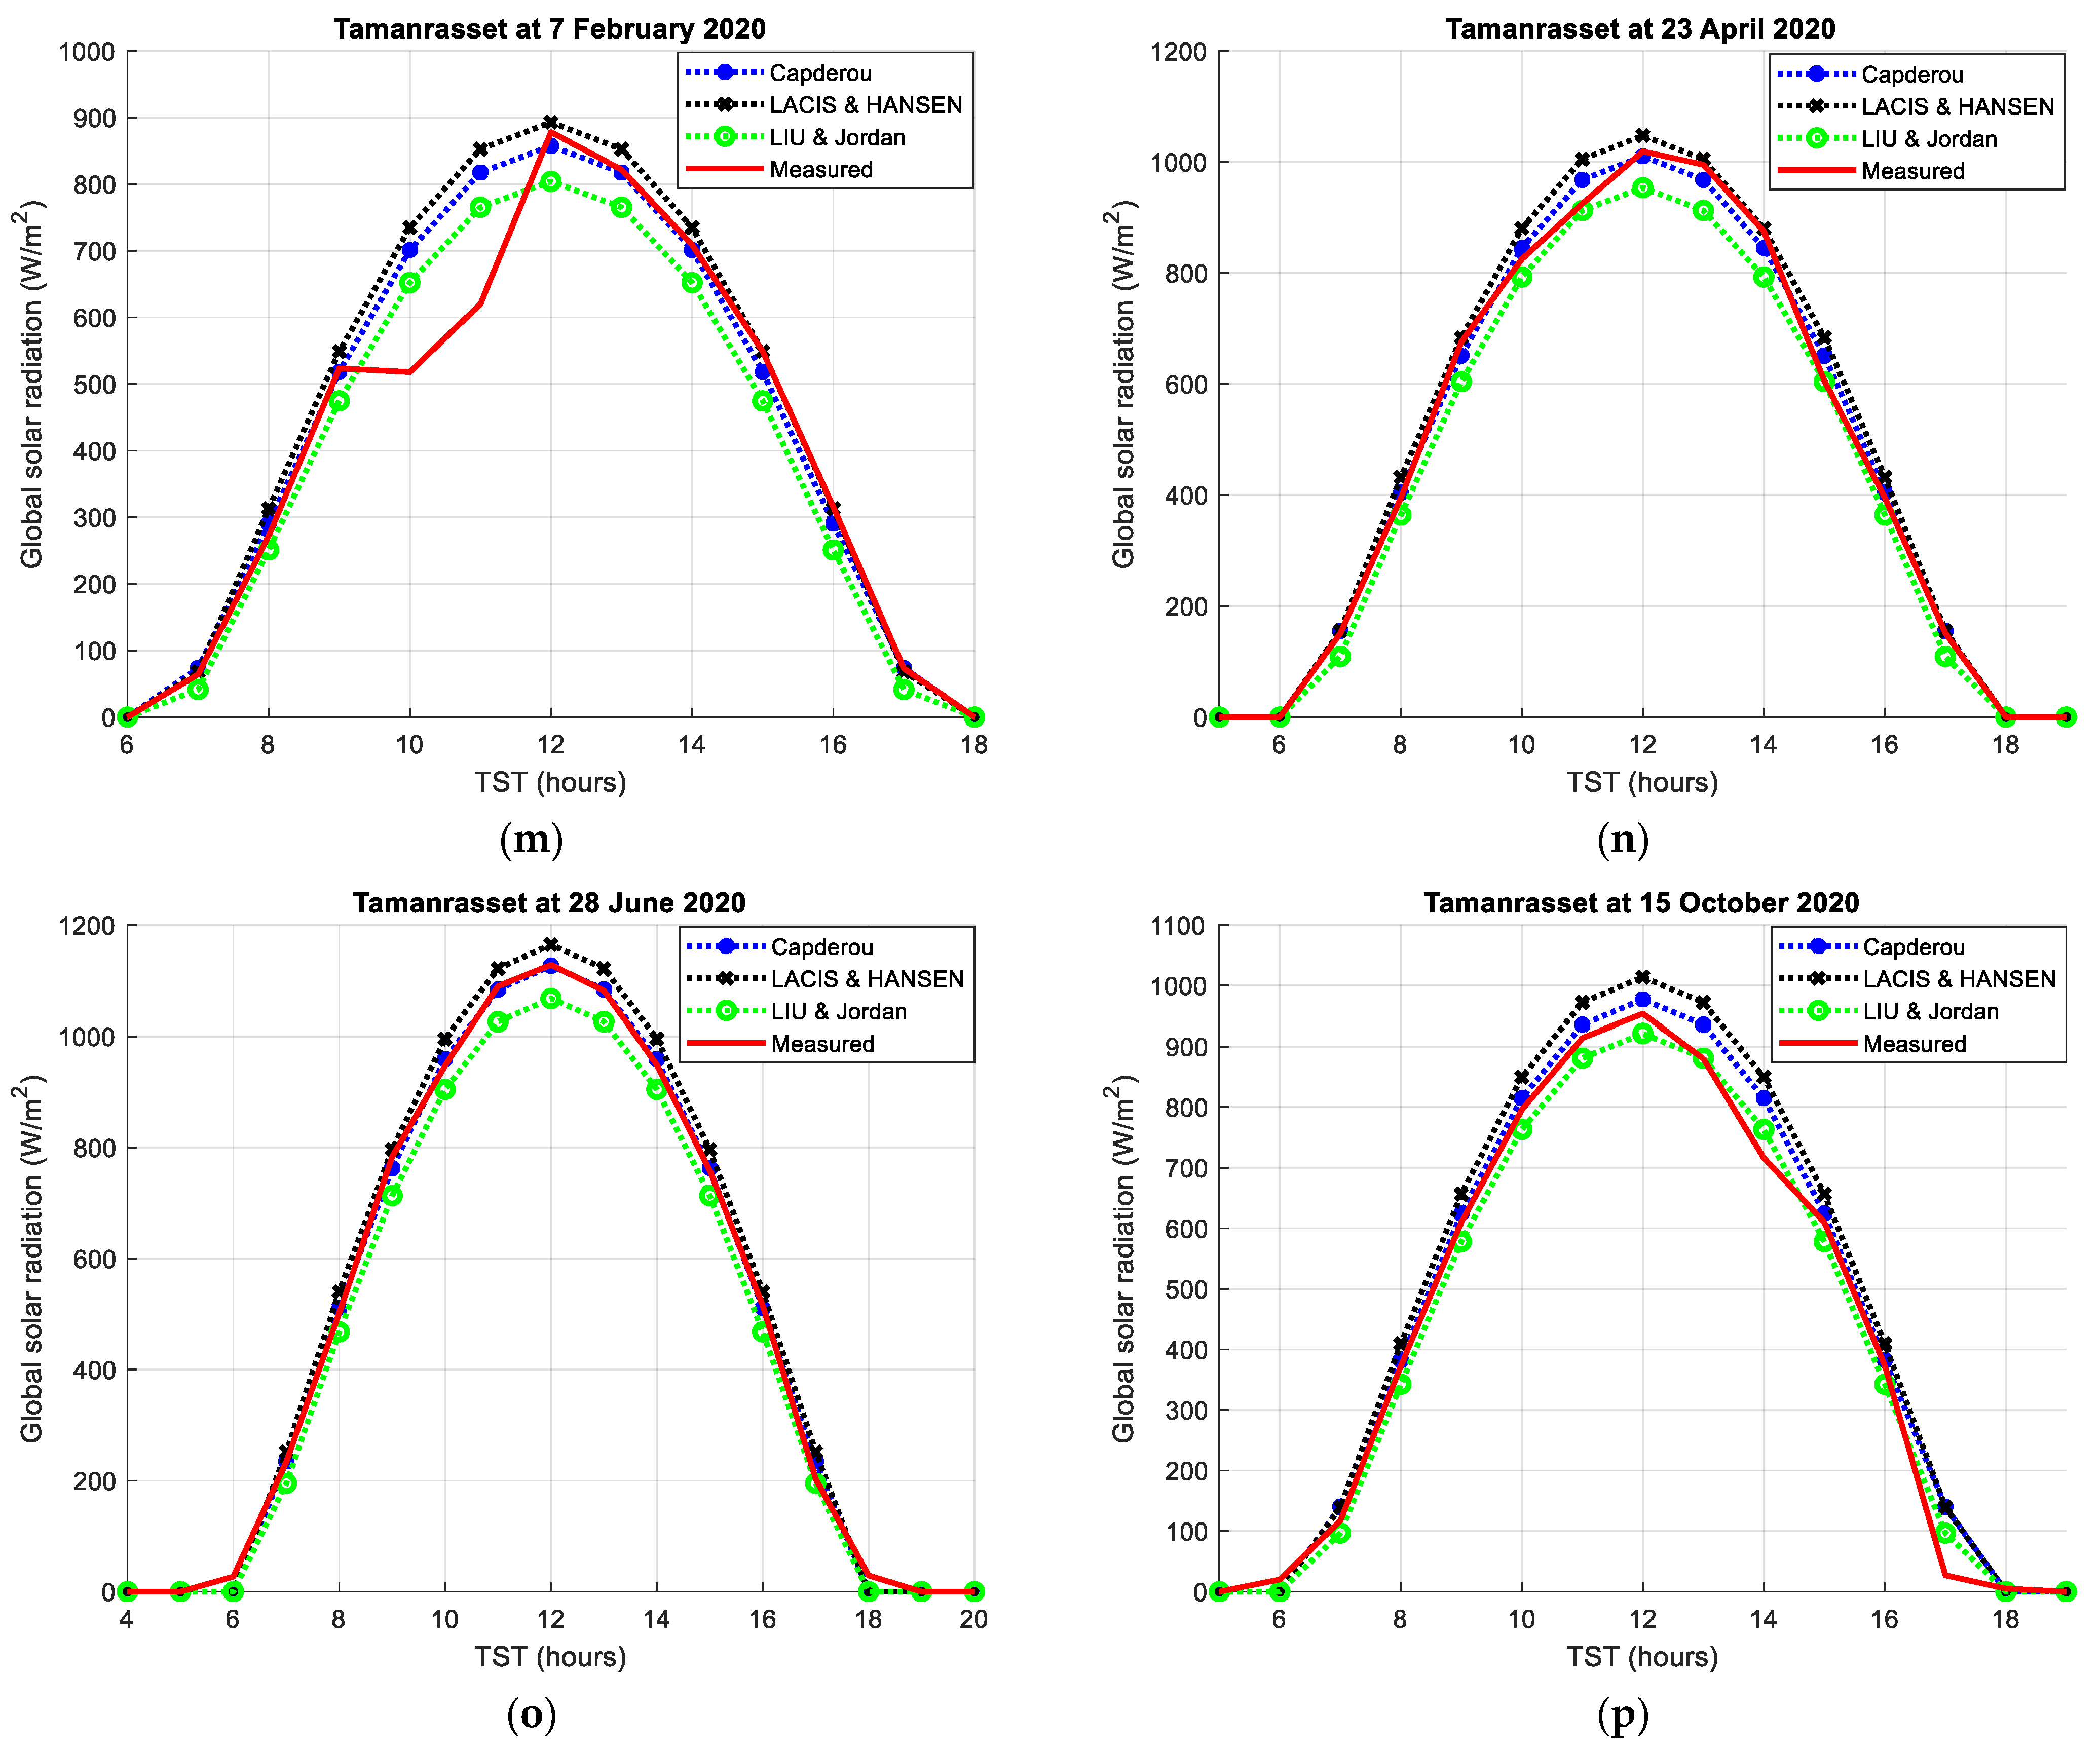
Global solar radiation measured and estimated by models for all studied cities is presented in Figure 7.
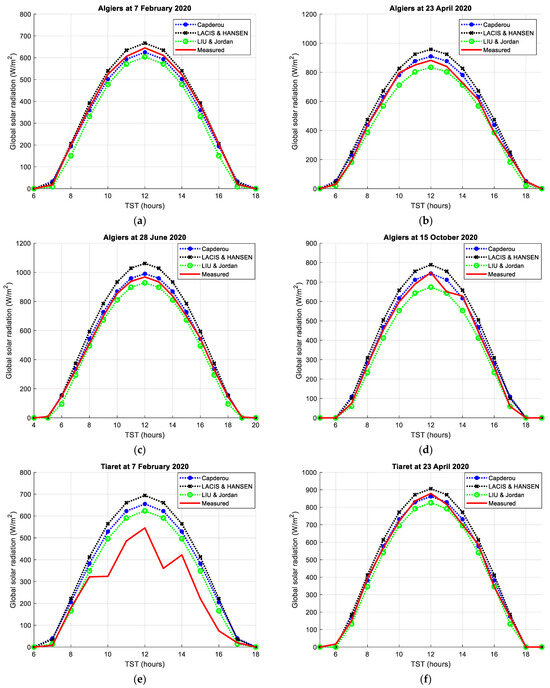
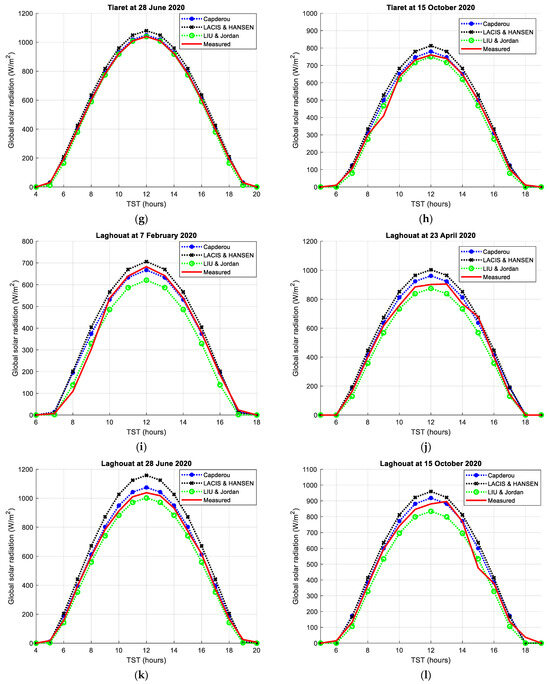
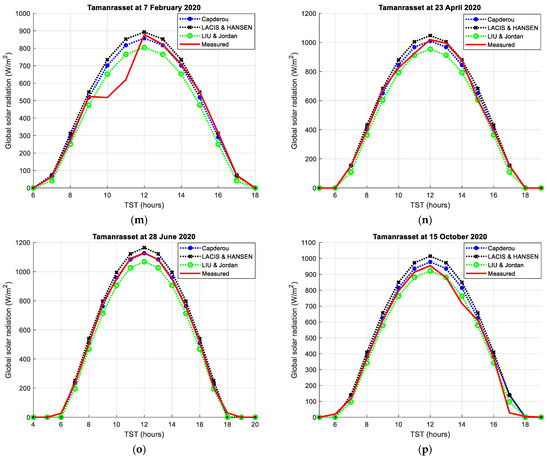
Figure 7.
Global component measured and estimated by all models [17,23,25,31,33,34]: (a) Algiers at 7 February 2020; (b) Algiers at 23 April 2020; (c) Algiers at 28 June 2020; (d) Algiers at 15 October 2020; (e) Tiaret at 7 February 2020; (f) Tiaret at 23 April 2020; (g) Tiaret at 28 June 2020; (h) Tiaret at 15 October 2020; (i) Laghouat at 7 February 2020; (j) Laghouat at 23 April 2020; (k) Laghouat at 28 June 2020; (l) Laghouat at 15 October 2020; (m) Tamanrasset at 7 February 2020; (n) Tamanrasset at 23 April 2020; (o) Tamanrasset at 28 June 2020; (p) Tamanrasset at 15 October 2020.
Table 3.
The values of statistical errors.

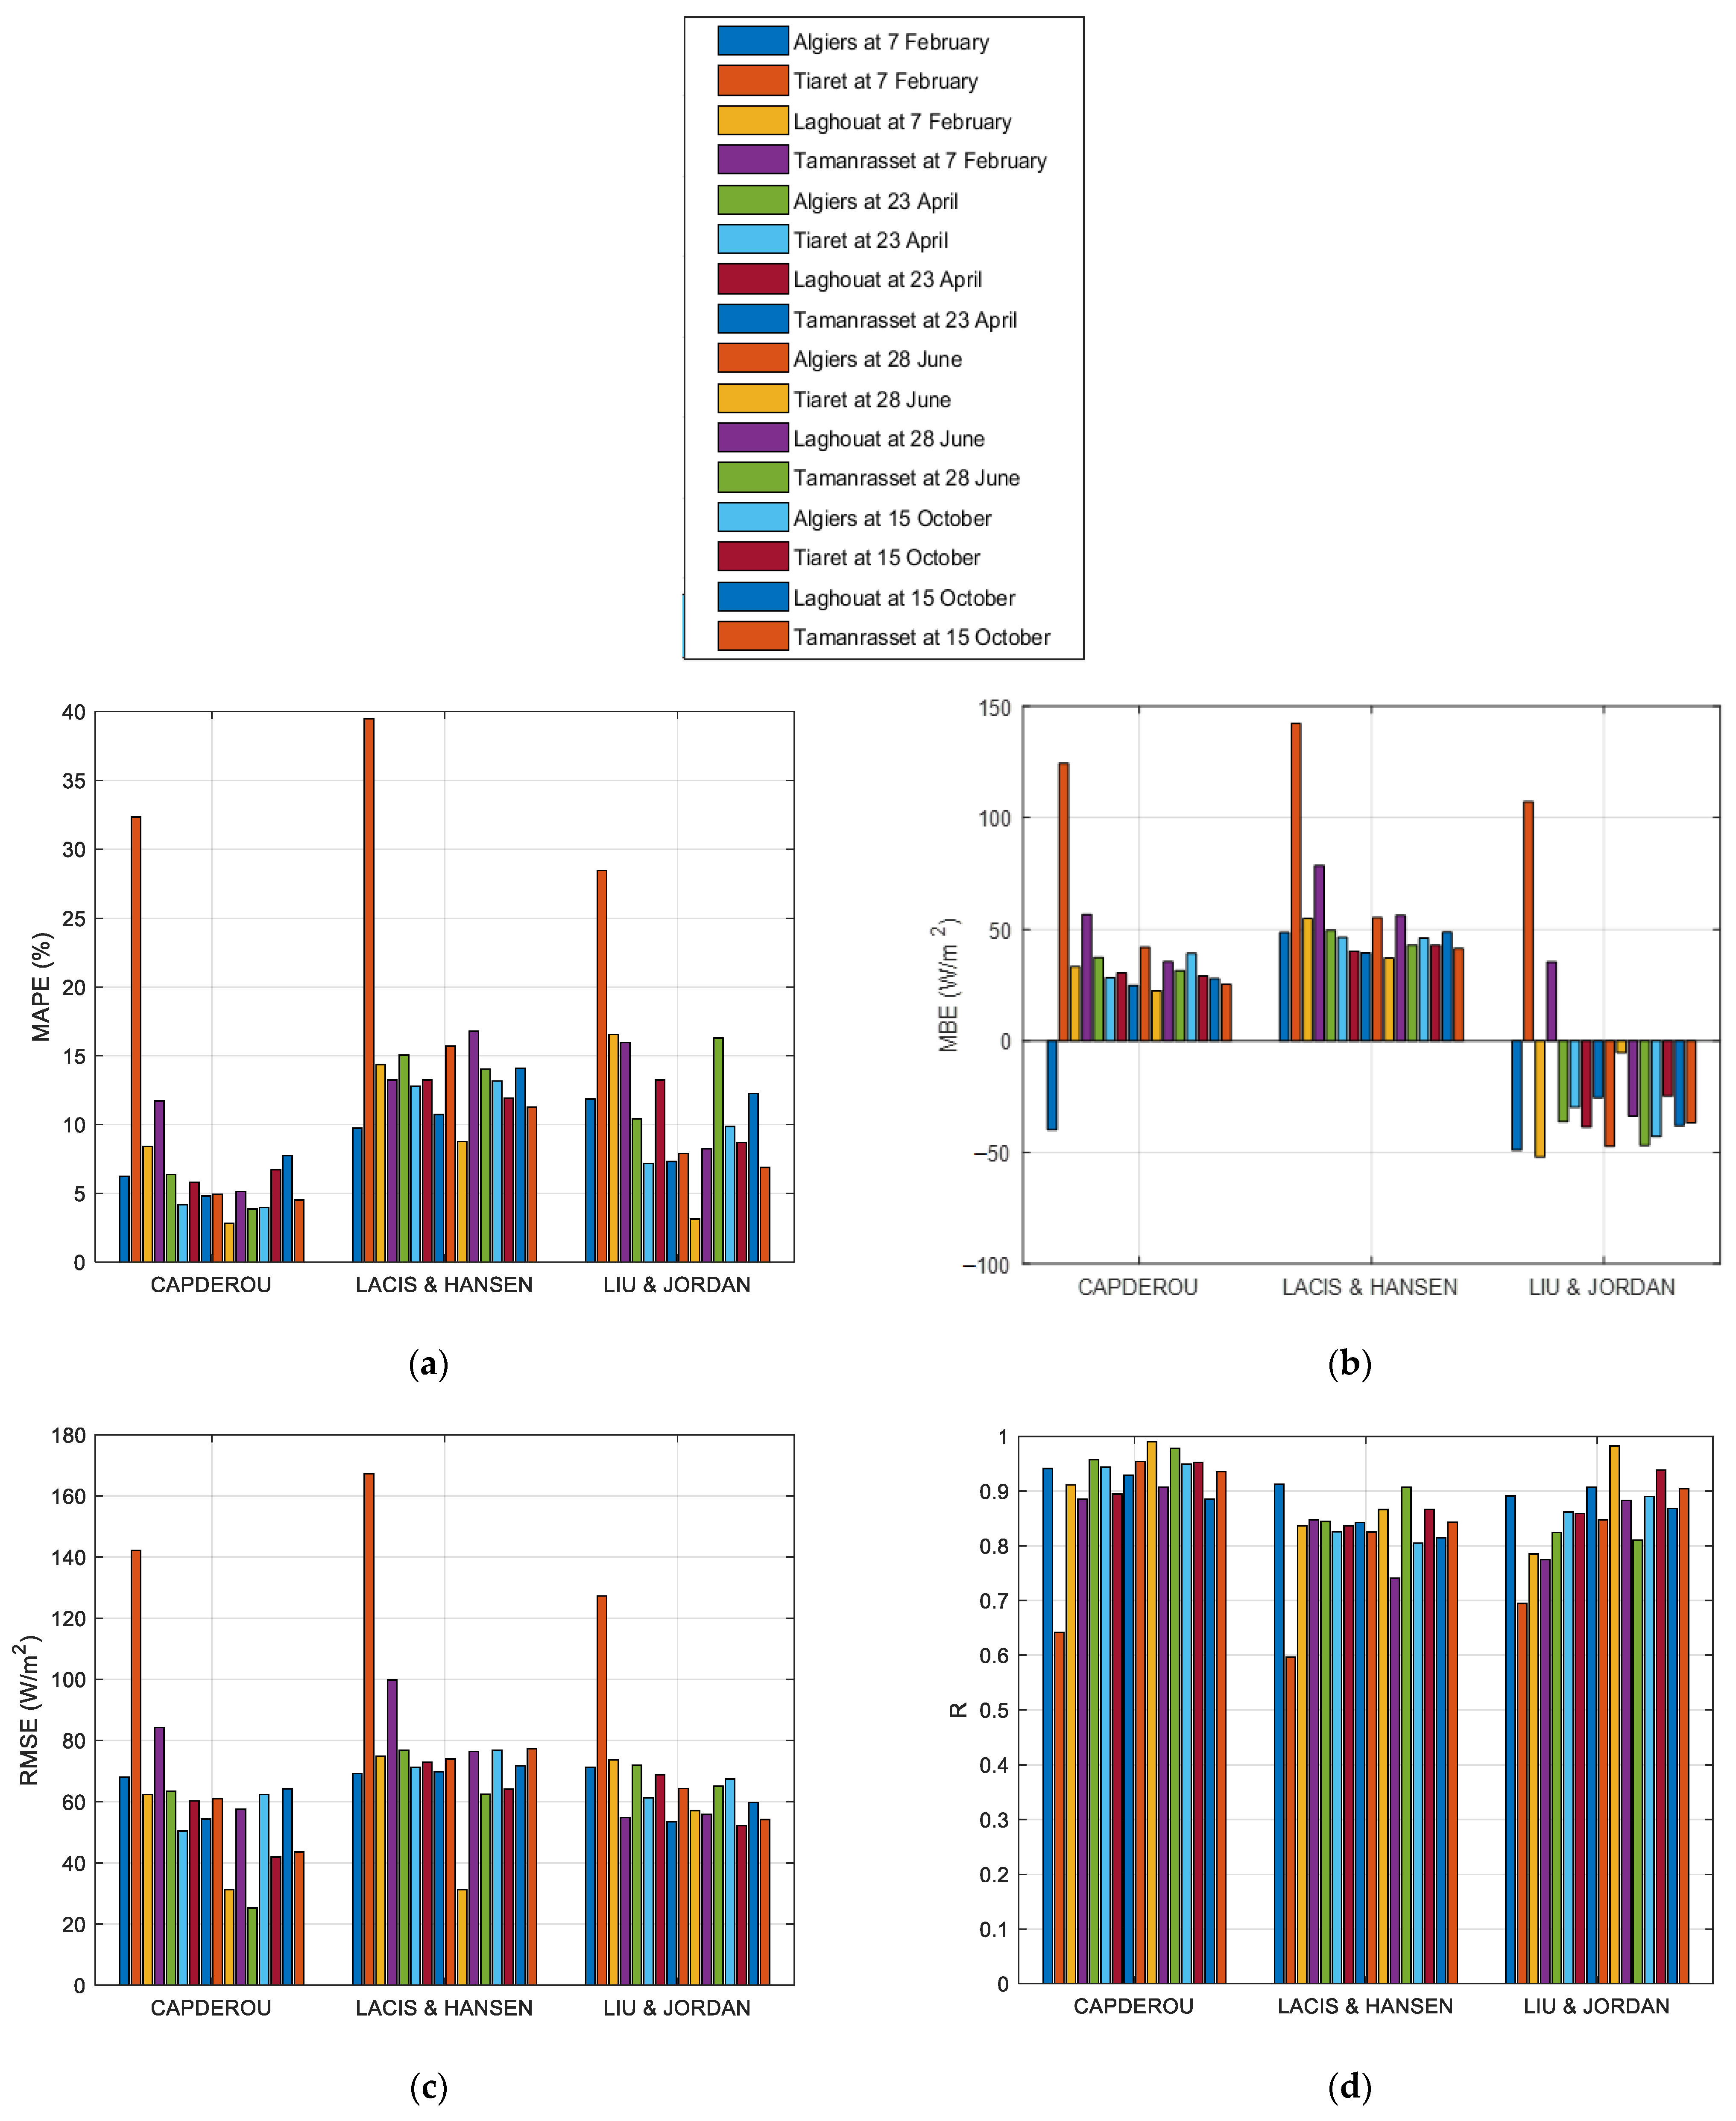
Figure 8.
Statistical errors for all studied models [17,23,25,31,33,34]: (a) MAPE; (b) MBE; (c) RMSE; (d) R.
In fact, the curves representative of the global solar radiation reveal that the Lacis and Hansen model overestimates the global solar component in all cases, whether for the site of Algiers, Tiaret, Laghouat or the one of Tamanrasset, which appears in Table 3, whereat the averages of relative errors are quite high whilst the MBE values have been shown to be positive. However, this is explained by the fact that the general expressions for calculating global solar radiation proposed by this model only take into account the absorption coefficients of solar radiation by a few atmospheric constituents (ozone and water vapor), neglecting the other extinction coefficients due to the other constituents of the atmosphere, such as aerosols, oxygen and carbon dioxide. On the other hand, the Liu and Jordan model underestimates the measured values in most cases, as this appears in the MBE values, which are almost always negative. Furthermore, this model just makes use of constants indicating the sky’s condition, which influences the estimate of the global radiation. In the simulation, we chose the case of an average sky due to the presence of dust and aerosols in the air, as this explains the measured values, which are higher than those calculated by this model; hence, a non-negligible relative error value has been shown to exist.
Additionally, for the Capderou model, we find that the predicted values for the global solar component are often quite similar to the actual values. Usually, the average relative error is negligibly tiny, if not negligible. Furthermore, a sample instance may be seen on the 7 of February in Laghouat, on the 23 of April in Tiaret and on the 28 of June in Tiaret and Tamanrasset, whereat the curve generated by this model matches with the curve of the measured data, so that the relative error MAPE is very low (between 3 and 9%) and the correlation coefficient, R, is closer to 1 (superior at 0.94).
On the 7 February in Tamanrasset, a noticeable dip in the measured data occurs between 9:00 a.m. and 12:00 p.m., the measured values being significantly lower than those estimated by the models. This discrepancy can be attributed to the passage of clouds in the sky during this time, obstructing solar radiation. Similarly, for the Tiaret site on February 7, the models exhibit poor predictions, indicating the influence of climatic disturbances such as clouds and rain. The impact of these disturbances is evident in Table 3 and Figure 8, where statistical error values (MAPE, MBE, and RMSE) are considerably higher, and the correlation coefficient (R) is notably lower, ranging between 0.6 and 0.7. This underscores the models’ limitations in accurately estimating solar radiation under adverse weather conditions.
Considering the comprehensive results in Figure 8 and Table 3, the Capderou model consistently outperforms the other models, with the lowest values for MAPE, MBE, and RMSE. These lower values indicate the superior performance of the Capderou model compared to that of its counterparts. Furthermore, the model maintains excellent agreement with actual data on the majority of days. Consequently, the Capderou model emerges as the most reliable for predicting and estimating the solar global radiation component at ground level.
Moreover, the symmetrical behavior observed in Figure 7a,c,k,o around noon underscores the inherent symmetry prevalent in natural phenomena. In contrast, the unsymmetrical behavior seen in the measured data in Figure 7e,m can be explained by the presence of clouds during specific time intervals. Cloud cover during the period from 9 a.m. to 14 p.m. on 7 February in Tiaret and from 9 a.m. to 12 p.m. on the same day in Tamanrasset reduces the intensity of global radiation reaching the ground.
7. Conclusions
In Algeria, meteorological stations collect various meteorological data, with only limited radiometric data available. Consequently, digital techniques serve as an effective alternative for estimating and reconstructing global solar radiation using observed meteorological data. Additionally, semi-empirical models retain significance, offering a practical approach for managing solar field utilization and addressing concerns related to sustainable development, encompassing both environmental considerations and supply security.
This study specifically focuses on the estimation of solar radiation using the Capderou, Lacis and Hansen, and Liu and Jordan models. Each model employs unique equations for calculating global solar radiation. To validate our findings, the estimated values derived from these empirical models are compared to measured data from select Algerian sites. Generally, the results obtained through the simulation of these models demonstrate high satisfaction when comparing measured and estimated values. Notably, the Capderou model exhibits an advantage over the other models, suggesting promising outcomes in contrast to existing literature. However, a limitation is acknowledged; these models prove less effective under weather conditions that disturb the sky state, such as those with clouds or rain. In such scenarios, the utilization of models based on satellite images is encouraged—a potential avenue for future research.
Based on the achieved results, particularly the low value of the statistical error parameter (MAPE), which generally does not exceed 7% for the Capderou model, around 15% on average for the Lacis and Hansen model, and approximately 11% for the Liu and Jordan model, this study emerges as a valuable tool for calculating and estimating global solar radiation at ground level throughout the year, applicable to all cities in Algeria and potentially in other regions with similar climate conditions.
In light of the Algerian government’s commitment to the 2020–2030 renewable energy development program, aiming to generate 27% of electricity from solar energy by 2030, this work assumes significance. It can serve as an effective and valuable tool in establishing the foundational calculations for the design and implementation of solar projects in Algeria, contributing to the country’s broader renewable energy objectives and the preservation of its gas reserves.
Author Contributions
Conceptualization, I.R.; methodology, I.R.; software, I.R.; validation, I.R., O.B., M.Y.S. and A.C.; formal analysis, I.R. and M.Y.S.; investigation, I.R., O.B. and M.Y.S.; resources, O.B.; data curation, I.R., O.B., M.Y.S. and A.C.; writing—original draft preparation, I.R.; writing—review and editing, I.R., O.B. and M.Y.S.; visualization, I.R., O.B., M.Y.S. and A.C.; supervision, I.R. and O.B.; funding acquisition, O.B. All authors have read and agreed to the published version of the manuscript.
Funding
The authors wish to express their gratitude to the Basque Government through the project EKOHEGAZ II (ELKARTEK KK-2023/00051), to the Diputación Foral de Álava (DFA) through the project CONAVANTER, and to the UPV/EHU through the project GIU20/063 for supporting this work.
Data Availability Statement
The data presented in this study are available in the article.
Acknowledgments
The authors wish to express their gratitude to the Basque Government, to the Diputación Foral de Álava (DFA) and to the UPV/EHU, for supporting this work. Furthermore, the authors would like to acknowledge the projects supported by the Laboratory for Analysis and Control of Energy Systems and Electrical Networks, University of Amar Telidji, which played a vital role in making this research possible. Also, we thank the Renewable Energy Development Center in Algiers, Algeria, for providing meteorological data. sincere appreciation is extended to all the associates who have directly or indirectly contributed to this work.
Conflicts of Interest
The authors declare no conflicts of interest.
Appendix A
The network of meteorological stations in Algeria is sparsely populated and provides little data on the intensity of solar radiation. Further, Figure A1 and Table A1 make it evident that the majority of the nation’s meteorological stations are found in the north and the highlands, whilst their number is few in the south (the Sahara area), whereat solar radiation levels are high [38]. Additionally, and as observed in Figure A2, the databases include a lot of missing data since they have yet to stand for sufficient measurements.
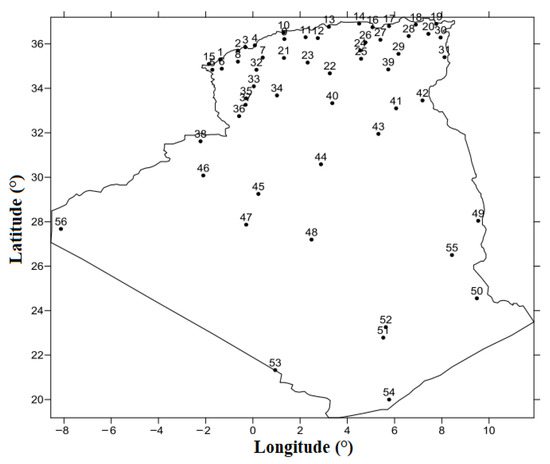
Figure A1.
Meteorological stations over Algeria [38].
Figure A1.
Meteorological stations over Algeria [38].
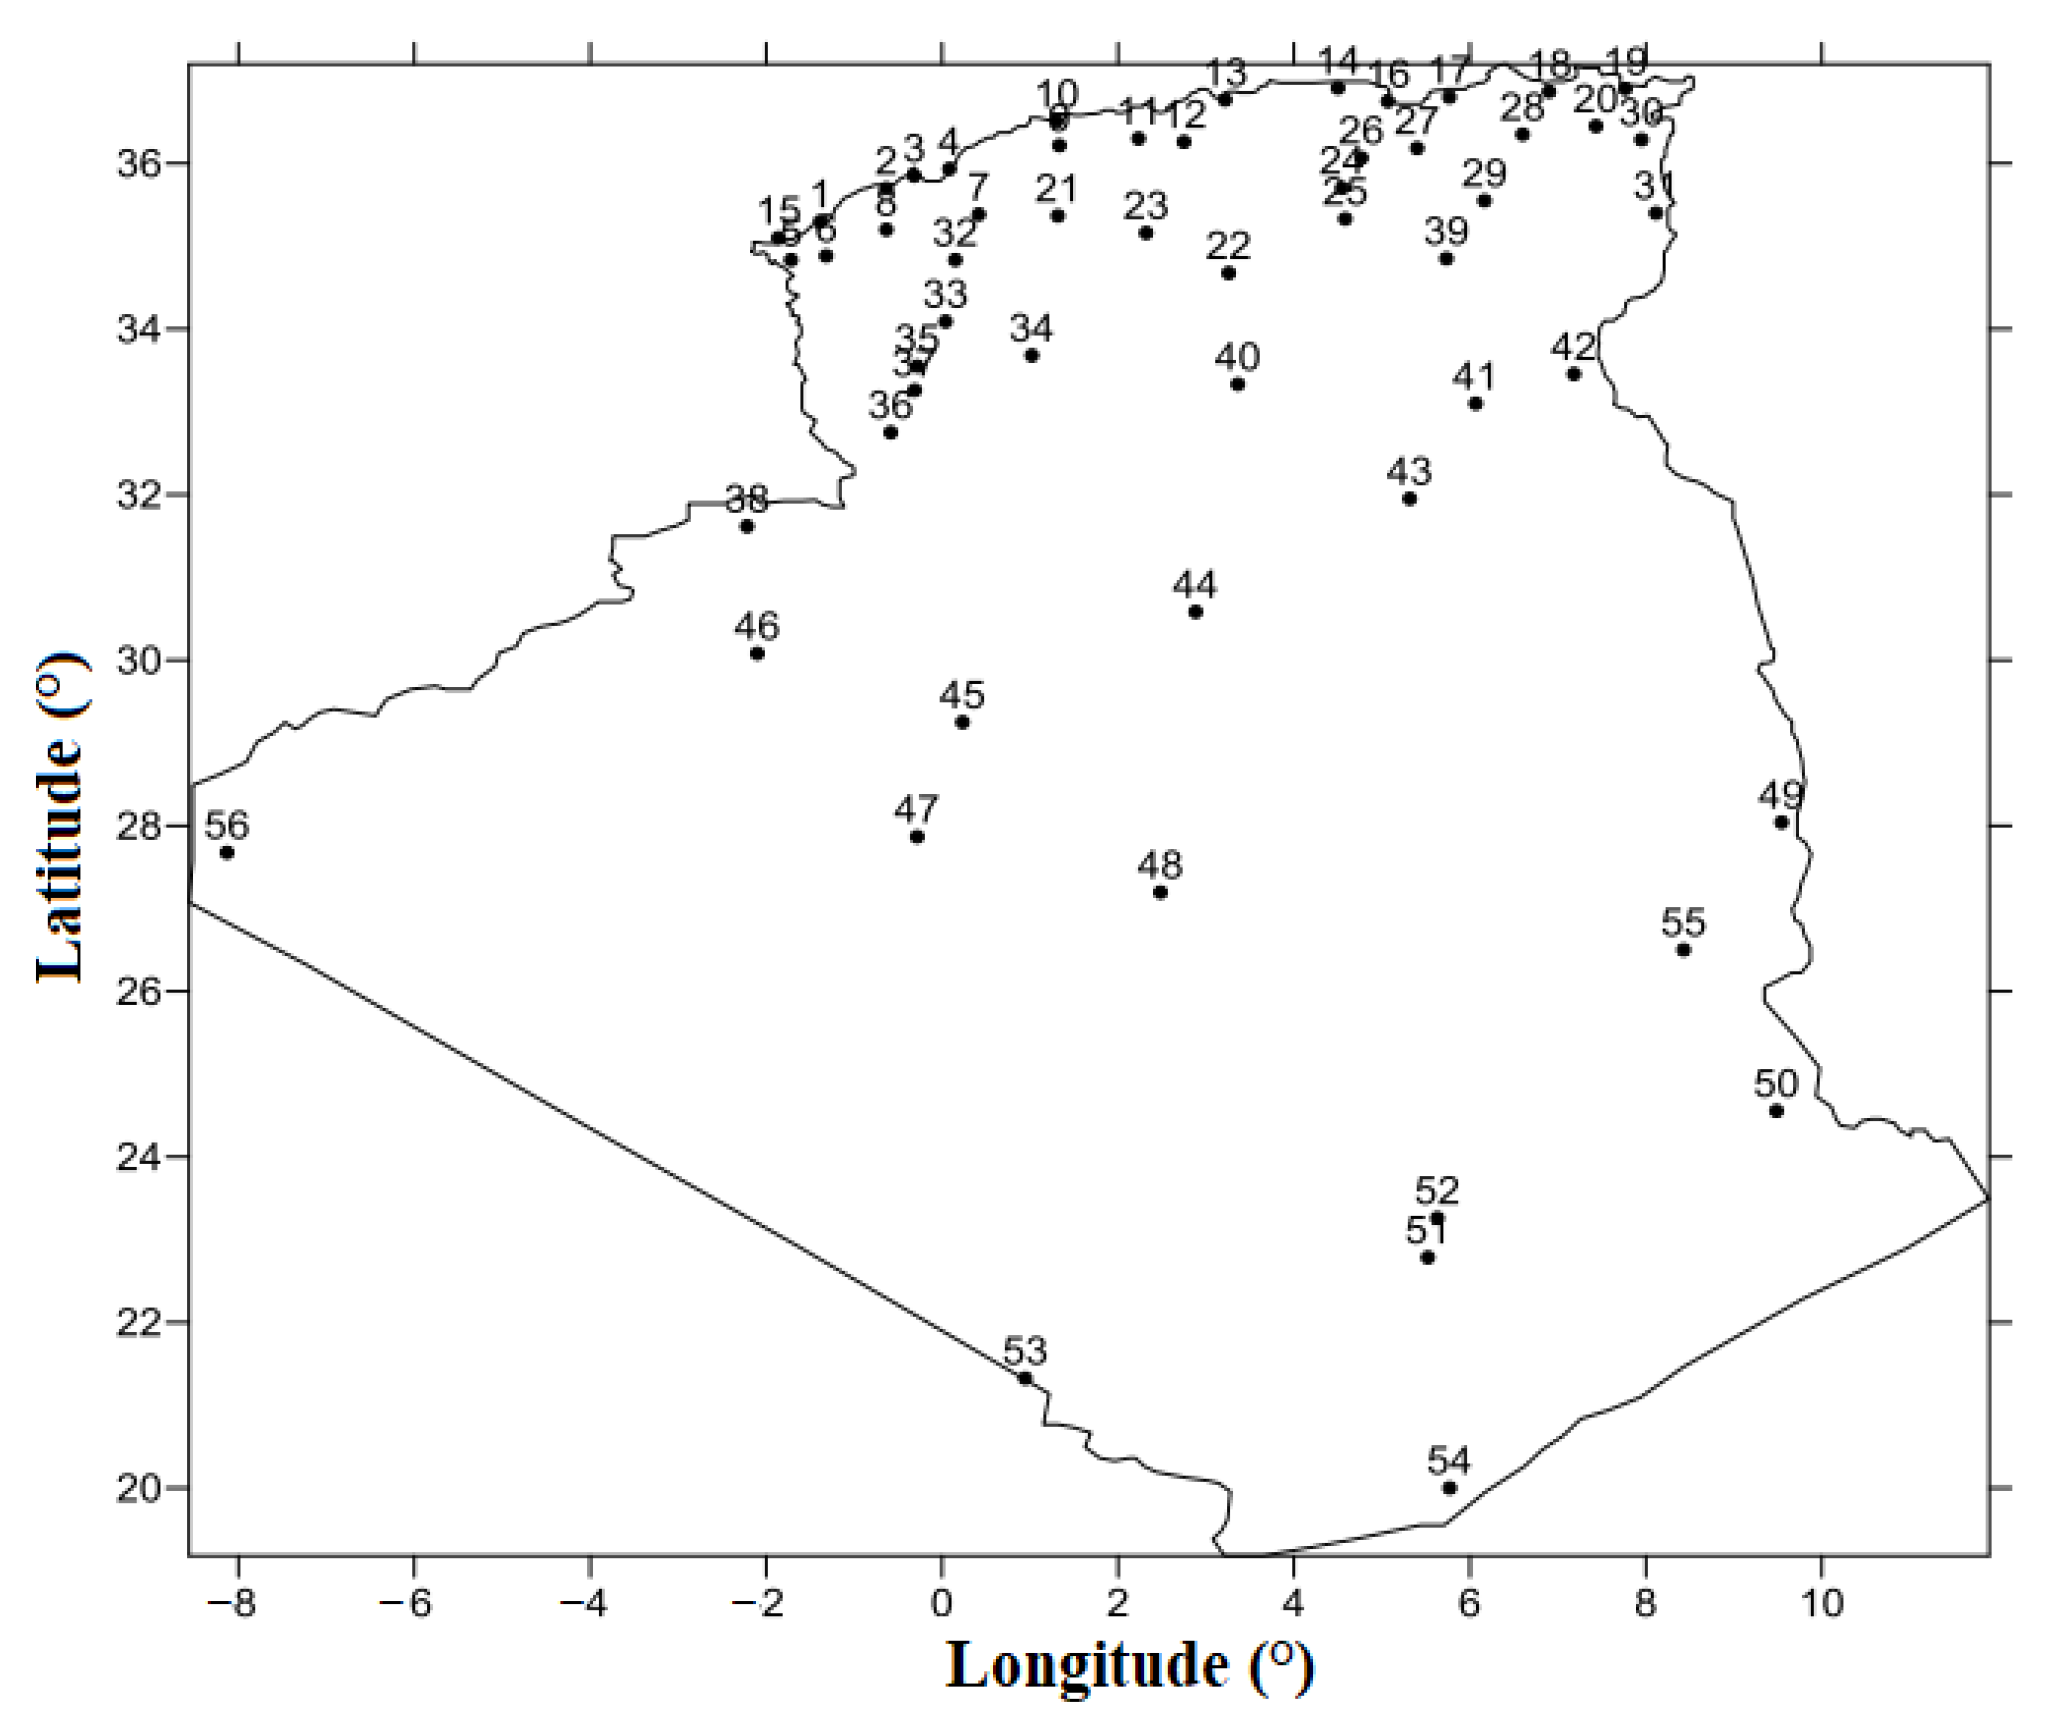
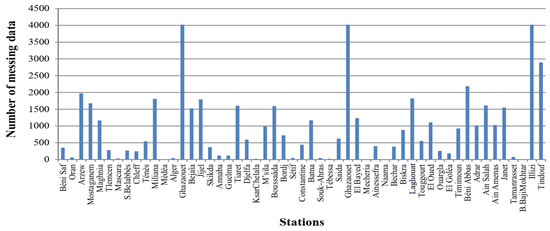
Figure A2.
Missing data in the meteorological network of Algeria [38].
Figure A2.
Missing data in the meteorological network of Algeria [38].
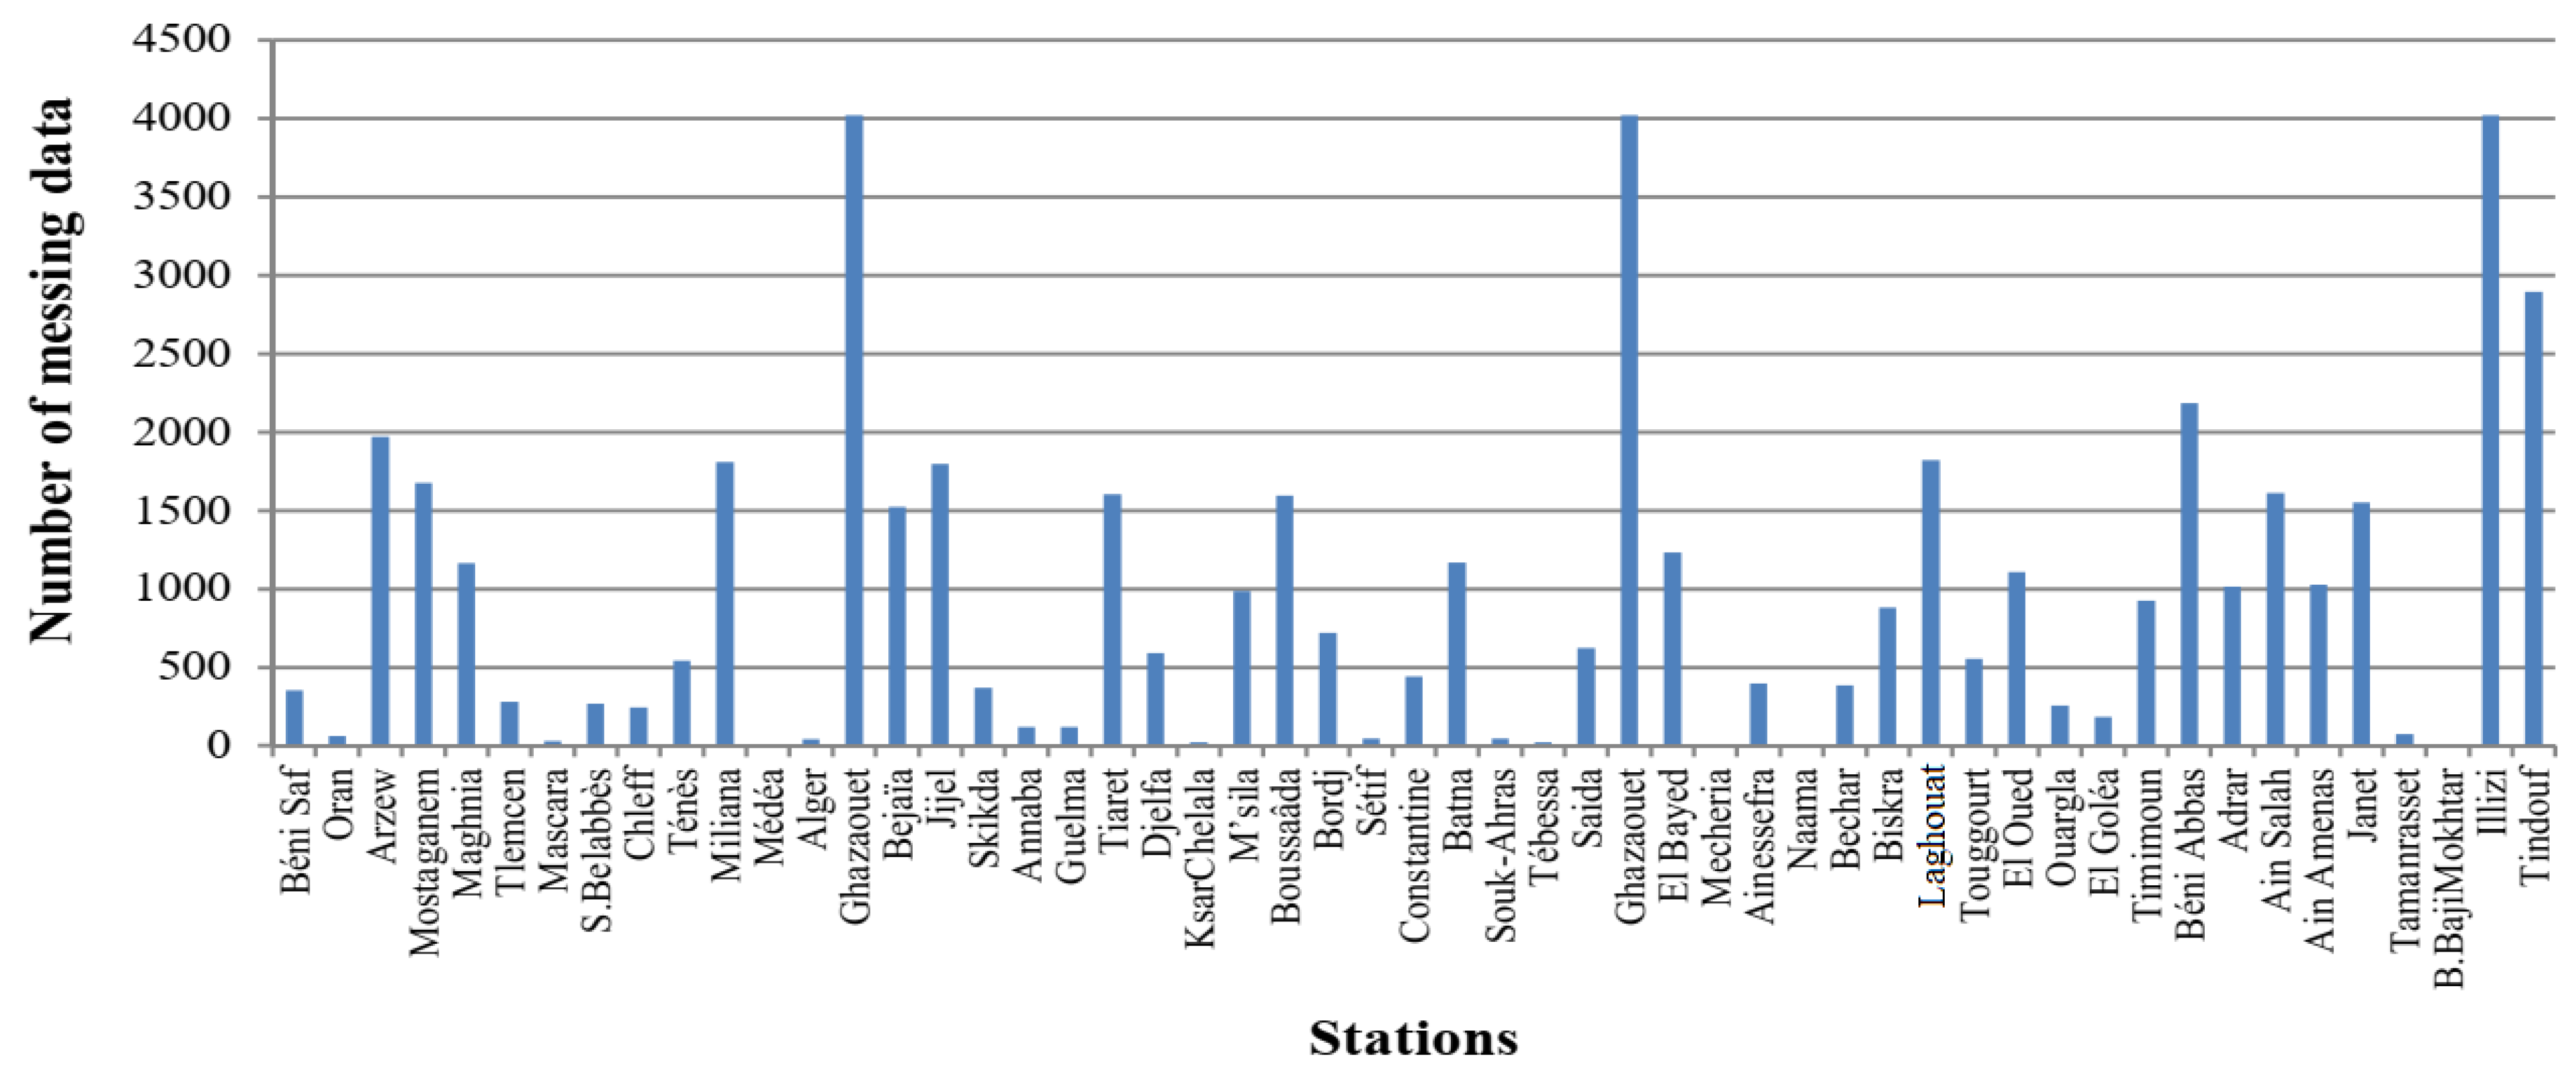
Table A1.
Geographical coordinates of meteorological stations in Algeria [38].
Table A1.
Geographical coordinates of meteorological stations in Algeria [38].
| N | Station | Longitude (°) | Latitude (°) | N | Station | Longitude (°) | Latitude (°) |
|---|---|---|---|---|---|---|---|
| 1 | Beni Saf | −1.33 | 35.25 | 29 | Batna | 6.35 | 35.71 |
| 2 | Oran | −0.60 | 35.63 | 30 | Souk-Ahras | 7.97 | 36.28 |
| 3 | Arzew | −0.26 | 35.81 | 31 | Tebessa | 8.11 | 35.41 |
| 4 | Mostaganem | 0.12 | 35.88 | 32 | Saida | 0.15 | 34.86 |
| 5 | Maghnia | −1.78 | 34.81 | 33 | Elkheiter | 0.04 | 34.09 |
| 6 | Tlemcen | −1.45 | 35.01 | 34 | El Bayed | 1.00 | 33.73 |
| 7 | Mascara | 0.30 | 35.60 | 35 | Mecheria | −0.26 | 33.55 |
| 8 | S.Belabbes | −0.65 | 35.18 | 36 | Ainessefra | −0.60 | 32.75 |
| 9 | Chleff | 1.33 | 36.21 | 37 | Naama | −0.30 | 33.26 |
| 10 | Tenes | 1.33 | 36.50 | 38 | Bechar | −2.25 | 31.63 |
| 11 | Miliana | 2.23 | 36.30 | 39 | Biskra | 5.73 | 34.80 |
| 12 | Médéa | 2.75 | 36.45 | 40 | Laghouat | 2.87 | 33.79 |
| 13 | Alger | 3.00 | 36.80 | 41 | Touggourt | 6.13 | 33.11 |
| 14 | Tizi Ouzou | 4.50 | 36.91 | 42 | El Oued | 6.78 | 33.50 |
| 15 | Ghazaouet | −1.86 | 35.10 | 43 | Ouargla | 5.40 | 31.91 |
| 16 | Bejaïa | 5.05 | 36.75 | 44 | El Golea | 2.86 | 30.56 |
| 17 | Jijel | 5.57 | 36.80 | 45 | Timimoun | 0.28 | 29.25 |
| 18 | Skikda | 6.90 | 36.88 | 46 | Béni Abbas | −2.16 | 30.13 |
| 19 | Annaba | 7.81 | 36.83 | 47 | Adrar | −0.18 | 27.81 |
| 20 | Guelma | 7.46 | 36.46 | 48 | Ain Salah | 2.47 | 27.20 |
| 21 | Tiaret | 1.32 | 35.36 | 49 | Ain Amenas | 9.63 | 28.05 |
| 22 | Djelfa | 3.25 | 34.68 | 50 | Janet | 9.47 | 24.26 |
| 23 | KsarChelala | 2.32 | 35.16 | 51 | Tamanrasset | 5.52 | 22.78 |
| 24 | M’sila | 4.50 | 35.66 | 52 | Assekrem | 5.63 | 23.26 |
| 25 | Boussaâda | 4.20 | 35.33 | 53 | B.BajiMokhtar | 0.57 | 21.20 |
| 26 | Bordj | 4.66 | 36.06 | 54 | Ain Guezzam | 5.77 | 19.56 |
| 27 | Setif | 5.25 | 36.18 | 55 | Illizi | 8.43 | 26.50 |
| 28 | Constantine | 6.61 | 36.28 | 56 | Tindouf | −8.16 | 27.70 |
Appendix B
The absorption coefficient from the ozone of the Lacis and Hansen model is calculated via the following [17,39]:
is the ozone relative optical pathlength, and it is defined as follows:
is the relative optical air mass defined via the following:
is the vertical ozone-layer thickness (cm) under NTP (normal temperature and surface pressure)
is the latitude and is the longitude of the place.
The absorption coefficient from water vapor of the Lacis and Hansen model is calculated via the following:
is the pressure-corrected relative optical pathlength of precipitable water (cm) calculated via the following:
represents the precipitable water vapor thickness under NTP using the following formula:
is the temperature (Kelvin) and HR is the humidity (%).
The coefficient of absorption by the ozone layer is given by the following:
References
- Libra, M.; Mrazek, D.; Tyukhov, I.; Severova, L.; Poulek, V.; Mach, J.; Subrt, T.; Beranek, V.; Svoboda, R.; Sedlacek, J. Reduced real lifetime of PV panels—Economic consequences. Sol. Energy 2023, 259, 229–234. [Google Scholar]
- Mandal, A.; Sen, R.; Goswami, S.; Chakraborty, B. Comparative Study of Univariate and Multivariate Long Short-Term Memory for Very Short-Term Forecasting of Global Horizontal Irradiance. Symmetry 2021, 13, 1544. [Google Scholar] [CrossRef]
- Alsharif, M.; Younes, M.; Kim, J. Time Series ARIMA Model for Prediction of Daily and Monthly Average Global Solar Radiation: The Case Study of Seoul, South Korea. Symmetry 2019, 11, 240. [Google Scholar] [CrossRef]
- Ul Rehman Tahir, Z.; Hafeez, S.; Asim, M.; Amjad, M.; Farooq, M.; Azhar, M.; Amjad, G.M. Estimation of daily diffuse solar radiation from clearness index, sunshine duration and meteorological parameters for different climatic conditions. Sustain. Energy Technol. Assess. 2021, 47, 101544. [Google Scholar]
- Wang, L.; Liu, Y.; Li, T.; Xie, X.; Chang, C. The Short-Term Forecasting of Asymmetry Photovoltaic Power Based on the Feature Extraction of PV Power and SVM Algorithm. Symmetry 2020, 12, 1777. [Google Scholar] [CrossRef]
- Huang, Y.; Wu, Y. Short-Term Photovoltaic Power Forecasting Based on a Novel Autoformer Model. Symmetry 2023, 15, 238. [Google Scholar] [CrossRef]
- Iqbal, M. An Introduction to Solar Radiation; Academic Press: Cambridge, MA, USA; Department of Mechanical Engineering, University of British Columbia: Vancouver, BC, Canada, 1983; ISBN 9780323151818. [Google Scholar]
- Swartman, R.K.; Ogunlade, O. Solar radiation estimates from common parameters Array. Sol. Energy 1967, 11, 170–172. [Google Scholar] [CrossRef]
- Batlles, J.; Rubio, M.A.; Tovar, J.; Olmo, F.J. Empirical modeling of hourly direct irradiance by means of hourly global irradiance. Sol. Energy 2000, 25, 675–688. [Google Scholar] [CrossRef]
- Diabaté, L.; Remund, J.; Wald, L. LINKE turbidity factors for several sites in Africa. Sol. Energy 2003, 75, 111–119. [Google Scholar] [CrossRef]
- Meziani, F.; Boulifaa, M.; Ameur, Z. Determination of the global solar irradiation by MSG-SEVIRI images processing in Algeria. Adv. Renew. Energy Clean Environ. 2013, 36, 525–534. [Google Scholar] [CrossRef]
- Hove, T.; Manyumbu, E. Estimates of the LINKE turbidity factor over Zimbabwe using ground-measured clear-sky global solar radiation and sunshine records based on a modified ESRA clear-sky model approach. Renew. Energy 2013, 52, 190–196. [Google Scholar] [CrossRef]
- Yan, K.; Shen, H.; Wang, L.; Zhou, H.; Xu, M.; Mo, Y. Short-term solar irradiance forecasting based on a hybrid deep learning methodology. Information 2020, 11, 32. [Google Scholar] [CrossRef]
- Yang, L.; Cao, Q.; Yu, Y.; Liu, Y. Comparison of daily diffuse radiation models in regions of China without solar radiation measurement. Energy 2020, 191, 116571. [Google Scholar] [CrossRef]
- Diagne, H.M.; David, M.; Lauret, P.; Boland, J.; Schmutz, N. Review of solar irradiance forecasting methods and a proposition for small-scale insular grids. Renew. Sustain. Energy Rev. 2013, 27, 65–76. [Google Scholar] [CrossRef]
- Liu, B.; Jordan, R.C. The interrelationship and characteristic distribution of direct, diffuse and total solar radiation. Sol. Energy 1960, 4, 1–19. [Google Scholar] [CrossRef]
- Lacis, A.L.; Hansen, J.E. A parameterization for Absorption of Solar Radiation in the Earth’s Atmosphere. J. Atmos. Sci. 1974, 31, 118–133. [Google Scholar] [CrossRef]
- Bird, R.E.; Hulstrom, R.L. A Simplified Clear Sky Model for a Direct and Diffuse Insolation on Horizontal Surface; Solar Energy Research Institute: Goldon, CO, USA, 1981; Report number: SERI/TR-642-761. [Google Scholar]
- Paltridge, G.W.; Platt, C.M.R. Radiative Processes in Meteorology and Climatology; Elsevier Scientific Pub. Co.: Amsterdam, The Netherlands, 1976; Volume 103, issue 437, pp. 527–528. [Google Scholar]
- Mächler, M. Parameterization of Solar Irradiation under Clear Skies. Master’s Thesis, University of British Columbia, Vancouver, BC, Canada, 1983. [Google Scholar]
- Perez, R.; Stewart, R.; Arbogast, C.; Seals, R.; Scott, J. An Anisotropic Hourly Diffuse Model for Sloping Surfaces, ‘Description, Performance Validation, Site Dependency Evaluation. Sol. Energy 1986, 36, 481–497. [Google Scholar] [CrossRef]
- Muneer, T.; Younes, S.; Munawwar, S. Discourses on solar radiation modeling. Renew. Sustain. Energy Rev. 2007, 11, 551–602. [Google Scholar] [CrossRef]
- Capderou, M. Atlas Solaire de l’Algérie. Modèles Théorique et Expérimentaux; Tome 1, Vol. 1 et 2; Office des Publications Universitaires: Algiers, Algeria, 1987; Volume 2. [Google Scholar]
- Brichambrant, P.; Vauge, C. Le Gisement Solaire. Evaluation de la Ressource Energétique; Technique et Documentation; Lavoisier: Paris, France, 1982. [Google Scholar]
- El Mghouchi, Y.; Ajzoul, T.; Taoukil, D.; El Bouardi, A. The most suitable prediction model of the solar intensity, on horizontal plane, at various weather conditions in a specified location in Morocco. Renew. Sustain. Energy Rev. 2016, 54, 84–98. [Google Scholar] [CrossRef]
- El Mghouchi, Y.; El Bouardi, A.; Choulli, Z.; Ajzoul, T. Models for obtaining the daily direct, diffuse and global solar radiations. Renew. Sustain. Energy Rev. 2015, 56, 87–99. [Google Scholar] [CrossRef]
- Cooper, P.I. The absorption of solar radiation in solar stills. Sol. Energy 1969, 12, 333–346. [Google Scholar] [CrossRef]
- Duffie, J.; Beckman, W. Solar Engineering of Thermal Processes, 4th ed.; Wiley: New York, NY, USA, 2013; ISBN 978-0-470-87366-3. [Google Scholar]
- Davies, J.A.; Hay, J.E. Calculation of the solar radiation incident on a horizontal surface. In Proceedings of the First Canadian Solar Radiation Data Workshop, Toronto, ON, Canada, 17–19 April 1978. [Google Scholar]
- Hoyt, D.V. A model for the calculation of solar global insolation. Sol. Energy 1978, 21, 21–37. [Google Scholar] [CrossRef]
- Rougab, I.; Reguigue, M.; Cheknane, A. Contribution to the forecasting and estimation of solar radiation components at ground level in Algeria. Rom. J. Inf. Technol. Autom. Control 2023, 33, 43–56. [Google Scholar] [CrossRef]
- ASHRAE. Handbook of Fundamentals; American Society of Heating, Refrigeration, and Air-Conditioning Engineers: Atlanta, GA, USA, 1985. [Google Scholar]
- Yaïche, M.R.; Bekkouche, S.M.A. Estimation of global solar radiation in Algeria for different types of sky. Renew. Energy Rev. 2010, 13, 683–695. [Google Scholar]
- Mesri, M.; Rougab, I.; Cheknane, A.; Bachari, N.I. Estimation du rayonnement solaire au sol par des modèles semi-empiriques. Renew. Energy Rev. 2012, 15, 451–463. [Google Scholar]
- SolarGis, Solar Resource Maps of Algeria. Available online: https://solargis.com/maps-and-gisdata/download/algeria (accessed on 10 March 2023).
- Chen, J.L.; Yang, L.; Ma, M.; Chen, Q.; Wu, S.J.; Xiao, Z.L. Empirical models for estimating monthly global solar radiation: A most comprehensive review and comparative case study in China. Renew. Sustain. Energy Rev. 2019, 108, 91–111. [Google Scholar] [CrossRef]
- Ahao, Q.; Yao, W.X.; Wang, C.X.; Wang, Y. Study on the influence of fog and haze on solar radiation based on scattering-weakening effect. Renew. Energy 2019, 134, 178–185. [Google Scholar]
- Benmouiza, K. Quantification of Solar Radiation in Algeria, Application to the Sizing of Photovoltaic Systems. Ph.D. Thesis, University of Tlemcen, Tlemcen, Algeria, 2015. [Google Scholar]
- Talbi, K.; Harrouni, S. Evaluating Semi-Empirical Models for Global Solar Radiation on Inclined Surfaces in South of Algeria. In Proceedings of the 3rd CISTEM’18, Algiers, Algeria, 29–31 October 2018. [Google Scholar]
Disclaimer/Publisher’s Note: The statements, opinions and data contained in all publications are solely those of the individual author(s) and contributor(s) and not of MDPI and/or the editor(s). MDPI and/or the editor(s) disclaim responsibility for any injury to people or property resulting from any ideas, methods, instructions or products referred to in the content. |
© 2024 by the authors. Licensee MDPI, Basel, Switzerland. This article is an open access article distributed under the terms and conditions of the Creative Commons Attribution (CC BY) license (https://creativecommons.org/licenses/by/4.0/).