
Investigation of the Structural Dependence of the Cyclical Thermal Aging of Low-Voltage PVC-Insulated Cables


Abstract
1. Introduction
2. Methodology
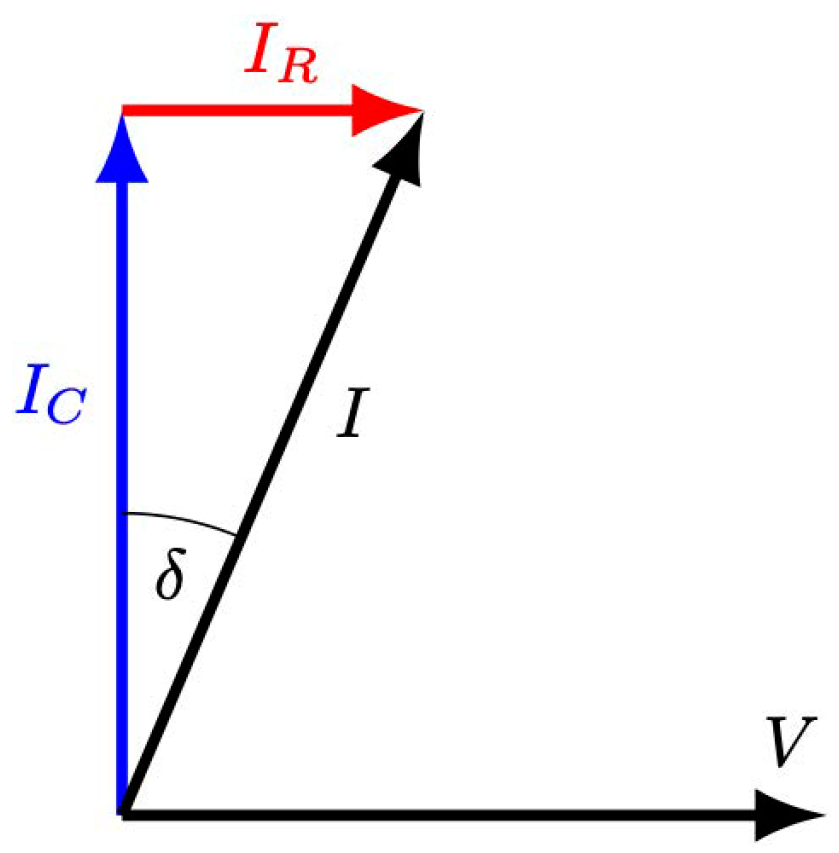
2.1. Dielectric Response Measurements
2.2. Hardness Testing
3. Experiment
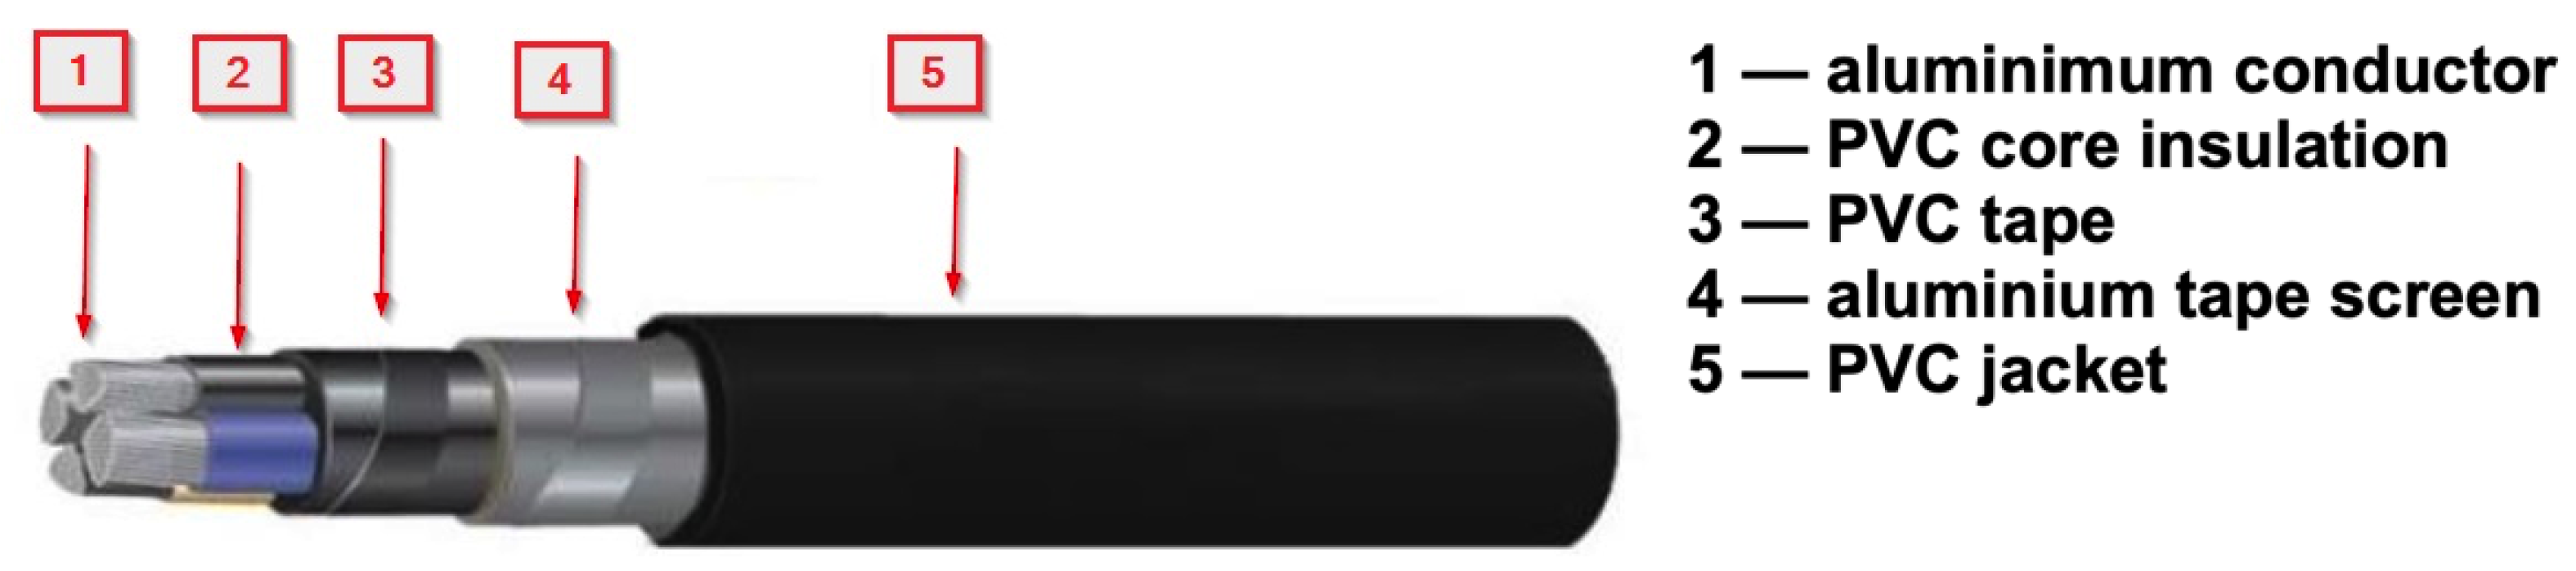
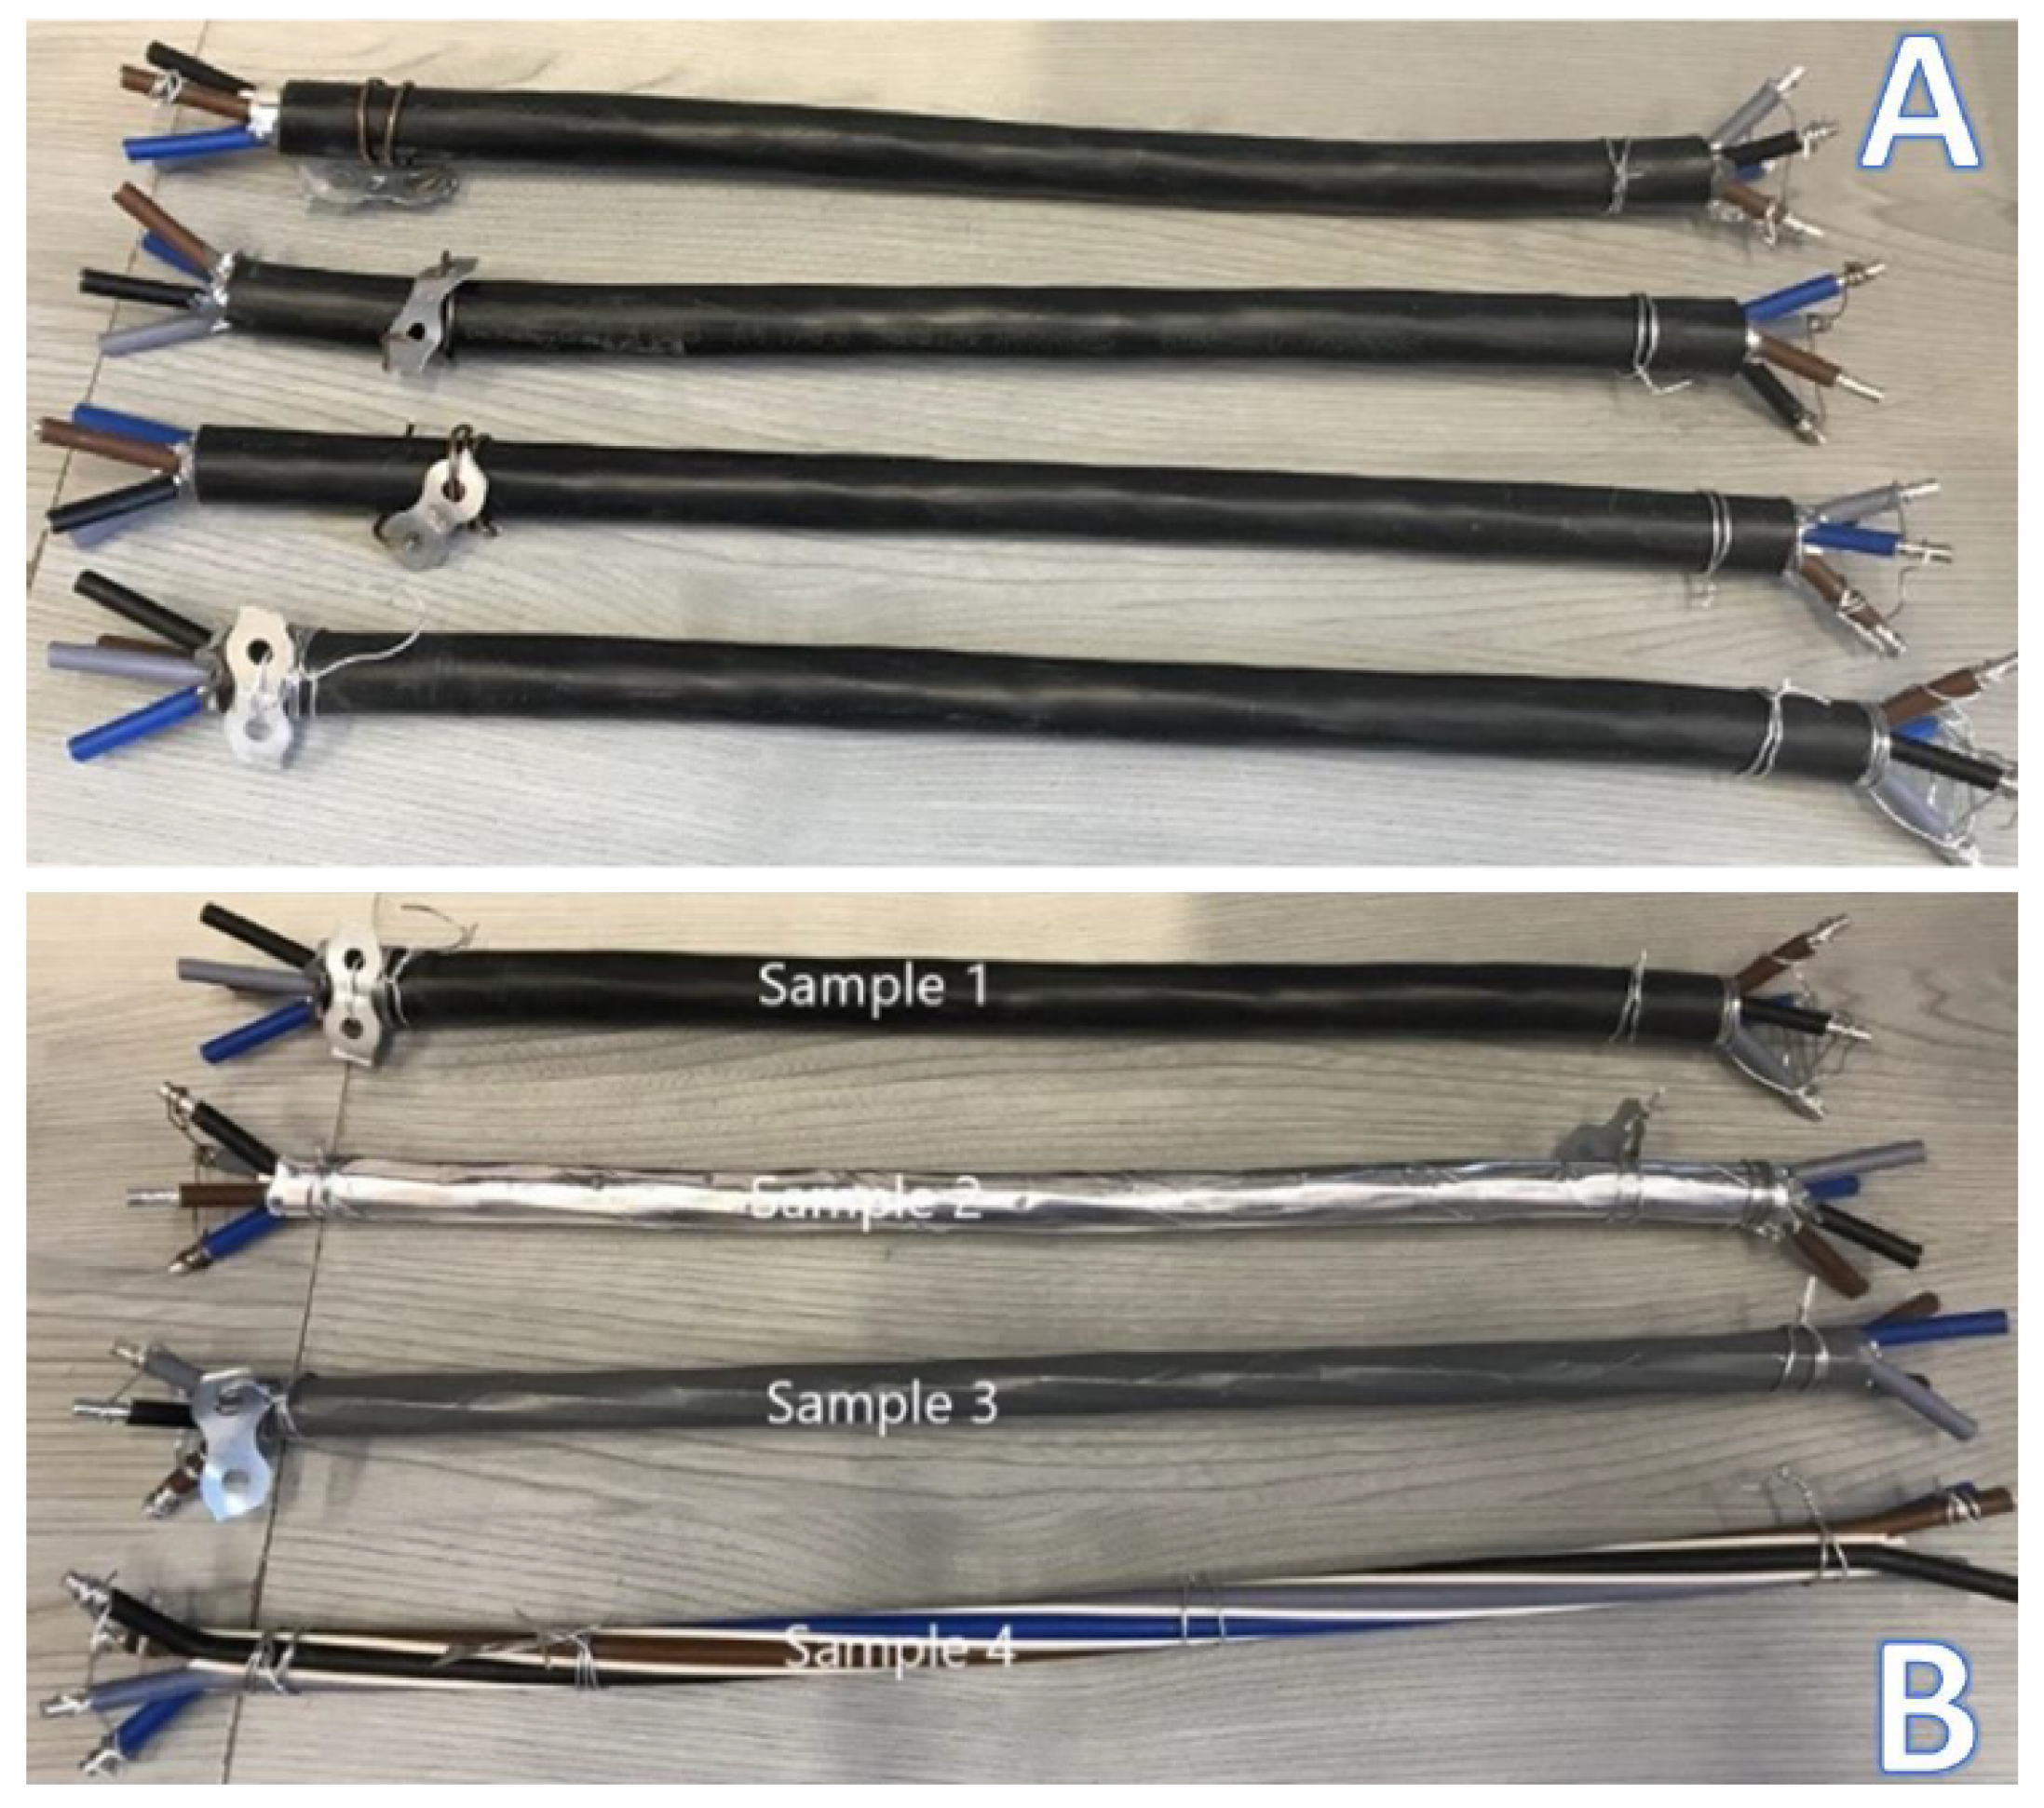
3.1. Cable Sample
- 1.
- 4 x Solid Aluminium Conductor.
- 2.
- PVC core insulation.
- 3.
- PVC tape.
- 4.
- Aluminium tape screen.
- 5.
- PVC jacket.
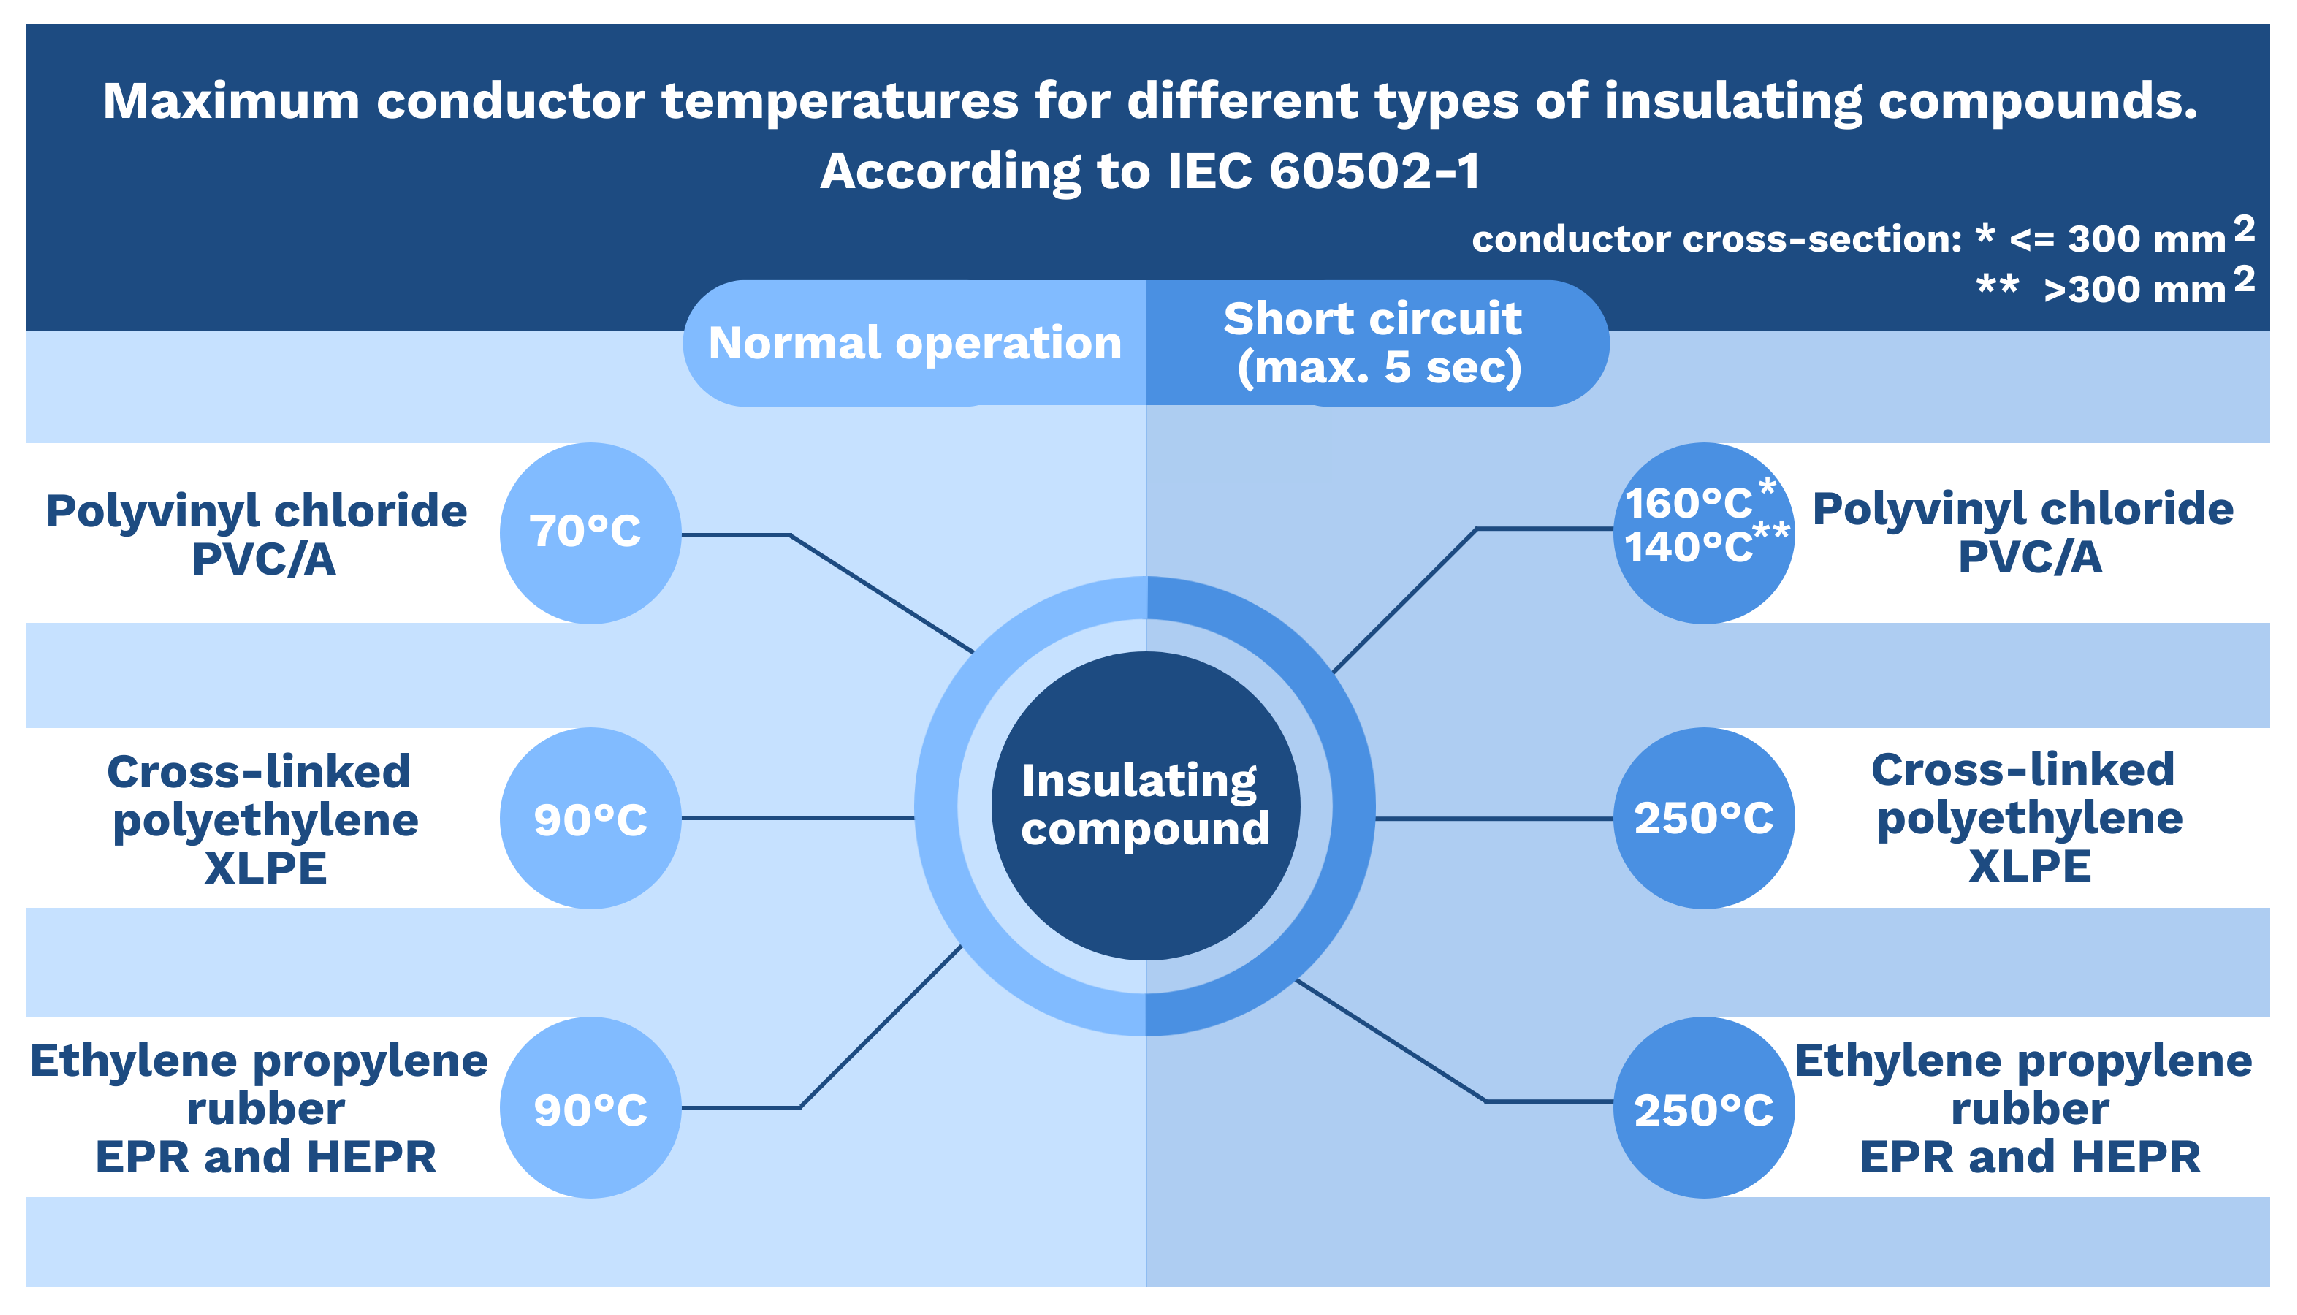
3.2. Thermal Aging
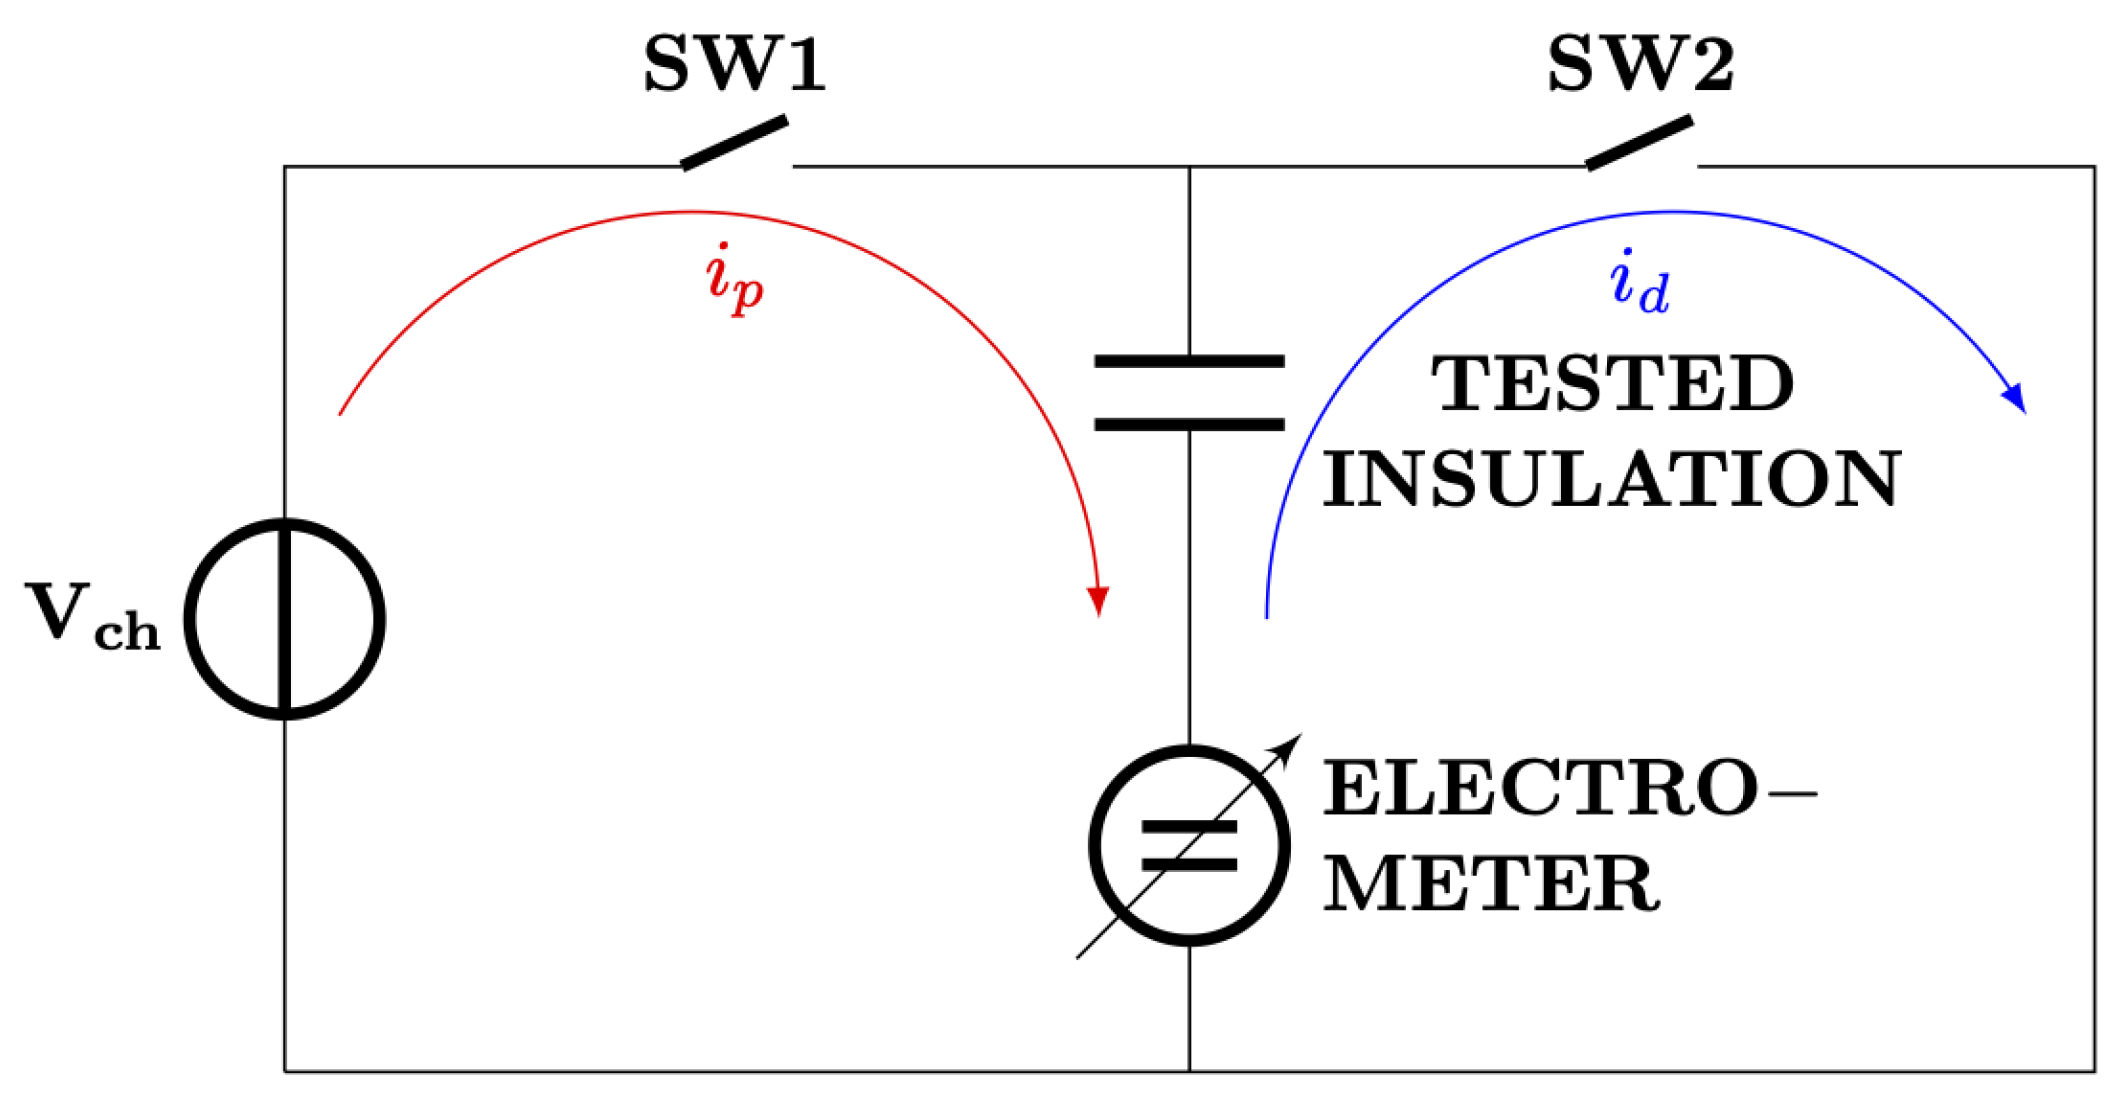
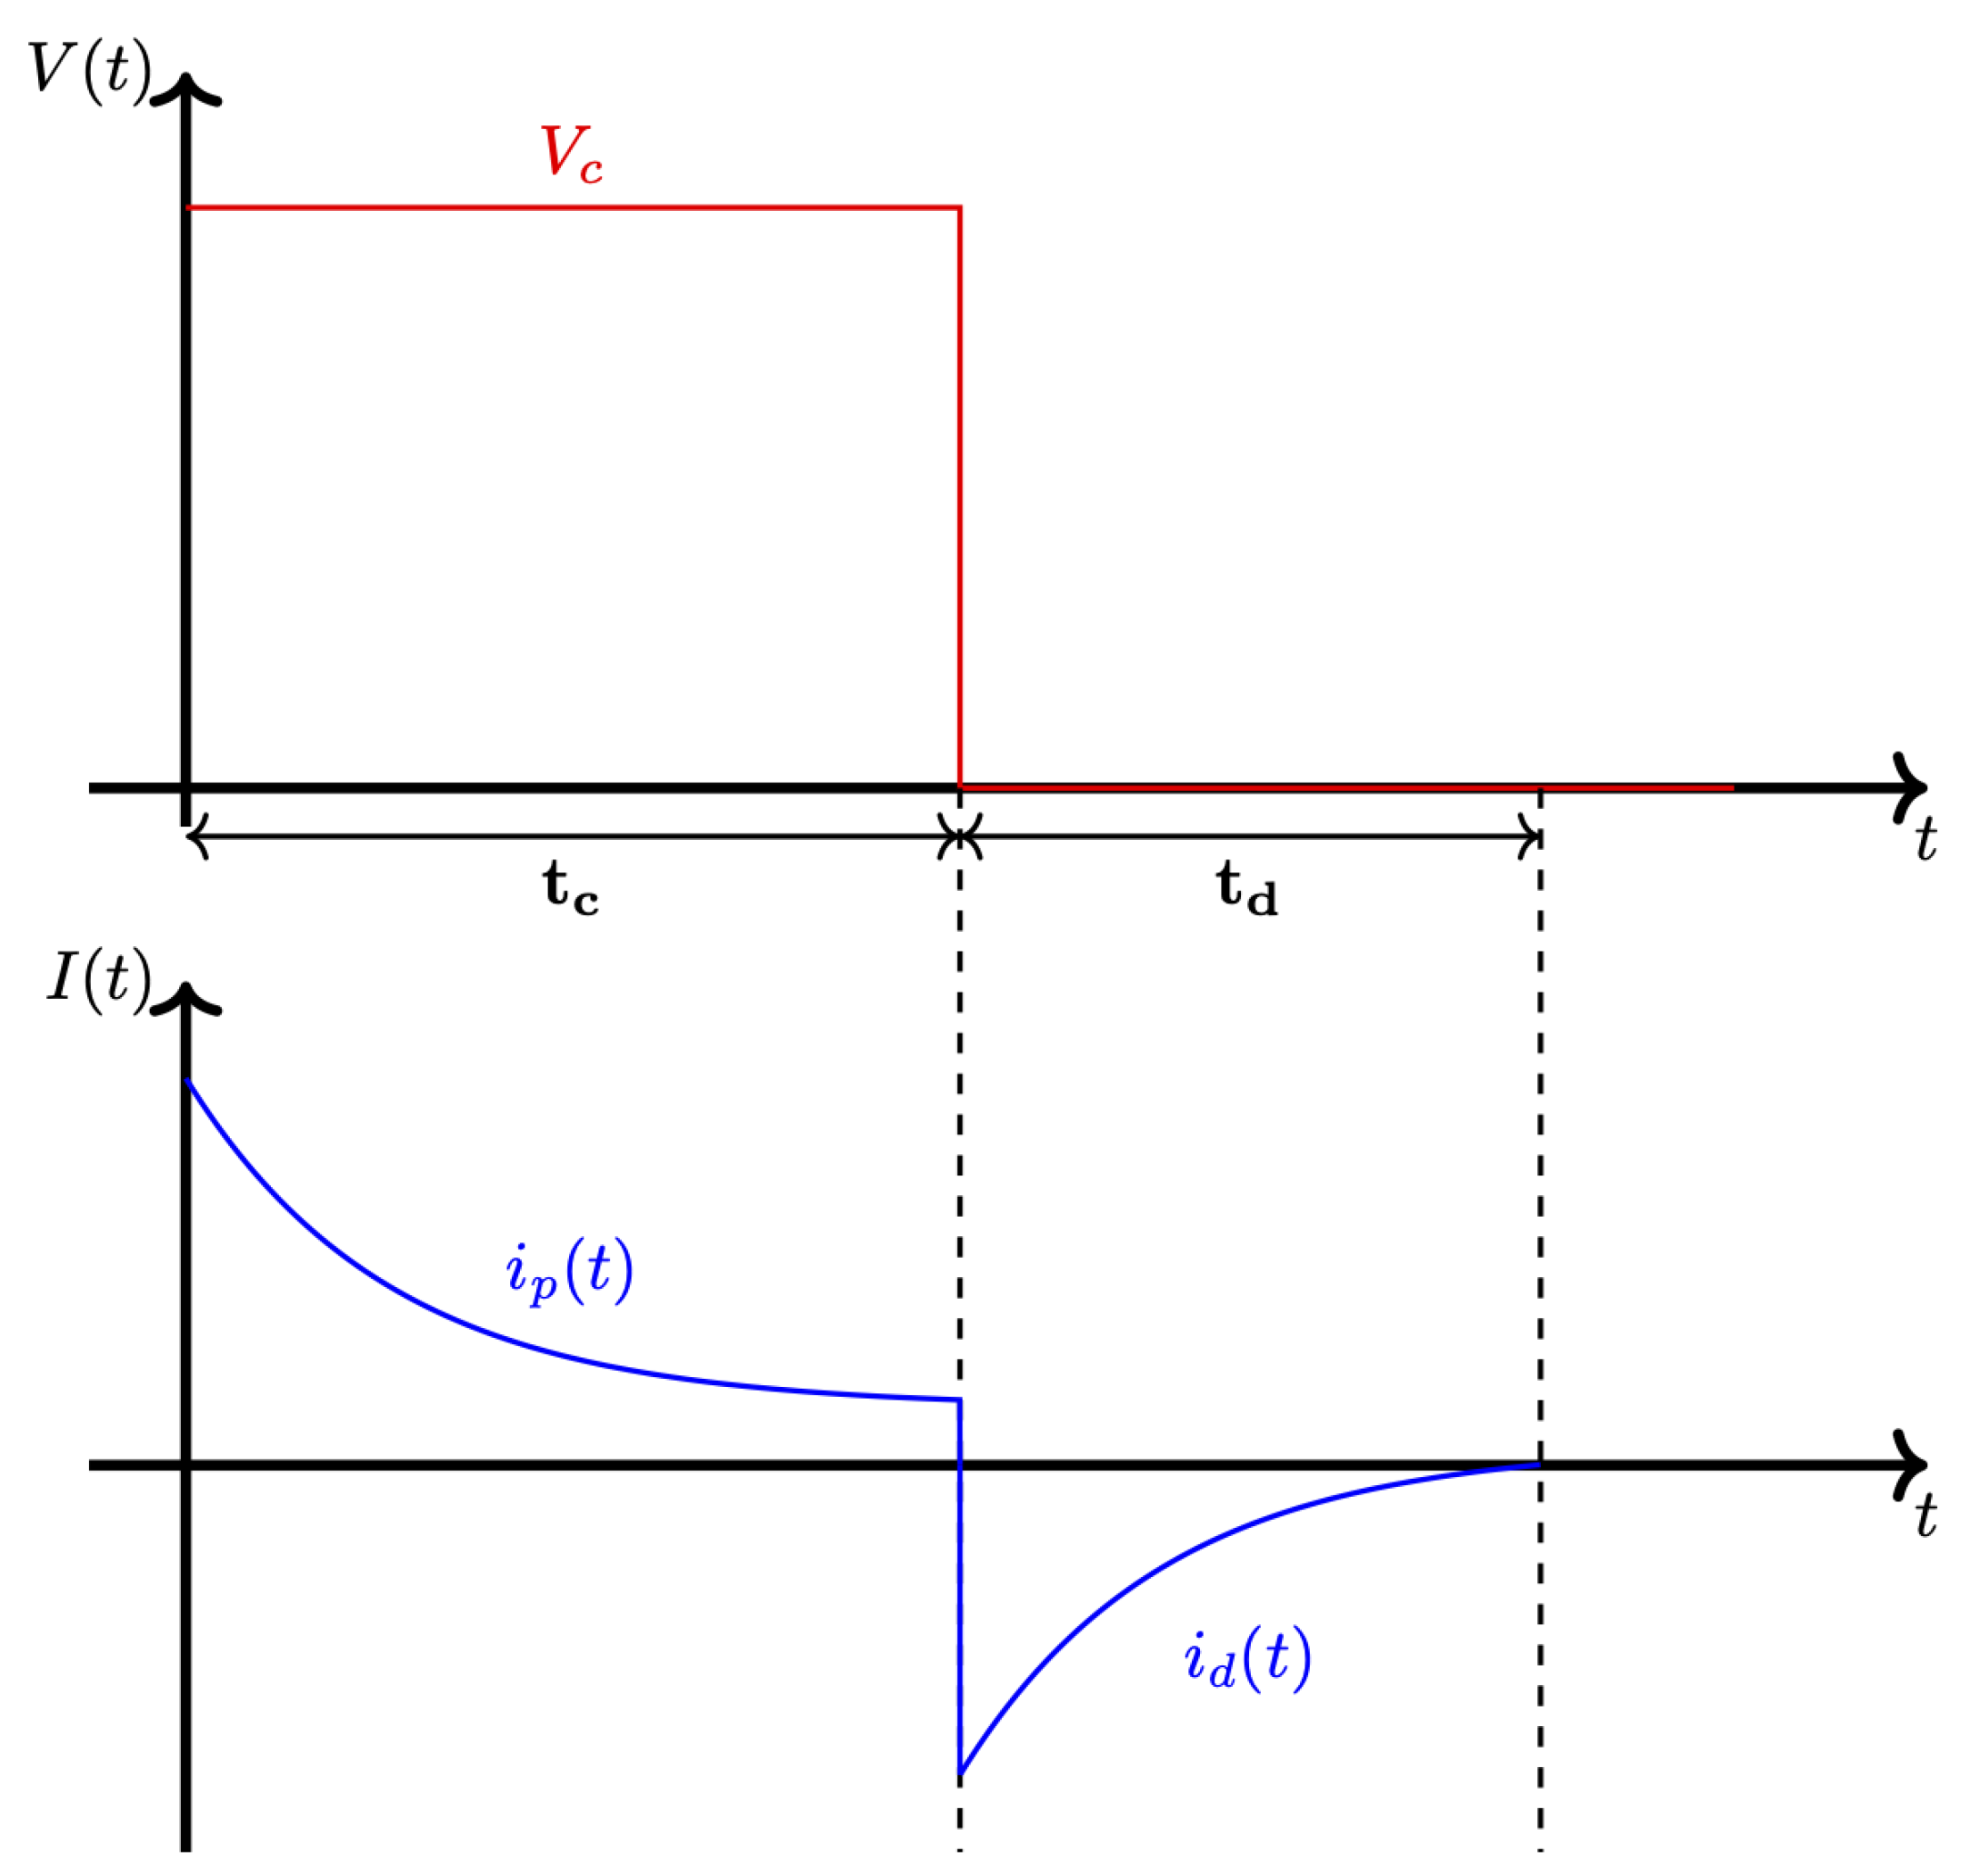
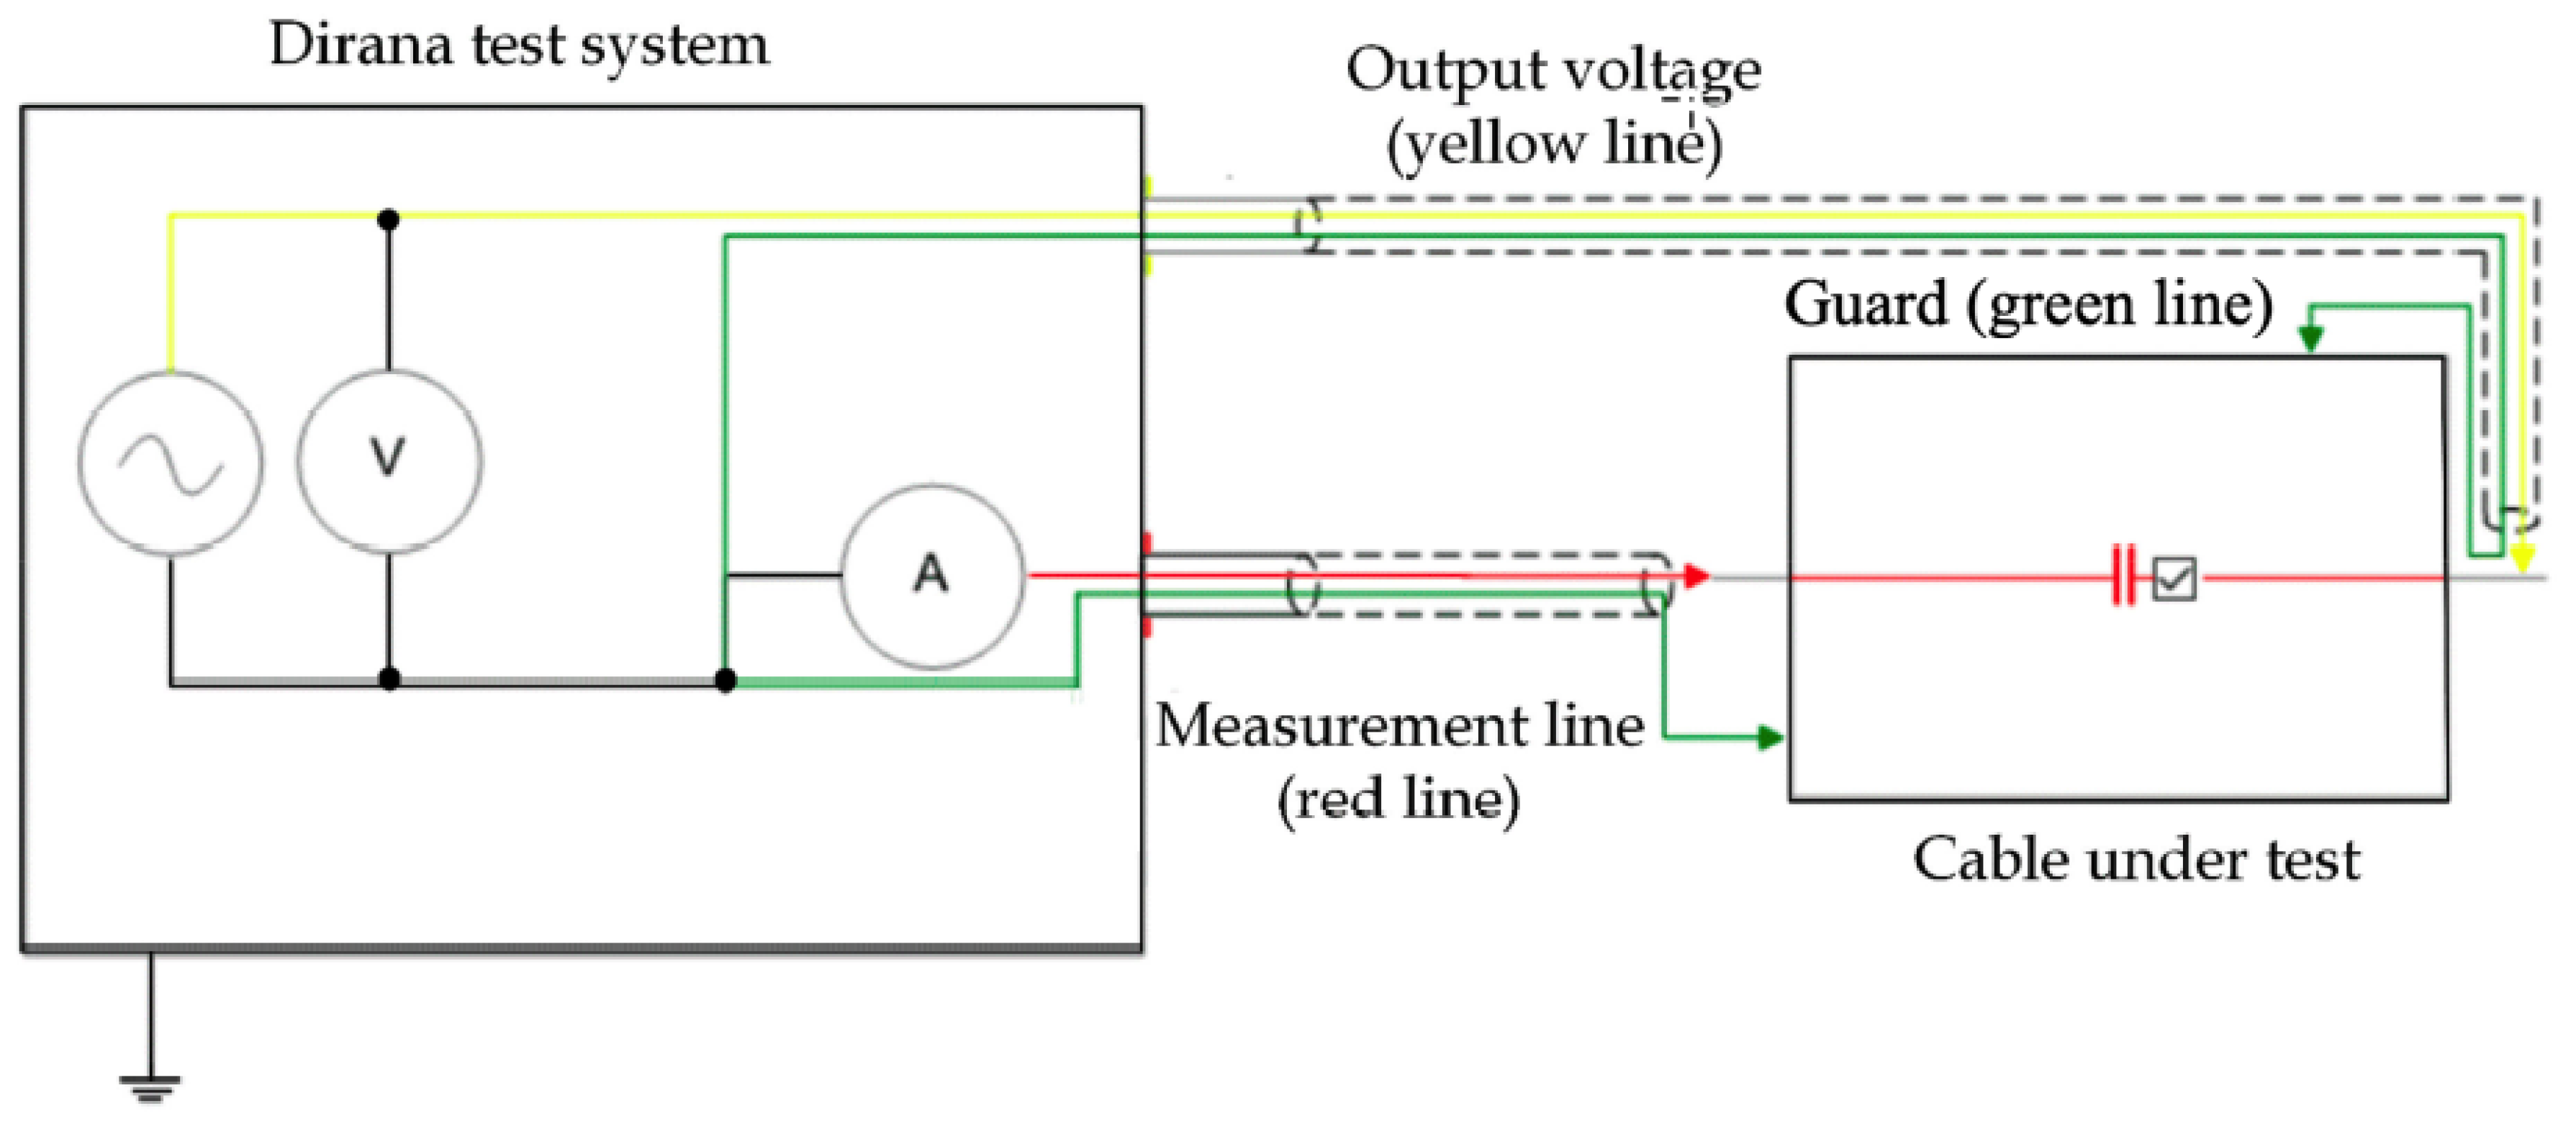
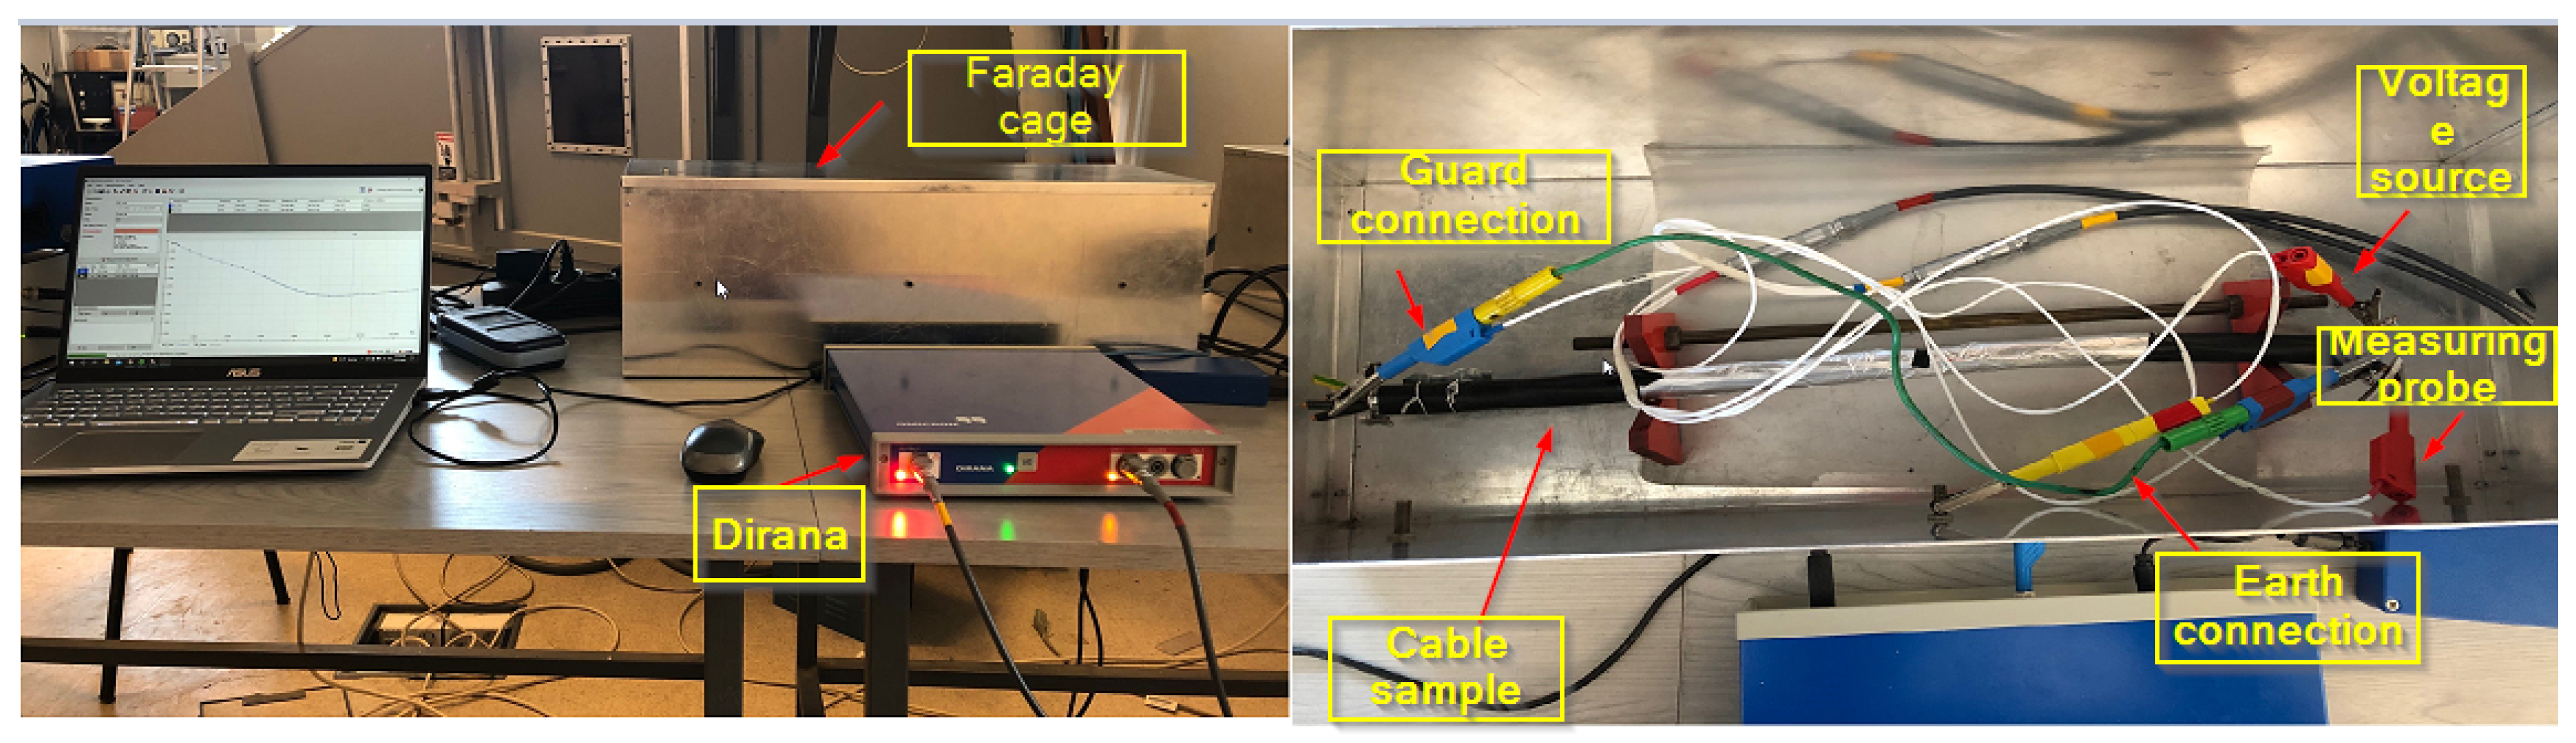
3.3. Dielectric Response Measurement
- Configuration: general dielectric.
- Test voltage: 100 V.
- Frequency range: 300 μHz–5 kHz.
- Charging time: 3333 s.
- Discharging time: 1000 s.
3.4. Shore D Hardness Measurement
4. Results and Discussion
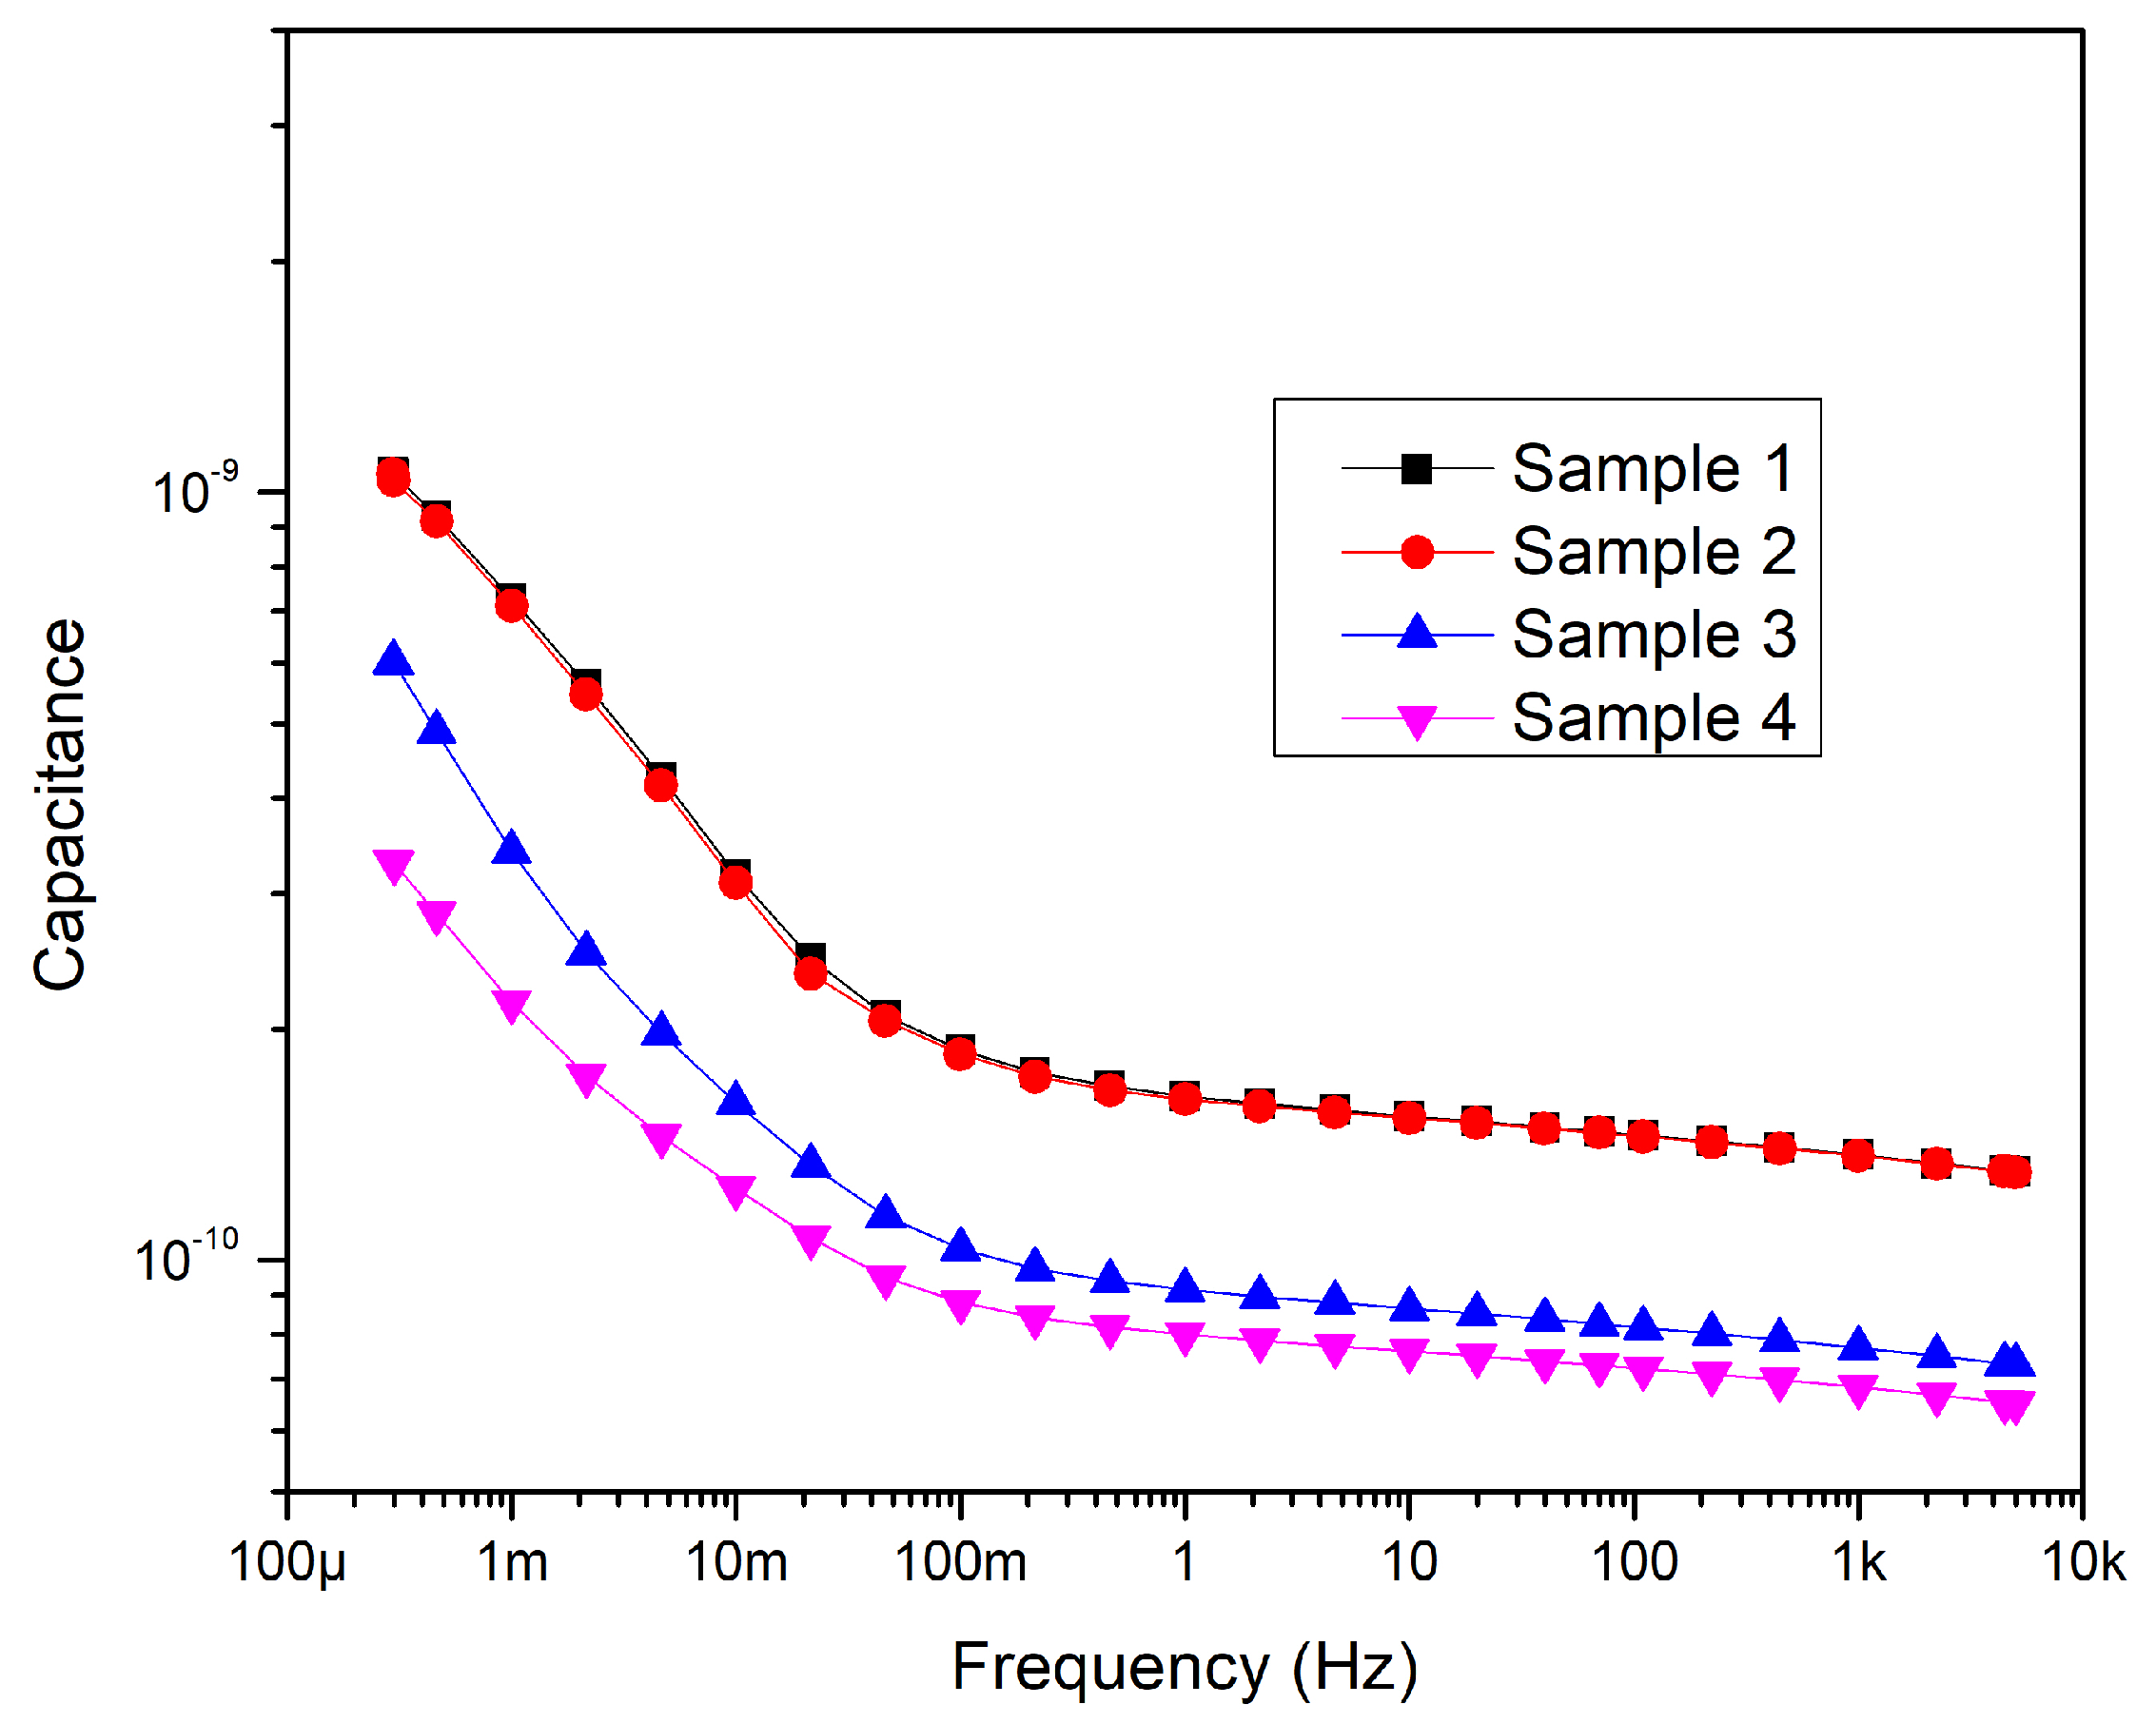
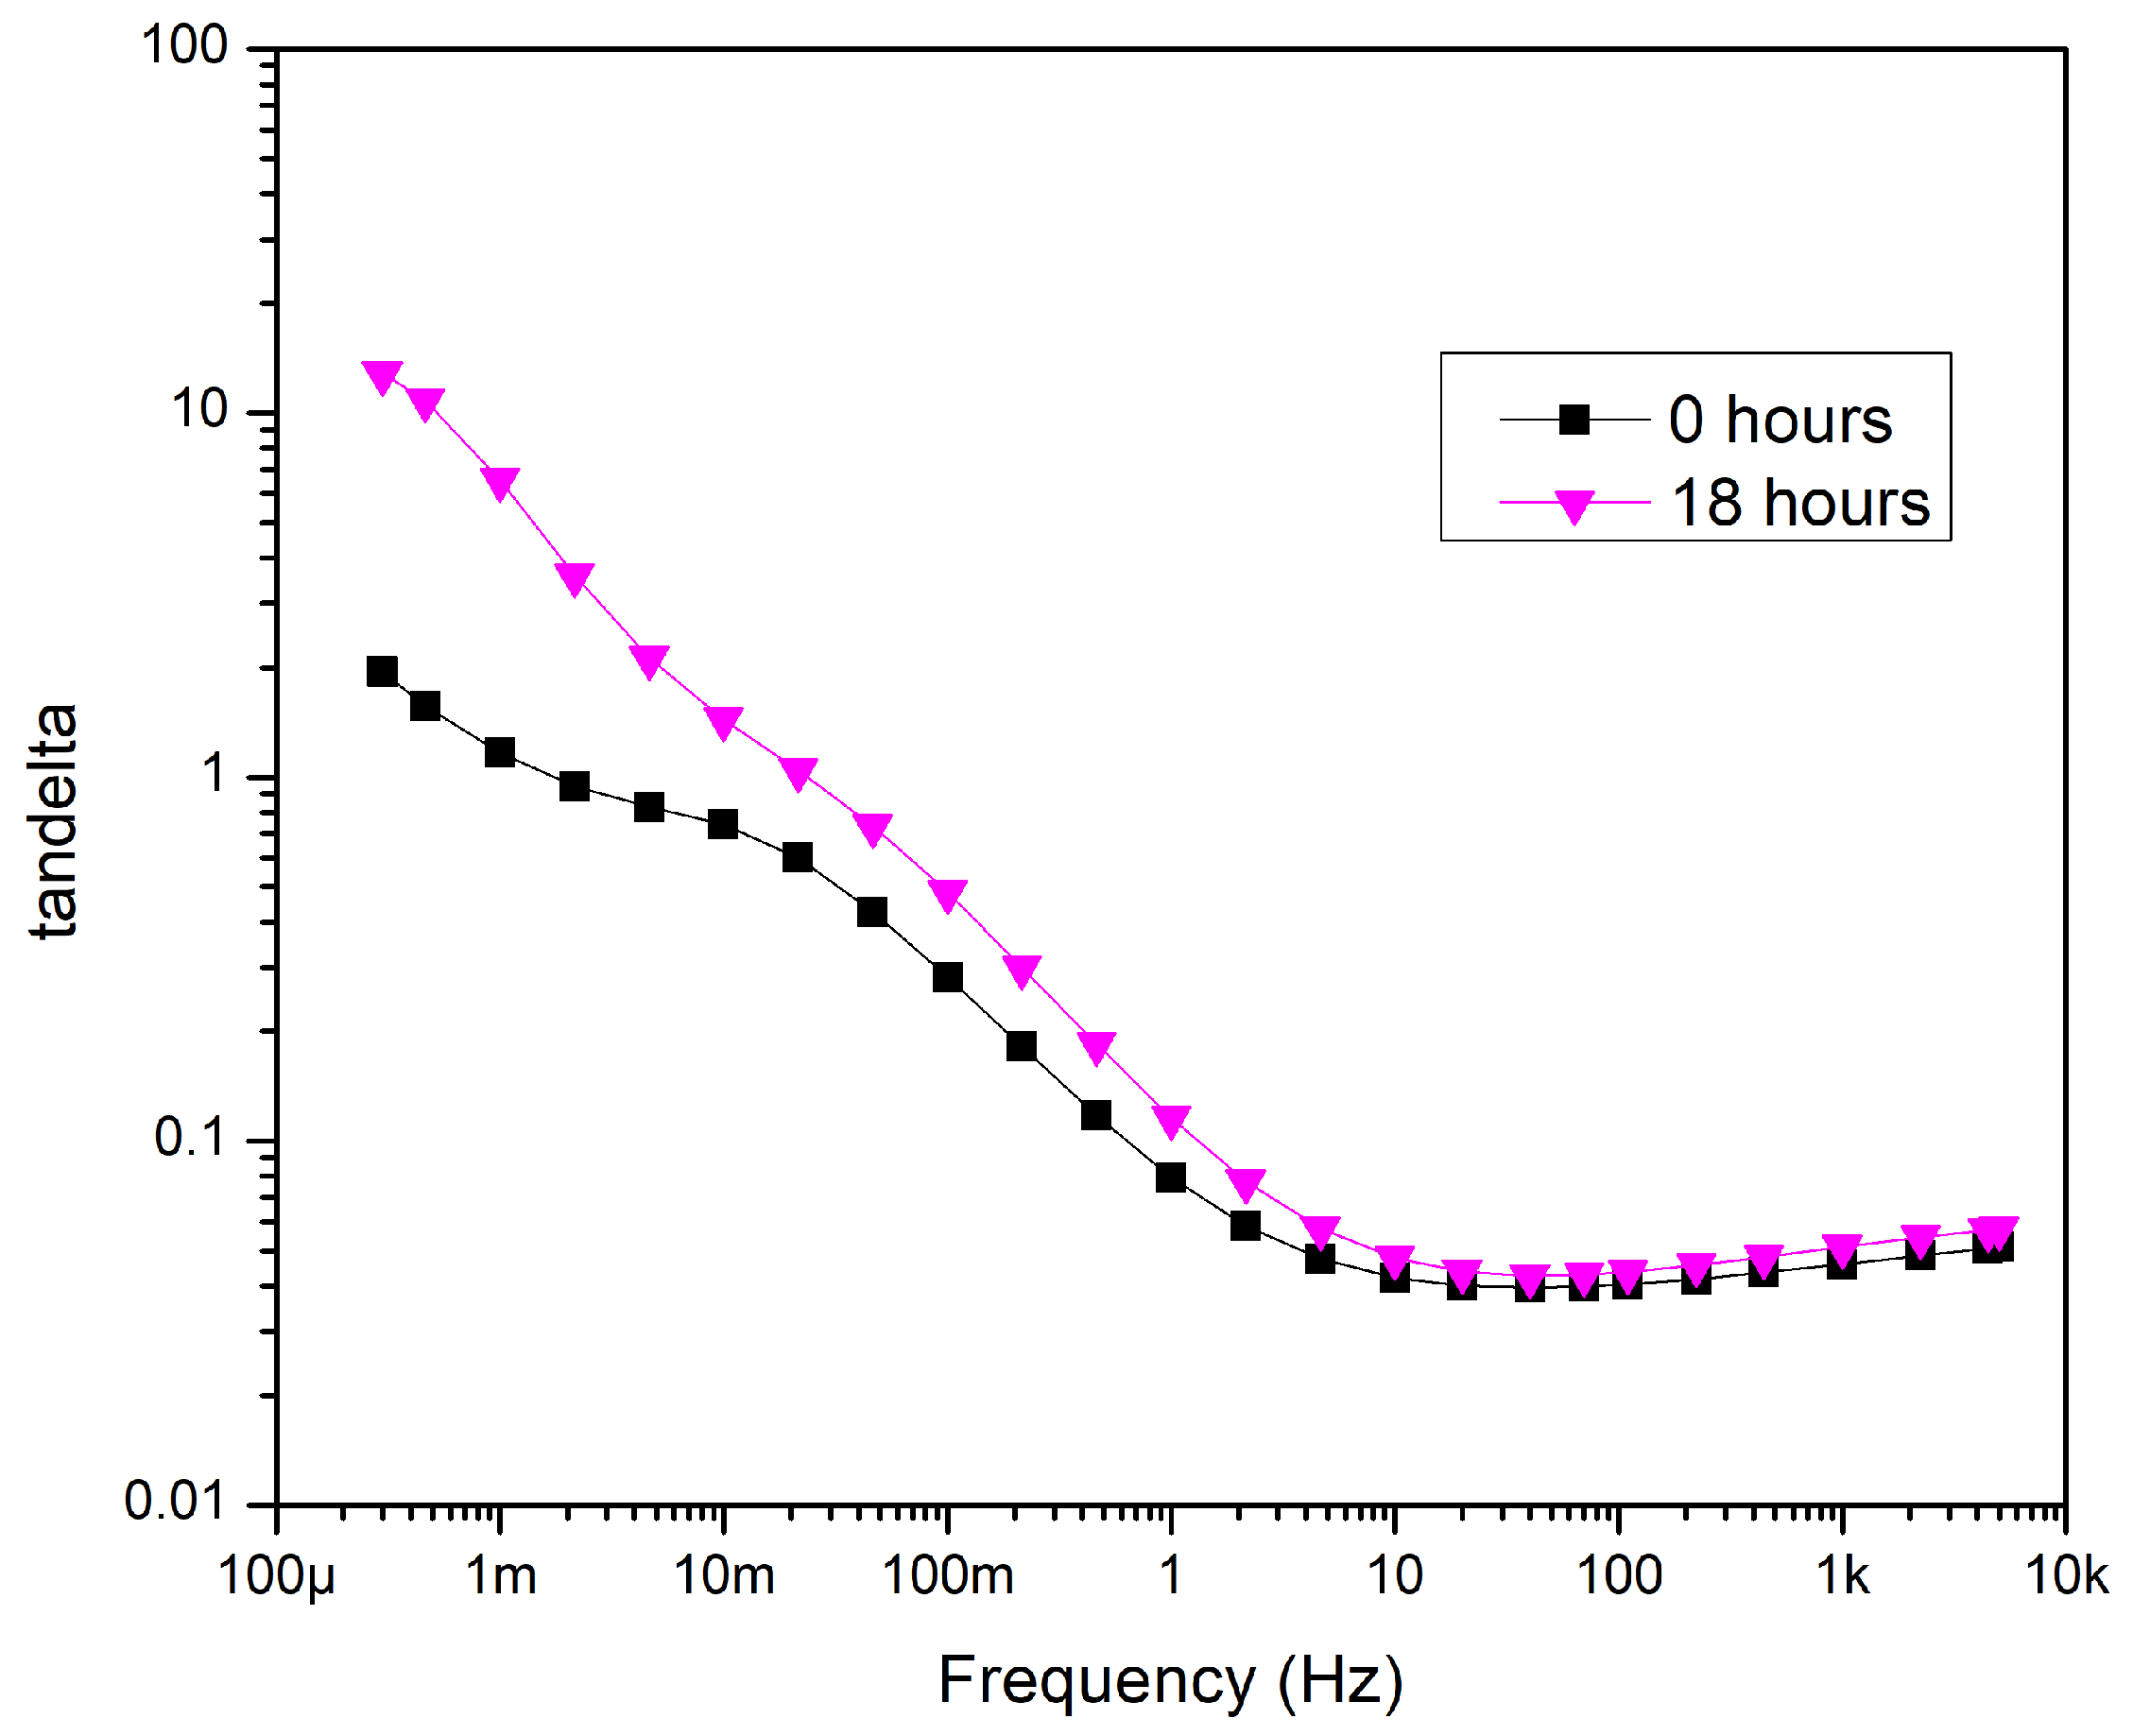
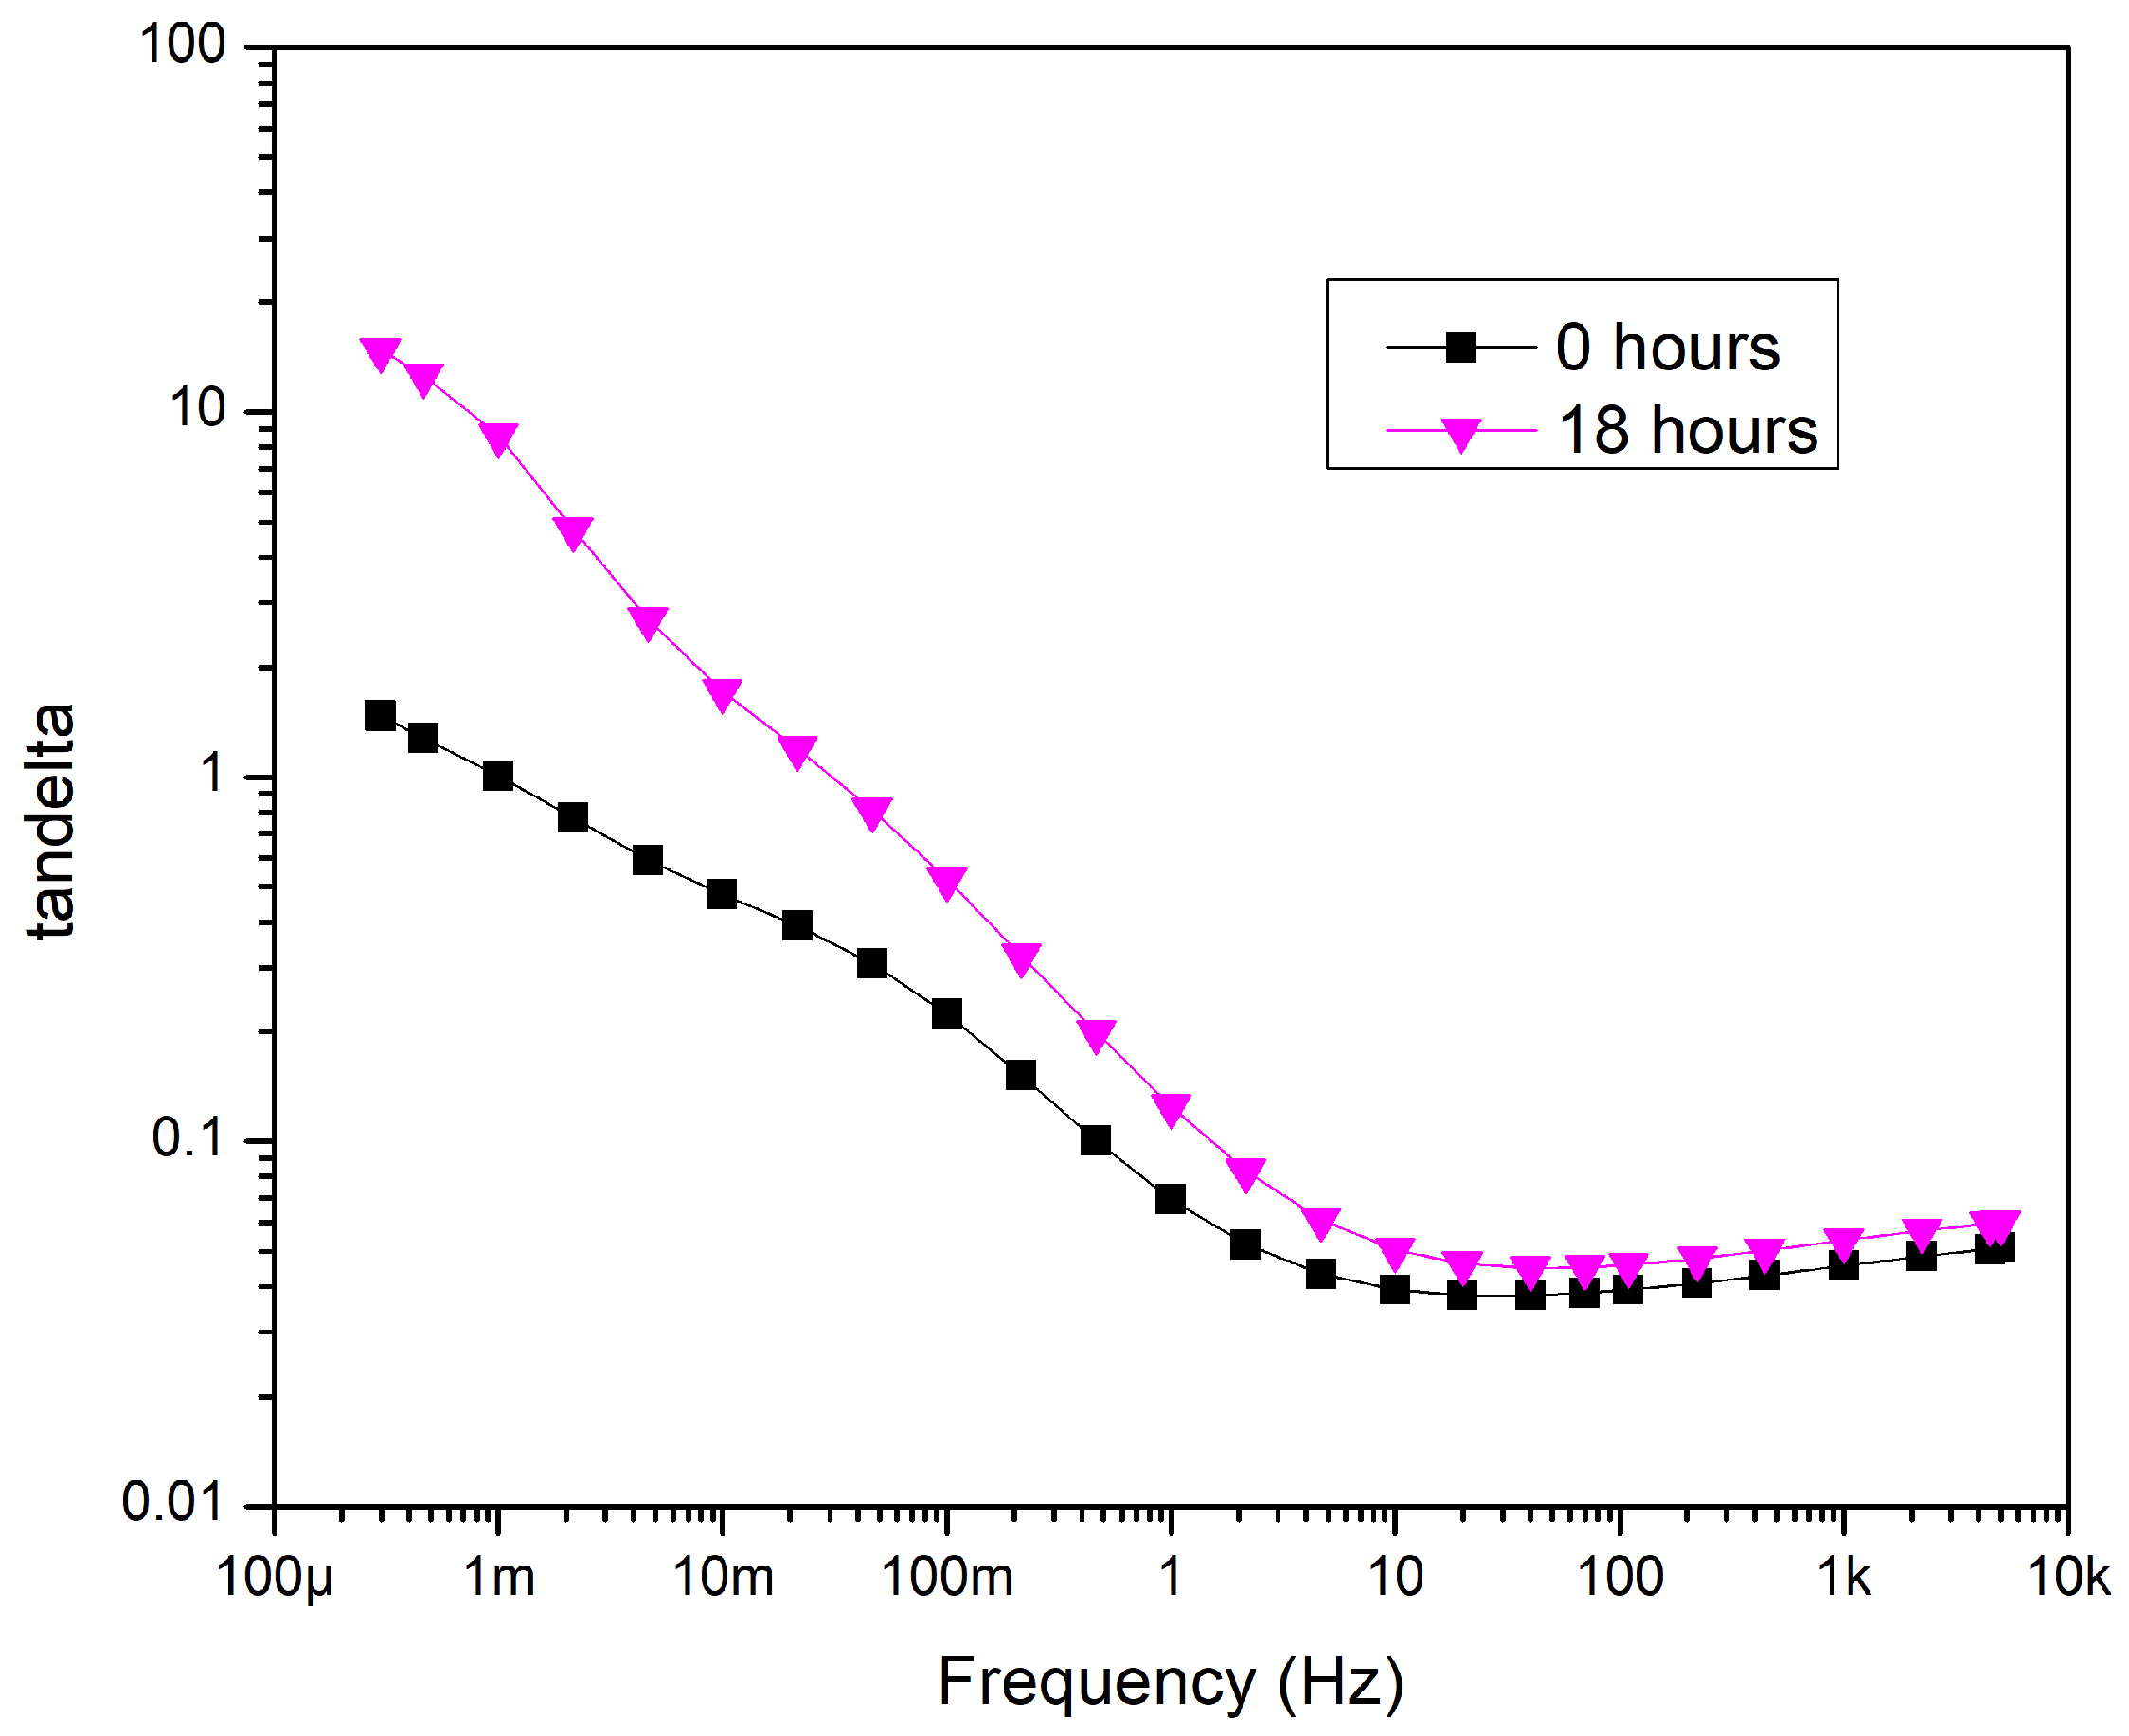
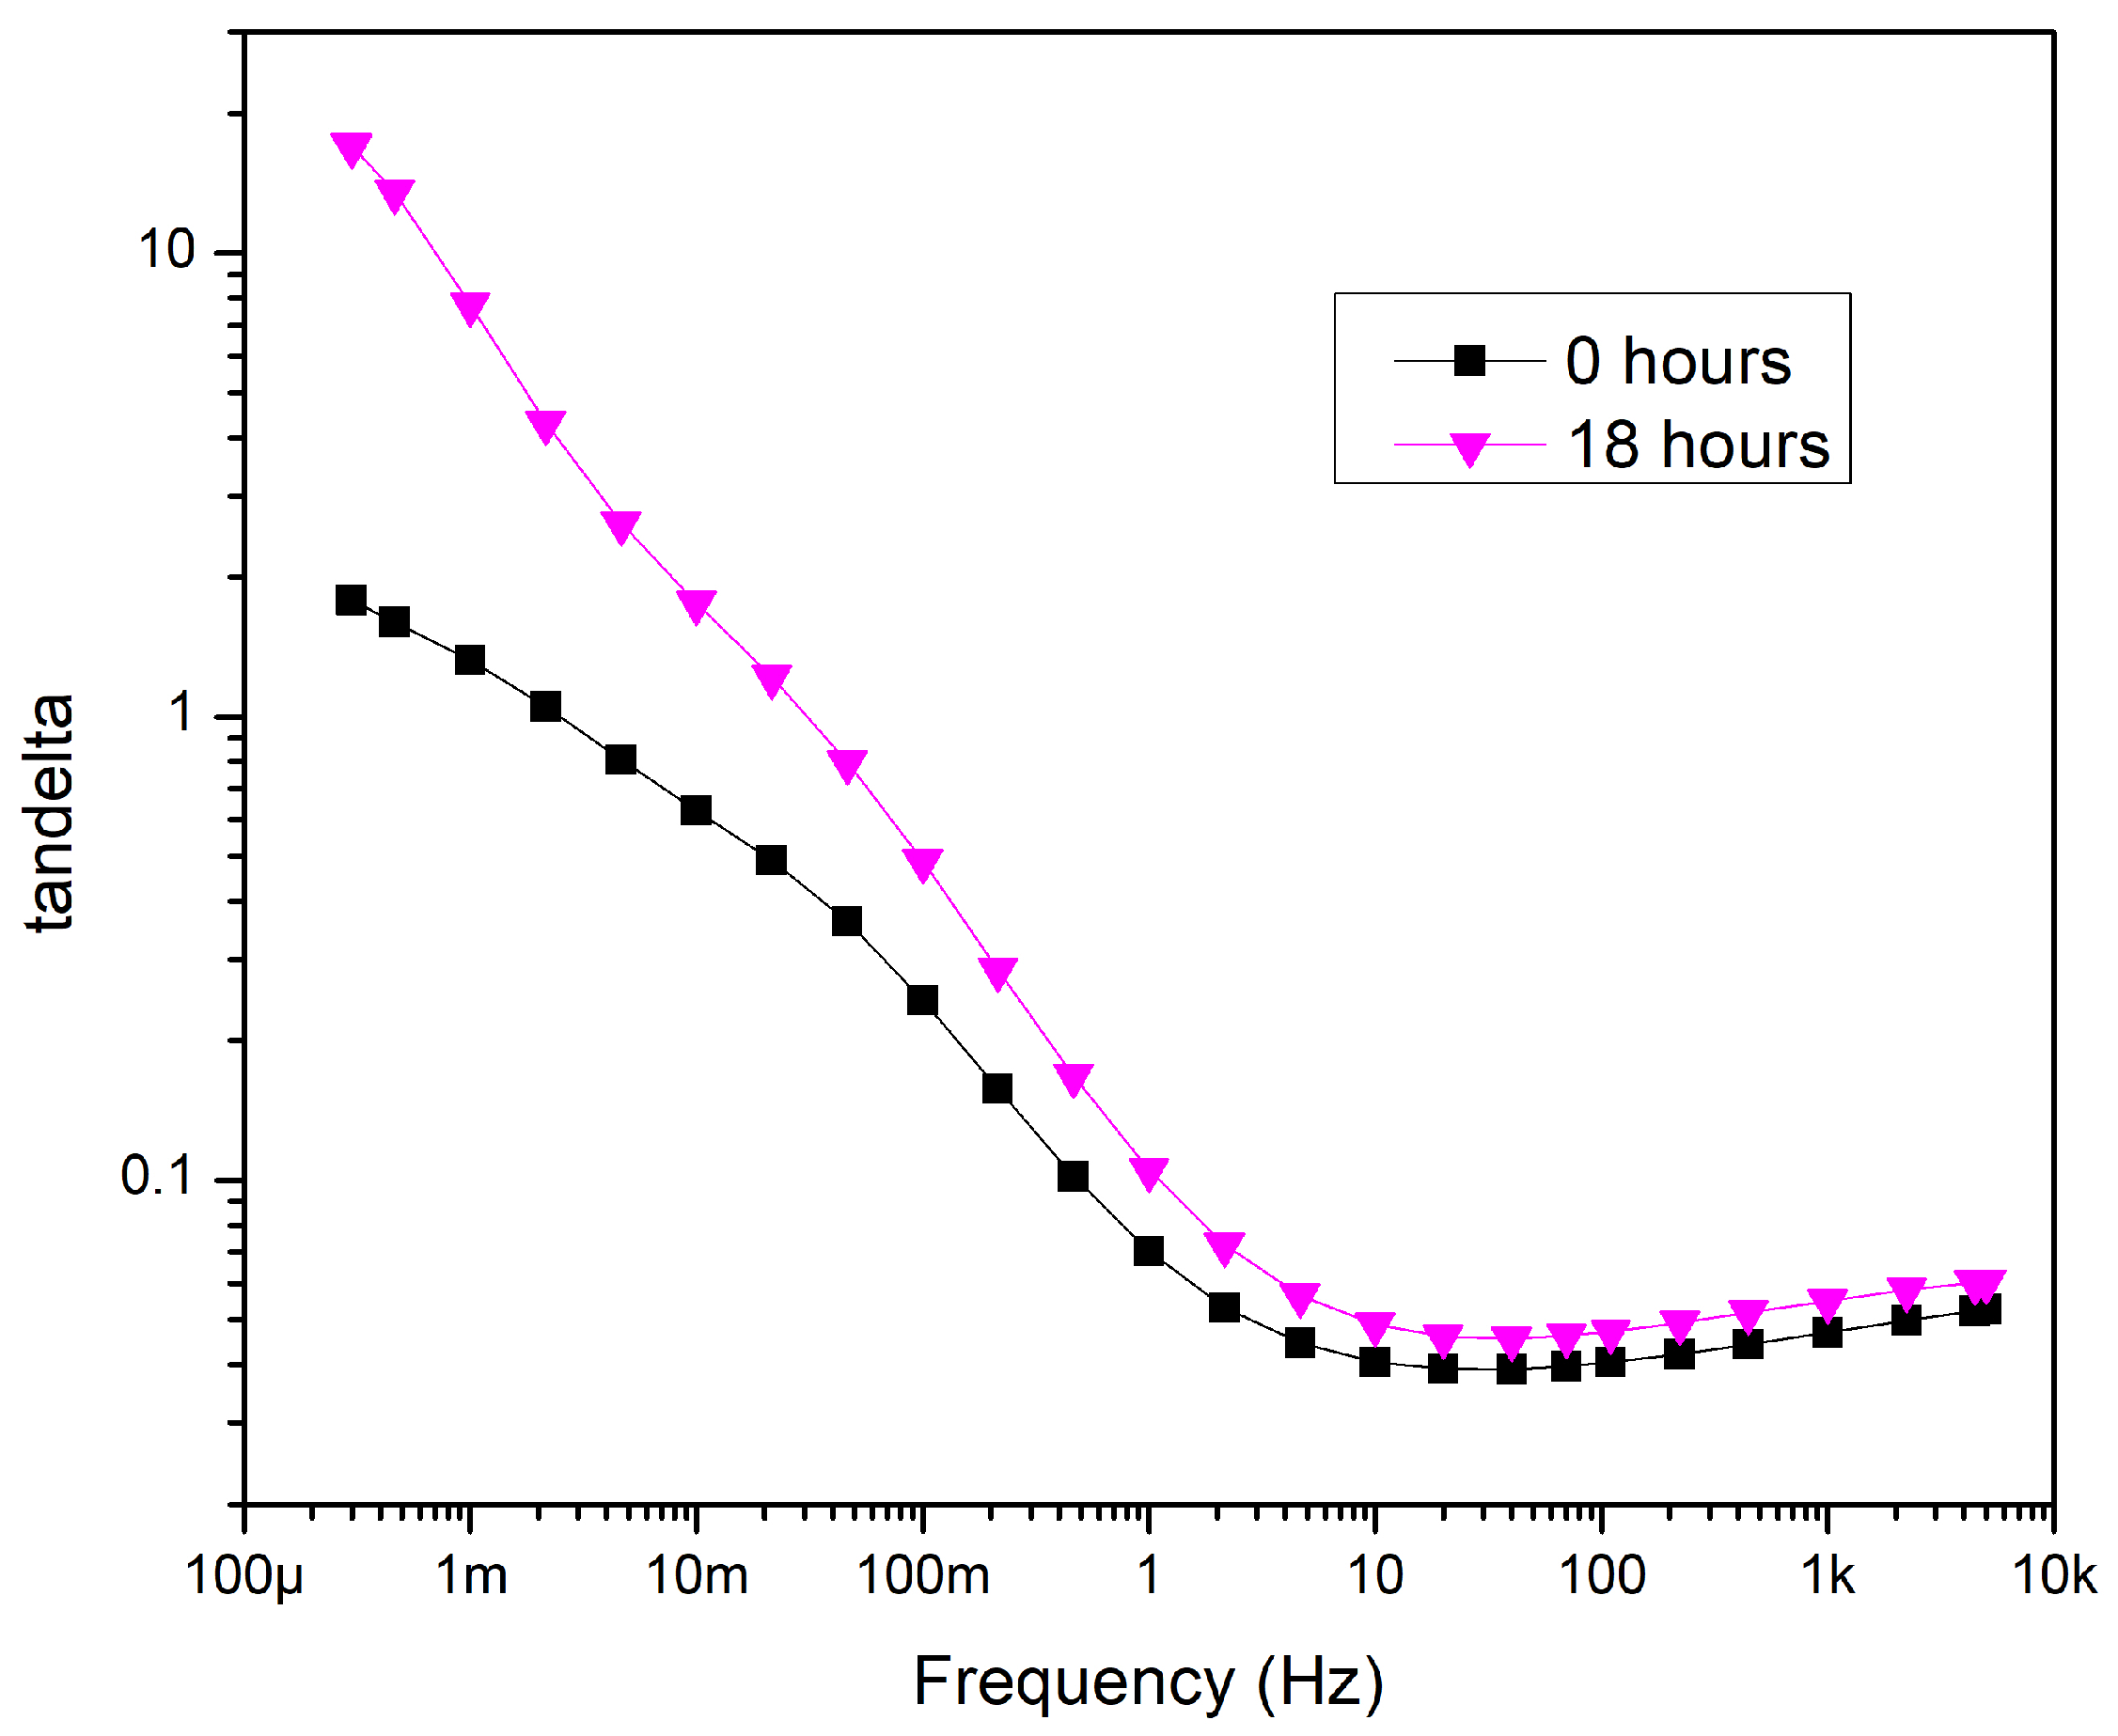
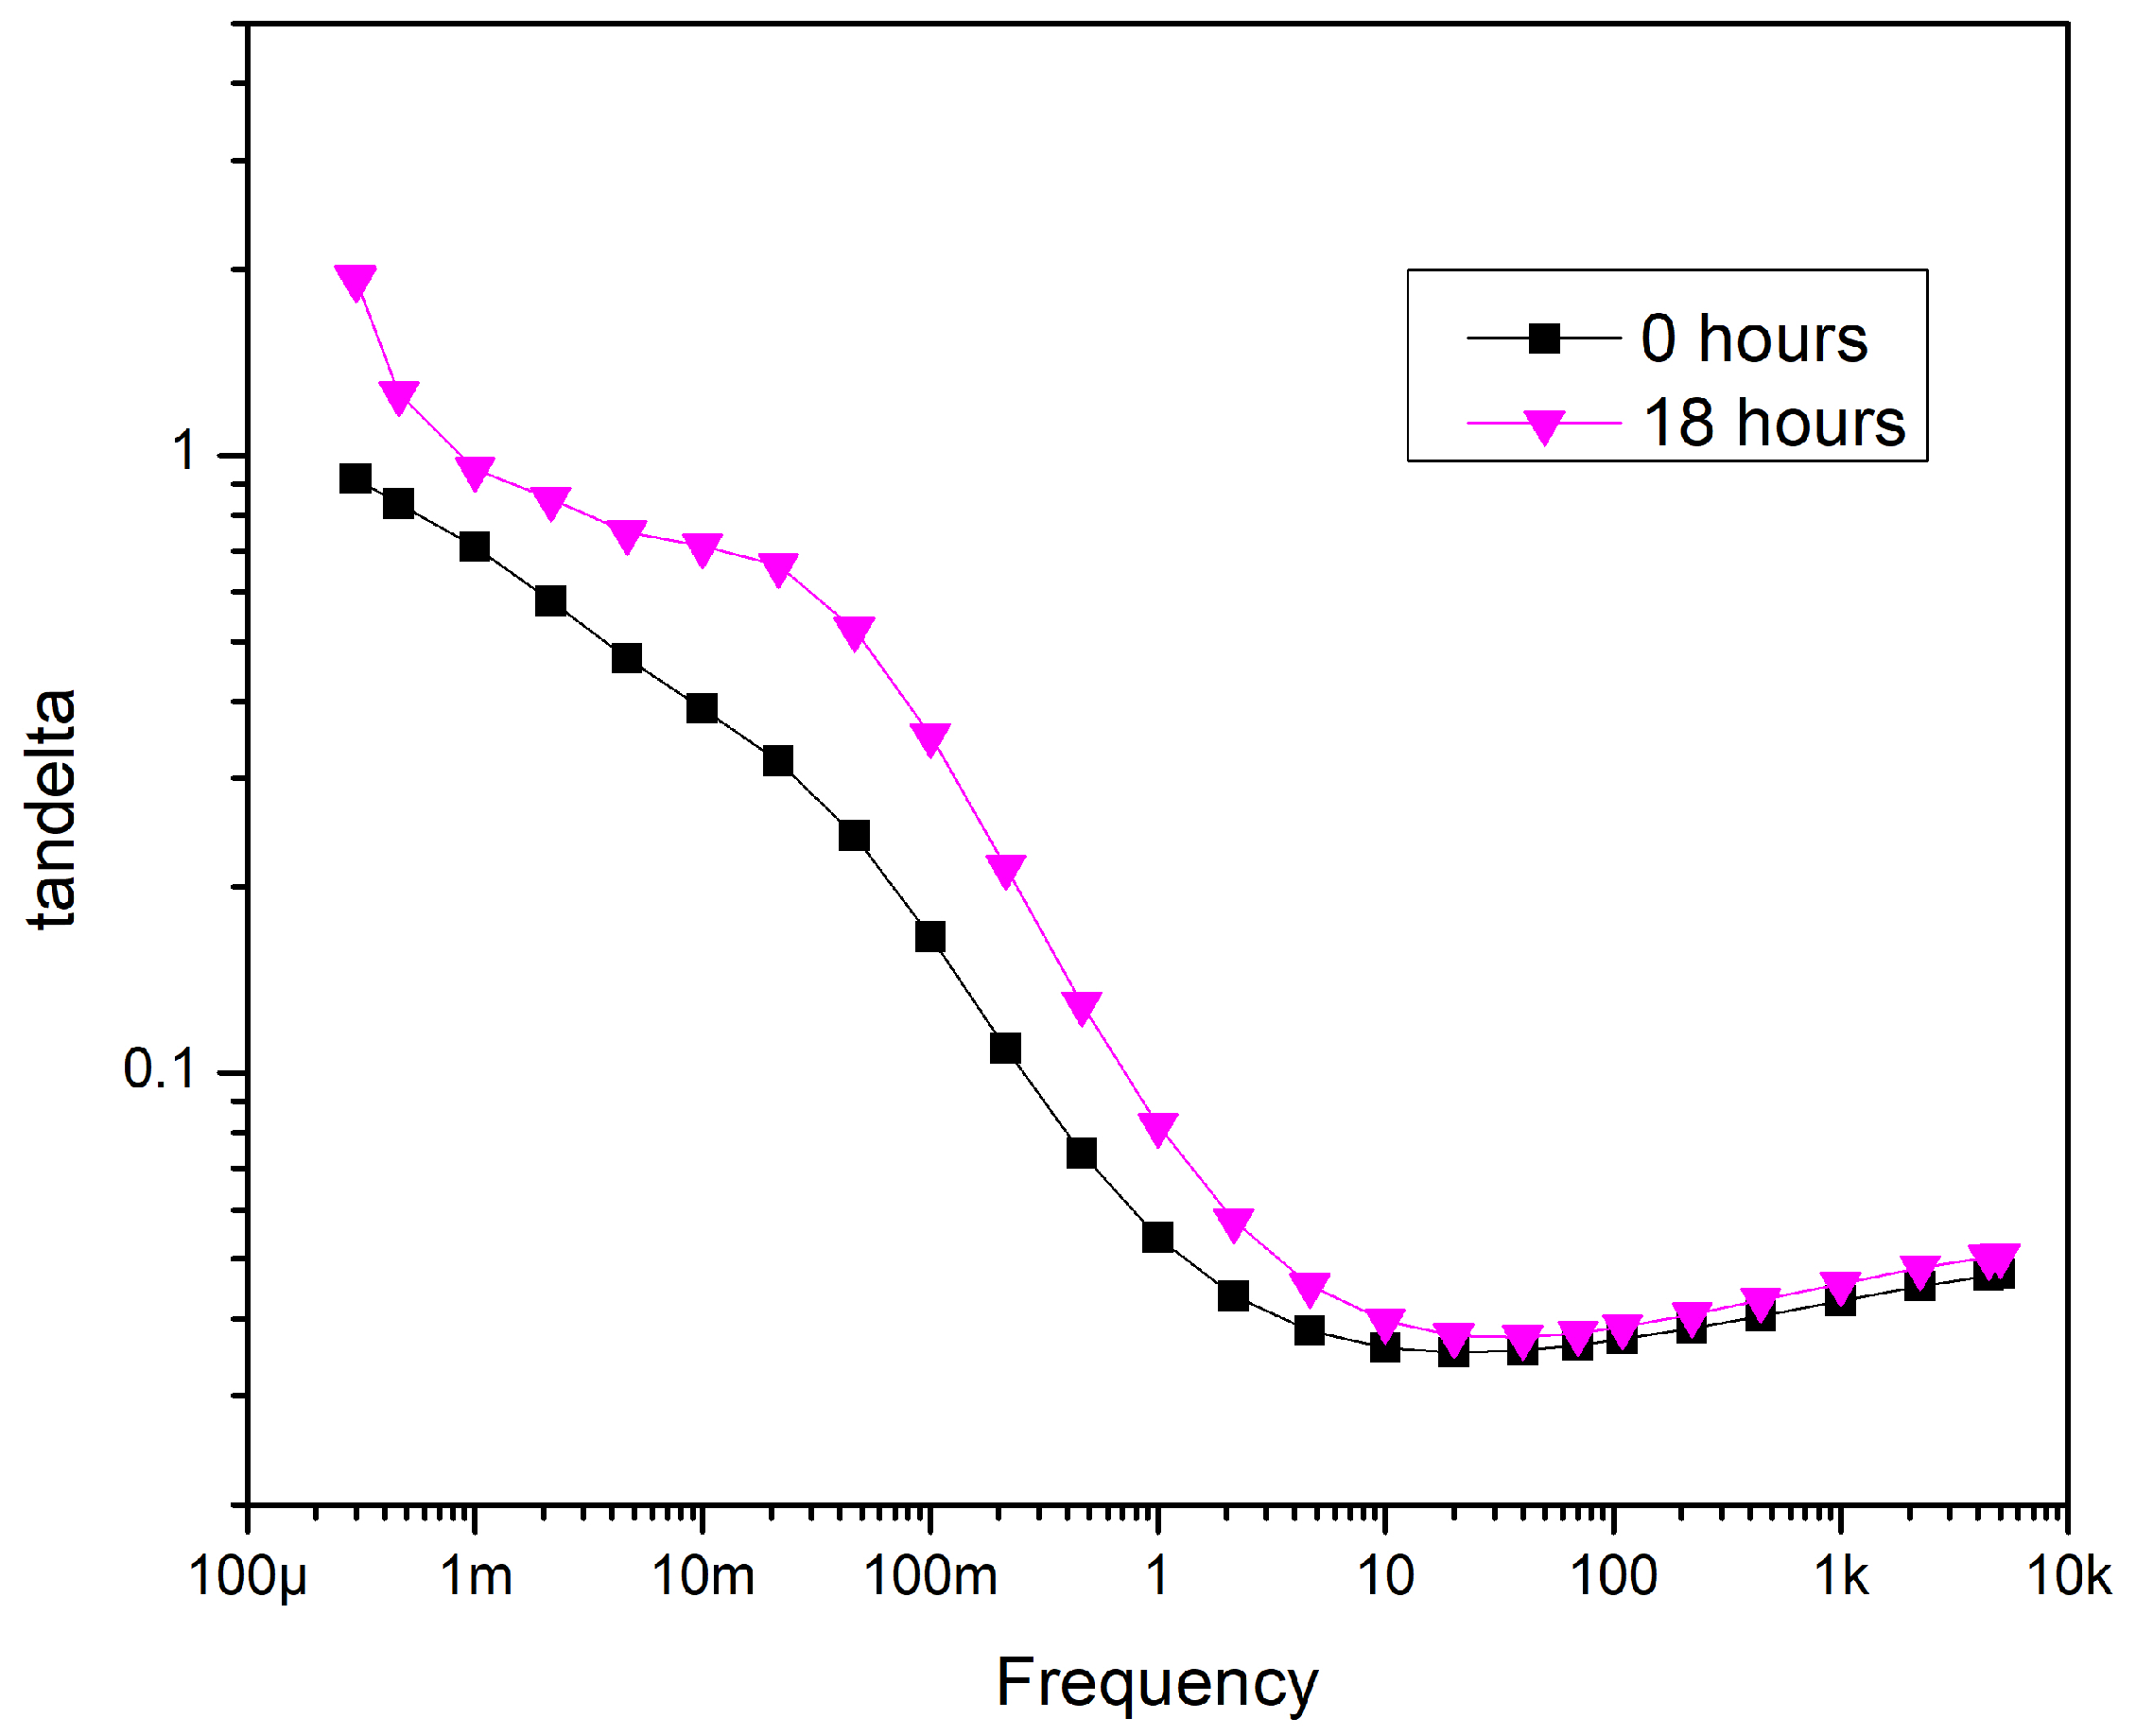
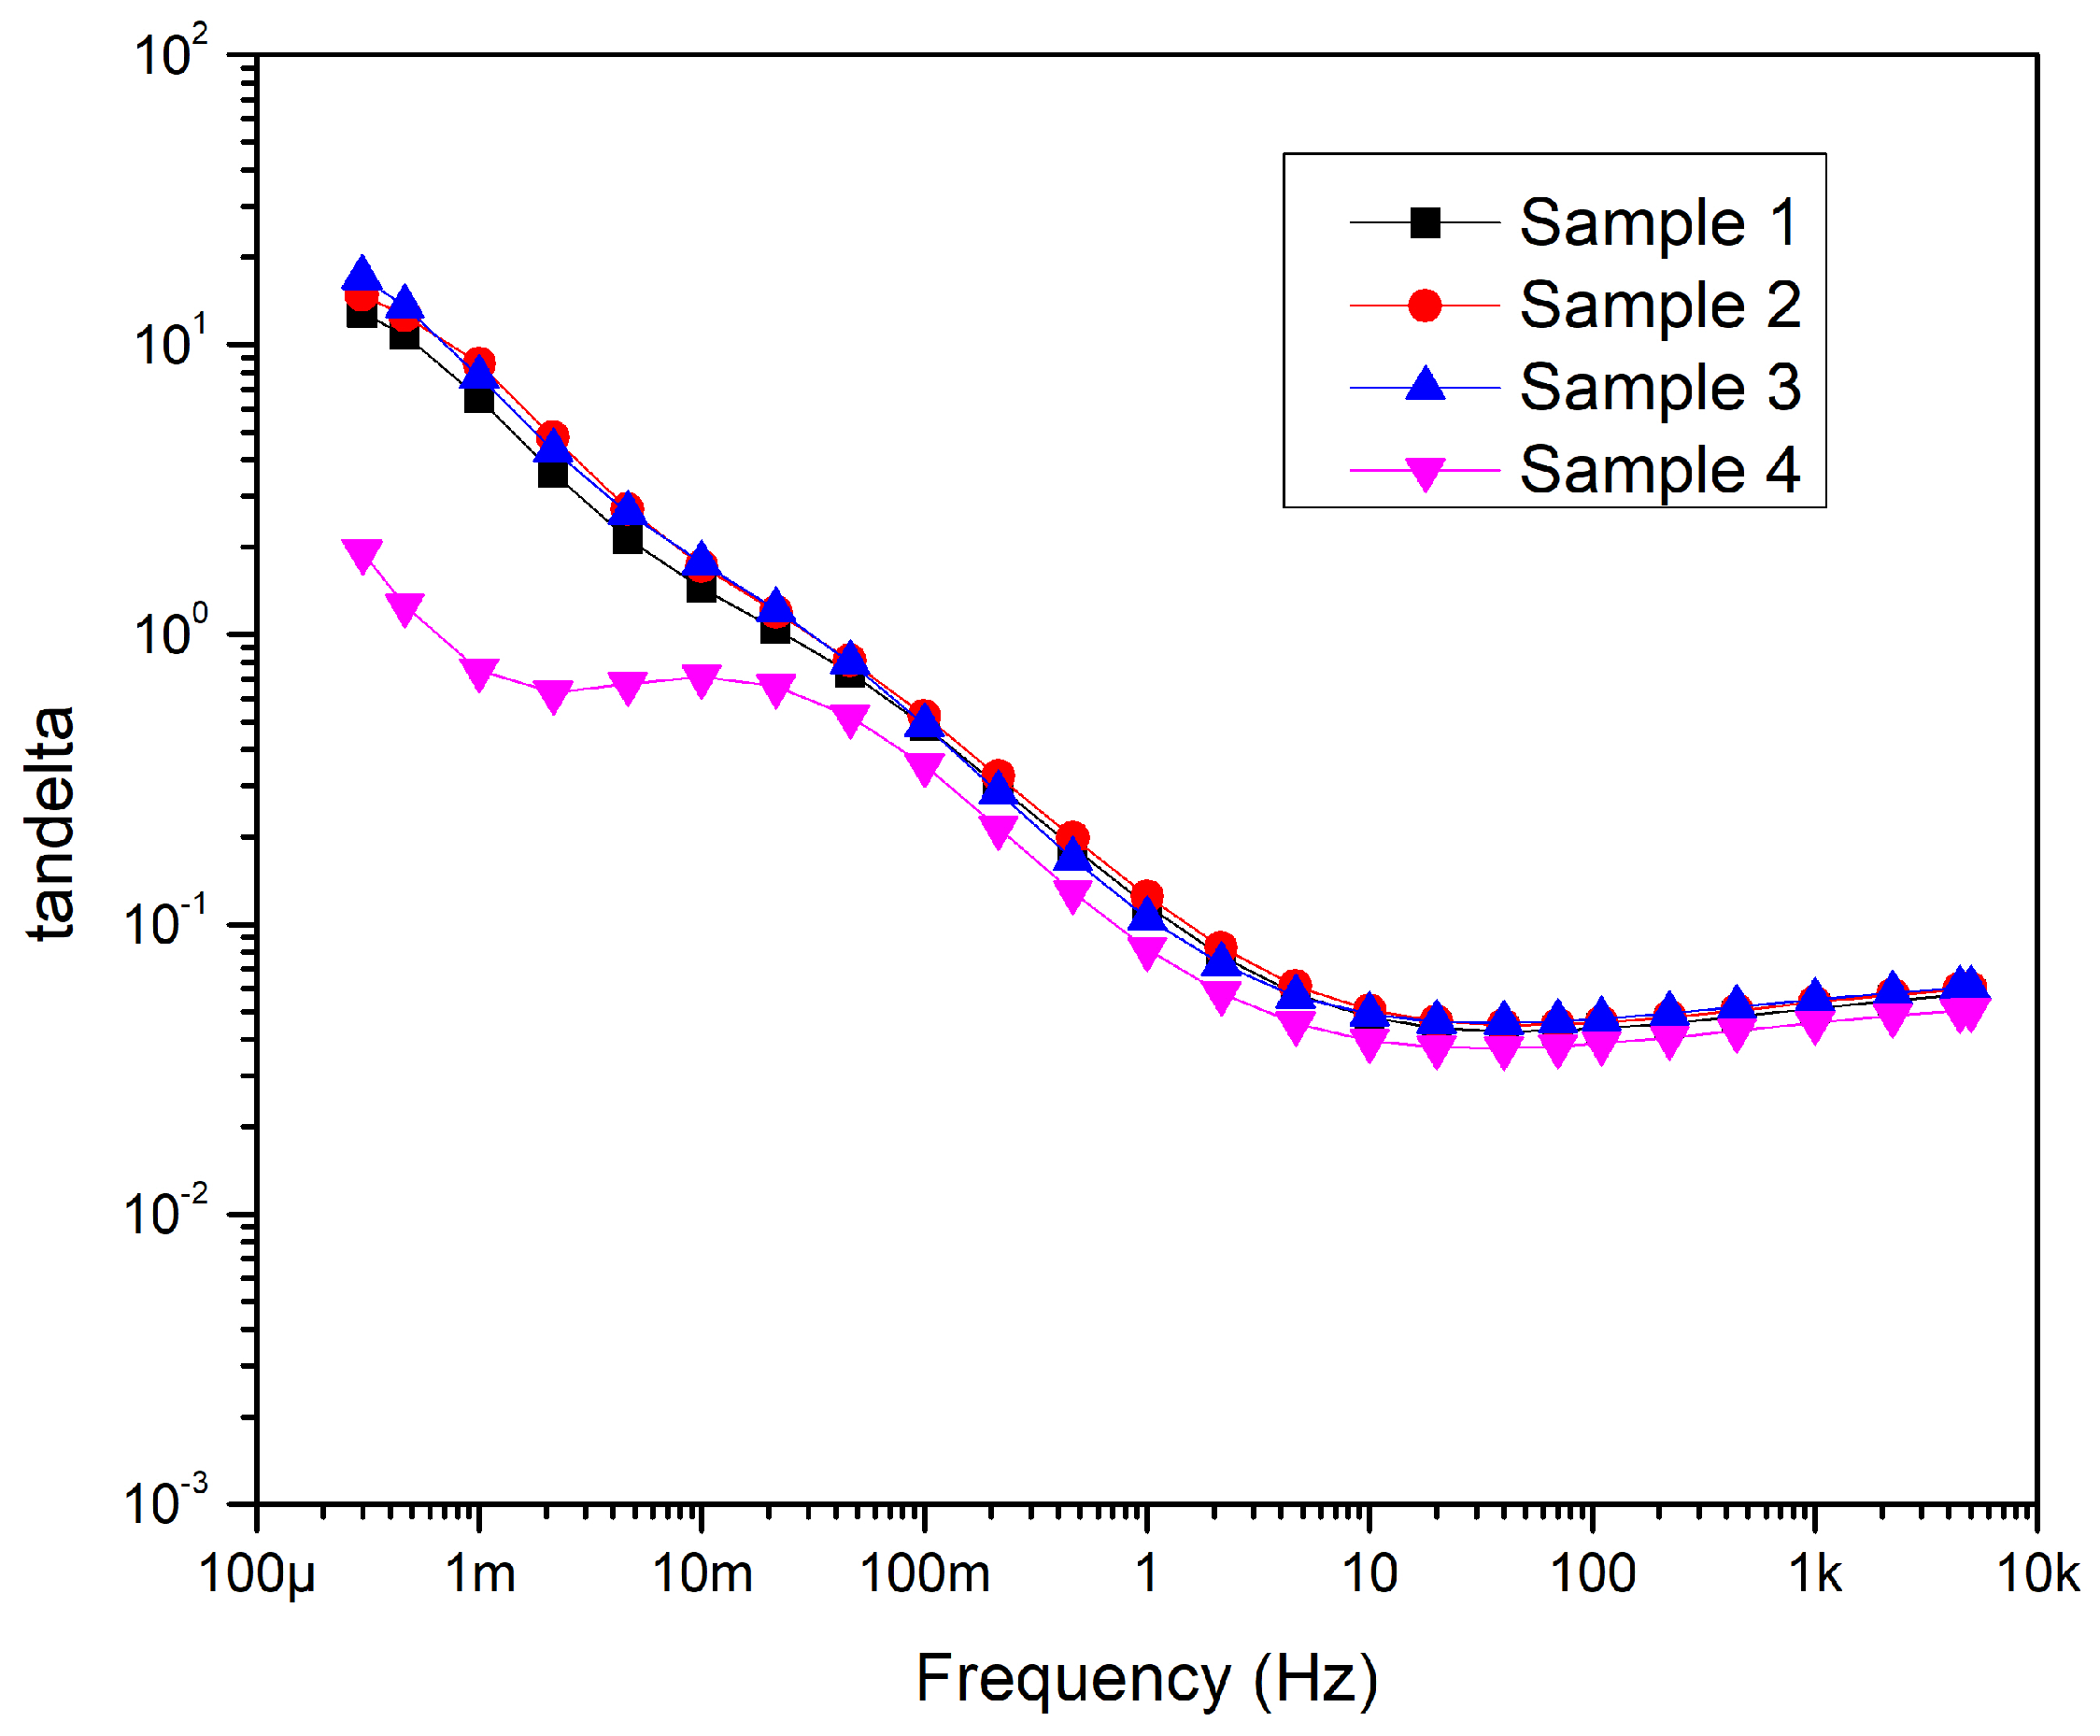
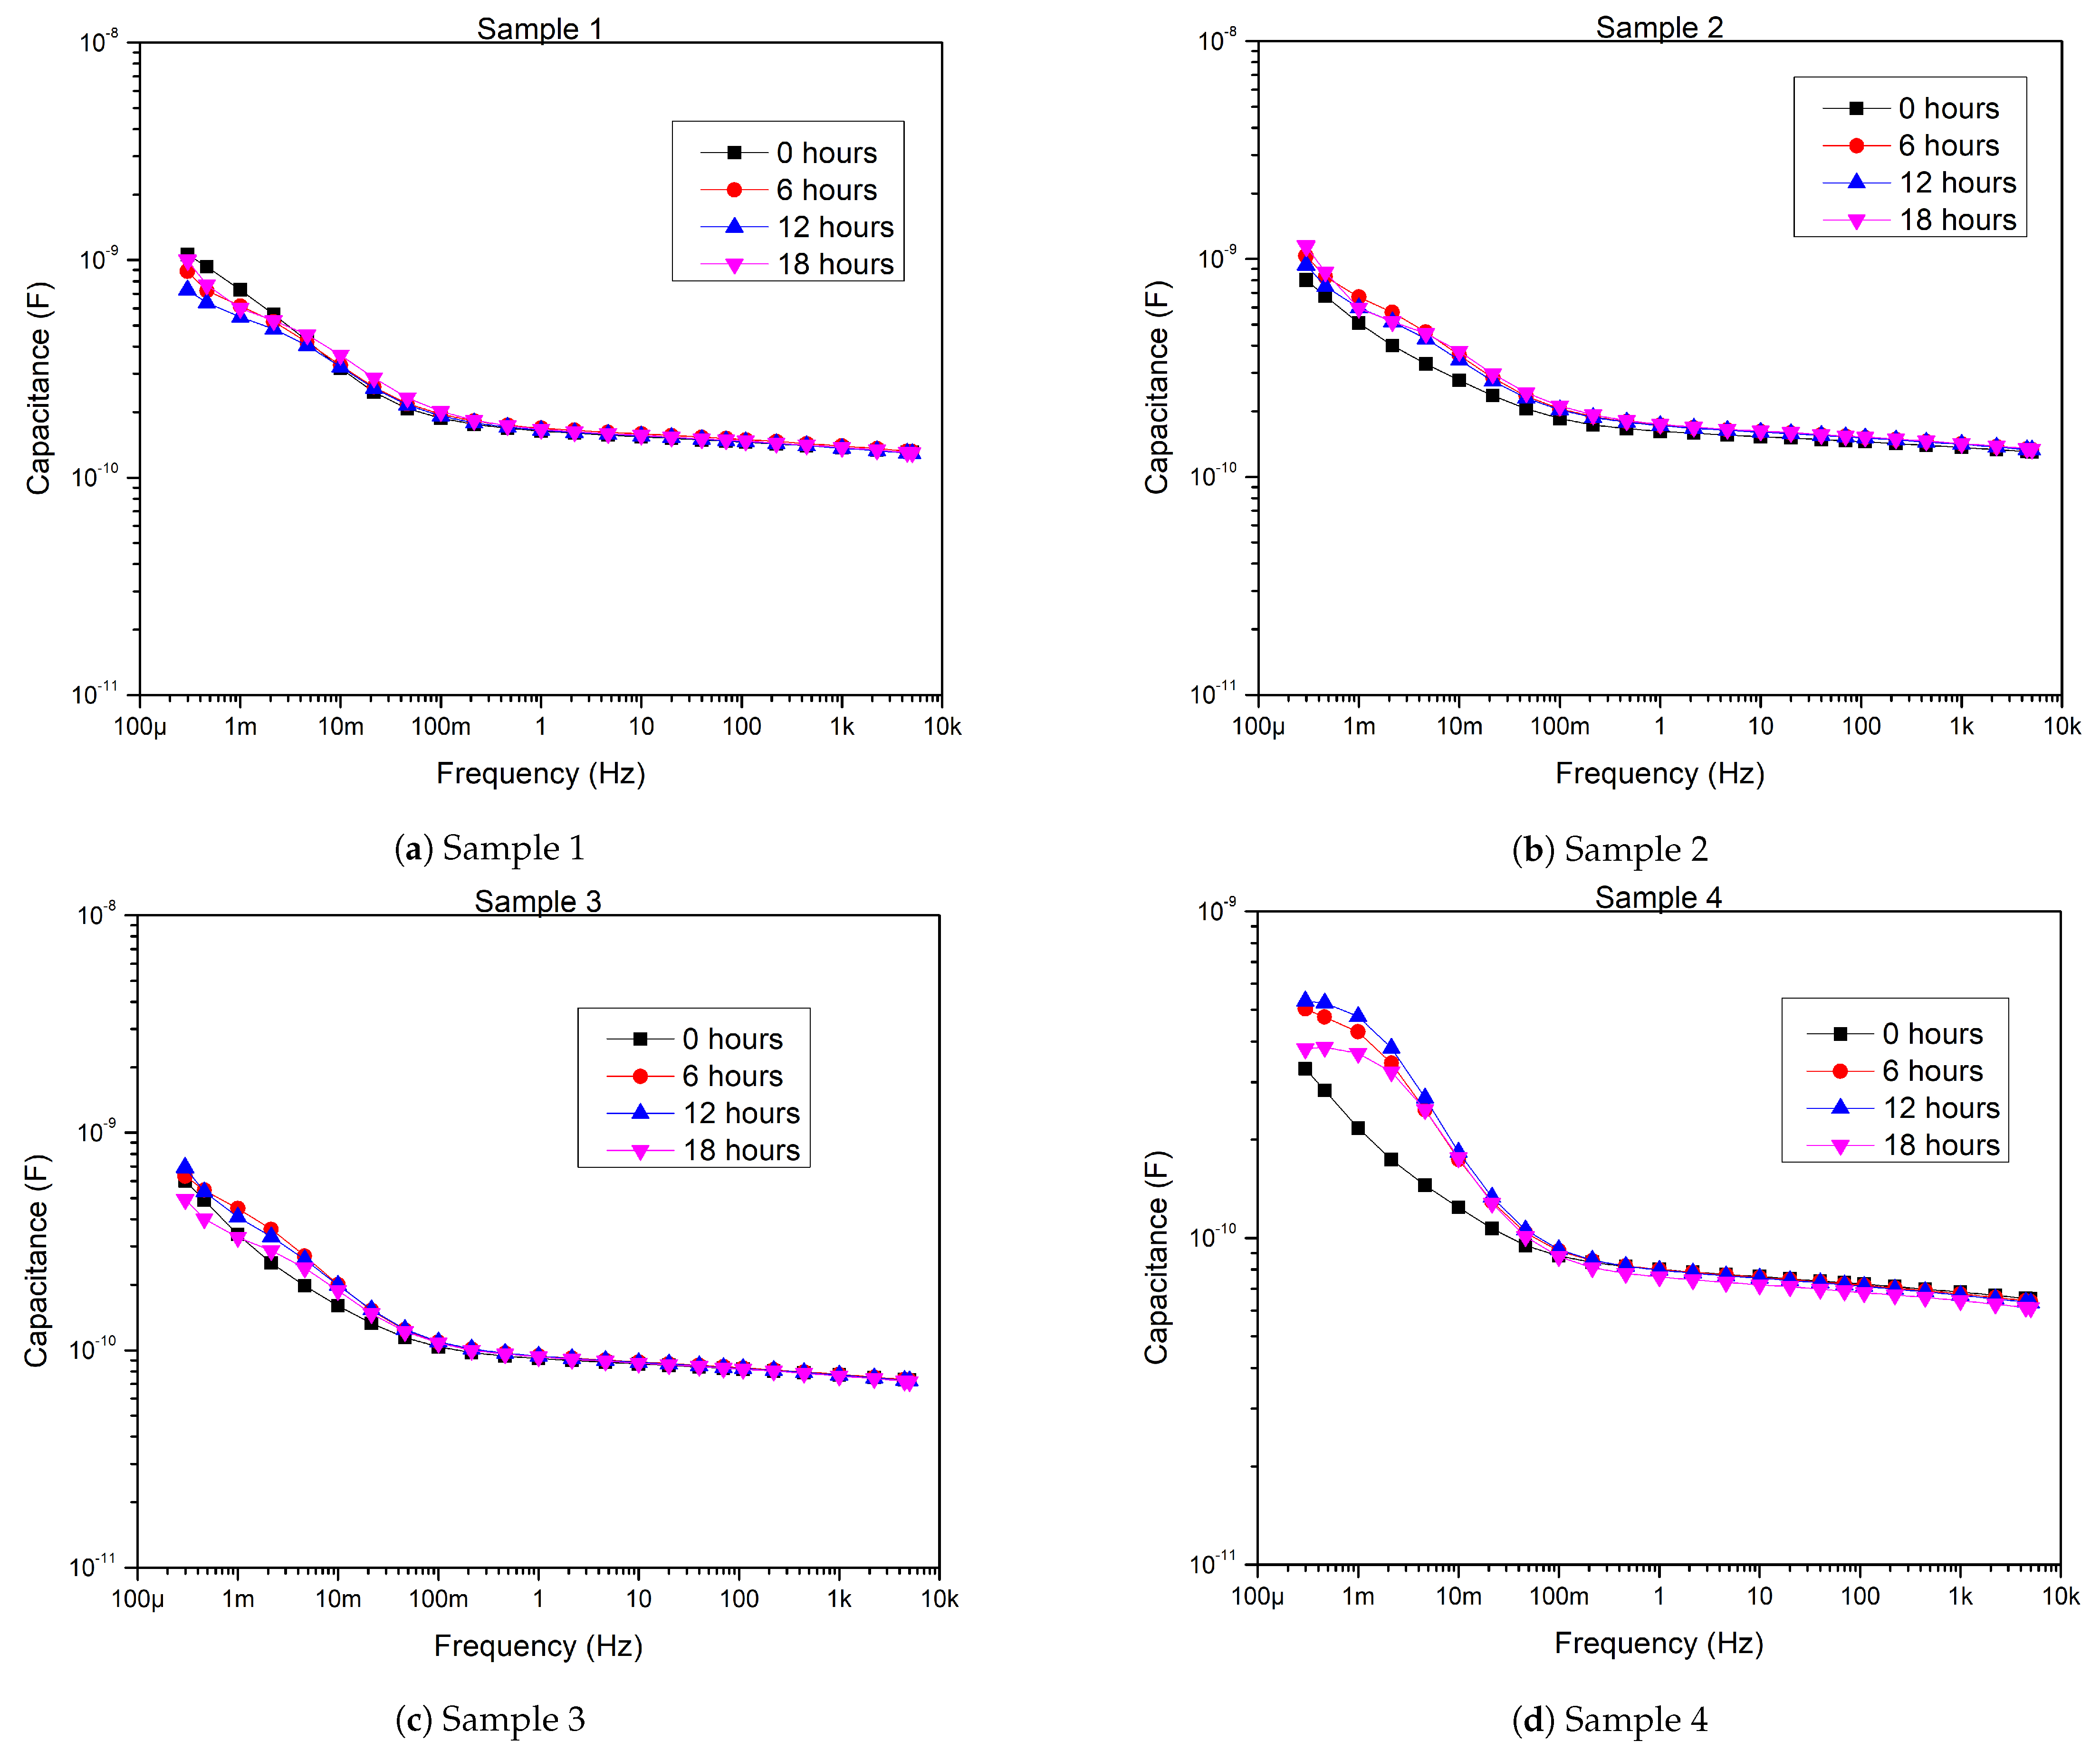
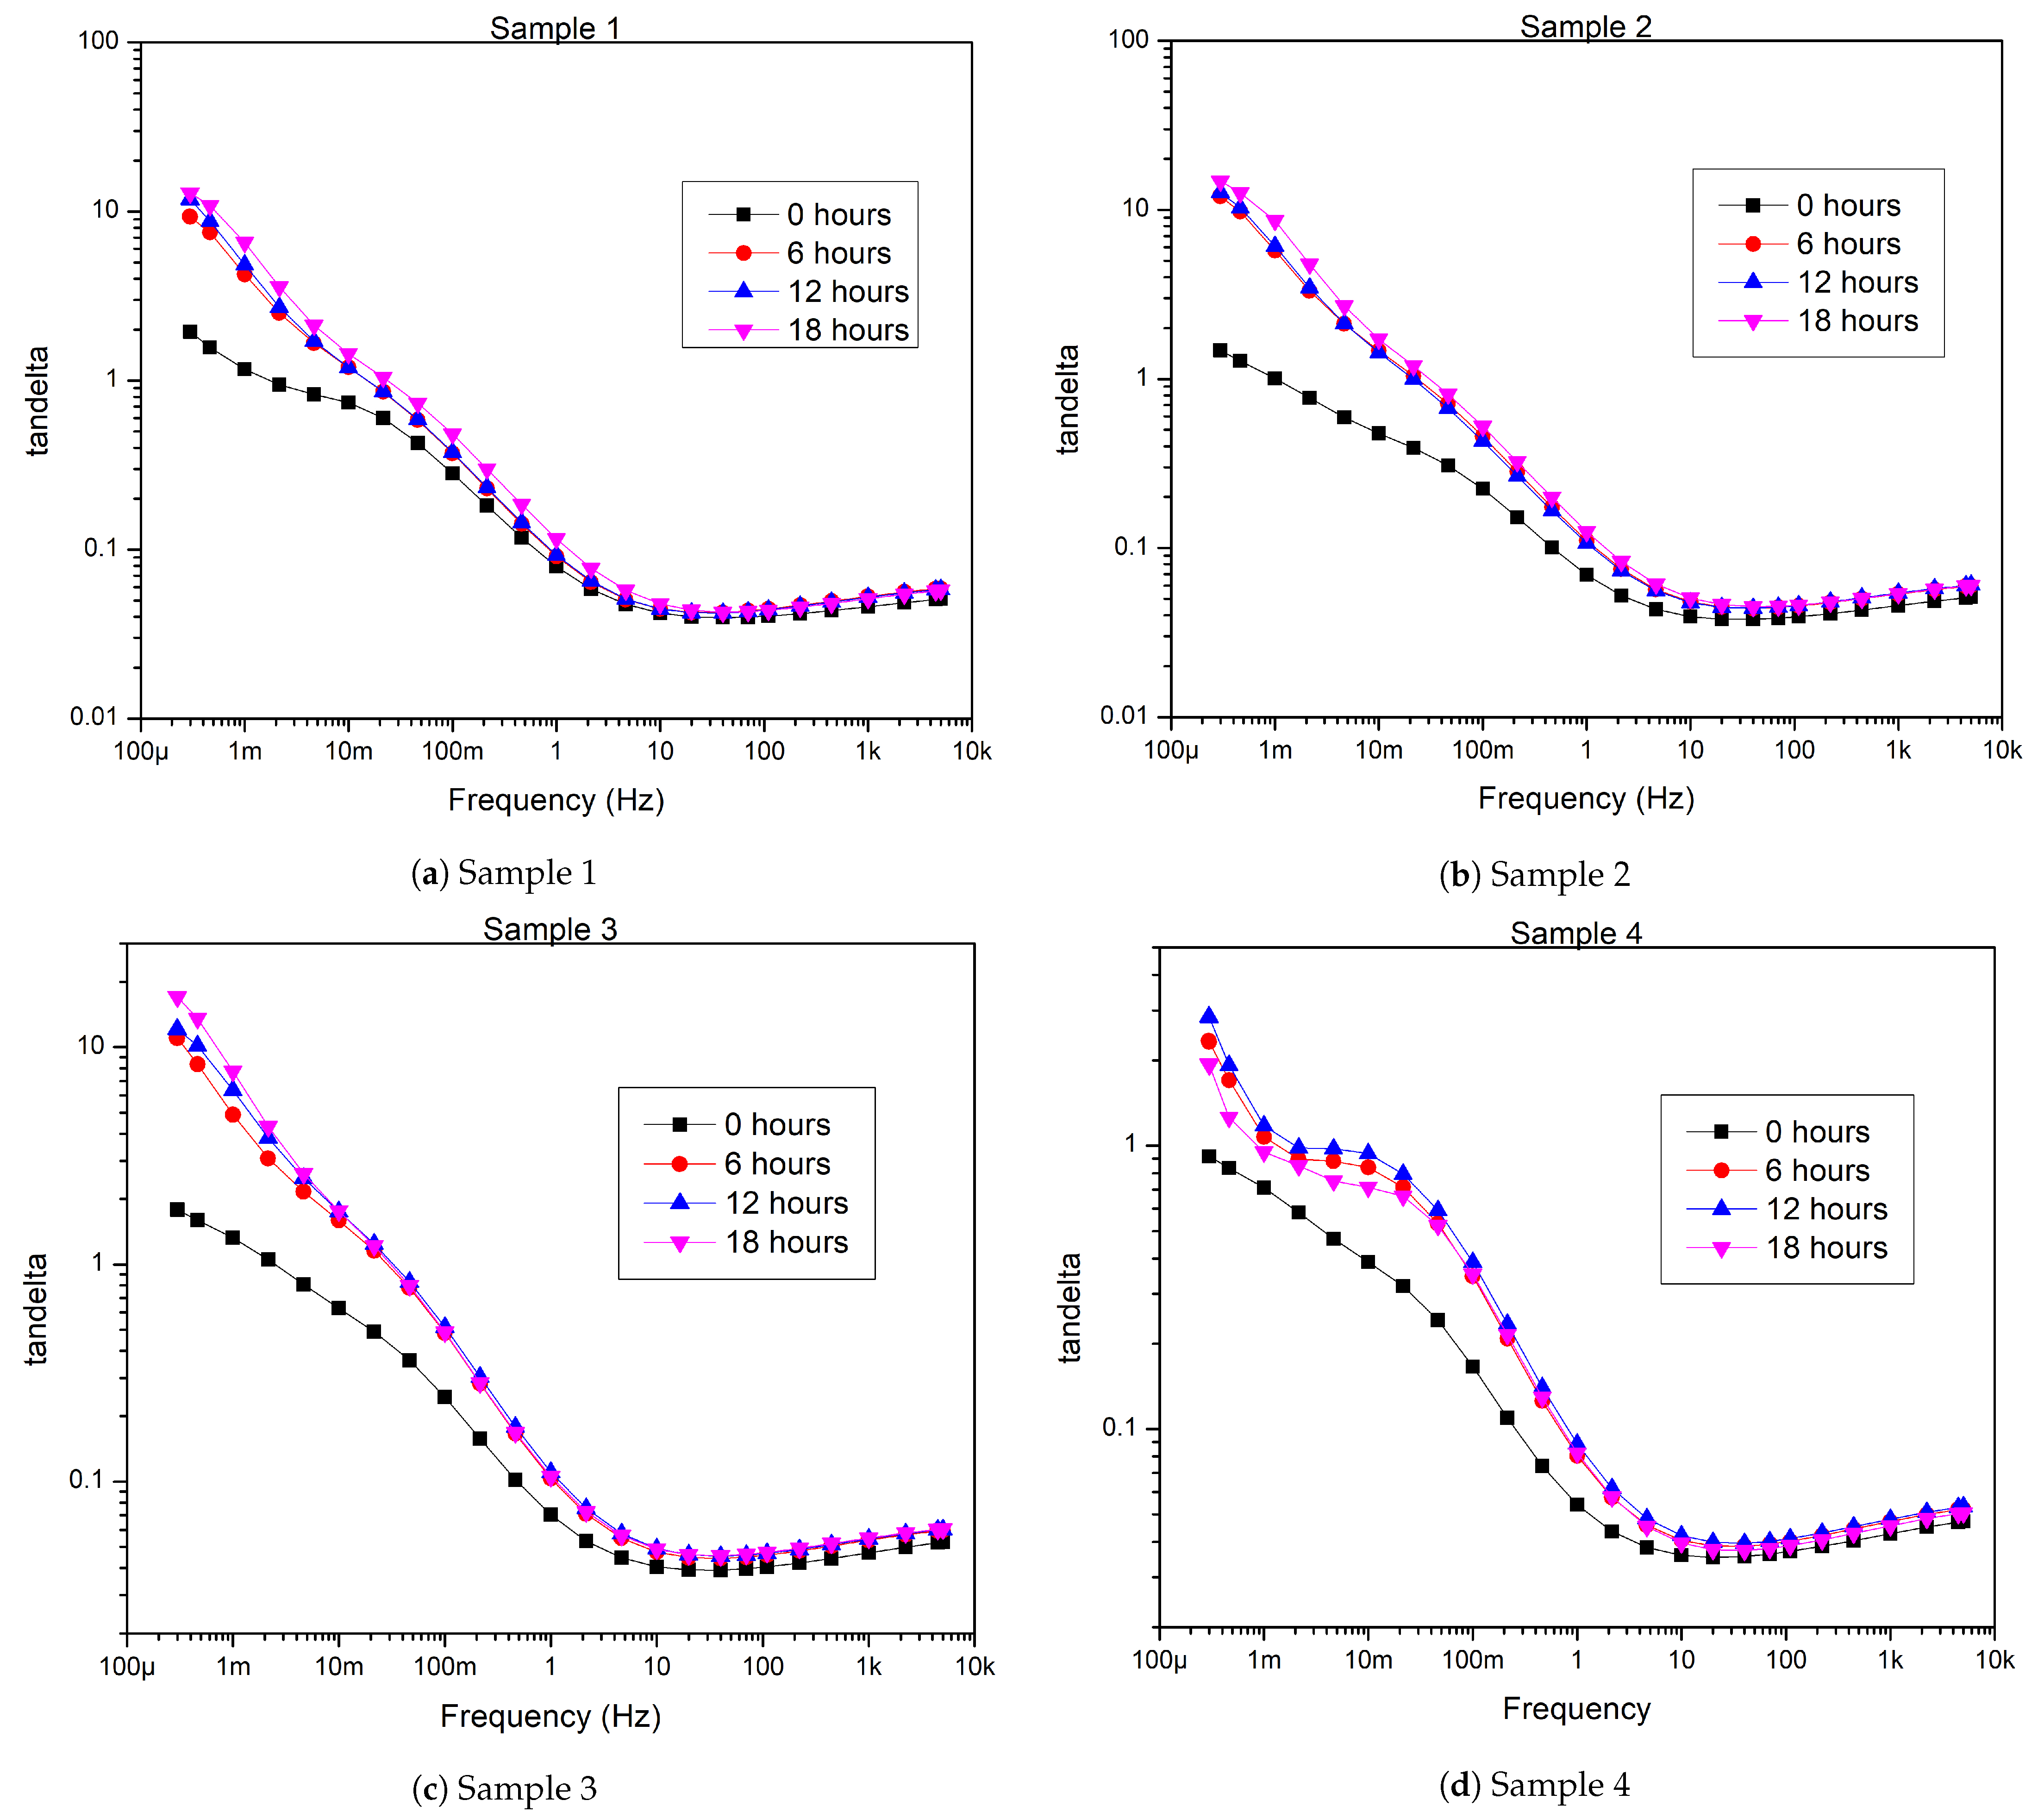
4.1. Effect on Tan and Capacitance
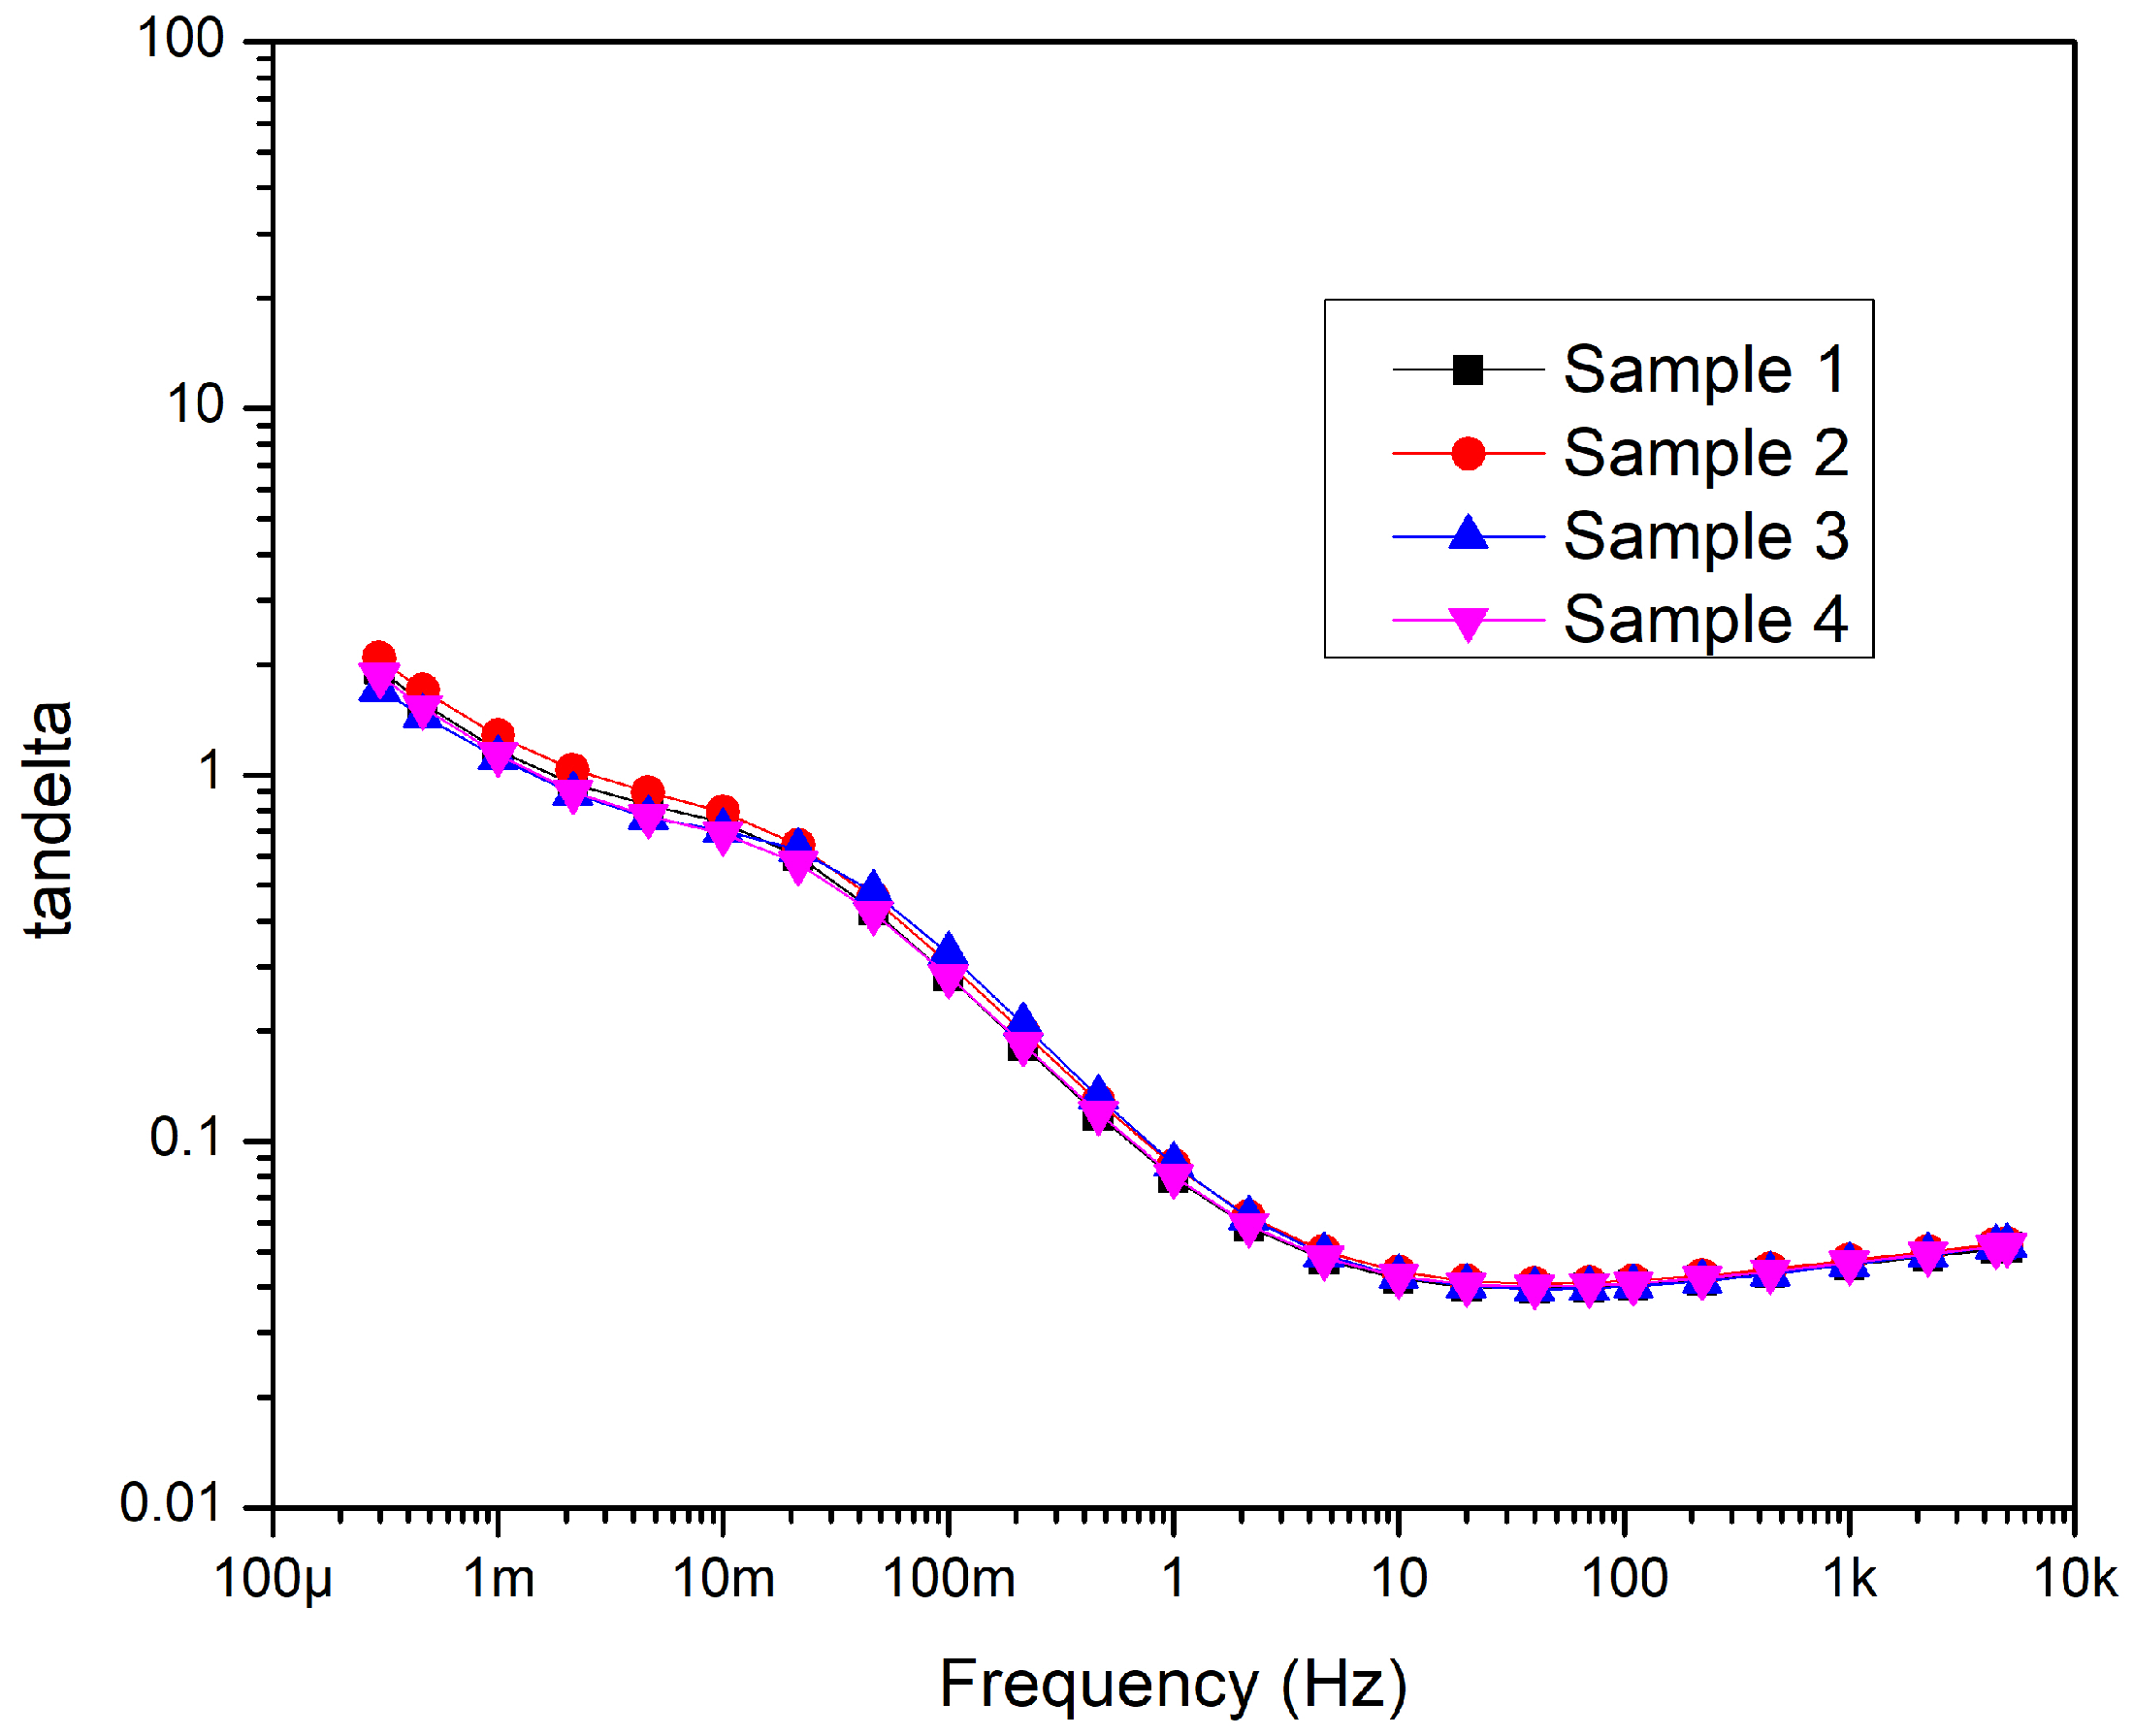
4.1.1. Before Aging
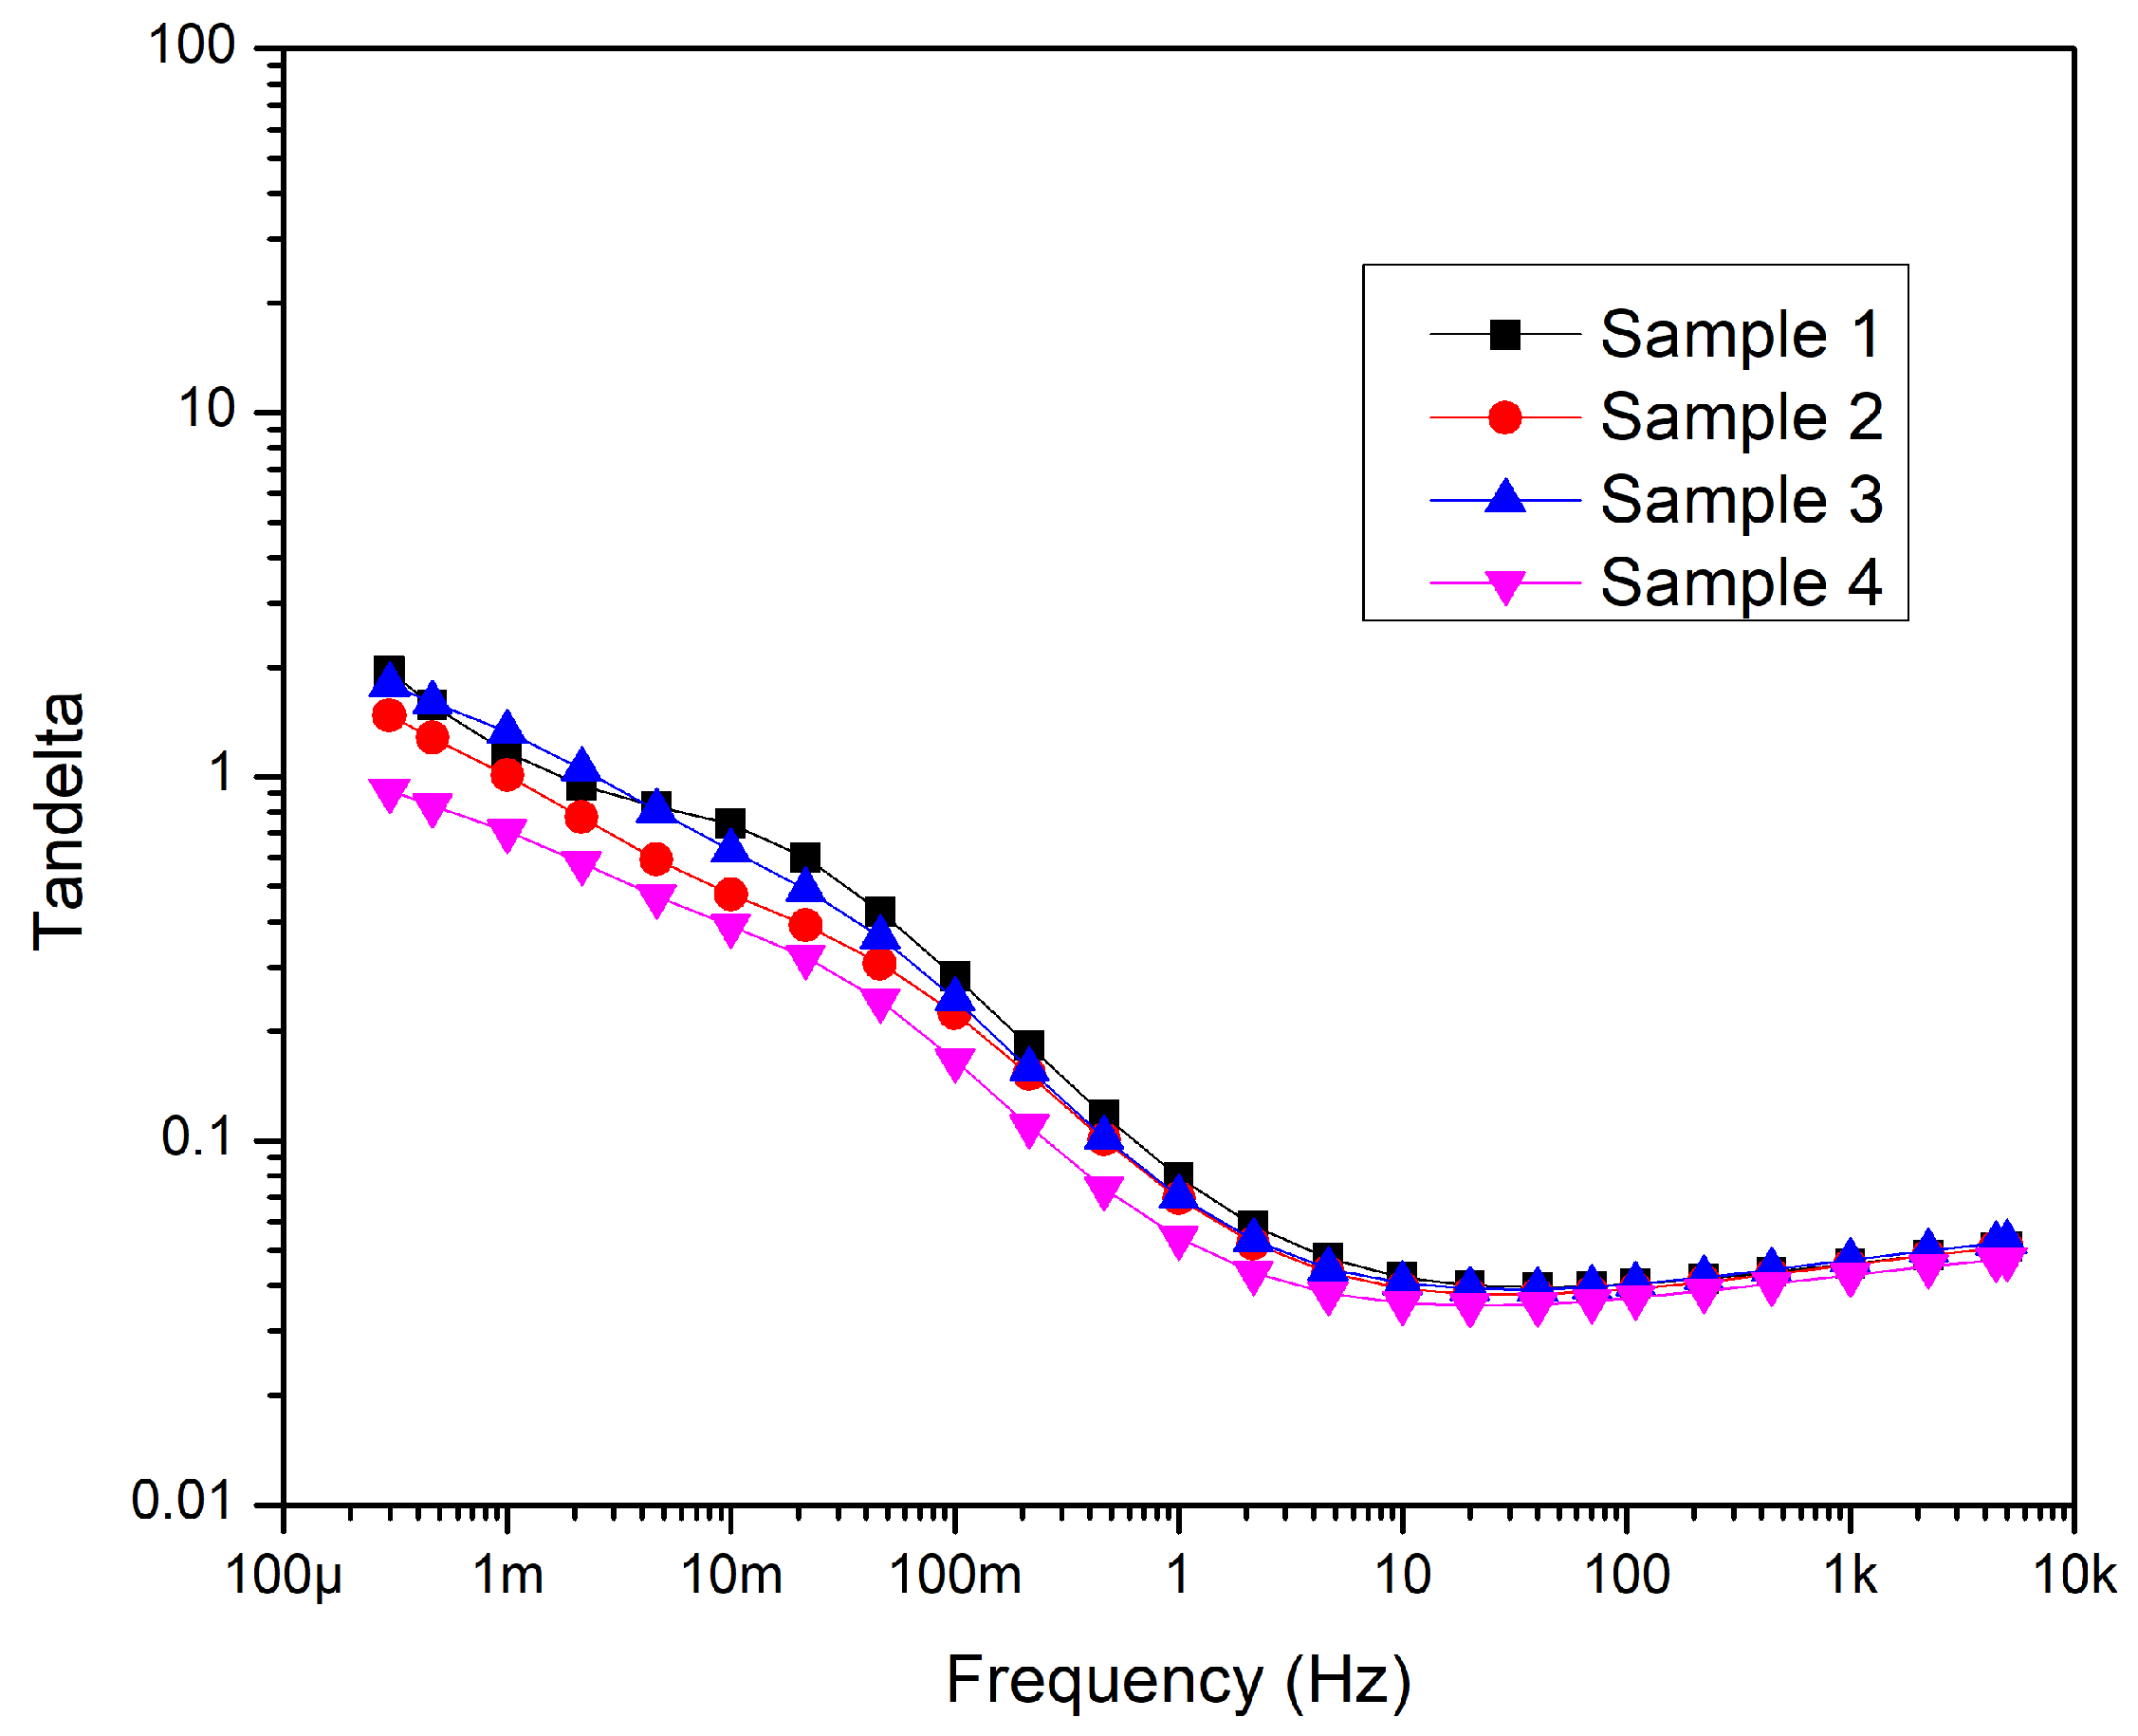
4.1.2. After Aging
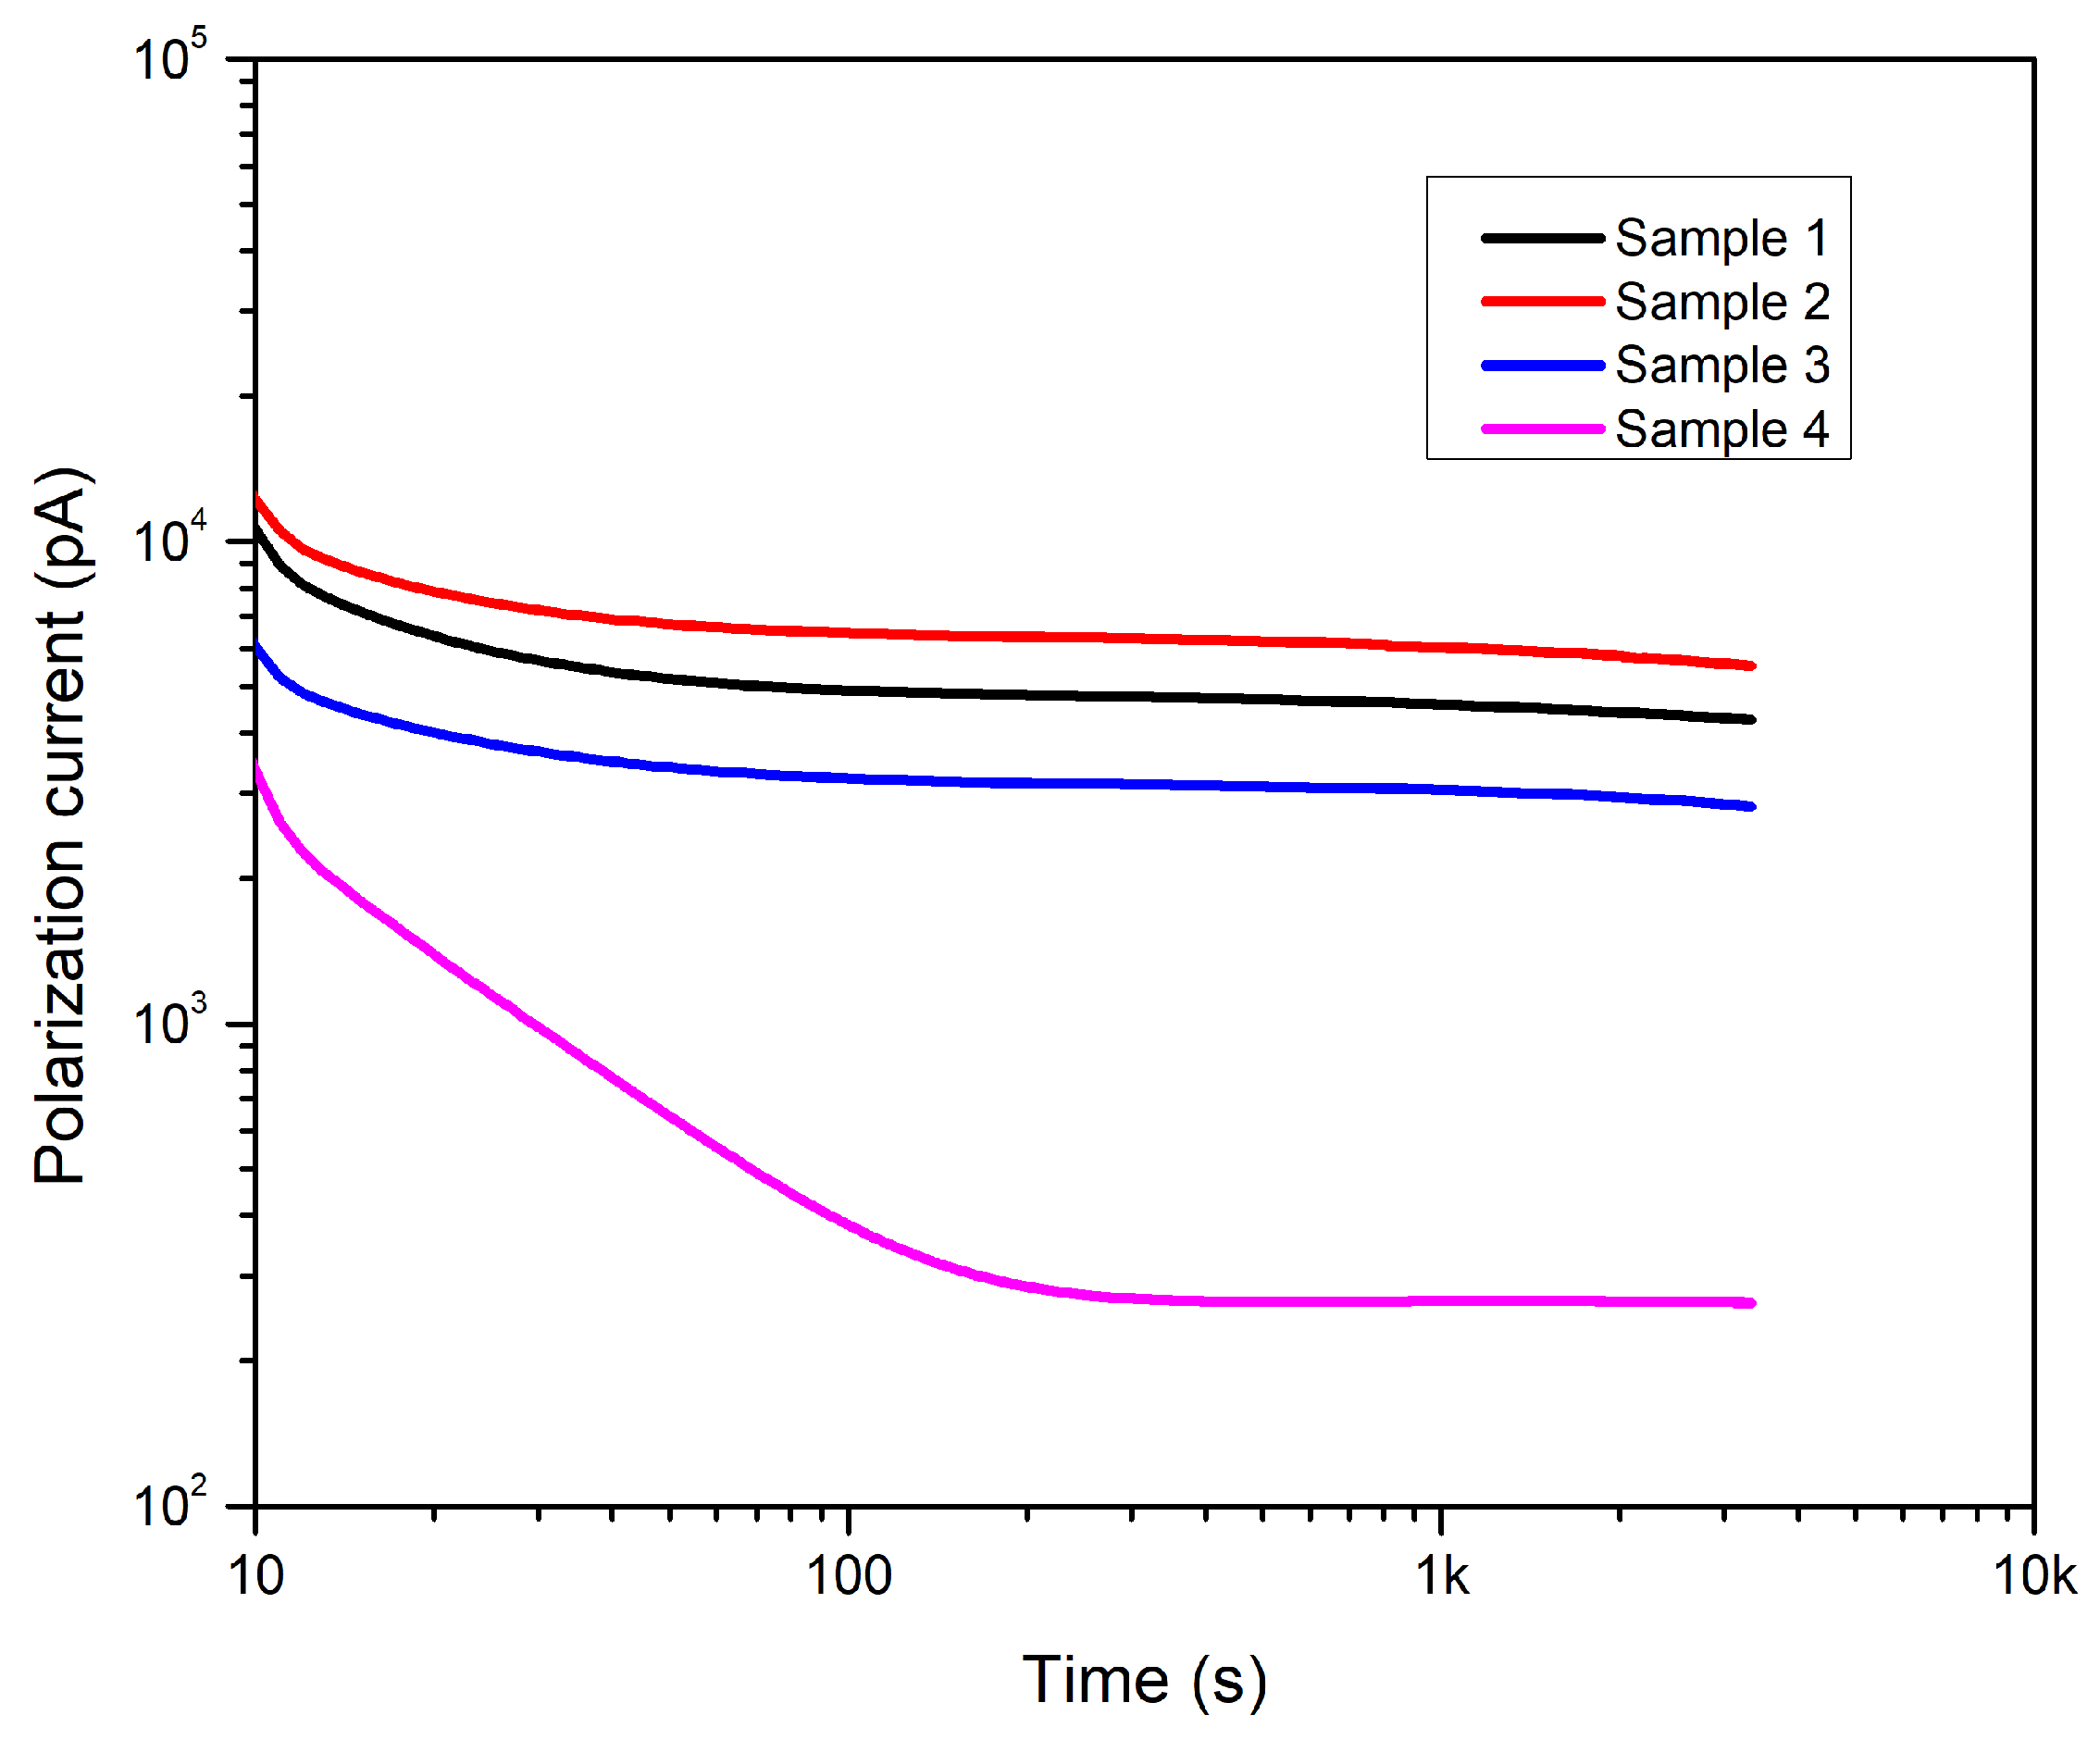
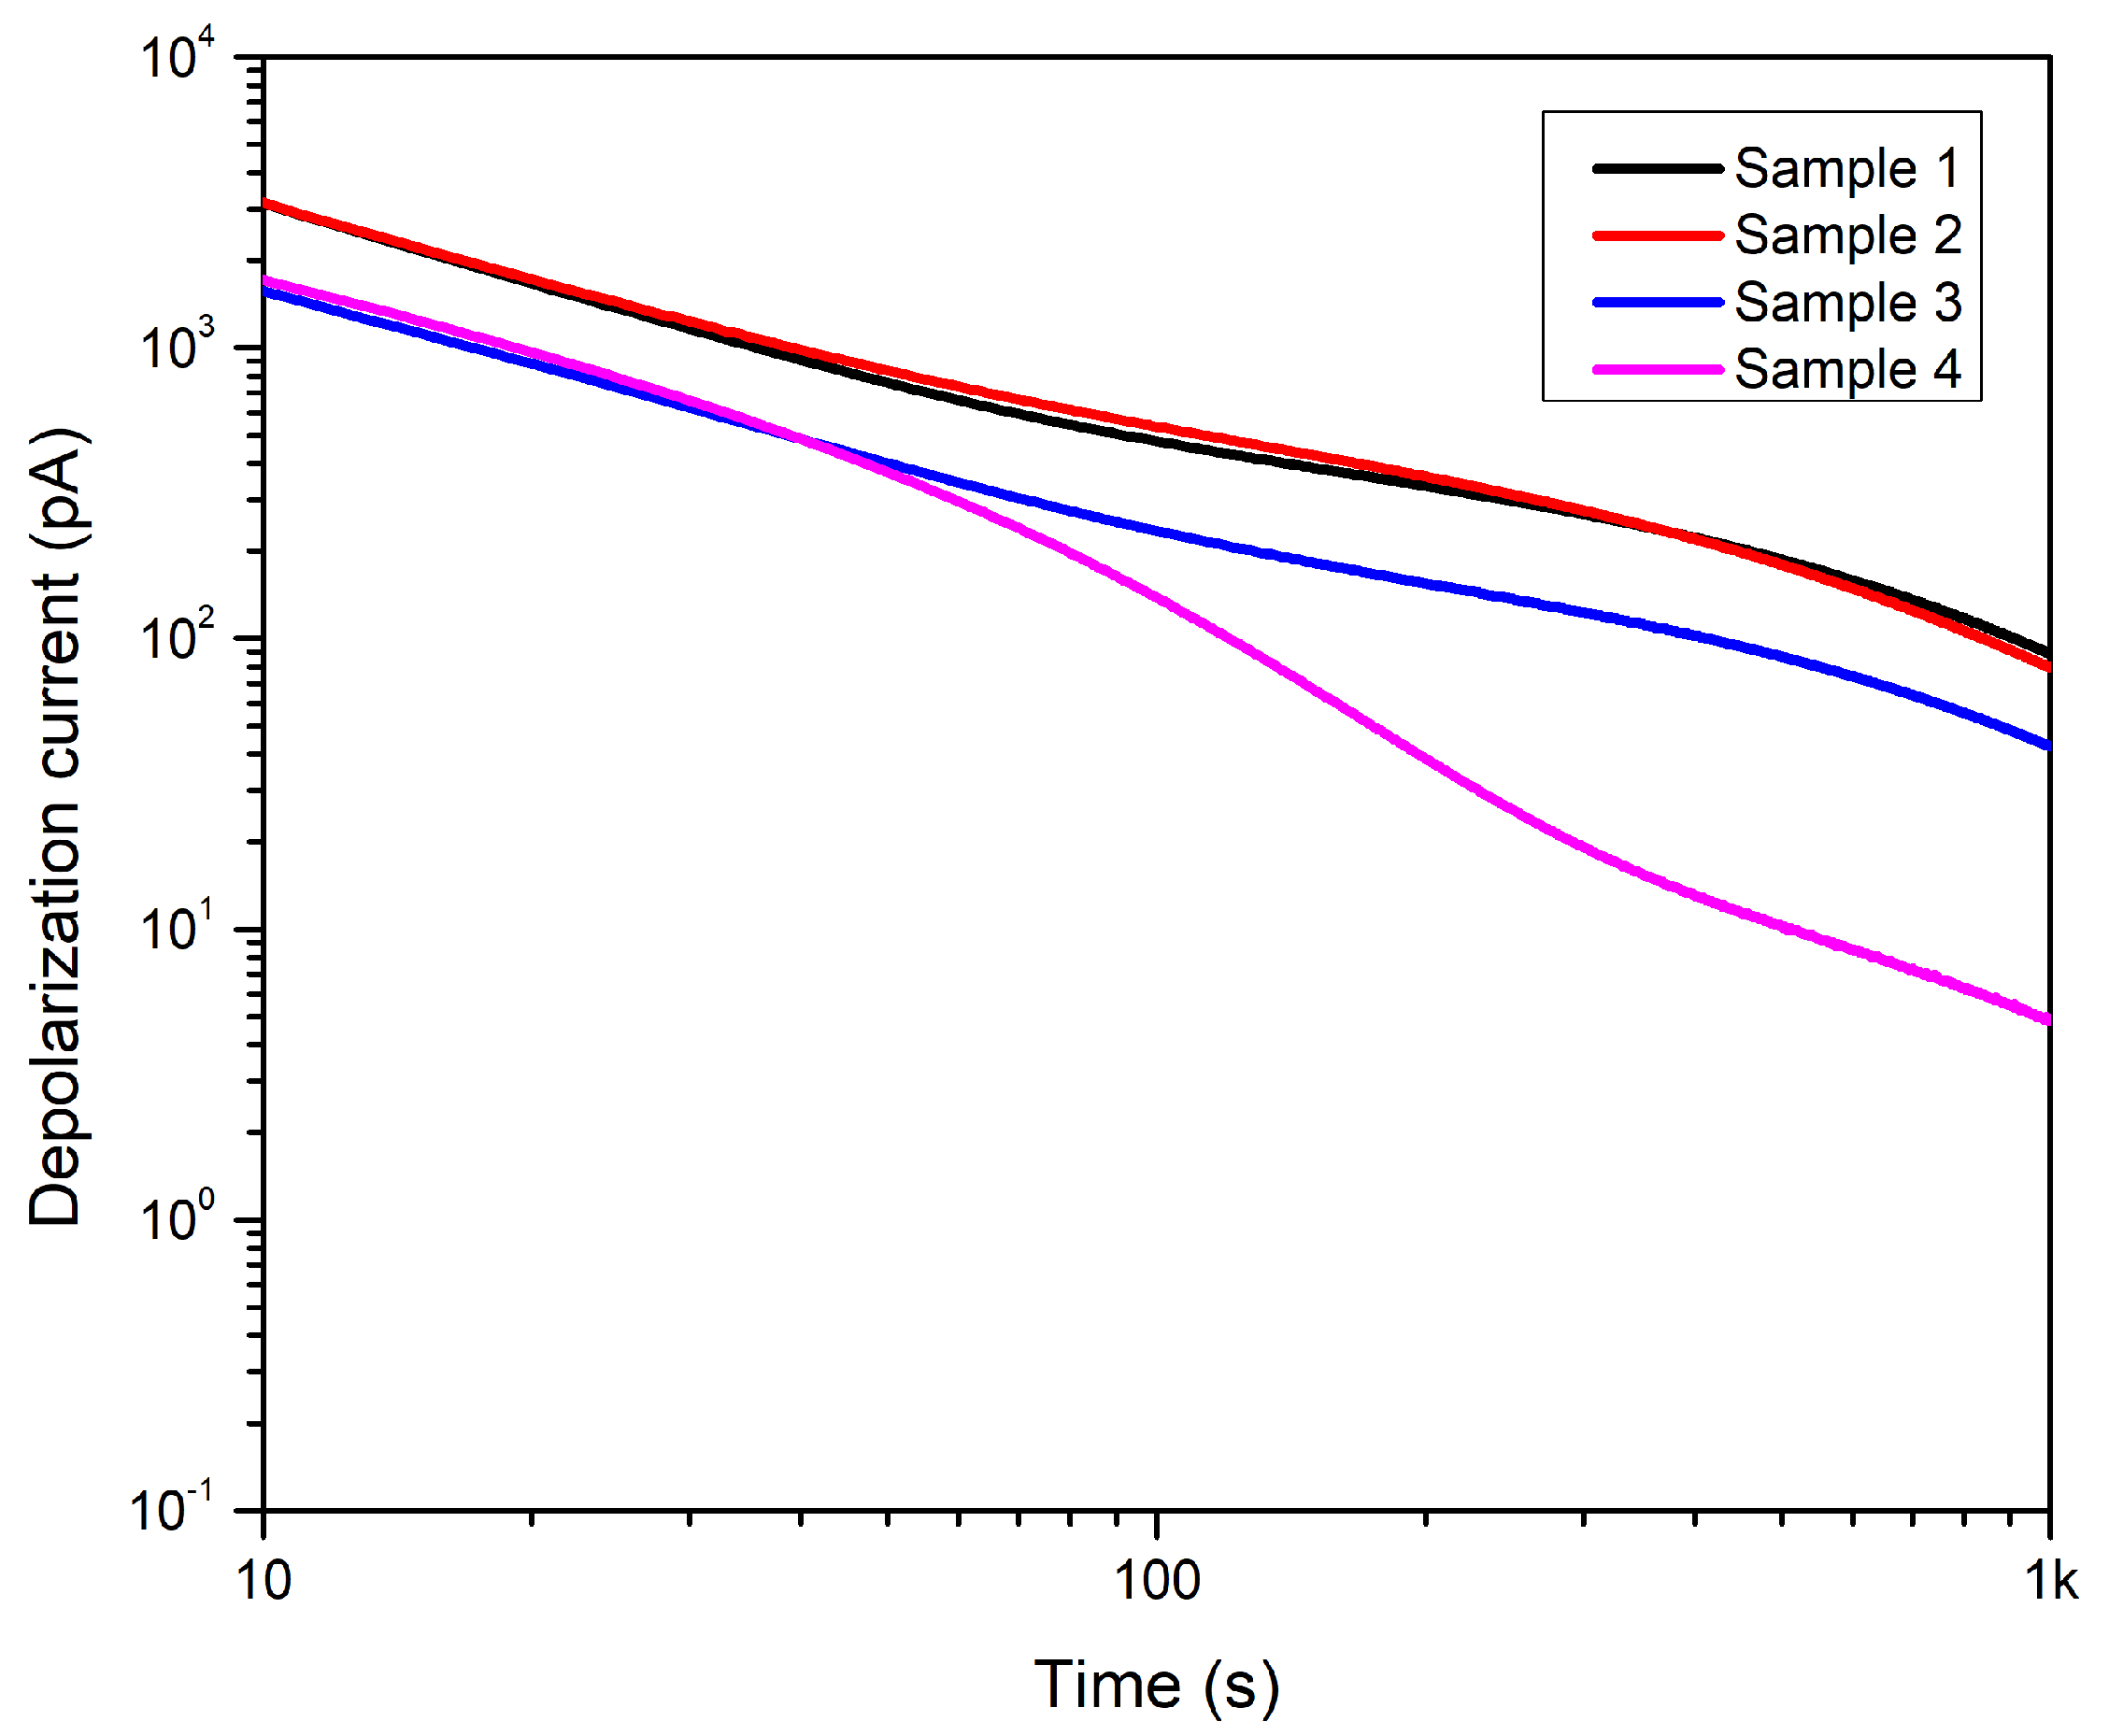
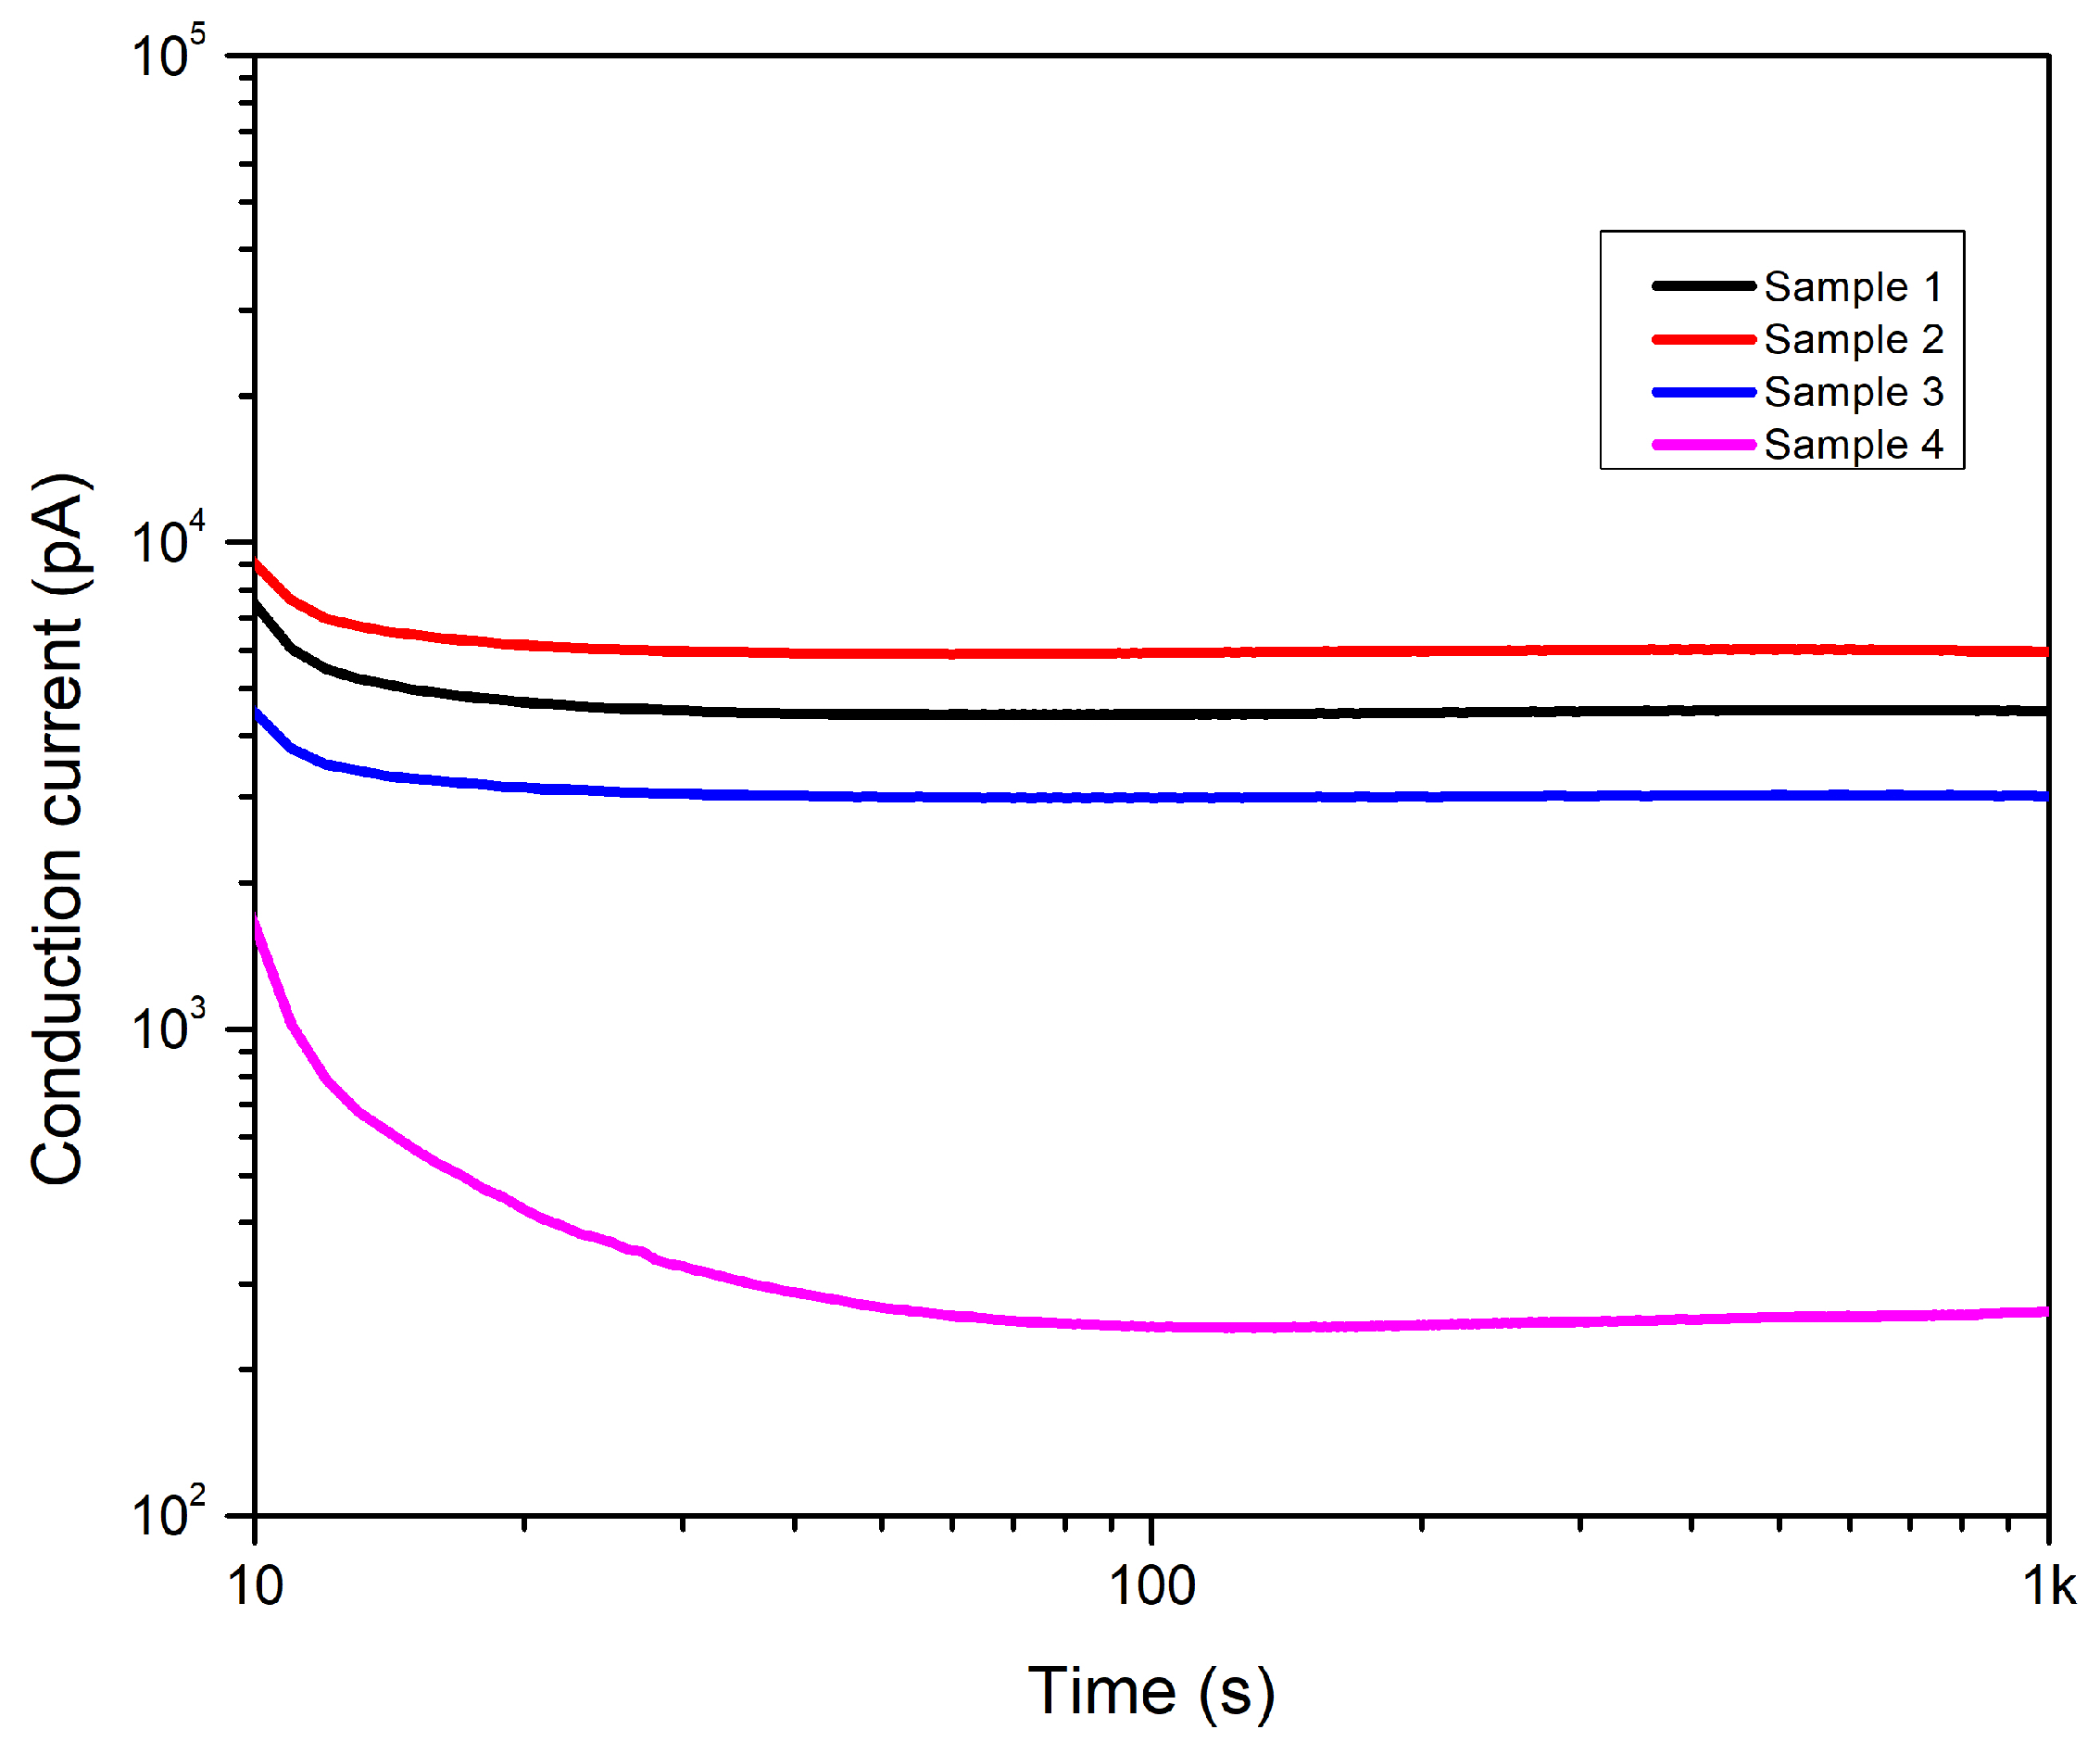
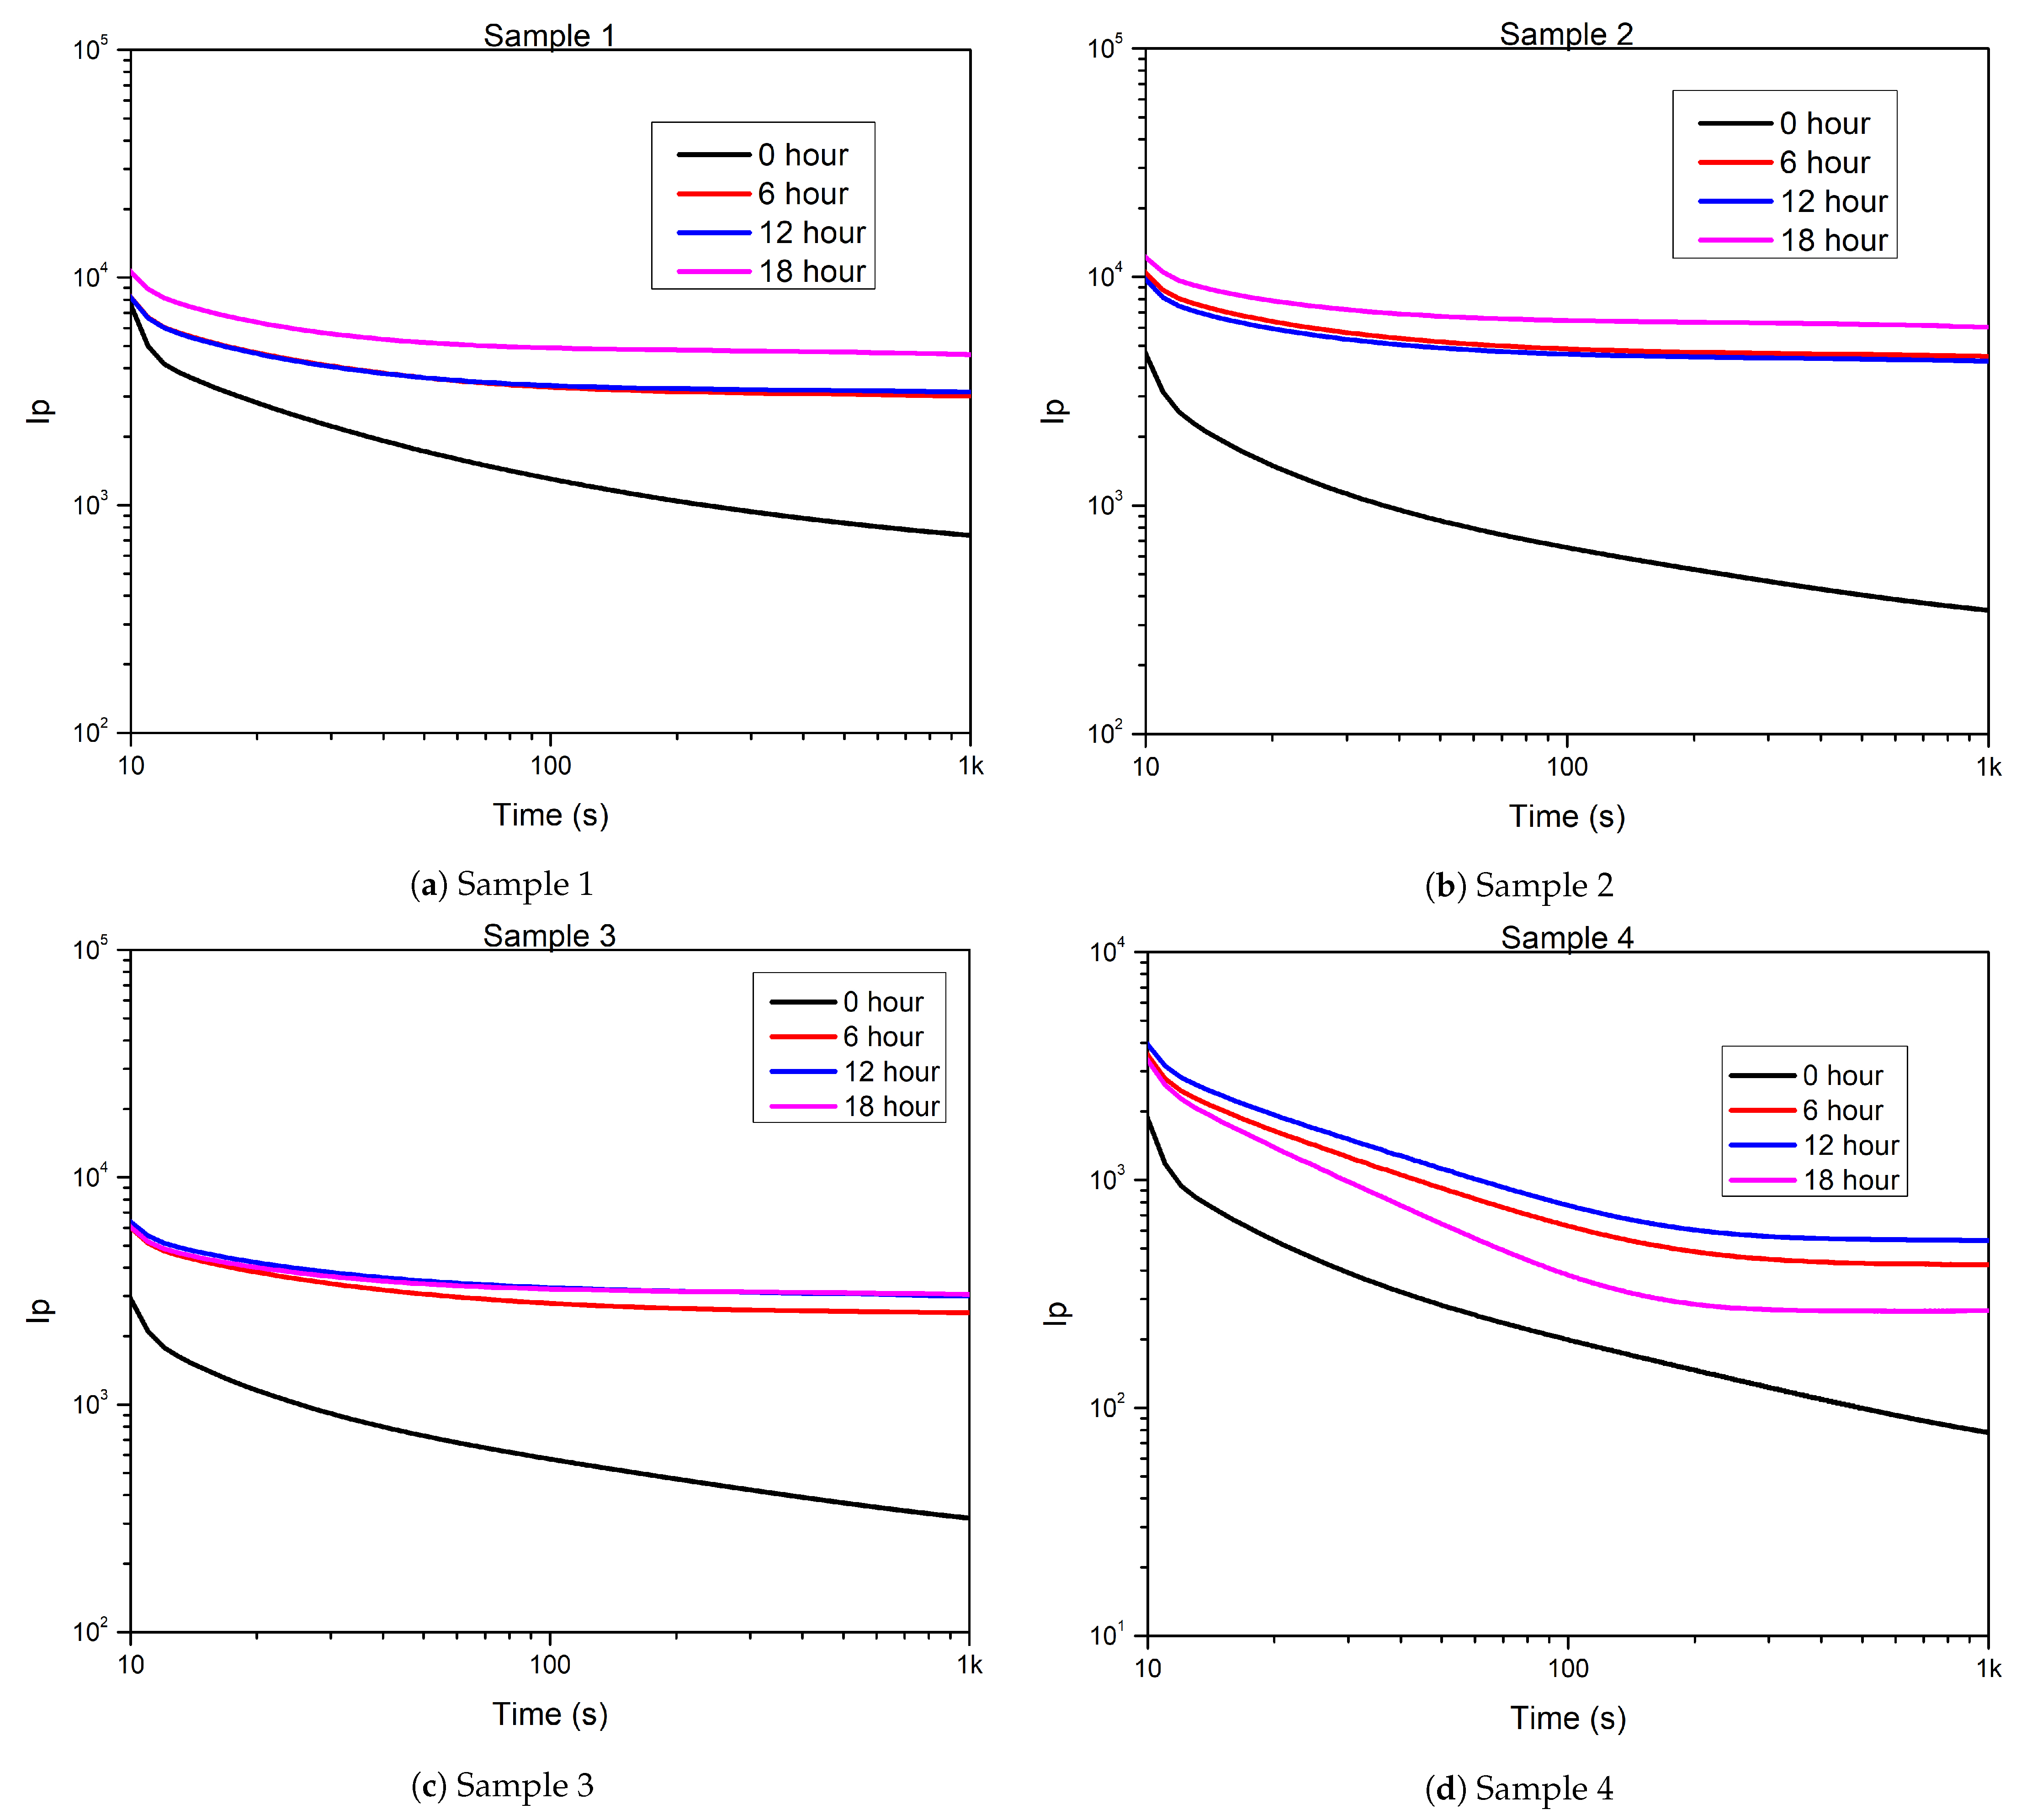
4.2. Impact on the Polarization, Depolarization, and Conduction Currents
4.2.1. Before Aging
4.2.2. After Aging
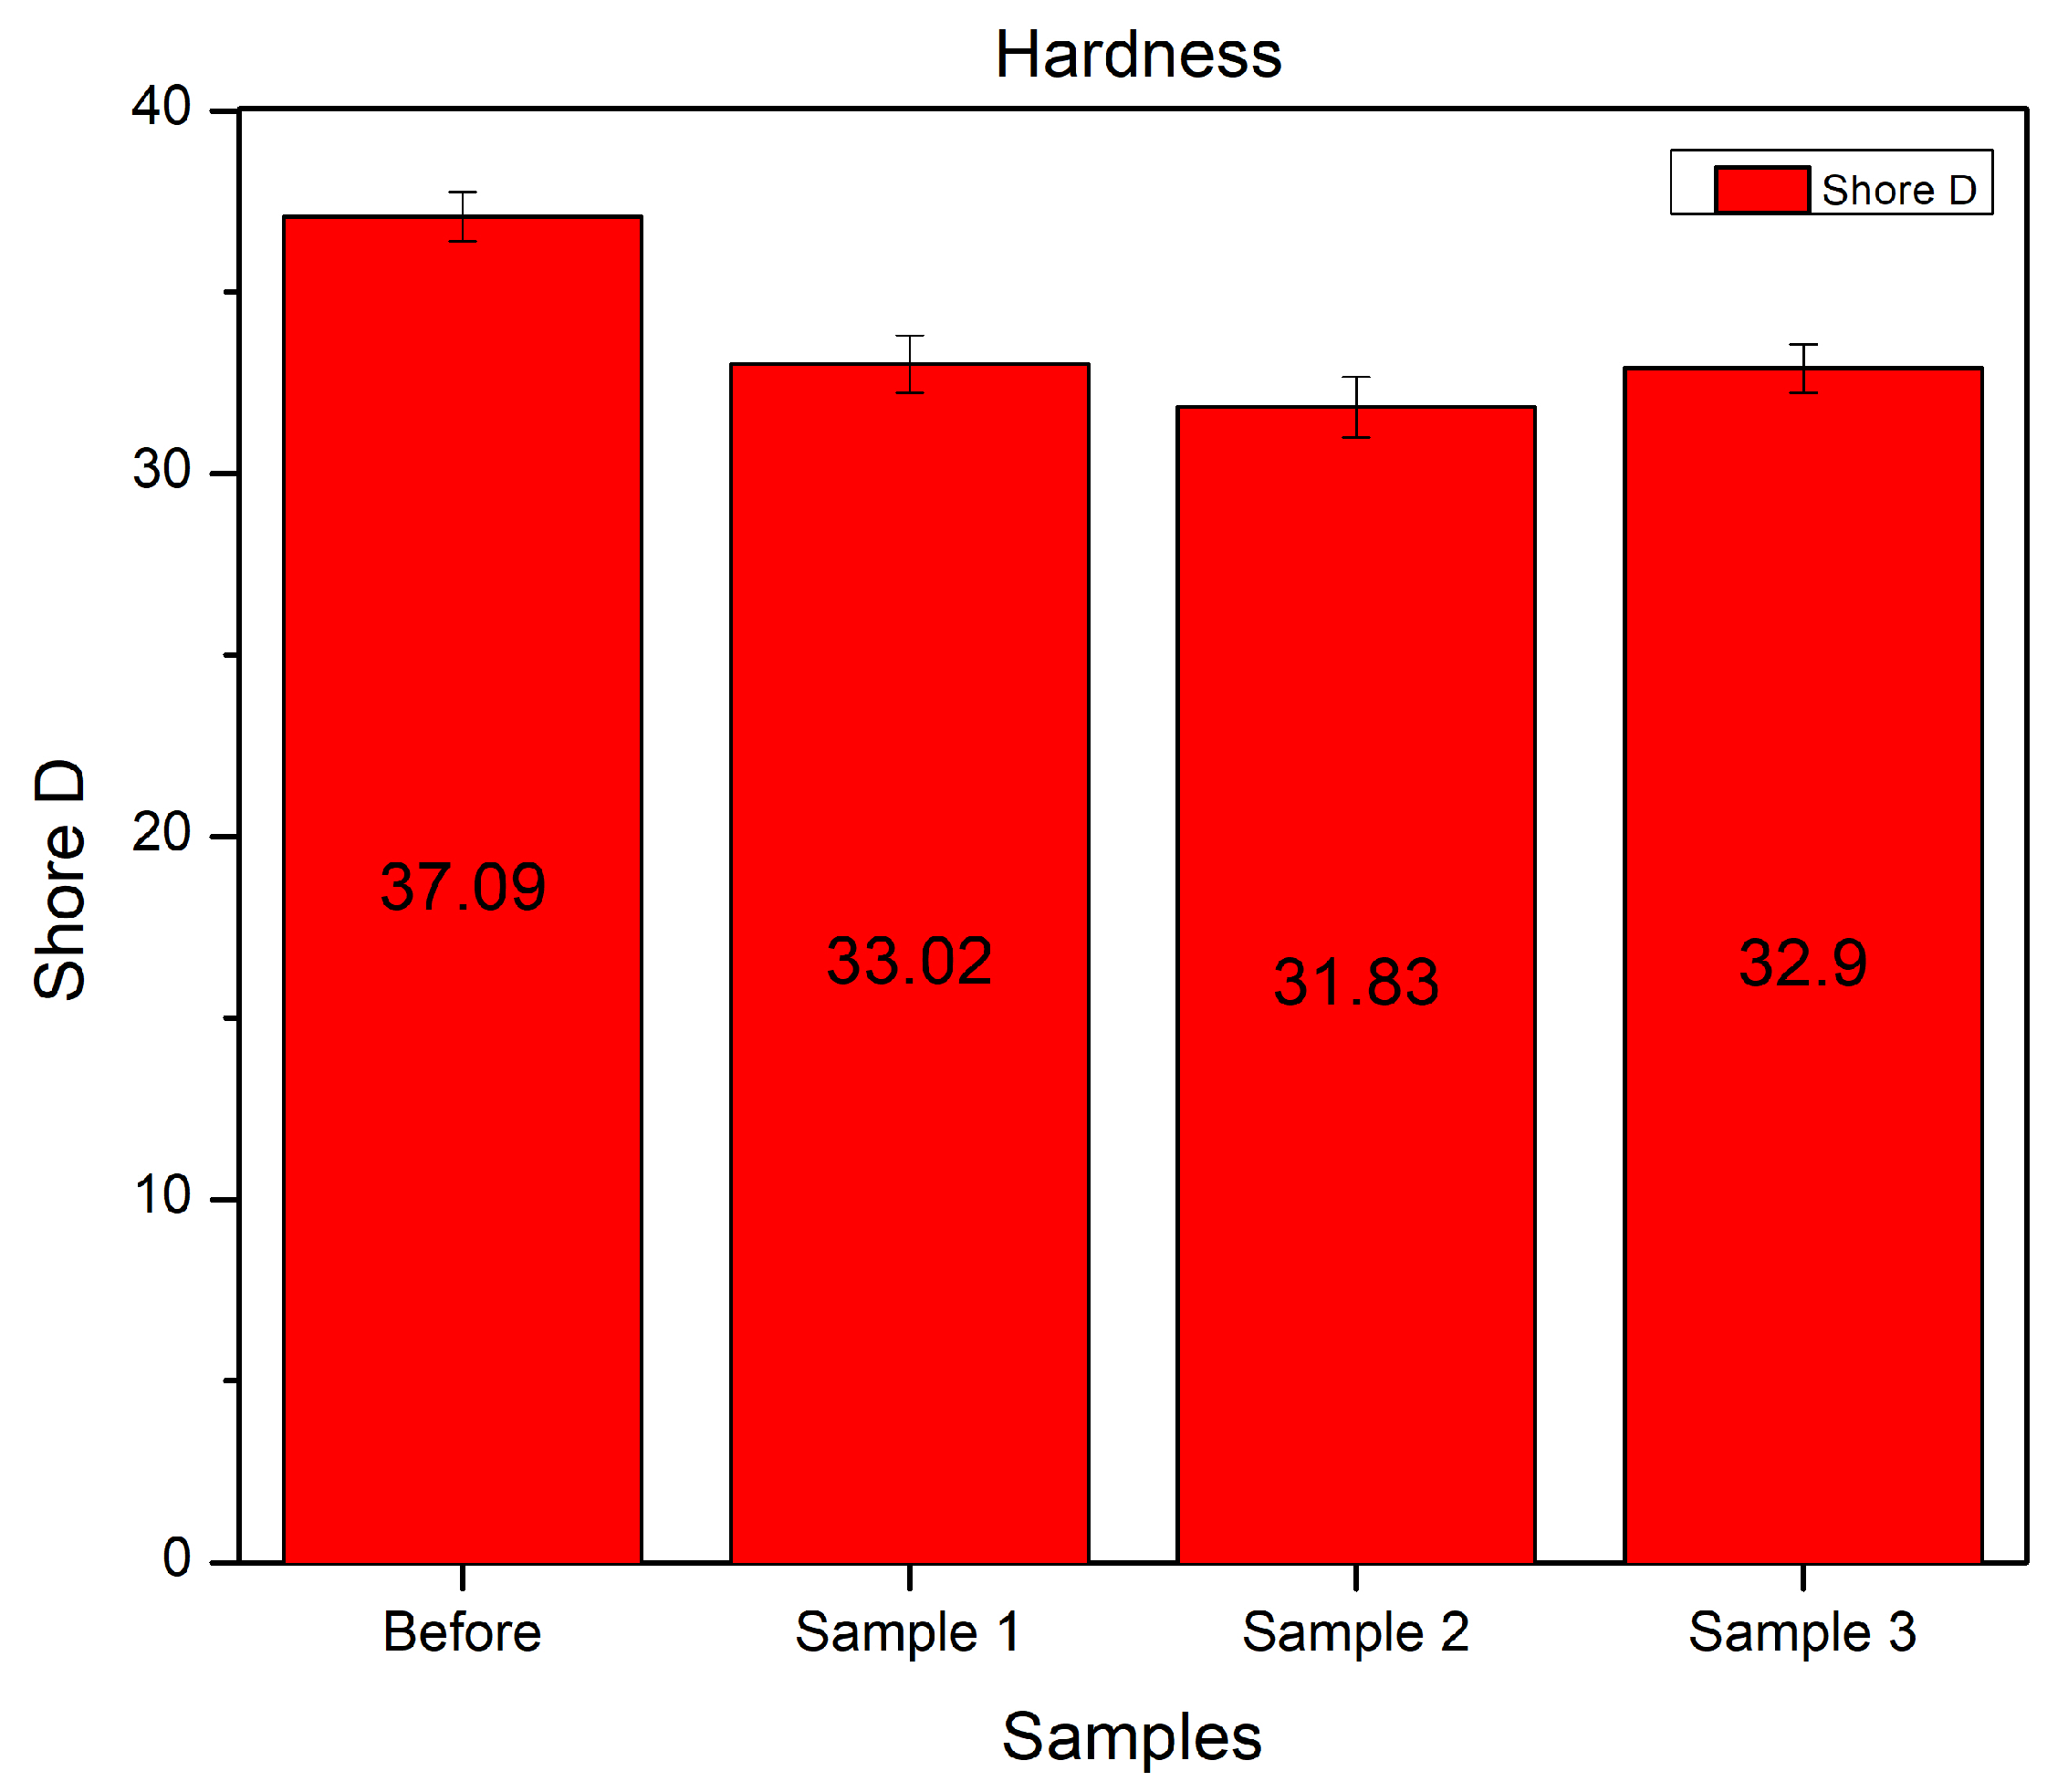
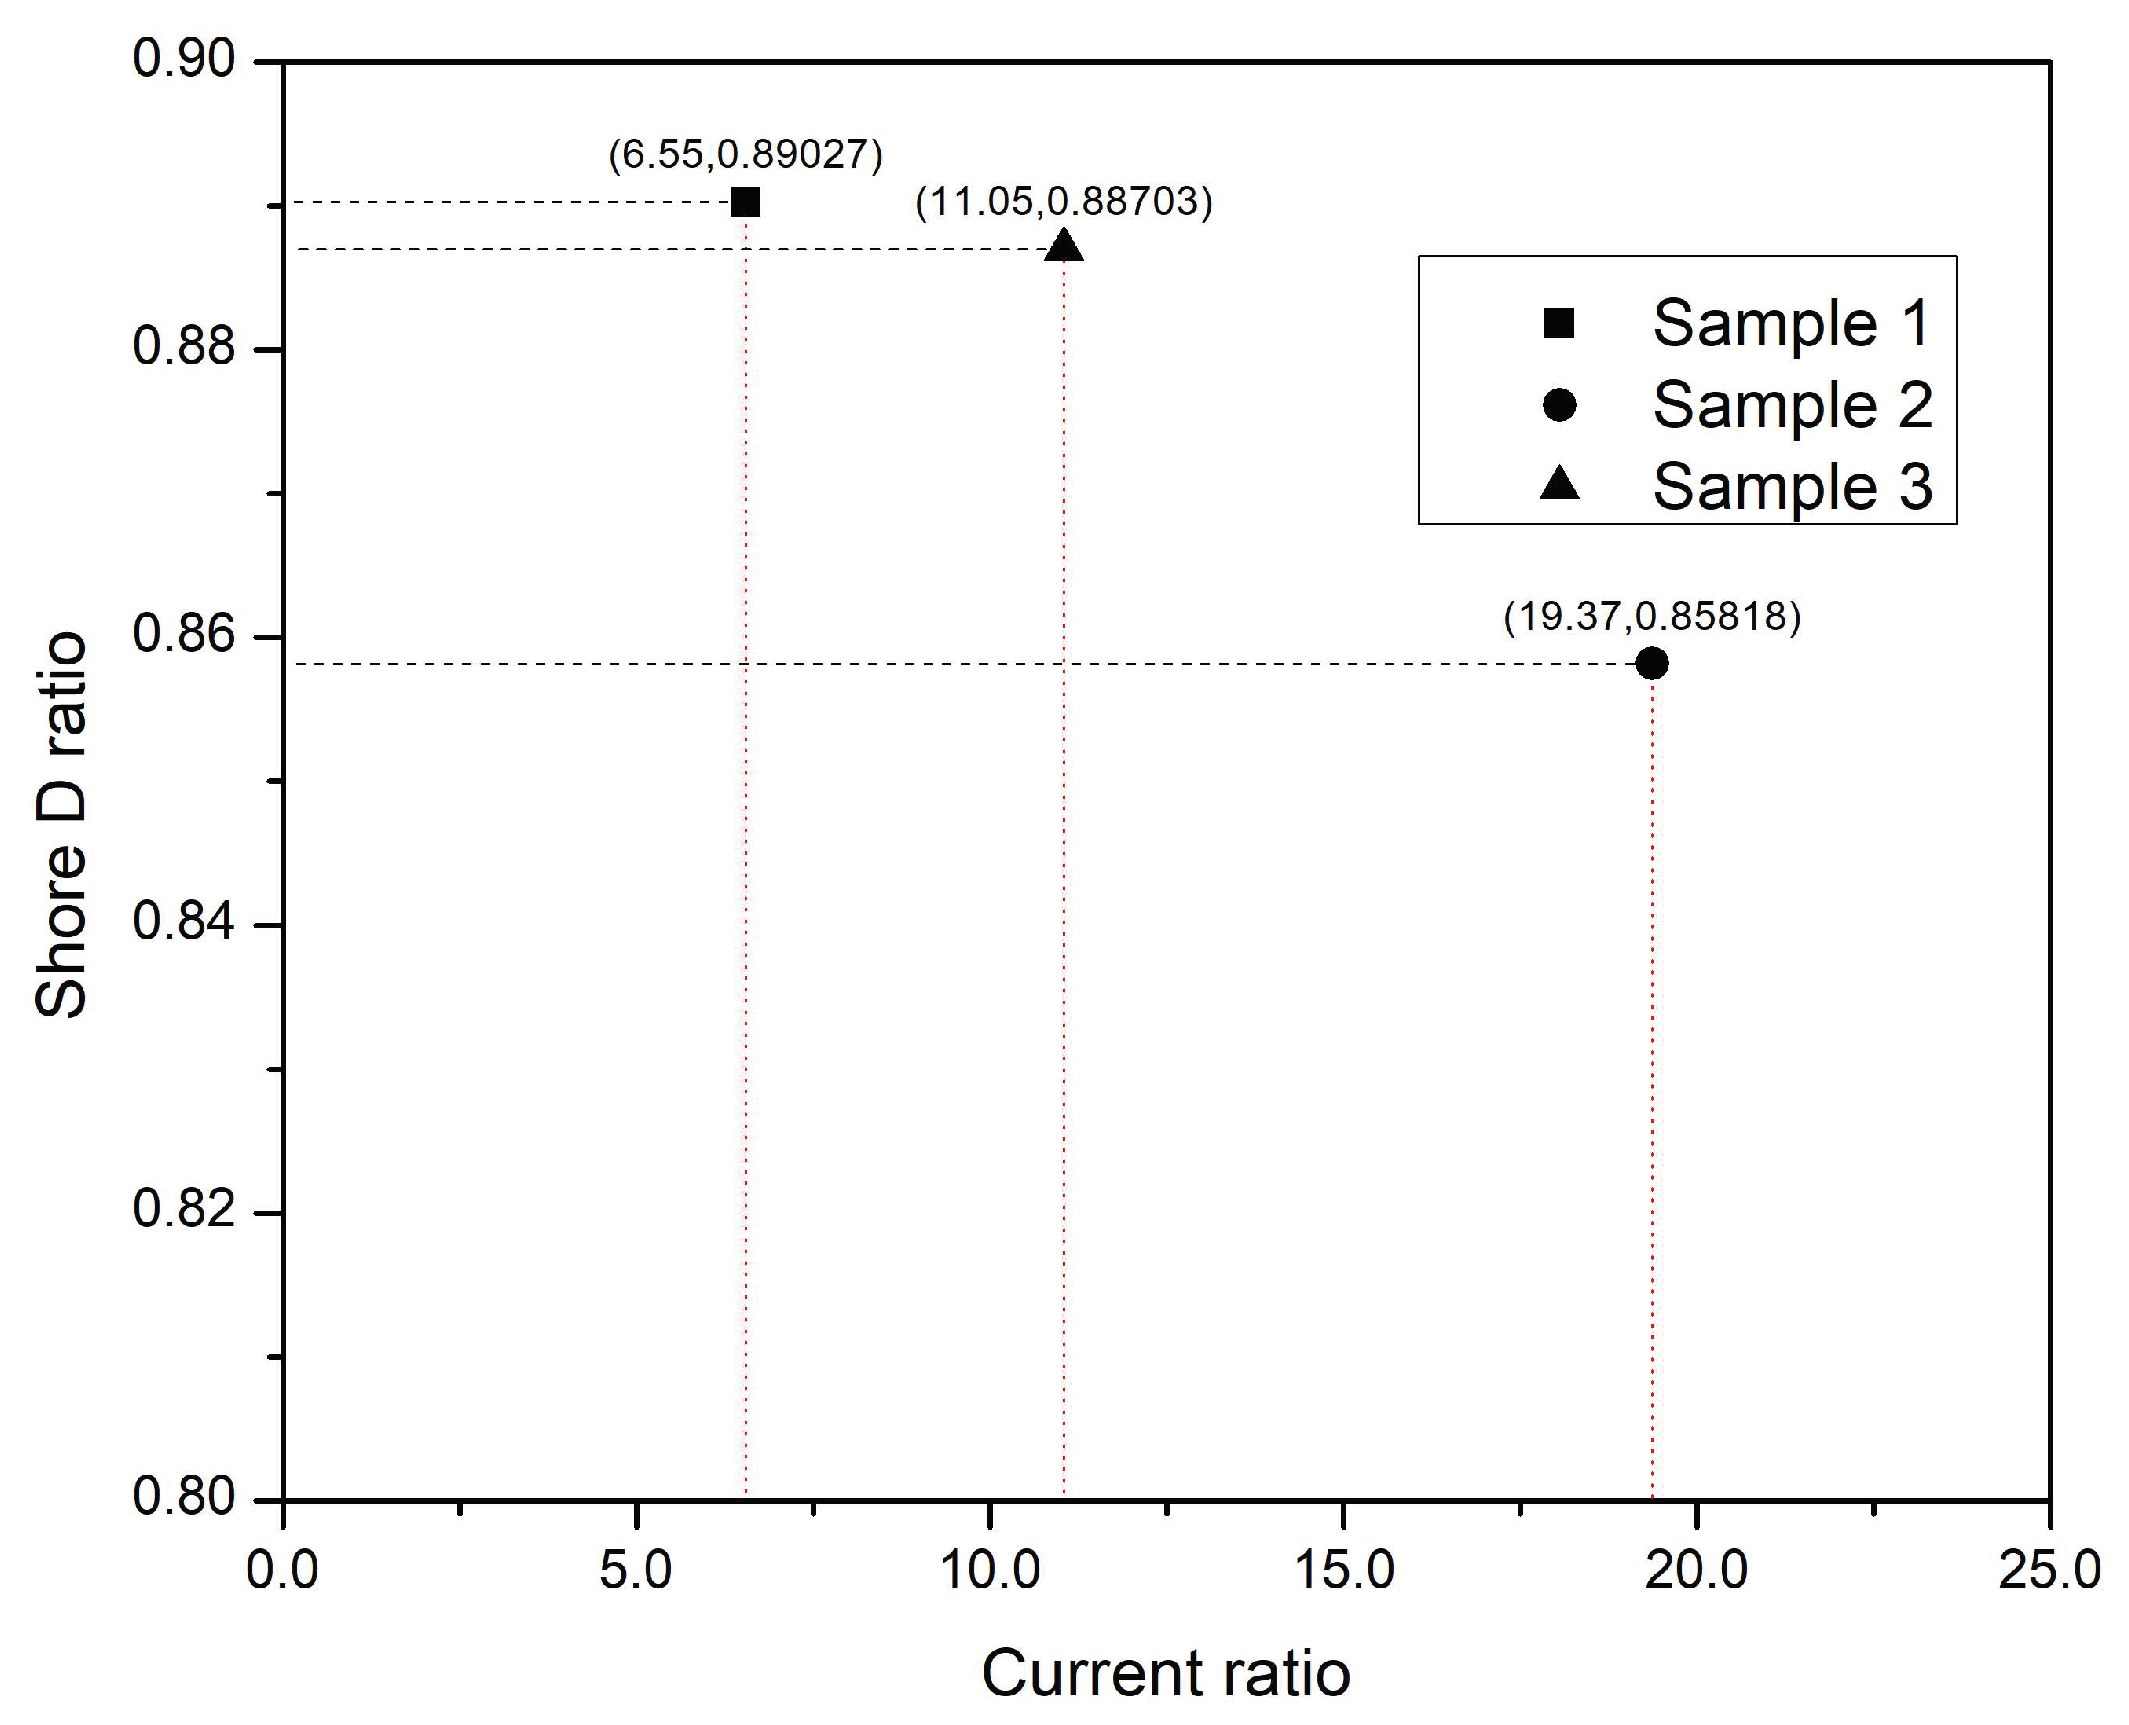
4.3. Shore D Hardness
5. Conclusions
Author Contributions
Funding
Institutional Review Board Statement
Informed Consent Statement
Data Availability Statement
Conflicts of Interest
Appendix A. Results of the FDS Measurement
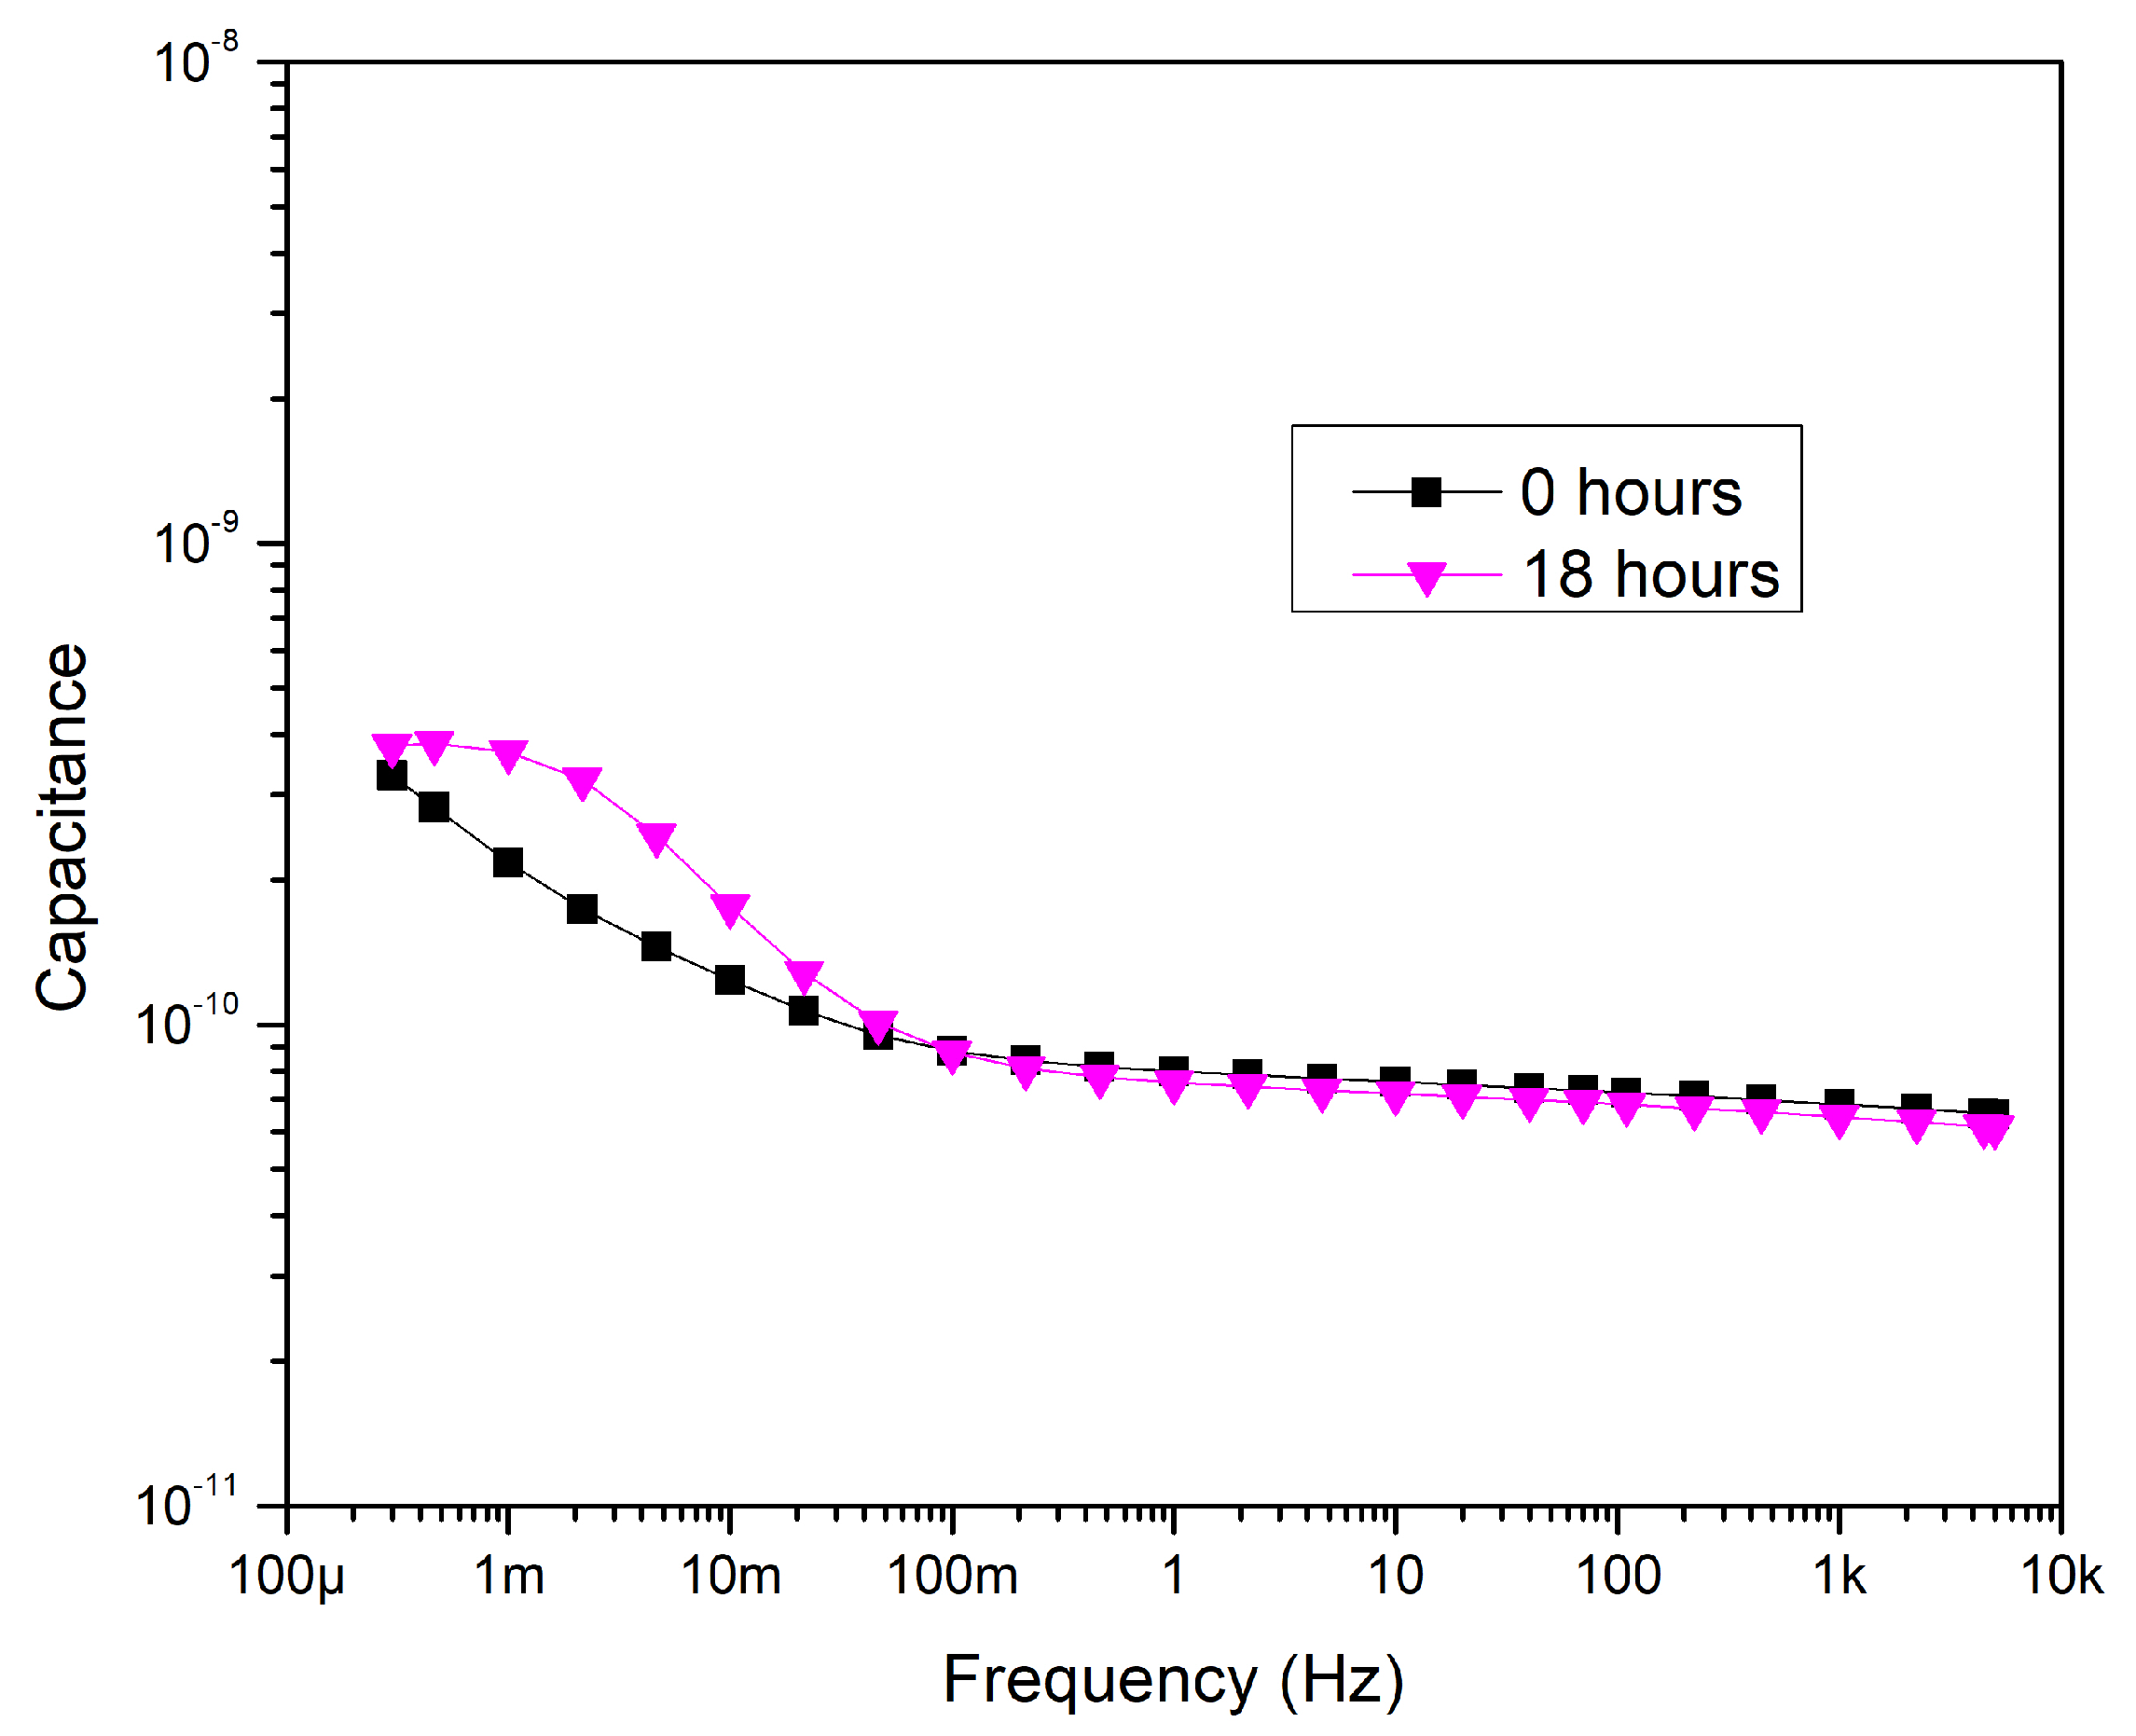
Appendix A.1. Capacitance of Samples

Appendix A.2. Tan δ of Samples

Appendix B. Results of the PDC Measurement
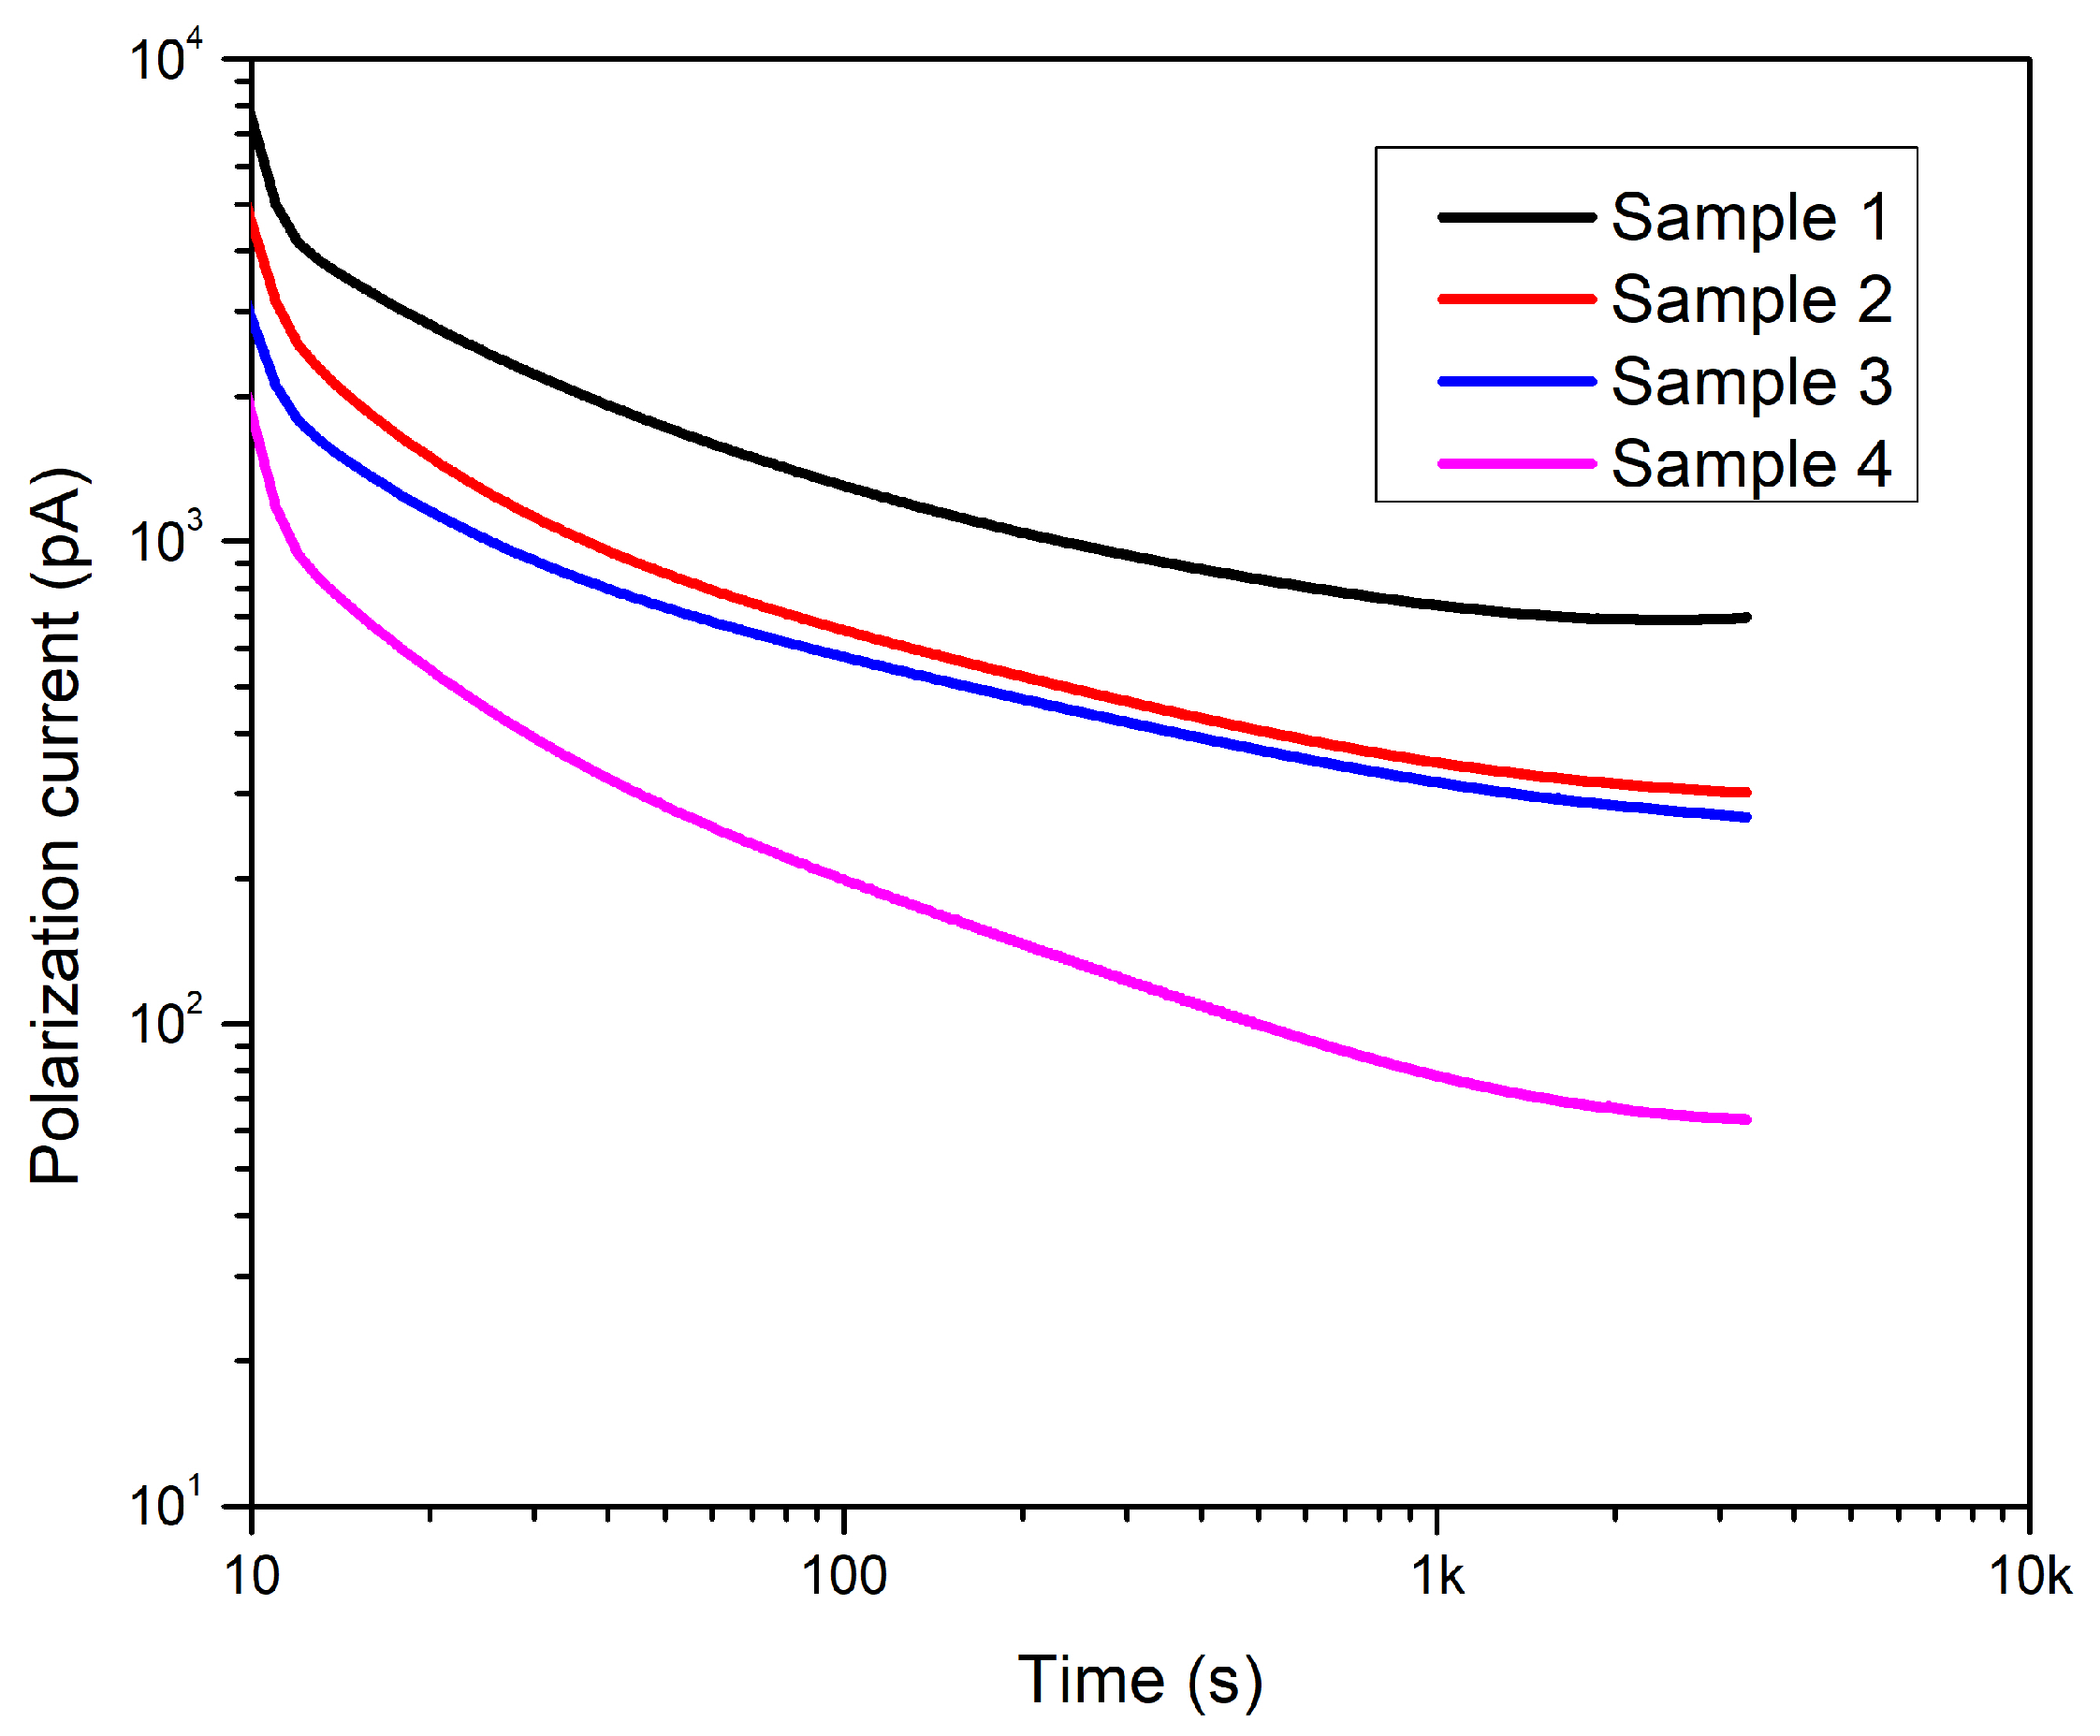
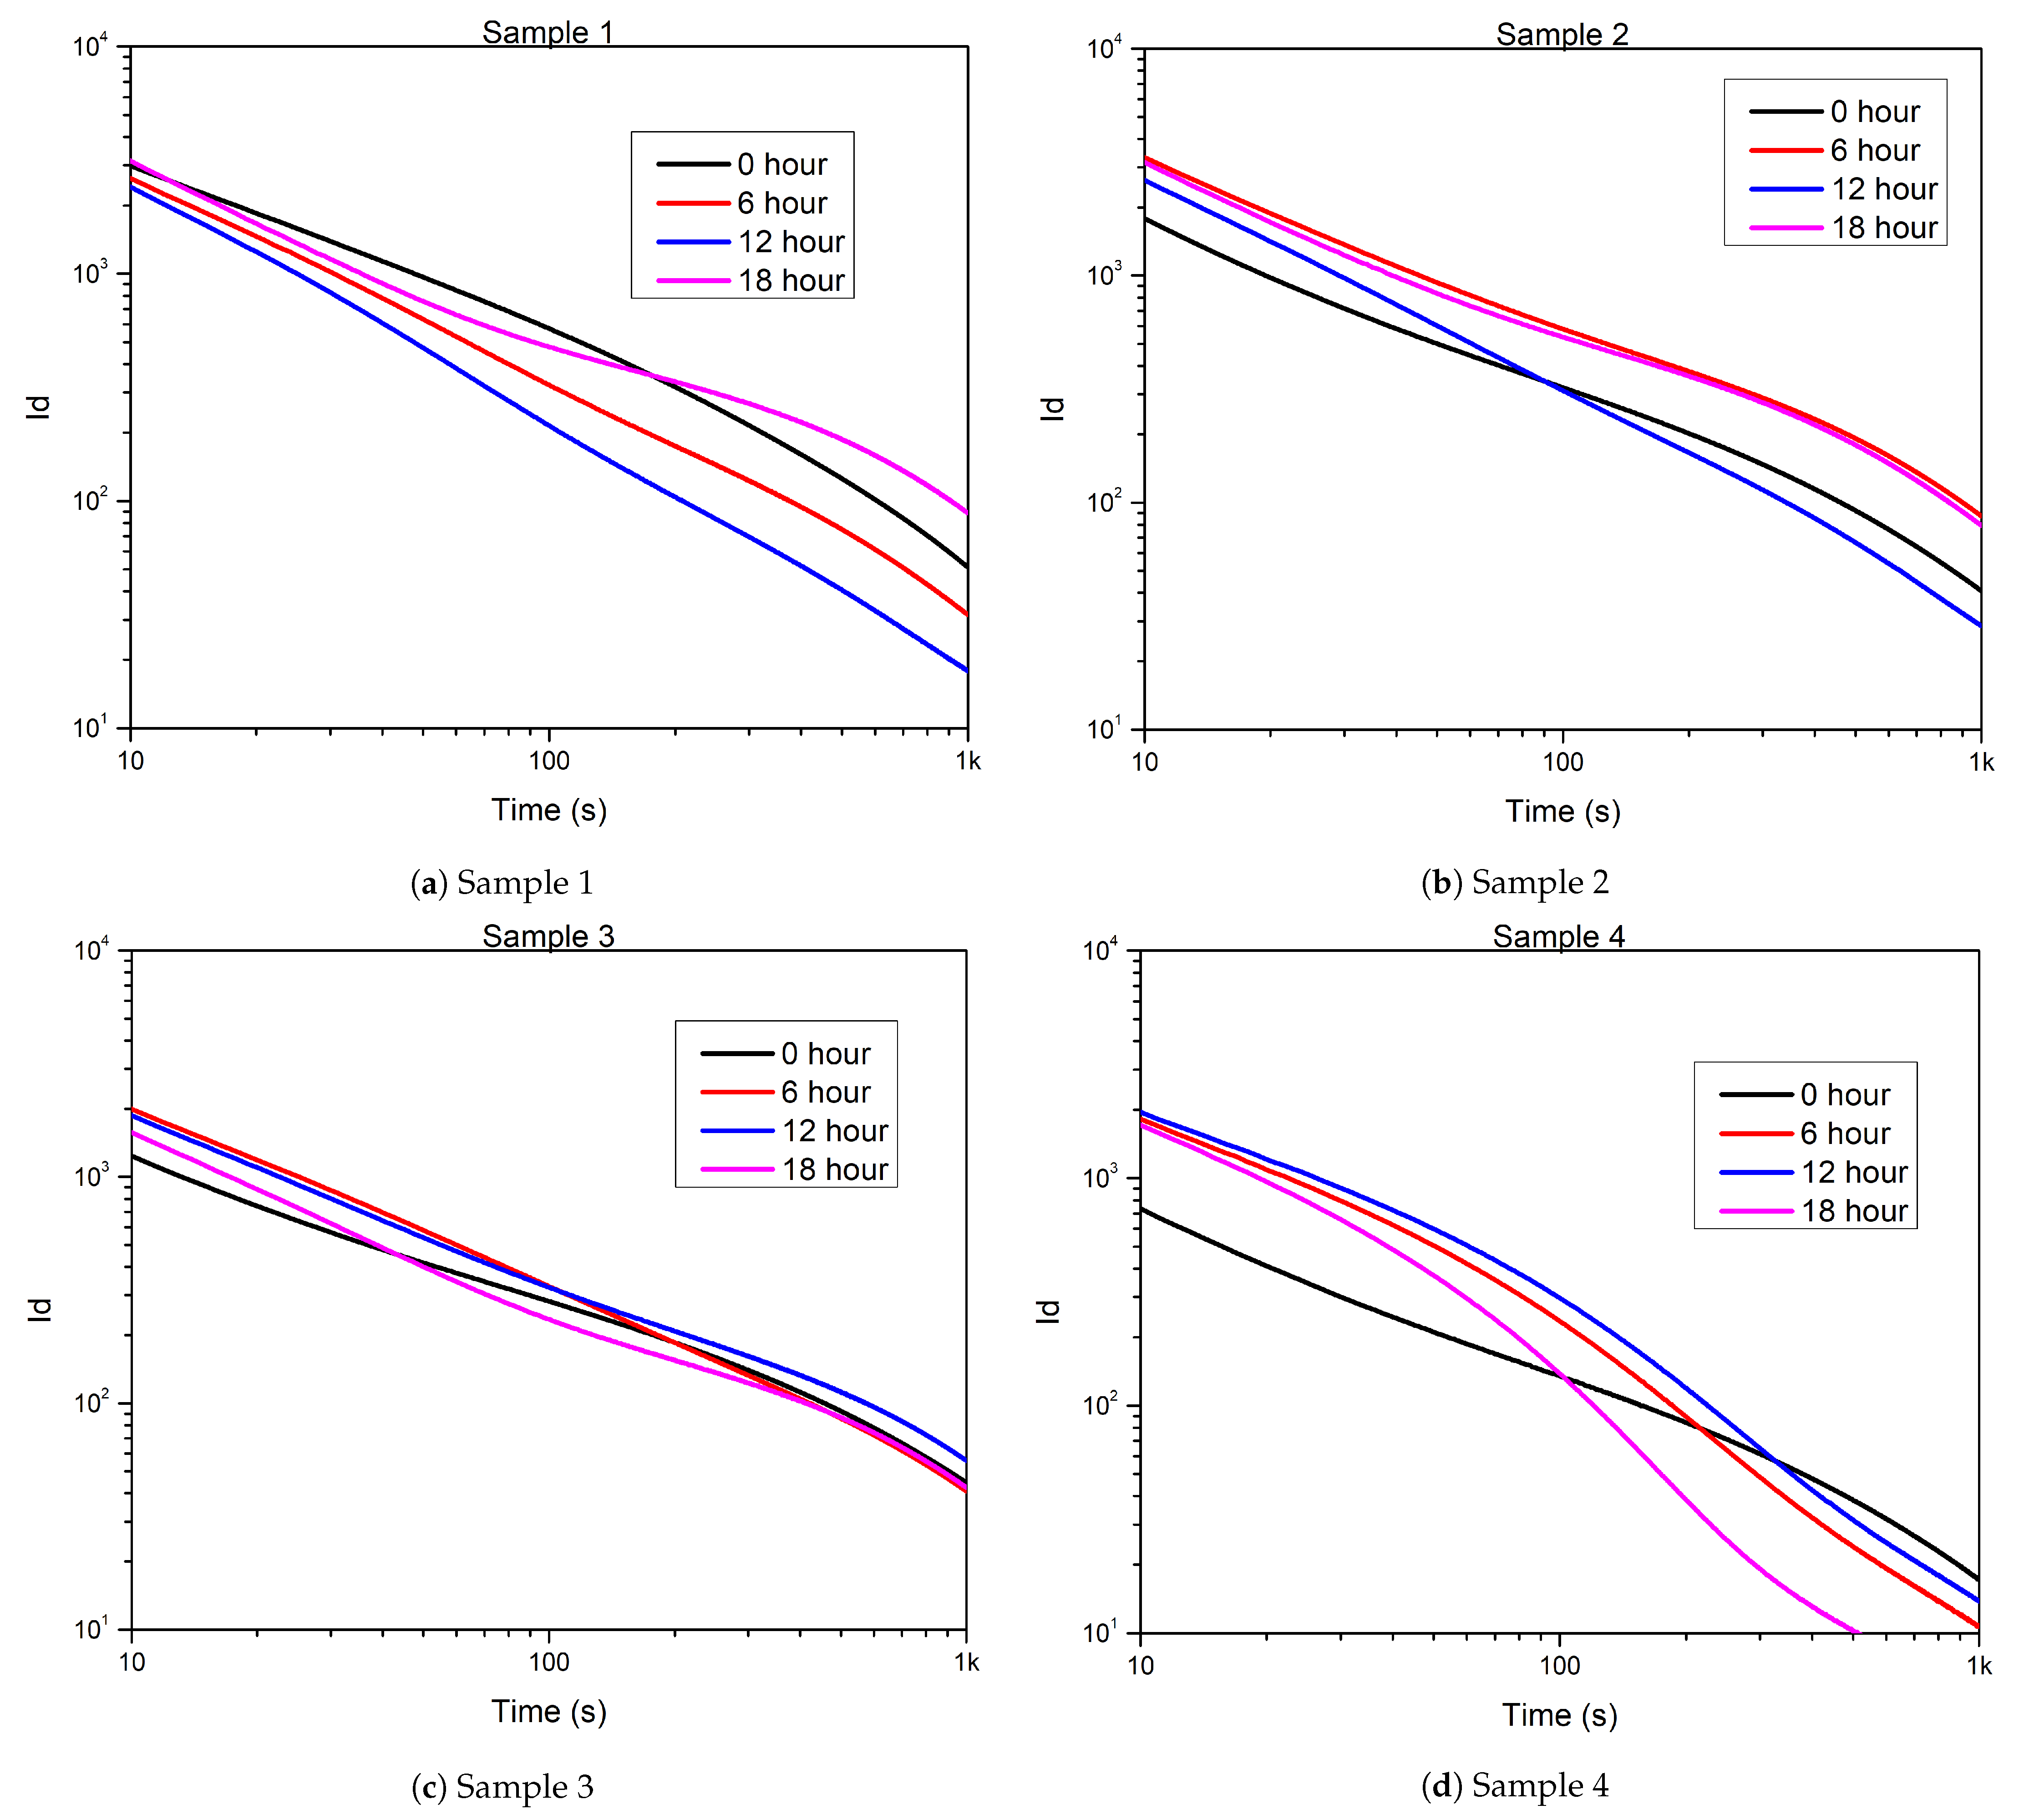
Appendix B.1. Polarization Current of Samples

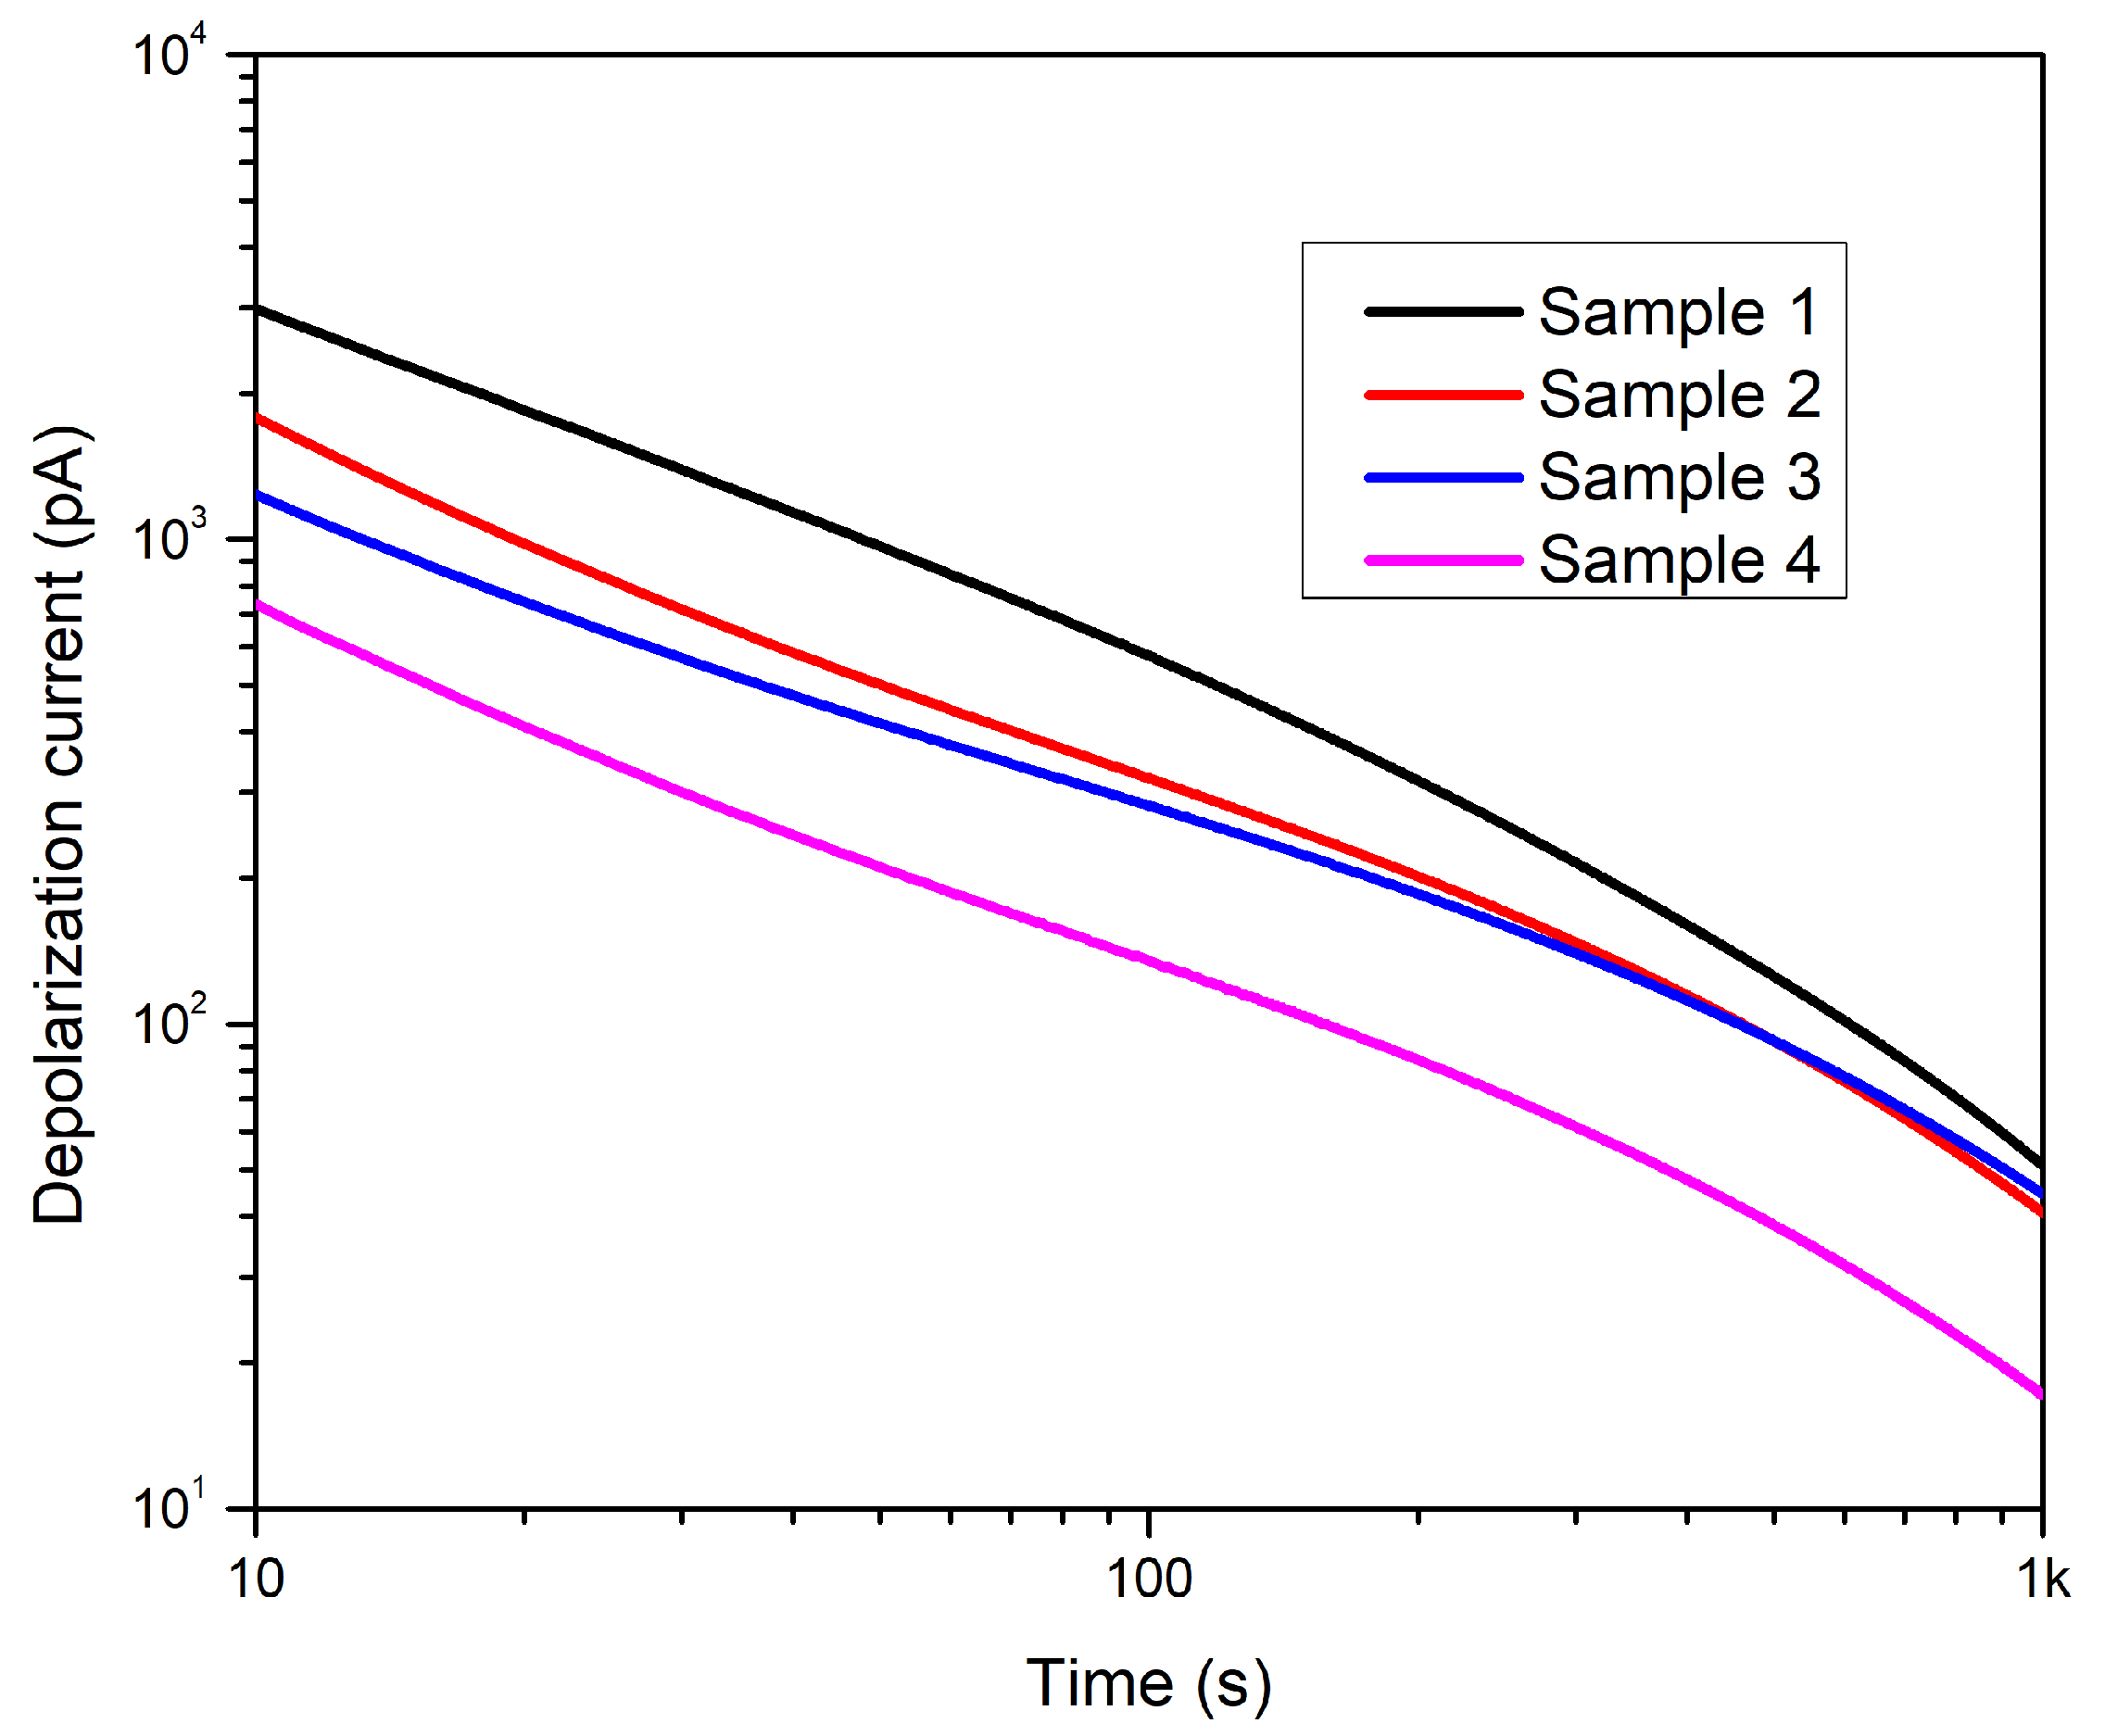
Appendix B.2. Depolarization Current of Samples

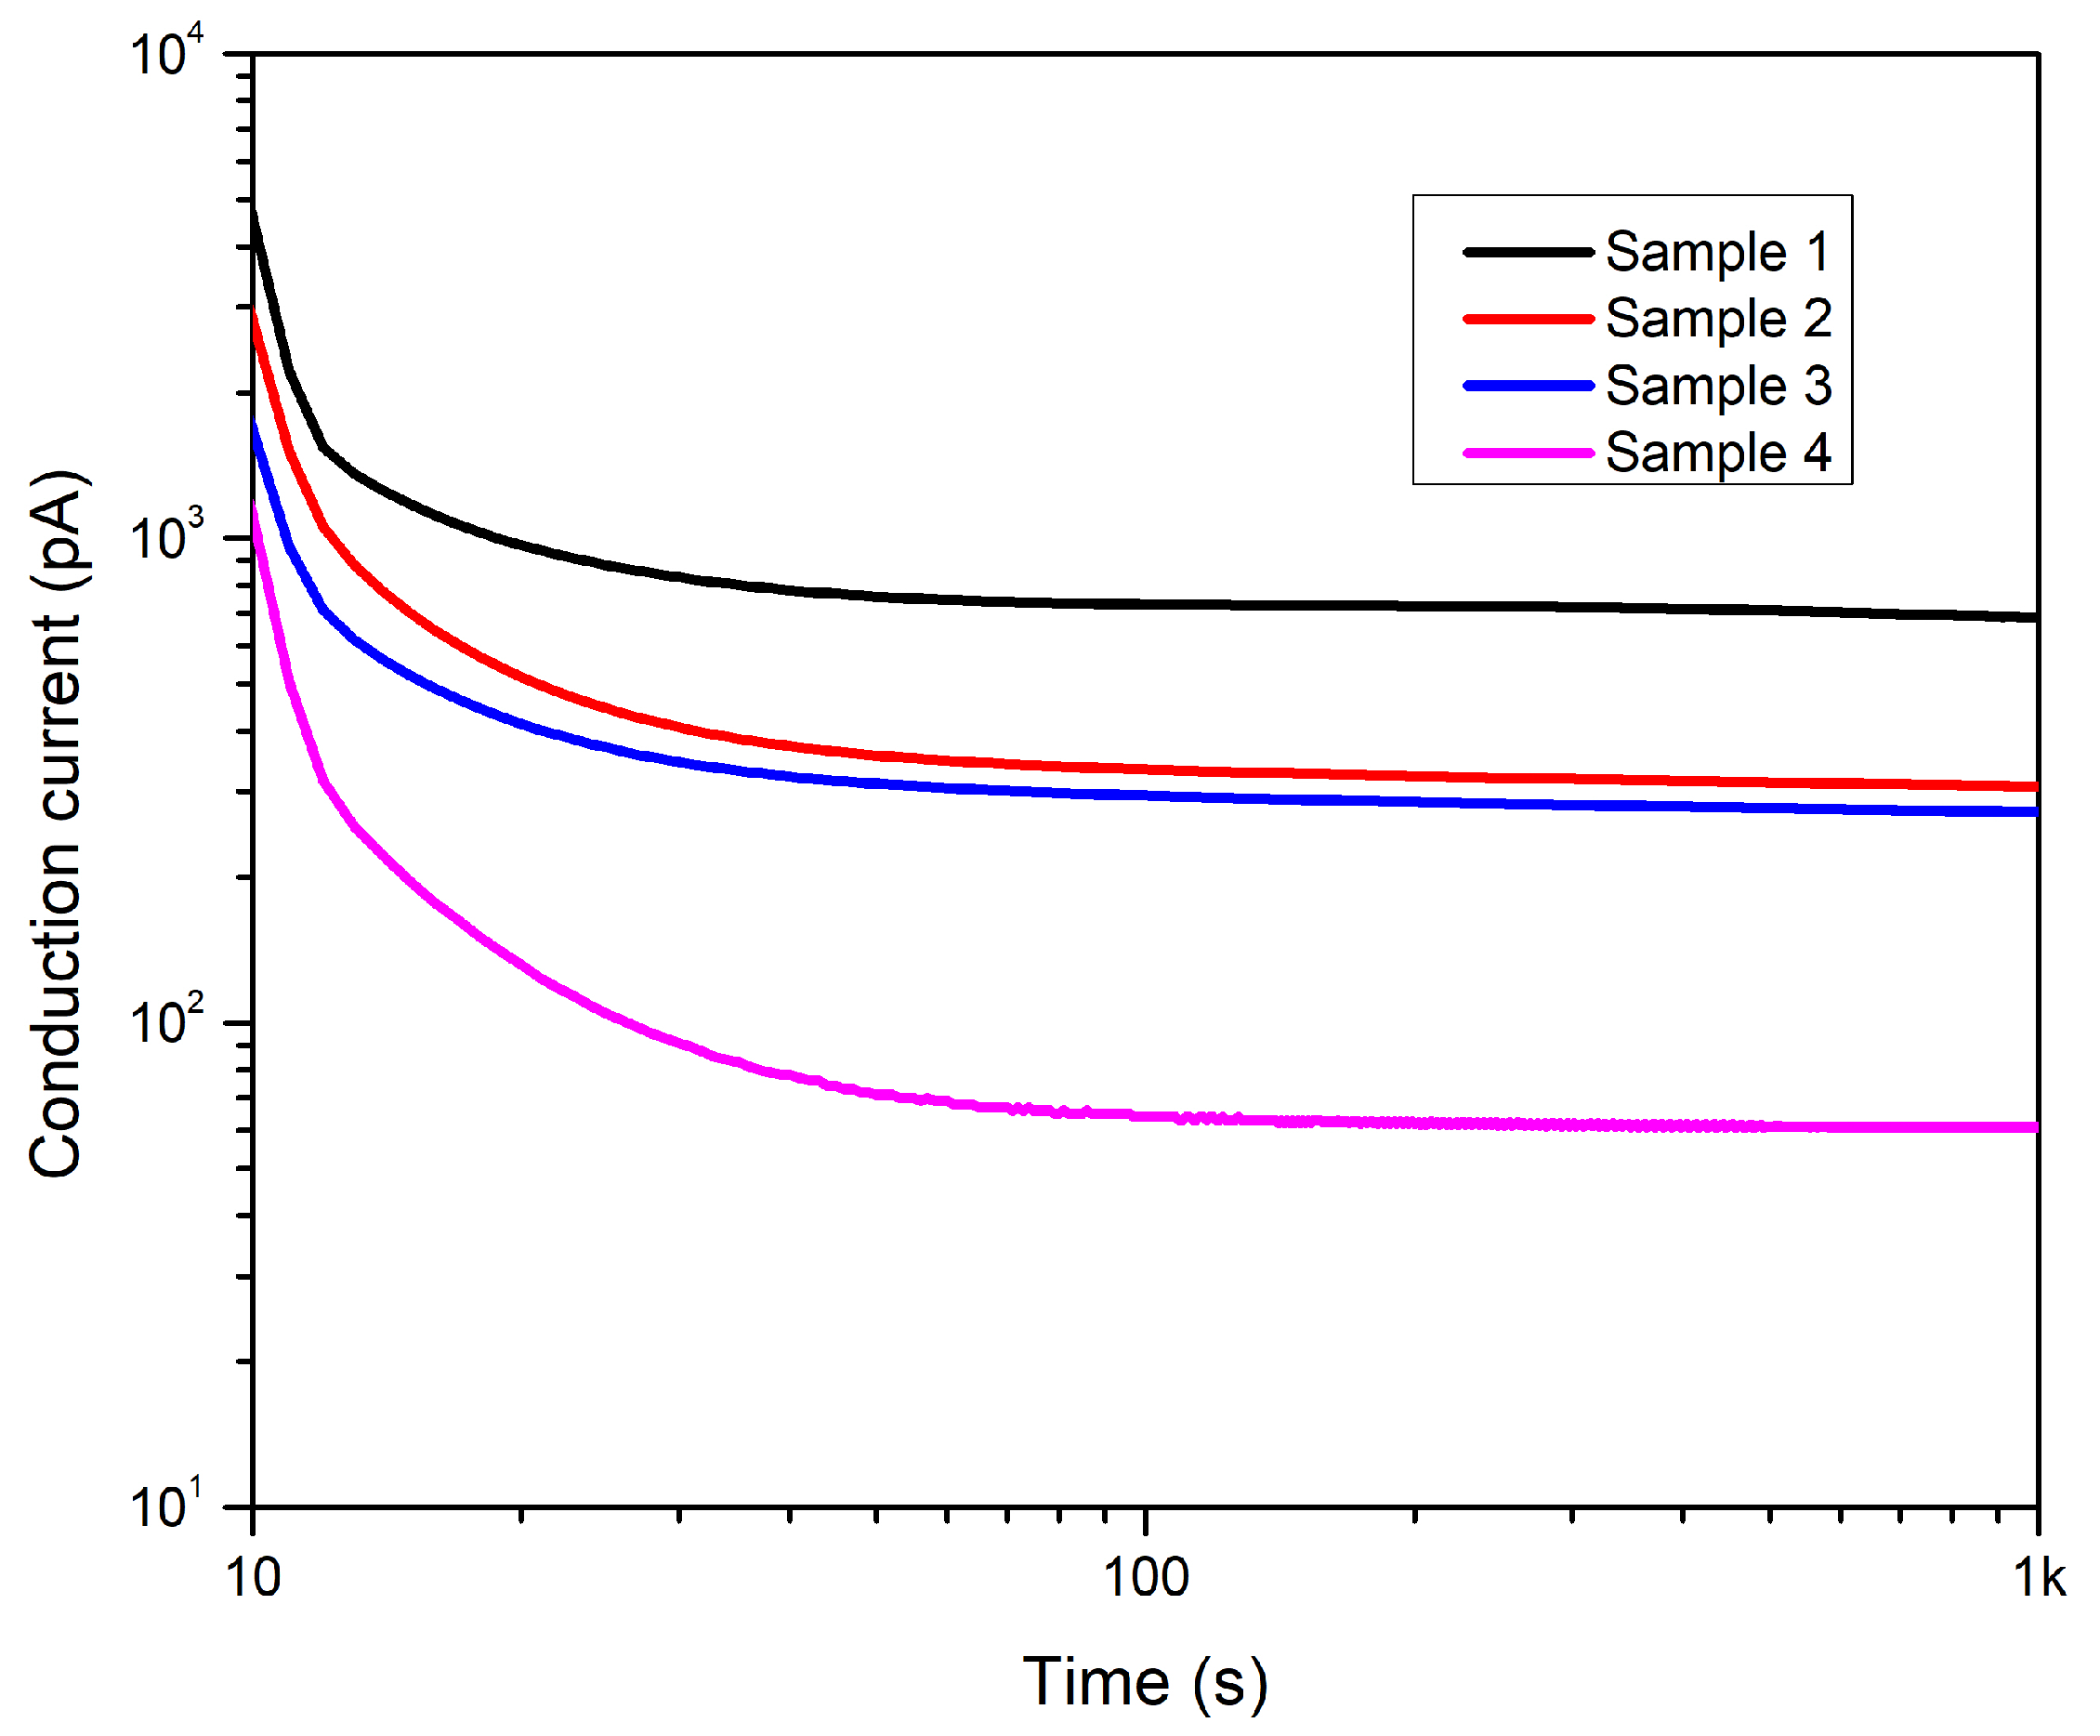
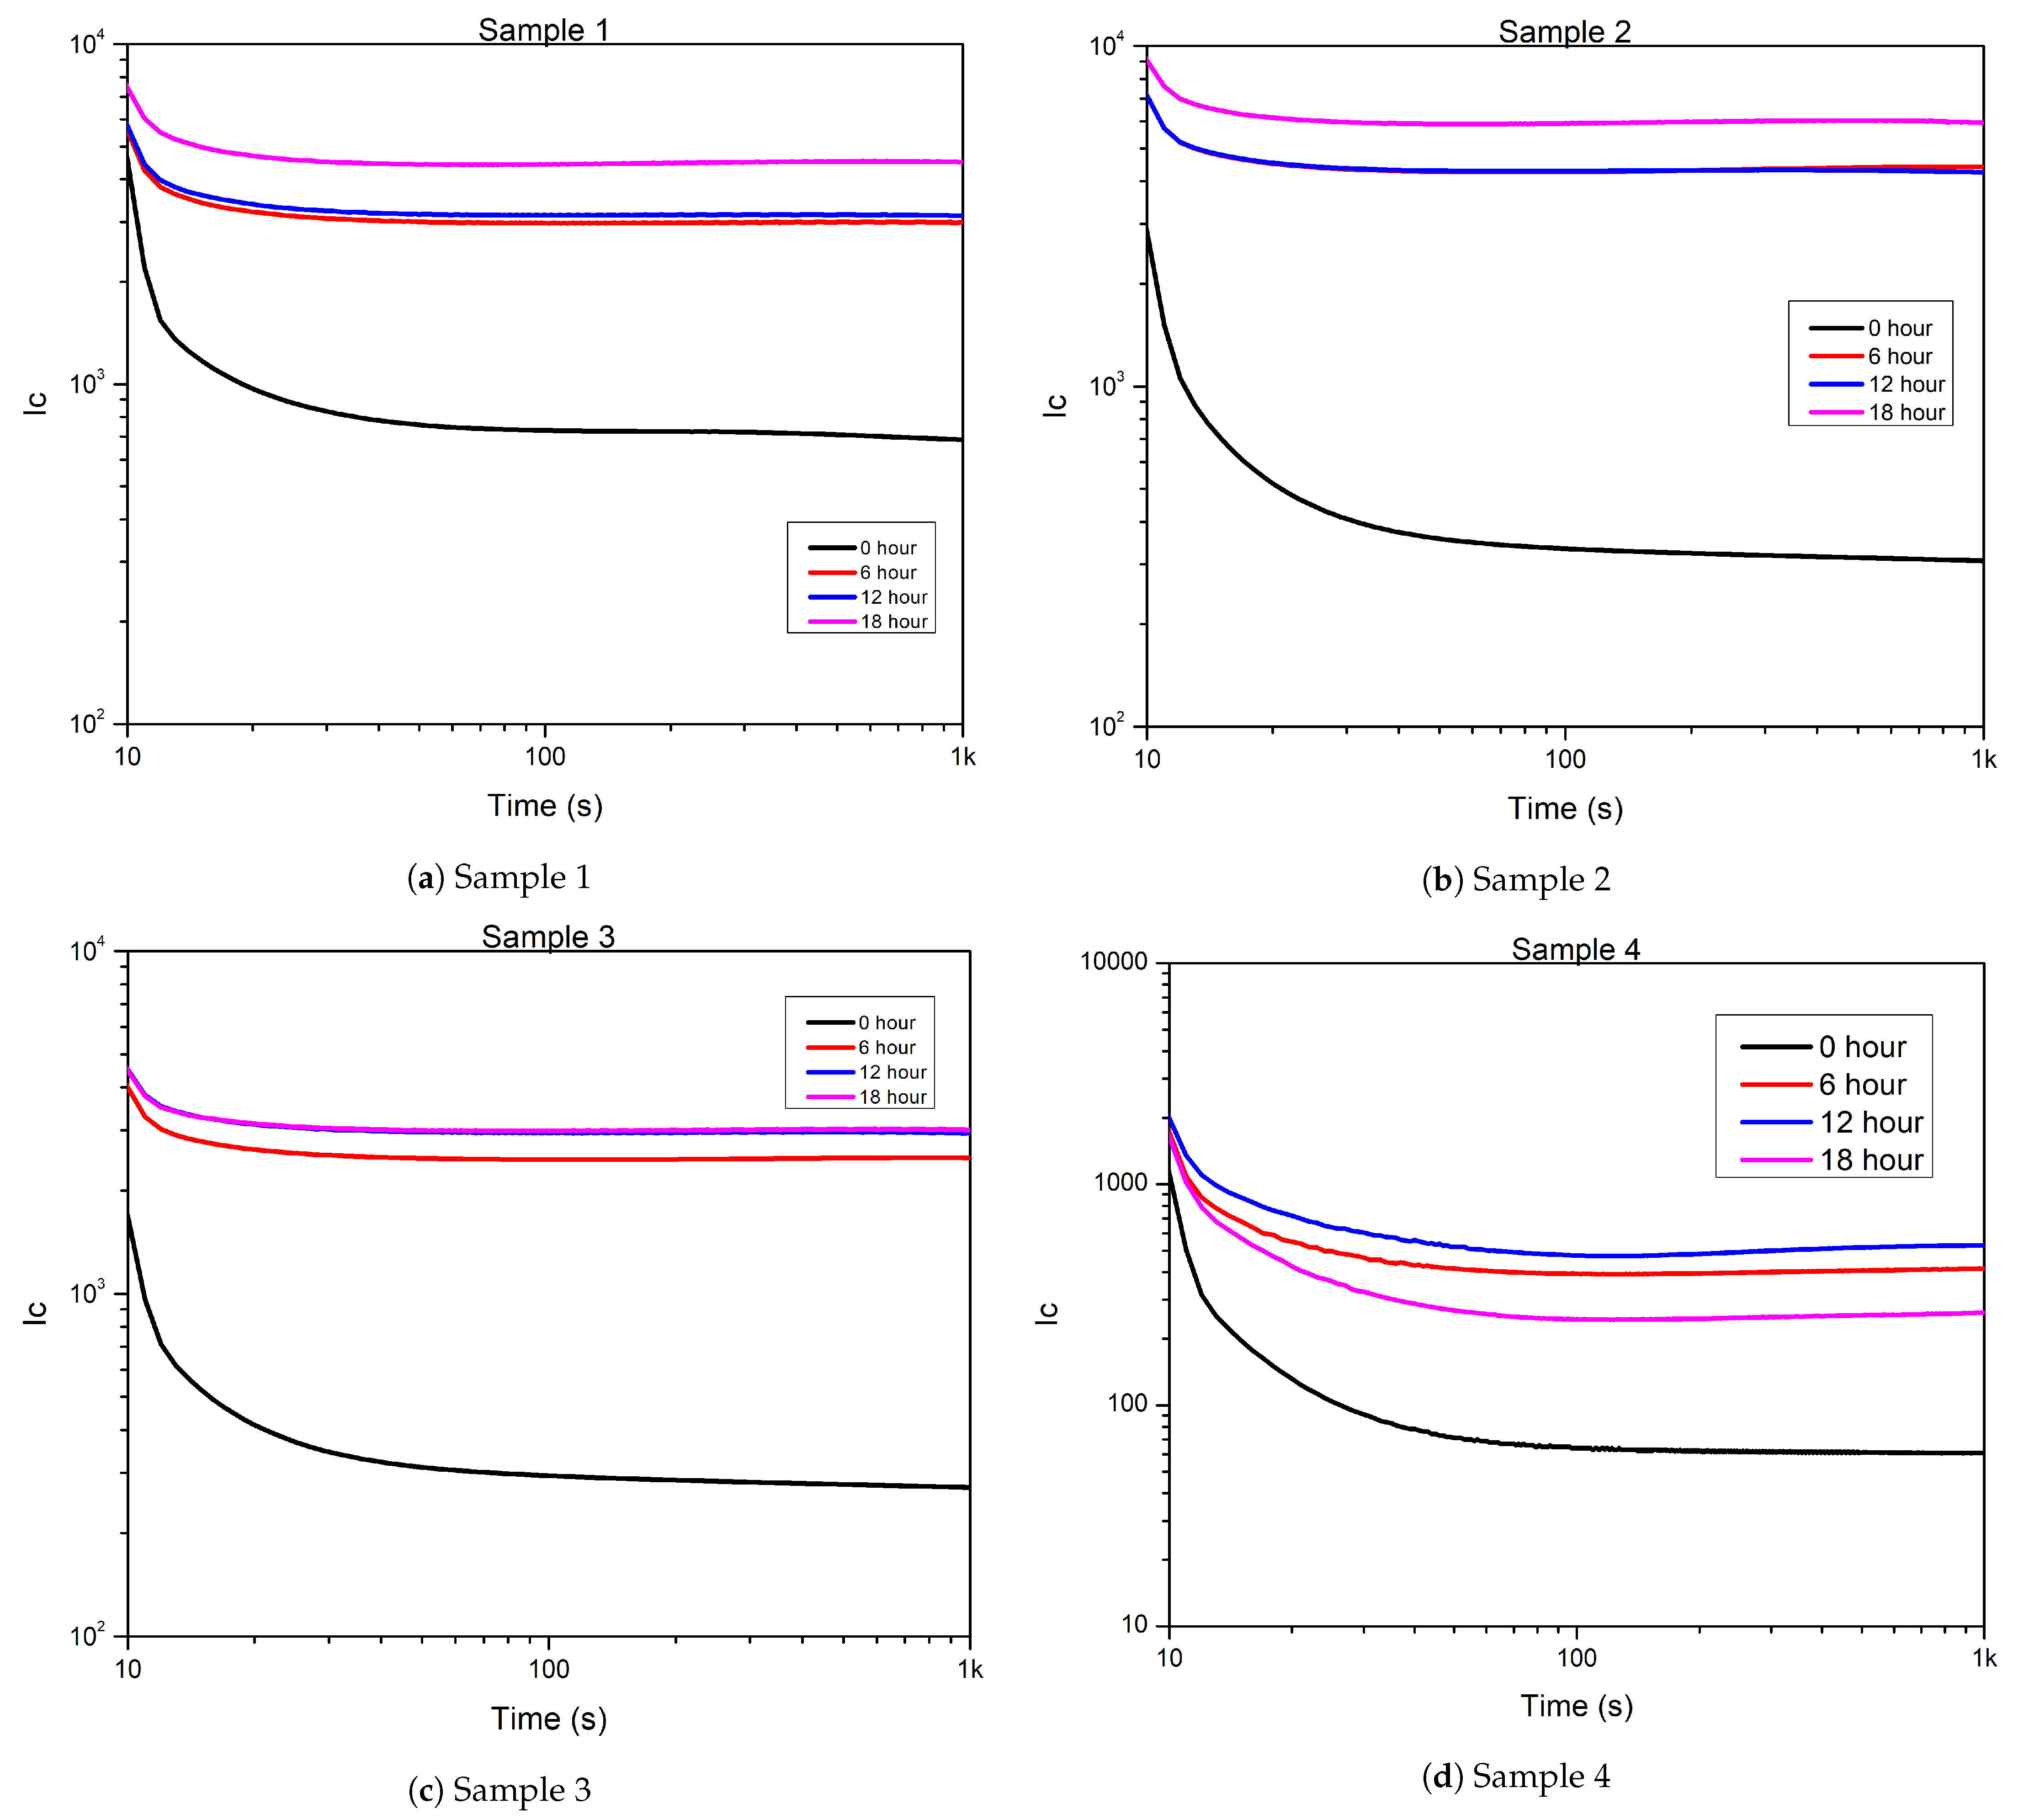
Appendix C. Calculated Conductive Current of Samples

References
- Kruizinga, B.; Wouters, P.; Steennis, E. Fault development on water ingress in damaged underground Low Voltage cables with plastic insulation. In Proceedings of the 2015 IEEE Electrical Insulation Conference (EIC), Seattle, WA, USA, 7–10 June 2015; pp. 309–312. [Google Scholar] [CrossRef]
- Eurostat. Renewable Energy Statistics. Available online: https://ec.europa.eu/eurostat/statistics-explained/index.php?title=Renewable_energy_statistics#Share_of_renewable_energy_more_than_doubled_between_2004_and_2021 (accessed on 14 April 2023).
- Densley, J. Ageing mechanisms and diagnostics for power cables—An overview. IEEE Electr. Insul. Mag. 2001, 17, 14–22. [Google Scholar] [CrossRef]
- Phayomhom, A.; Kveeyarn, K. Heat cycles test set for power cable. In Proceedings of the 2013 10th International Conference on Electrical Engineering/Electronics, Computer, Telecommunications and Information Technology, Krabi, Thailand, 15–17 May 2013; pp. 1–6. [Google Scholar] [CrossRef]
- Mazzanti, G. The Effects of Seasonal Factors on Life and Reliability of High Voltage AC Cables Subjected to Load Cycles. IEEE Trans. Power Deliv. 2020, 35, 2080–2088. [Google Scholar] [CrossRef]
- Lingvay, I.; Stancu, C.; Budrugeac, P.; Cucos, A.; Lingvay, C. Studies concerning the fast ageing by thermal cycling of power cables. In Proceedings of the 2011 7th International Symposium on Advanced Topics in Electrical Engineering (ATEE), Bucharest, Romania, 12–14 May 2011; pp. 1–4. [Google Scholar]
- Muniz, P.R.; Teixeira, J.L.; Santos, N.Q.; Magioni, P.L.Q.; Cani, S.P.N.; Fardin, J.F. Prospects of life estimation of low voltage electrical cables insulated by PVC by emissivity measurement. IEEE Trans. Dielectr. Electr. Insul. 2017, 24, 3951–3958. [Google Scholar] [CrossRef]
- Bowler, N.; Liu, S. Aging mechanisms and monitoring of cable polymers. Int. J. Progn. Health Manag. 2015, 6. [Google Scholar] [CrossRef]
- Jakubowicz, I.; Yarahmadi, N.; Gevert, T. Effects of accelerated and natural ageing on plasticized polyvinyl chloride (PVC). Polym. Degrad. Stab. 1999, 66, 415–421. [Google Scholar] [CrossRef]
- Wilson, A.S. Plasticisers: Selection, Applications and Implications; iSmithers Rapra Publishing: Shawbury, UK, 1996; Volume 88. [Google Scholar]
- Gumargalieva, K.; Ivanov, V.; Zaikov, G.; Moiseev, J.V.; Pokholok, T. Problems of ageing and stabilization of poly (vinyl chloride). Polym. Degrad. Stab. 1996, 52, 73–79. [Google Scholar] [CrossRef]
- Cheremisinoff, N.P. P. In Condensed Encyclopedia of Polymer Engineering Terms; Cheremisinoff, N.P., Ed.; Butterworth-Heinemann: Boston, MA, USA, 2001; pp. 200–255. [Google Scholar] [CrossRef]
- Csányi, G.M.; Bal, S.; Tamus, Z.A. Dielectric Measurement Based Deducted Quantities to Track Repetitive, Short-Term Thermal Aging of Polyvinyl Chloride (PVC) Cable Insulation. Polymers 2020, 12, 2809. [Google Scholar] [CrossRef]
- Nedjar, M.; Beroual, A.; Bournane, M. Thermal aging of polyvinyl chloride. In Proceedings of the CEIDP’05. 2005 Annual Report Conference on Electrical Insulation and Dielectric Phenomena, Piscataway, NJ, USA, 16–19 October 2005; pp. 261–264. [Google Scholar] [CrossRef]
- Wei, X.F.; Linde, E.; Hedenqvist, M.S. Plasticiser loss from plastic or rubber products through diffusion and evaporation. NPJ Mater. Degrad. 2019, 3, 18. [Google Scholar] [CrossRef]
- Nedjar, M.; Béroual, A.; Boubakeur, A. Influence of thermal aging on the electrical properties of poly (vinyl chloride). J. Appl. Polym. Sci. 2006, 102, 4728–4733. [Google Scholar] [CrossRef]
- Konečná, Z. Temperature dependence of electrical parameters of coaxial cables. In Proceedings of the 2016 Conference on Diagnostics in Electrical Engineering (Diagnostika), Pilsen, Czech Republic, 6–8 September 2016; pp. 1–4. [Google Scholar] [CrossRef]
- Csányi, G.M.; Tamus, Z.Á.; Varga, Á. Impact of distributed generation on the thermal ageing of low voltage distribution cables. In Proceedings of the Doctoral Conference on Computing, Electrical and Industrial Systems, Caparica, Portugal, 3–5 May 2017; pp. 251–258. [Google Scholar]
- Csányi, G.M.; Tamus, Z.Á.; Kordás, P. Effect of Enhancing Distribution Grid Resilience on Low Voltage Cable Ageing. In Proceedings of the Doctoral Conference on Computing, Electrical and Industrial Systems, Costa de Caparica, Portugal, 2–4 May 2018; pp. 300–307. [Google Scholar]
- Suraci, S.V.; Fabiani, D.; Xu, A.; Roland, S.; Colin, X. Ageing Assessment of XLPE LV Cables for Nuclear Applications Through Physico-Chemical and Electrical Measurements. IEEE Access 2020, 8, 27086–27096. [Google Scholar] [CrossRef]
- Afia, R.S.A.; Mustafa, E.; Tamus, Z.A. Aging Mechanisms and Non-Destructive Aging Indicators of XLPE/CSPE Unshielded LV Nuclear Power Cables Subjected to Simultaneous Radiation-Mechanical Aging. Polymers 2021, 13, 3033. [Google Scholar] [CrossRef] [PubMed]
- Quennehen, P.; Royaud, I.; Seytre, G.; Gain, O.; Rain, P.; Espilit, T.; François, S. Determination of the aging mechanism of single core cables with PVC insulation. Polym. Degrad. Stab. 2015, 119, 96–104. [Google Scholar] [CrossRef]
- Quennehen, P.; Seytre, G.; Royaud, I.; Gain, O.; Rain, P.; Espilit, T. Dielectric and Physicochemical Behavior of Aged PVC Insulated Cables. In Proceedings of the 2012 Annual Report Conference on Electrical Insulation and Dielectric Phenomena, Montreal, QC, Canada, 14–17 October 2012. [Google Scholar] [CrossRef]
- Höning, N.; De Jong, E.; Bloemhof, G.; Poutre, H.L. Thermal behaviour of low voltage cables in smart grid—Related environments. In Proceedings of the IEEE PES Innovative Smart Grid Technologies, Europe, Istanbul, Turkey, 12–15 October 2014; pp. 1–6. [Google Scholar] [CrossRef]
- Bal, S.; Tamus, Z.A. Investigation of Effects of Thermal Ageing on Dielectric Properties of Low Voltage Cable Samples by using Dielectric Response Analyzer. In Proceedings of the 2022 International Conference on Diagnostics in Electrical Engineering (Diagnostika), Pilsen, Czech Republic, 6–8 September 2022; pp. 1–6. [Google Scholar] [CrossRef]
- Afia, R.S.; Mustafa, E.; Ádám Tamus, Z. Dielectric Spectroscopy of Low Voltage Nuclear Power Cables Under Simultaneous Thermal and Mechanical Stresses. Energy Rep. 2020, 6, 662–667. [Google Scholar] [CrossRef]
- Afia, R.S.; Mustafa, E.; Ádám Tamus, Z. Condition Monitoring of Photovoltaic Cables Based Cross-Linked Polyolefin Insulation Under Combined Accelerated Aging Stresses: Electrical and Mechanical Assessment. Energy Rep. 2022, 8, 1038–1049. [Google Scholar] [CrossRef]
- Afia, R.S.A.; Mustafa, E.; Tamus, Z.A. Condition Assessment of XLPO Insulated Photovoltaic Cables Based on Polarisation/Depolarisation Current. In Proceedings of the 2020 International Conference on Diagnostics in Electrical Engineering (Diagnostika), Pilsen, Czech Republic, 1–4 September 2020; pp. 1–4. [Google Scholar] [CrossRef]
- Zaengl, W. Dielectric spectroscopy in time and frequency domain for HV power equipment. I. Theoretical considerations. IEEE Electr. Insul. Mag. 2003, 19, 5–19. [Google Scholar] [CrossRef]
- Morsalin, S.; Phung, T.B.; Danikas, M.; Mawad, D. Diagnostic challenges in dielectric loss assessment and interpretation: A review. IET Sci. Meas. Technol. 2019, 13, 767–782. [Google Scholar] [CrossRef]
- Fofana, I.; Hadjadj, Y. Electrical-Based Diagnostic Techniques for Assessing Insulation Condition in Aged Transformers. Energies 2016, 9, 679. [Google Scholar] [CrossRef]
- IEC 60502-1; Power cables with extruded insulation and their accessories for rated voltages from 1 kV (Um = 1.2 kV) up to 30 kV (Um = 36 kV)—Part 1: Cables for rated voltages of 1 kV (Um = 1.2 kV) and 3 kV (Um = 3.6 kV). International Electrotechnical Commission: Geneva, Switzerland, 2004.
- Mustafa, E.; Afia, R.S.; Tamus, Z.Á. Dielectric loss and extended voltage response measurements for low-voltage power cables used in nuclear power plant: Potential methods for aging detection due to thermal stress. Electr. Eng. 2021, 103, 899–908. [Google Scholar] [CrossRef]
- Bal, S.; Tamus, Z.A. Investigation of Effects of Short-term Thermal Stress on PVC Insulated Low Voltage Distribution Cables. Period. Polytech. Electr. Eng. Comput. Sci. 2021, 65, 167–173. [Google Scholar] [CrossRef]
- Tamus, Z.A. Practical consideration of mechanical measurements in cable diagnostics. In Proceedings of the 2011 Electrical Insulation Conference (EIC), Annapolis, MD, USA, 5–8 June 2011; pp. 359–363. [Google Scholar] [CrossRef]
- Fothergill, J.C.; Dodd, S.J.; Dissado, L.A.; Liu, T.; Nilsson, U.H. The measurement of very low conductivity and dielectric loss in XLPE cables: A possible method to detect degradation due to thermal aging. IEEE Trans. Dielectr. Electr. Insul. 2011, 18, 1544–1553. [Google Scholar] [CrossRef]
- Koch, M.; Raetzke, S.; Krueger, M. Moisture diagnostics of power transformers by a fast and reliable dielectric response method. In Proceedings of the 2010 IEEE International Symposium on Electrical Insulation, San Diego, CA, USA, 6–9 June 2010; pp. 1–5. [Google Scholar] [CrossRef]
- Afia, R.S.A.; Mustafa, E.; Tamus, Z.Á. Comparison of Mechanical and Low-Frequency Dielectric Properties of Thermally and Thermo-Mechanically Aged Low Voltage CSPE/XLPE Nuclear Power Plant Cables. Electronics 2021, 10, 2728. [Google Scholar] [CrossRef]
- Mustafa, E.; Afia, R.S.A.; Tamus, Z.A. Investigation of Electrical and Mechanical Properties of Low Voltage Power Cables under Thermal Stress. In Proceedings of the 2020 International Conference on Diagnostics in Electrical Engineering (Diagnostika), Pilsen, Czech Republic, 1–4 September 2020; pp. 1–4. [Google Scholar] [CrossRef]
- ASTM D2240-05; Standard Test Method for Rubber Property—Durometer Hardness. American Society for Testing and Materials: Philadelphia, PA, USA, 2000.
- Raza, M.H.; Butt, S.U.; Khattak, A.; Alahmadi, A.A. Investigation of Ramped Compression Effect on the Dielectric Properties of Silicone Rubber Composites for the Coating of High-Voltage Insulation. Materials 2022, 15, 2343. [Google Scholar] [CrossRef] [PubMed]
- Iqbal, M.B.; Khattak, A.; Ali, A.; Raza, M.H.; Ullah, N.; Alahmadi, A.A.; Khan, A. Influence of Ramped Compression on the Dielectric Behavior of the High-Voltage Epoxy Composites. Polymers 2021, 13, 3150. [Google Scholar] [CrossRef]
- Linde, E.; Gedde, U. Plasticizer migration from PVC cable insulation—The challenges of extrapolation methods. Polym. Degrad. Stab. 2014, 101, 24–31. [Google Scholar] [CrossRef]
- Starnes, W.H. Structural and mechanistic aspects of the thermal degradation of poly(vinyl chloride). Prog. Polym. Sci. 2002, 27, 2133–2170. [Google Scholar] [CrossRef]
- Zhu, M.X.; Li, J.C.; Song, H.G.; Chen, J.M.; Zhang, H.Y. Determination of trap energy in polyethylene with different aging status by molecular dynamics and density function theory. IEEE Trans. Dielectr. Electr. Insul. 2019, 26, 1823–1830. [Google Scholar] [CrossRef]
- Huzayyin, A.; Boggs, S.; Ramprasad, R. Density functional analysis of chemical impurities in dielectric polyethylene. IEEE Trans. Dielectr. Electr. Insul. 2010, 17, 926–930. [Google Scholar] [CrossRef]
- Kryshtob, V.I.; Rasmagin, S.I.; Vlasova, T.V. On Improving the Running Ability of Cables with Polymer Insulation. Russ. Electr. Eng. 2018, 89, 385–387. [Google Scholar] [CrossRef]
- Beneš, M.; Milanov, N.; Matuschek, G.; Kettrup, A.; Plaček, V.; Balek, V. Thermal degradation of PVC cable insulation studied by simultaneous TG-FTIR and TG-EGA methods. J. Therm. Anal. Calorim. 2004, 78, 621–630. [Google Scholar] [CrossRef]
- Wypych, G. 4-PRINCIPLES OF THERMAL DEGRADATION. In PVC Degradation and Stabilization (Third Edition), 3rd ed.; Wypych, G., Ed.; ChemTec Publishing: Boston, MA, USA, 2015; pp. 79–165. [Google Scholar] [CrossRef]
- Bazilchuk, M.; Sumigawa, T.; Kitamura, T.; Zhang, Z.; Kristiansen, H.; He, J. Contact area measurement of micron-sized metal-coated polymer particles under compression. Int. J. Mech. Sci. 2020, 165, 105214. [Google Scholar] [CrossRef]
- Ito, M.; Nagai, K. Analysis of degradation mechanism of plasticized PVC under artificial aging conditions. Polym. Degrad. Stab. 2007, 92, 260–270. [Google Scholar] [CrossRef]
- Audouin, L.; Dalle, B.; Metzger, G.; Verdu, J. Thermal aging of plasticized PVC. II. Effect of plasticizer loss on electrical and mechanical properties. J. Appl. Polym. Sci. 1992, 45, 2097–2103. [Google Scholar] [CrossRef]


| Cable Layer / Sample | Sample 1 | Sample 2 | Sample 3 | Sample 4 |
|---|---|---|---|---|
| Conductor | ✓ | ✓ | ✓ | ✓ |
| PVC Core Insulation | ✓ | ✓ | ✓ | ✓ |
| PVC Tape | ✓ | ✓ | ✓ | ✕ |
| Aluminium Tape Screen | ✓ | ✓ | ✕ | ✕ |
| PVC Jacket | ✓ | ✕ | ✕ | ✕ |
| Sample 1 | Sample 2 | Sample 3 | Sample 4 | |
|---|---|---|---|---|
| Before | 686.3961 | 307.2256 | 272.1701 | 60.8 |
| After | 4501.6 | 5950.7 | 3007.5 | 262.12 |
| Ratio (After/Before) | 6.55 | 19.37 | 11.05 | 4.31 |
| Sample 1 | Sample 2 | Sample 3 | |
|---|---|---|---|
| Before | 37.09 for all samples | ||
| After | 33.02 | 31.83 | 32.90 |
| Ratio (After/Before) | 0.890 | 0.858 | 0.887 |
Disclaimer/Publisher’s Note: The statements, opinions and data contained in all publications are solely those of the individual author(s) and contributor(s) and not of MDPI and/or the editor(s). MDPI and/or the editor(s) disclaim responsibility for any injury to people or property resulting from any ideas, methods, instructions or products referred to in the content. |
© 2023 by the authors. Licensee MDPI, Basel, Switzerland. This article is an open access article distributed under the terms and conditions of the Creative Commons Attribution (CC BY) license (https://creativecommons.org/licenses/by/4.0/).
Share and Cite
Bal, S.; Tamus, Z.Á. Investigation of the Structural Dependence of the Cyclical Thermal Aging of Low-Voltage PVC-Insulated Cables. Symmetry 2023, 15, 1186. https://doi.org/10.3390/sym15061186
Bal S, Tamus ZÁ. Investigation of the Structural Dependence of the Cyclical Thermal Aging of Low-Voltage PVC-Insulated Cables. Symmetry. 2023; 15(6):1186. https://doi.org/10.3390/sym15061186
Chicago/Turabian StyleBal, Semih, and Zoltán Ádám Tamus. 2023. "Investigation of the Structural Dependence of the Cyclical Thermal Aging of Low-Voltage PVC-Insulated Cables" Symmetry 15, no. 6: 1186. https://doi.org/10.3390/sym15061186
APA StyleBal, S., & Tamus, Z. Á. (2023). Investigation of the Structural Dependence of the Cyclical Thermal Aging of Low-Voltage PVC-Insulated Cables. Symmetry, 15(6), 1186. https://doi.org/10.3390/sym15061186