Article

Fluctuating Asymmetry as a Measure of Stress in Natural Populations of Woody Plants: Influence of Ecological and Geographical Factors on Developmental Stability

by
Elena Shadrina
1,*,
Victoria Soldatova
2 and
Nina Turmukhametova
3
1
Institute for Biological Problems of Cryolithozone, Federal Research Center “Yakutian Scientific Center SB RAS”, Siberian Branch of Russian Academy of Sciences, Lenin Av. 41, 677980 Yakutsk, Russia
2
Institute of Natural Sciences, North-Eastern Federal University, Belinsky Str. 58, 677027 Yakutsk, Russia
3
Institute of Natural Sciences and Pharmacy, Mari State University, Lenin Square 1, 424000 Yoshkar-Ola, Russia
*
Author to whom correspondence should be addressed.
Symmetry 2023, 15(3), 700; https://doi.org/10.3390/sym15030700
Submission received: 6 January 2023 / Revised: 15 February 2023 / Accepted: 16 February 2023 / Published: 10 March 2023

Abstract

:
Fluctuating asymmetry is a sensitive indicator of favorable conditions during the period of individual development. The influence of climatic factors, biotopic conditions, latitude, altitude, and age of plants from the natural populations of the silver birch Betula pendula Roth was analyzed. The material consisted of 13,000 leaves of the silver birch from 11 regions of north-eastern Siberia. The influence of 23 climatic factors and six integrated coefficients characterizing the general suitability of the climate, as well as summer, winter, spring, and autumn was analyzed. The developmental stability of woody plants and, consequently, the level of the FA of the lamina in natural biotopes can vary in a wide range. We found that climatic factors, mainly conditions in the warm season, have a significant impact. We also noted the influence of the age, biotope, and light conditions. For Betula pendula, an increase in FA was registered on the ecological periphery of its range, i.e., on the edge of the forest belt in the north and in the mountains. The data obtained demonstrate the high influence of natural stress-inducing factors on development stability in plants.

1. Introduction

Fluctuating asymmetry (FA) refers to minor differences between the left and right sides of the body or organs in bilaterally symmetrical organisms; its manifestations are nondirectional, they do not affect the genotype of the individual and its viability, and its variability is manifested at intra-individual, intra-, and inter-population levels. These deviations from an ideally symmetrical state originate in the early stages of ontogeny, so it can be argued that they reflect the favorable or unfavorable conditions in which the development took place. Many authors believe that FA can be considered one of the criteria of developmental stability, since it has been observed to increase with the intensification of negative factors of environmental and genetic nature [1,2,3,4,5].
There are many studies devoted to FA, but there are different opinions about the causes of the variability and prospects of using this phenomenon to analyze the causes of disturbances in the homeostasis of ontogeny. Studies are abundant on the assessment of the impact of anthropogenic factors on developmental stability and, as its reflection, the manifestations of FA. Different authors have shown that an increase in FA is observed in different structures and organisms of different trophic levels in territories with increased background radiation [6,7,8,9], cities and towns, areas affected by industrial and agricultural enterprises, and agroecosystems [10,11,12,13,14,15,16,17,18,19,20,21,22]. Plants, due to their sedentary lifestyle and multiple morphological structures, are a convenient research object for studying developmental stability; thus, they have a large number of works devoted to them [13,22,23,24,25,26,27,28,29,30,31,32,33,34,35,36,37,38,39]. At the same time, some authors argue that the relationship between FA as an indicator of developmental stability with environmental impacts is absent or doubtful [40,41,42,43,44], but there are enough studies whose results indicate the existence of such a relationship [12,13,14,15,16,17,22,25,27,28,33,34,35,36,37,45,46]. In natural conditions, we are dealing with a whole complex of environmental factors, so it is difficult to isolate those of first importance, as well as measure the stress-inducing effect, which can be caused by climatic conditions, interspecific interactions, pests, and parasites [36,37,45,47,48,49,50,51,52,53,54,55,56]. Moreover, some data indicate that developmental instability increases with genetic stress [3,5,46,57,58], which creates an additional load on the organism; this factor makes it hard to assess the impact that environmental factors proper have on FA manifestations.
We suggest that the analysis of the causes for variation in FA level in the natural populations of plants and animals is of interest for insight into the mechanisms of adaptation of species to the pessimum zone and for predicting possible reactions to the combined effect of adverse factors of different origin. The goal of our research was to study the relationship between FA (as a measure of developmental stability) and various natural factors by the example of woody plants.

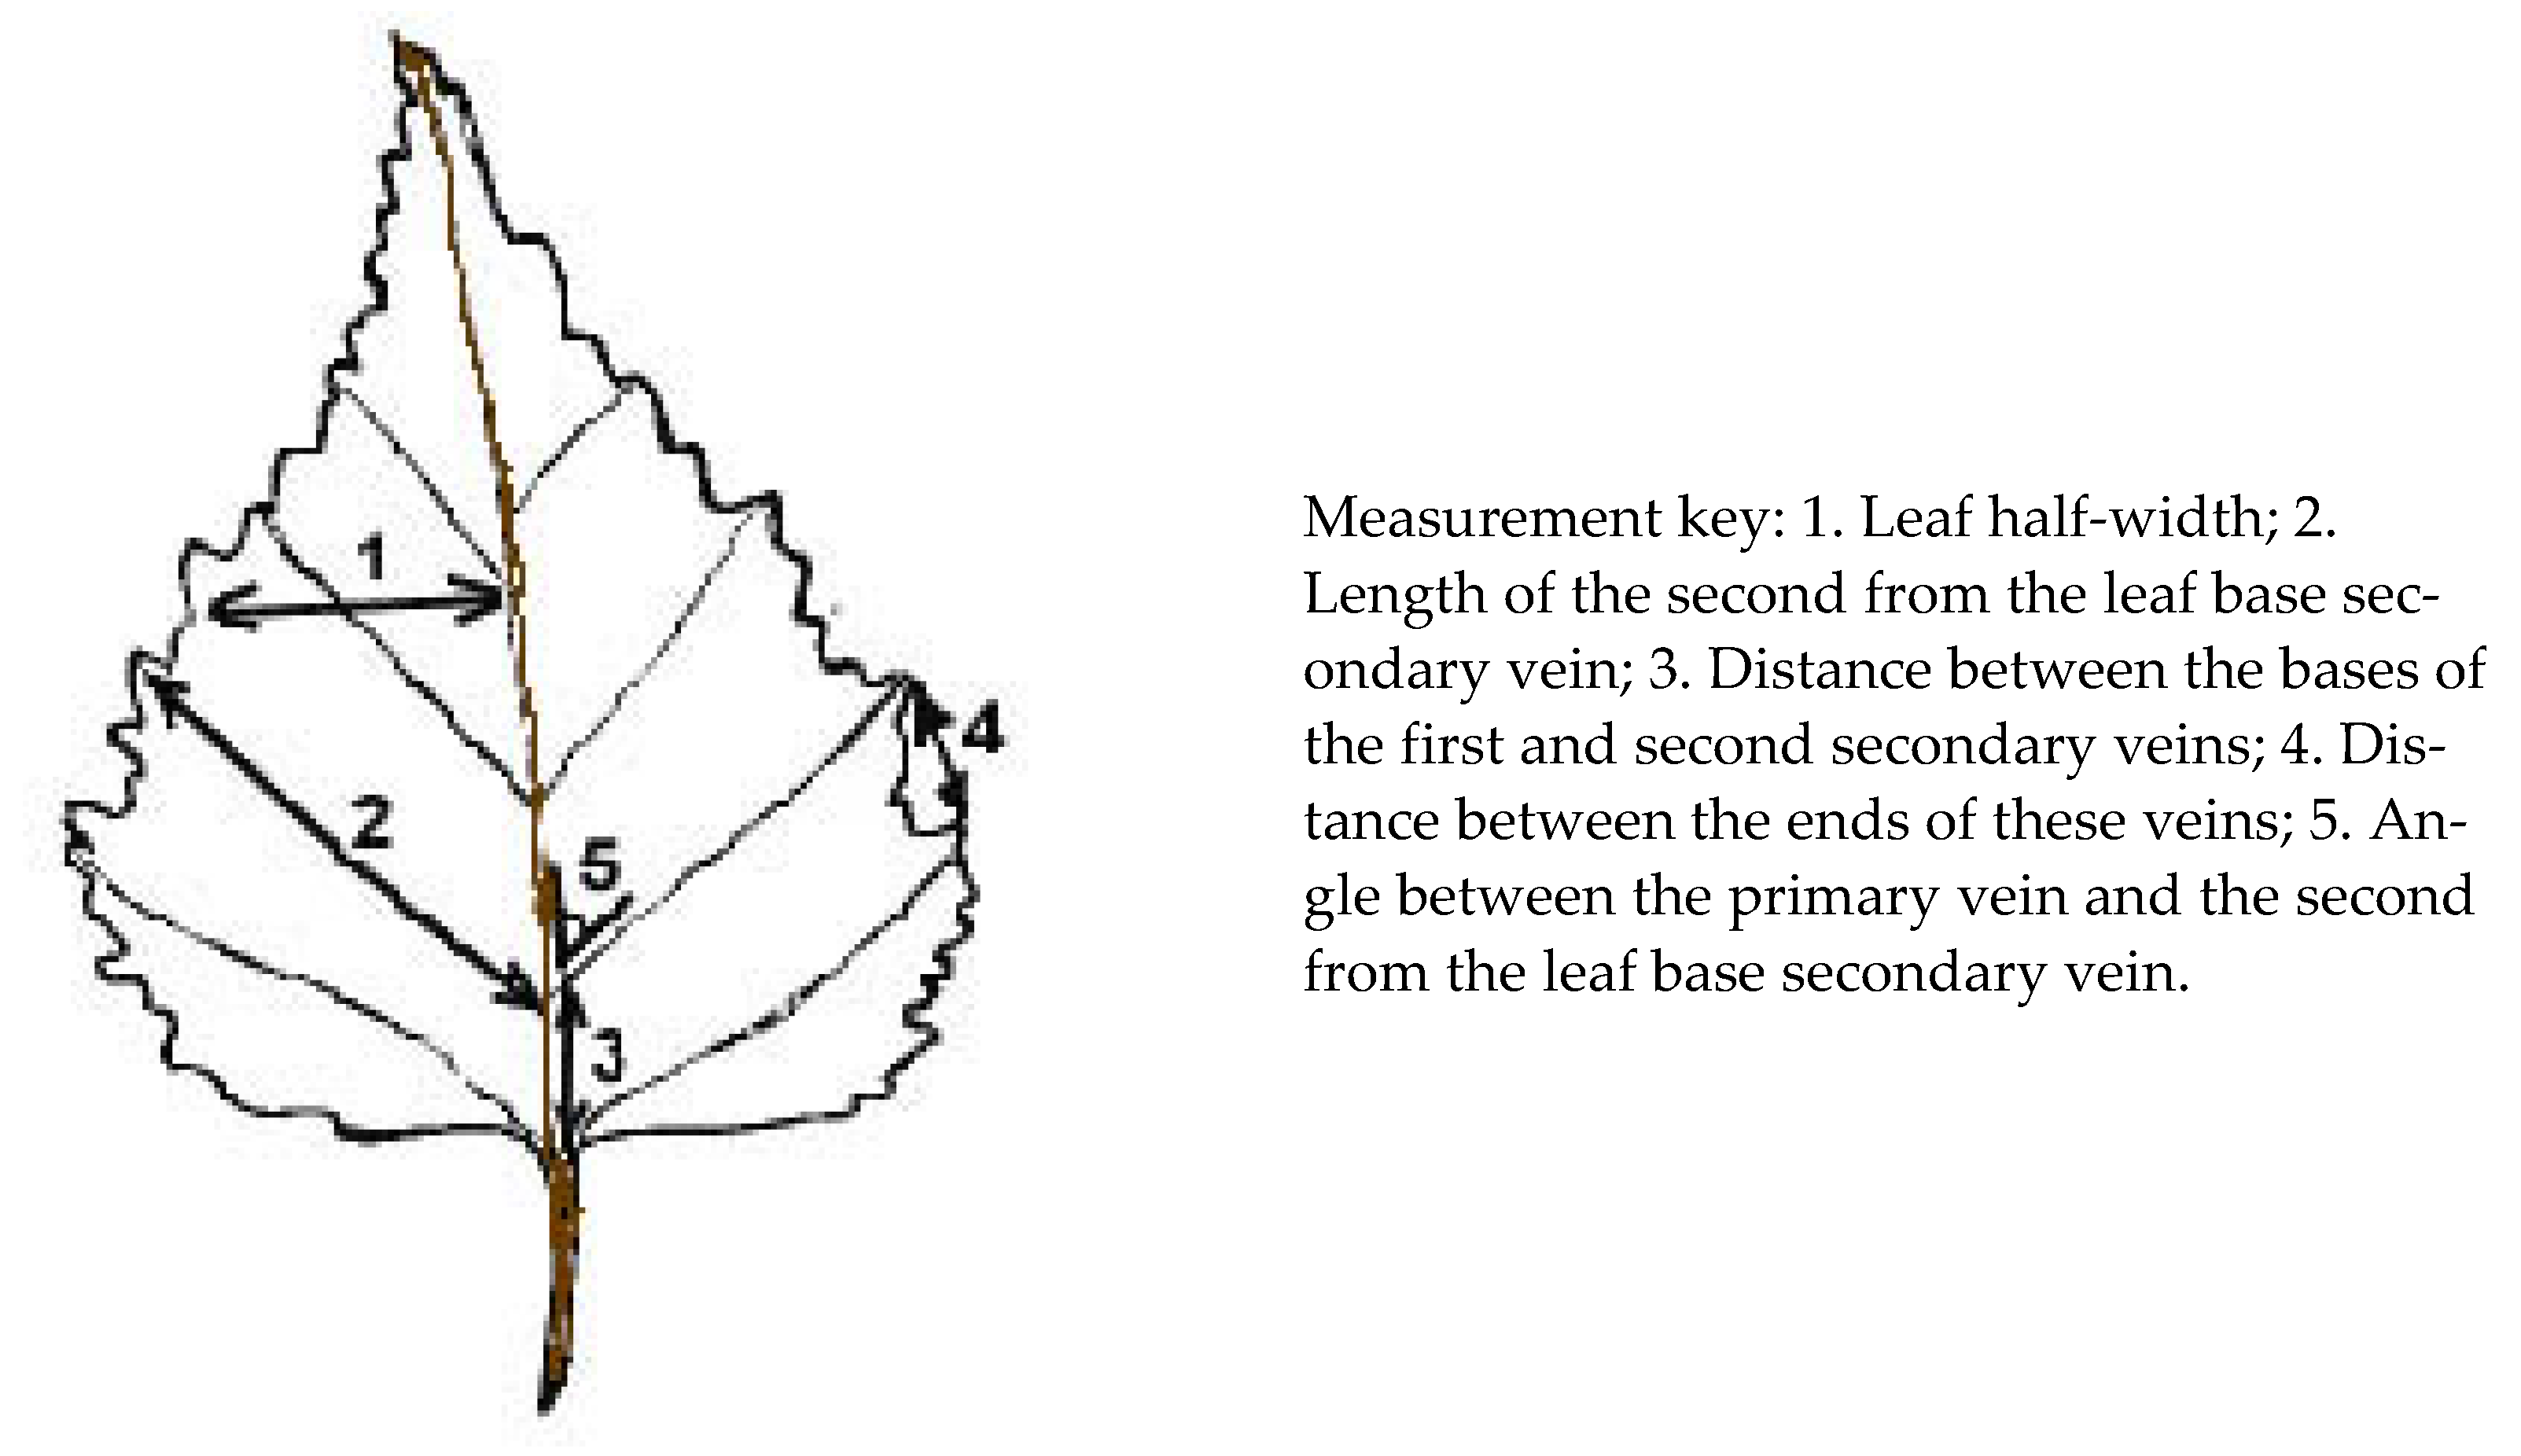
2. Materials and Methods

Object of the Study: We studied the silver birch (Betula pendula Roth). This species has Holarctic distribution and a broad range that covers the forest zone, including both the subzone of deciduous forests and the taiga, as well as a part of the forest–steppe zone in the south and almost to the edge of the forest vegetation in the north [59,60]. The range of the species in Yakutia extends to 66.5° N [61]. The wide distribution of B. pendula is ensured by its undemanding nature as to climatic and soil conditions; this indicates high ecological plasticity in this species [62,63], but it does not mean that the growth conditions are equally favorable throughout the range.
Region of the Study: Material for this study was collected in natural biopes of several regions of Yakutia (Figure 1). Yakutia is a vast region in the north-east of Russia characterized by a sharply continental climate. The region is characterized by a very cold and long winter that lasts at least 6–7 months. In the southern and southwestern regions, the absolute minimum of winter temperatures ranges from −58 to −62 °C, whereas in central regions, it is −66 °C [64]. Summer is short and hot; the warmest month is July [64]. Sharply continental climate causes great weather differences: the amplitude in monthly temperatures in the internal areas of Yakutia can reach 55–64 °C, and the amplitude between the absolute minimum and maximum is the greatest on Earth, more than 100 °C [64]. The frost-free period in Central Yakutia lasts up to 95–100 days, and in the tundra and forest–tundra, it is less than 2 months [64]. The annual precipitation figures are low, and about 75–80% of it falls between April and October, with the total annual precipitation being higher in southern and southwestern Yakutia [64]. The low precipitation is balanced out by the high amount of water bodies on this territory: there are more than 700,000 rivers that are more than 10 km in length, their total annual runoff is 800 km3, and the average density of the river network is 0.4–0.5 km/km2 [65]. In winter, the weather is governed by a stable anticyclone with low air temperatures, low wind speed, little snow, and dry air [65]. Spring stretches over only two months, April and May [65], while autumn spans September and October. October is when negative temperatures become dominant, so sometimes it is grouped with the winter months [65], but a lasting snow cover sets in only by mid-October [65], so we regarded October as an autumn month. Throughout the territory of the region, except its extreme south-west, there is permafrost, which aggravates the adverse climate effects.
We collected the material in the taiga zone, where the main stand-forming species is the larch. Pure birch forests occupy less than 1% of the area, but the birch also plays the role of a secondary wood species in mixed forests. It occurs in the undergrowth of larch forests and is found on the edges of forests, in the floodplains of rivers, and along the margins of meadows [66,67]. We examined the leaves collected from birches found in 130 sites across 11 regions (Figure 1). For the sake of presentation convenience, the regions were ranked by average annual temperature from 1 to 11; nine of the regions are in the middle taiga subzone, site 11 is located in the northern taiga subzone, and site 5 (even though it is one of the southernmost sites, it is located in the foothills of the Stanovoy Range) belongs to mountain sparse forests. The biotope type was determined using generally accepted geobotanical methods. The abundance of each species was evaluated using the Drude scale and vertical projection in percentage, the number of trees was calculated for each species, and individual height and trunk diameter were measured at the level of 1.3 m. The crown density (CD) was determined by eye estimate and expressed as decimal fraction [68].
When analyzing the influence of the geographical location, we examined the latitude and longitude of the site, as well as its height above mean sea level (AMSL); we also calculated a certain “latitude-elevation gradient” using Formula (1):
L E G = L R + E R
where LEG is the latitude–elevation gradient, LR is the rank of the region by the site latitude, and ER is the rank of the region by the site AMSL.
To analyze the impact of climatic factors, we performed statistical processing of meteorological data from 11 weather stations. Climatic conditions (precipitation and the average daily air temperature) were examined by months, by seasons, and by years (average annual). Winter was denoted as the period with persistent snow cover (November–March); summer as the period with average daily temperatures above 0 (June–August); spring as April–May; and autumn as September–October [65]. For winter, we examined the average temperature and precipitation, the temperature of the coldest month (January), and the average wind speed. For summer, we examined the average summer temperature, precipitation and humidity, the temperature of the warmest month (July), and the average daily temperature amplitude. In order to exclude the influence of the temporal climate trend, climatic parameters for the past 40 years were averaged and analyzed for each site. We also examined agroclimatic parameters via the sum of active temperatures (SAT) and the duration of each period in days for 0, +5, and +10 °C [70,71] (which we labeled SAT-0, SAT-5, and SAT-10, respectively), and by calculating the hydrothermal coefficient (HTC) using Formula (2):
H T C = W P P · 10 S A T
where HTC is the hydrothermal coefficient for the sum of active temperatures, WPP is the warm period precipitation, and SAT is the sum of active temperatures of the growing season. Climate inclemency values, in general and by seasons, were obtained by ranking the considered climatic parameters and calculating the arithmetic mean with Formula (3):
G C I = R n n
where GCI is the general climate inclemency, R is the ranking of particular climatic parameters, and n is the number of parameters. The general climate inclemency was evaluated with six climatic parameters: the average annual temperature, average temperature of the coldest and warmest months, annual precipitation, SAT for the period with average daily temperatures above +5 °C (SAT-5), and the duration of the frost-free period.
SCI, summer climate inclemency, and WCI, winter climate inclemency, were calculated using the same formula, respectively, with 4 parameters. For SCI, it was the average temperature of the summer, total summer precipitation, SAT-5, and the duration of the SAT-5 period. For WCI, we estimated the average temperature of the season, total precipitation, the duration of the period with an average daily temperature below 0, and the average wind speed. For autumn and spring, we estimated only the average temperature and total of precipitation.
Material Volume: For FA assessment, at each site, 100 leaves were collected (10 leaves from 10 trees) from short shoots. A total of 13,000 leaves of Betula pendula were collected. The leaves were scanned at 300 dpi and then measured in the Bio software package; linear measurements were taken to an accuracy of 0.1 mm and angular measurements to 0.1°. FA was assessed by five characteristics of the lamina structure and venation (Figure 2).
The value of the FA was estimated using the formula suggested by Zakharov et al. [36,72], Formula (4):
F A = L R L + R
where FA is the fluctuating asymmetry absolute value, and L and R are the measurements of the left and right halves of the leaf. Integrated fluctuating asymmetry (IFA) was calculated as the five characteristics’ mean. The average IFA was calculated for each of the examined trees and for the site as a whole.
For analyzing the FA, the following factors were taken into account: the time of leaf collection, leaf size, the age of trees, the presence of diseases and leaf pests, the type of the plant community, and some factors related to it, namely soil moisture and light conditions. Based on crown density (CD), we distinguished 4 gradations of lighting: 1, high, CD = 0–0.2; 2, moderate, CD = 0.3–0.5; 3, low CD = 0.6–0.75; 4, very low, CD = 0.75–1. The soil moisture was assessed by eye and by the nature of vegetation, and 3 gradations were distinguished: 1, insufficient moisture; 2, moderate moisture; 3, excessive moisture.
Statistical treatment of the material was performed using the generally accepted methods in the Microsoft Excel and Statistica-10 software packages [73]. Correctional analysis, nonparametric statistics, one-way and multi-way ANOVA, clustering method, and principal component analysis (PCA) [74] were carried out.

3. Results and Discussion

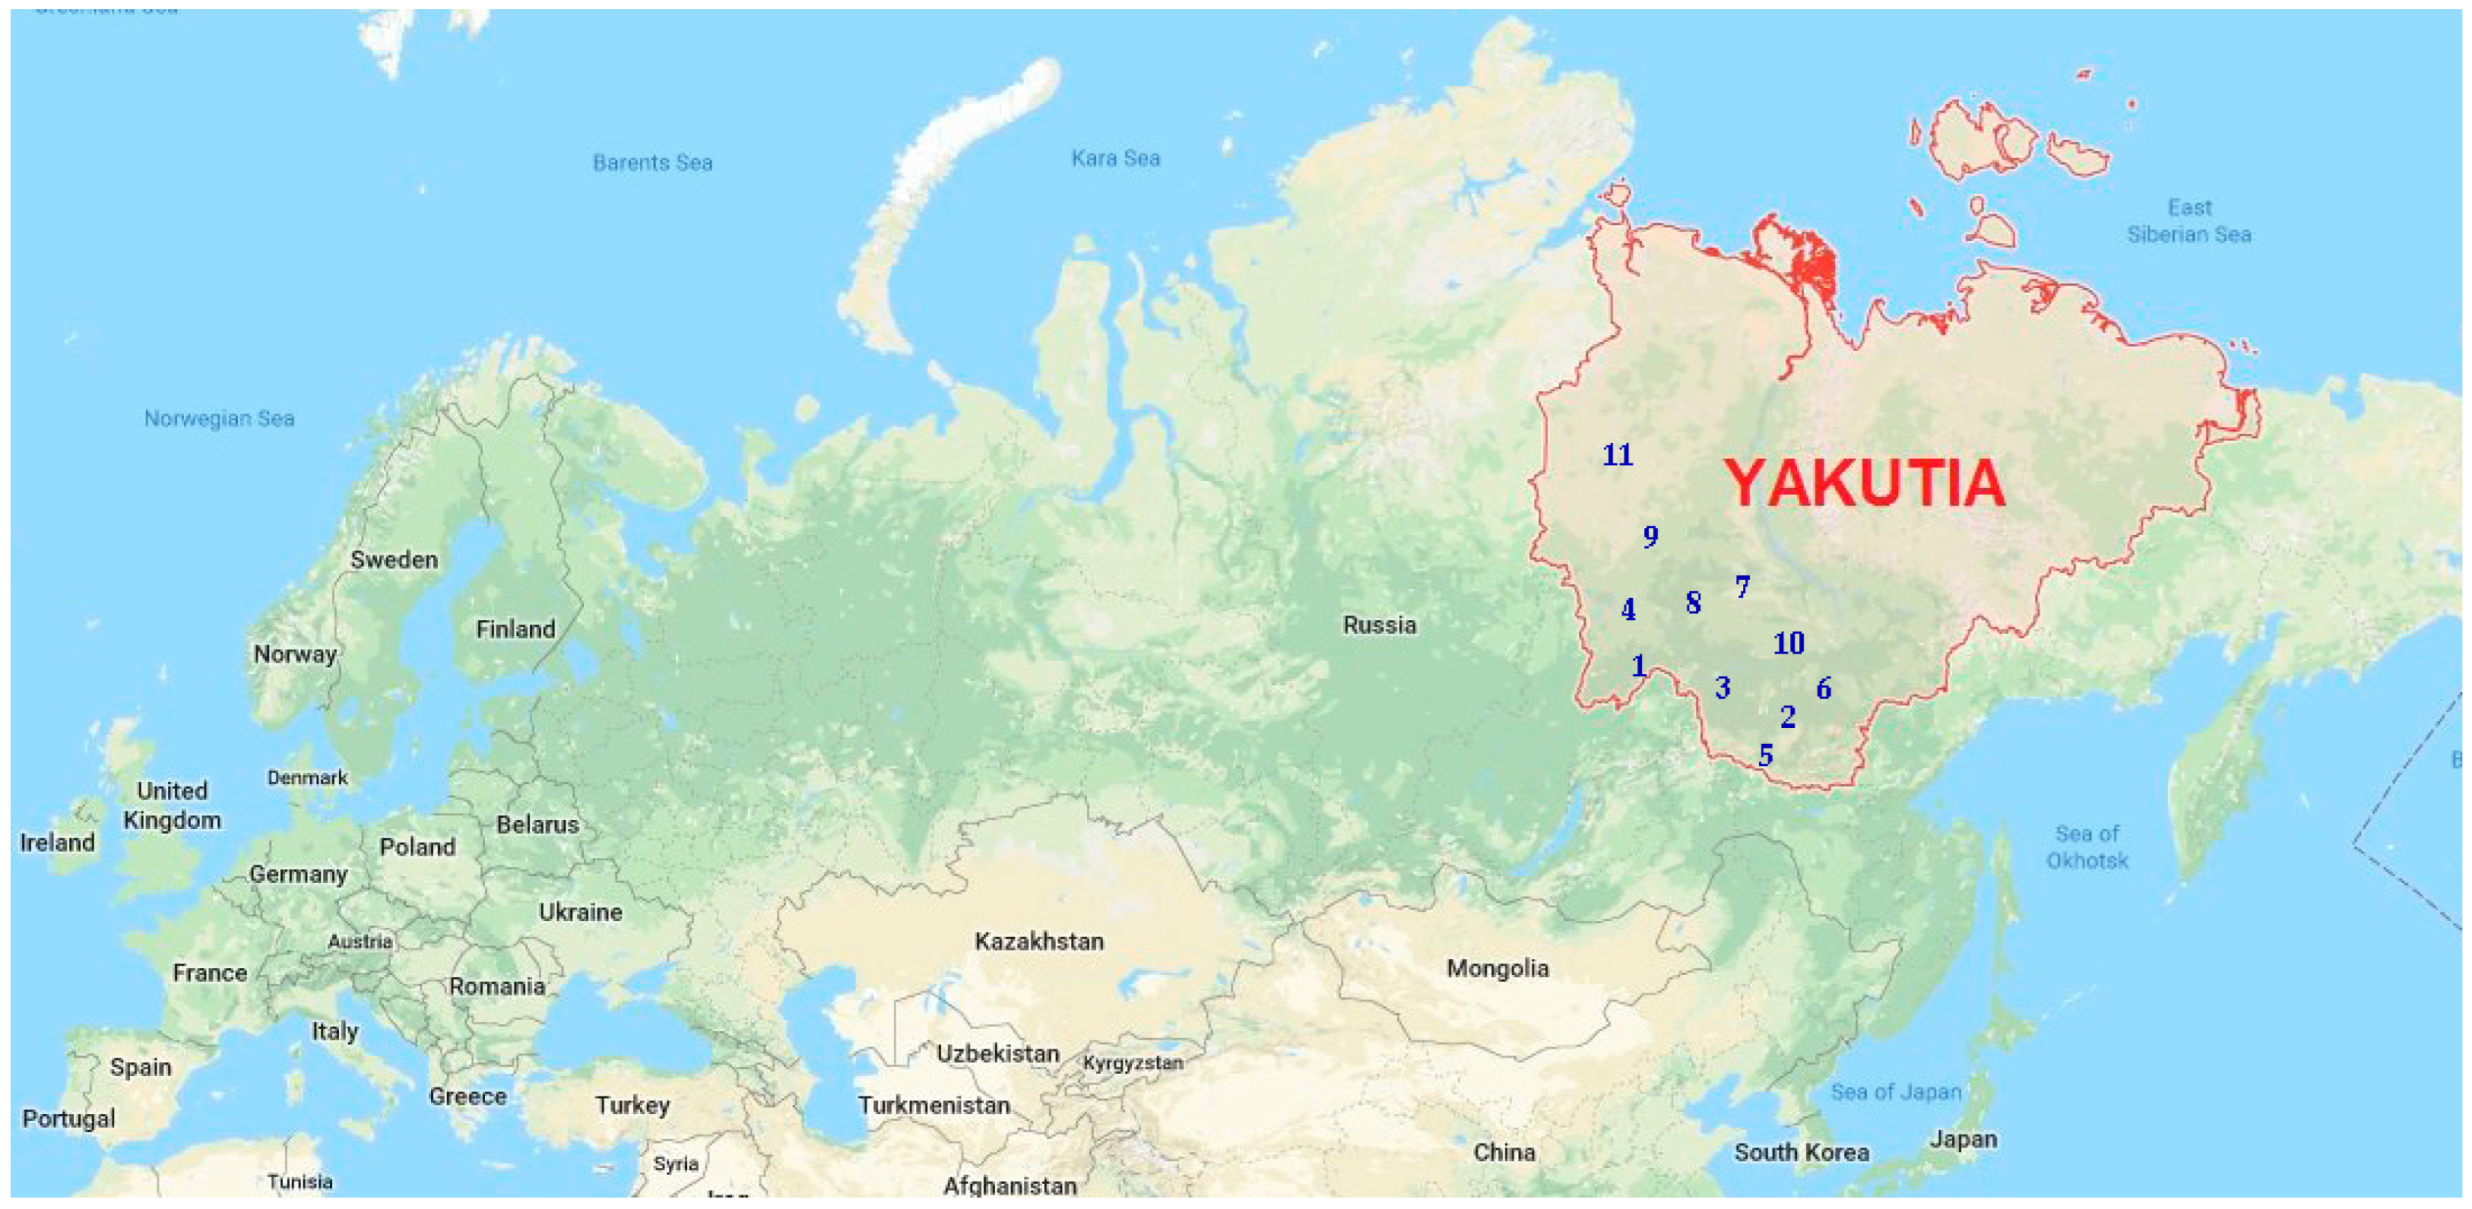
3.1. Abiotic Conditions of the Studied Regions

On the whole, all the studied regions could be characterized by rather harsh abiotic conditions, but the study covered a significant territory—from the edge of the southern taiga to the northern sparse forest—and the linear distance between the northernmost and the southernmost site was more than 1200 km. Initially, we ranked the regions by their average annual temperatures, and hereafter, we use their geographical names and numbers as presented in Table 1. Naturally, climatic conditions differ too, with the average annual temperature being highly correlated with the average temperature of winter months (Spearman’s rho R = 0.87, t = 5.36, p < 0.001), because the long cold season contributes significantly to this parameter and does not correlate with the temperature of the warm season that plays an important role in the life of plants. We analyzed the similarity of the 11 studied regions in a set of climatic parameters, including the average temperatures of summer and winter, the duration of the warm season, and precipitation in summer and winter, and the results show that they do not always correlate with the data on the average annual temperature and the geographical position. Judging by a complex of 23 climatic parameters, the highest similarity was observed between the regions 1, 4, 6–9, Lensk, Amga, and all the sites in West Yakutia (Figure 3). These areas have a relatively mild climate, which is explained by their geographical position: Amga and Lensk are located relatively southerly, and regions 4 and 7–9 are in the west of Yakutia; the continental climate is less pronounced there, and there is also a warming effect from the Vilyuy reservoir. There is a cascade of water power plants in the Vilyuy River valley. The construction of these plants led to the creation of a huge reservoir that freezes over later in winter than the neighboring rivers. A large mass of relatively warm water in that reservoir is considered the reason for a change in climate over a vast region, leading to softer winter conditions and more abundant precipitation. This phenomenon applies to regions 4, 7, 8, and 9, which are located in the area affected by the Vilyuy reservoir [75,76].
Regions 3 and 10 are similar in the combination of high summer and low winter temperatures, as well as the low precipitation, while region 2 (Aldan) stands apart within this cluster due to its relatively higher precipitation [65]. Regions 3 and 10 are situated in the Lena River valley and surrounded by low hills. The elevation above the sea level is not great, but during the cold season, the river valley is flooded by cold masses of air from the surrounding hills. Therefore, the Lena River valley is characterized by a colder climate than its neighboring regions. This phenomenon of cold air amassing in landscape depressions is a well-known fact in climatology [65]. Note the high degree of isolation (from the other regions) and similarities (between each other) in the climate that is manifested by regions 5 and 11, the southernmost and northernmost one in our studies: by forestry classification, they belong to the subzone of sparse forest, with region 11 being located near the edge of the forest vegetation on the northern periphery of the Betula pendula range and region 5 being located on the northern spurs of the Stanovoy Range, where the sparse forest’s origin is of montane nature.
The average annual temperature demonstrates a fairly close correlation with the latitude (R = 0.72, t = 3.1, p < 0.01) and shows no dependency on the longitude of the site or its elevation above sea level, but at the same time, it is significantly correlated with the latitude–elevation gradient (R = 0.76, t = 3.47, p < 0.01). The closest relations are observed between the coefficient of the general adversity of the climate and the latitude–elevation gradient (R = 0.88, t = 5.76, p < 0.001).

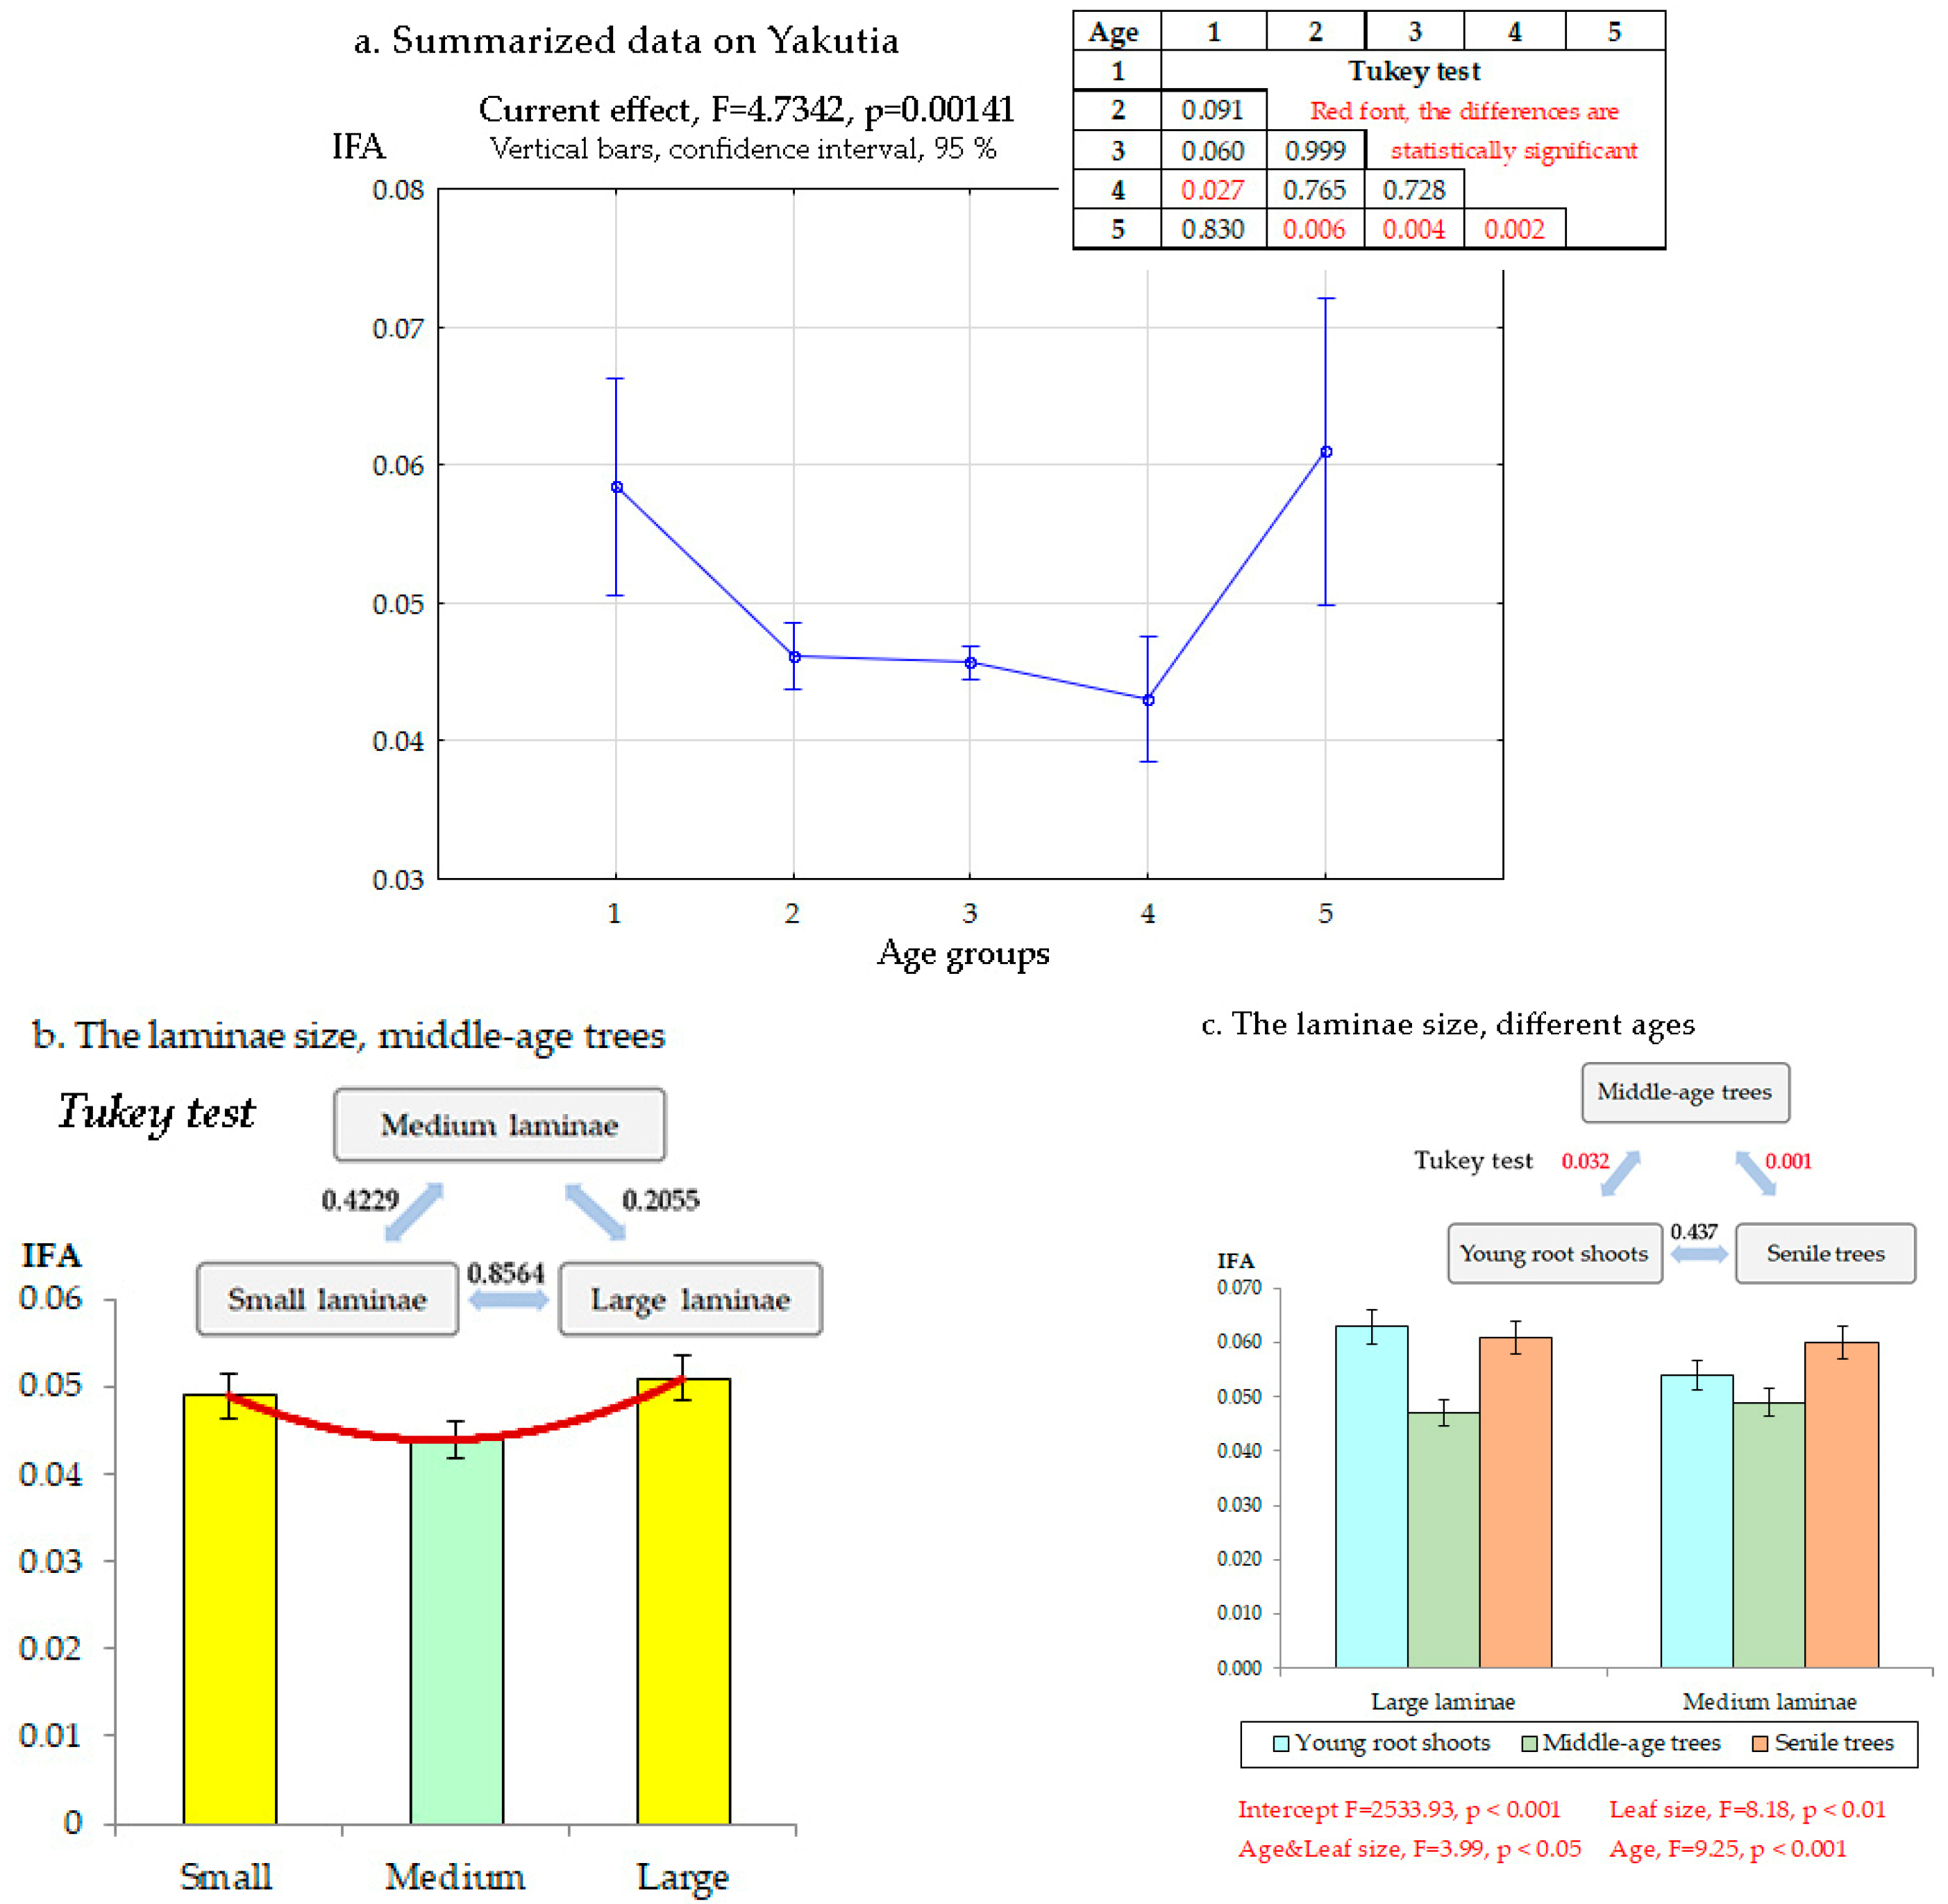
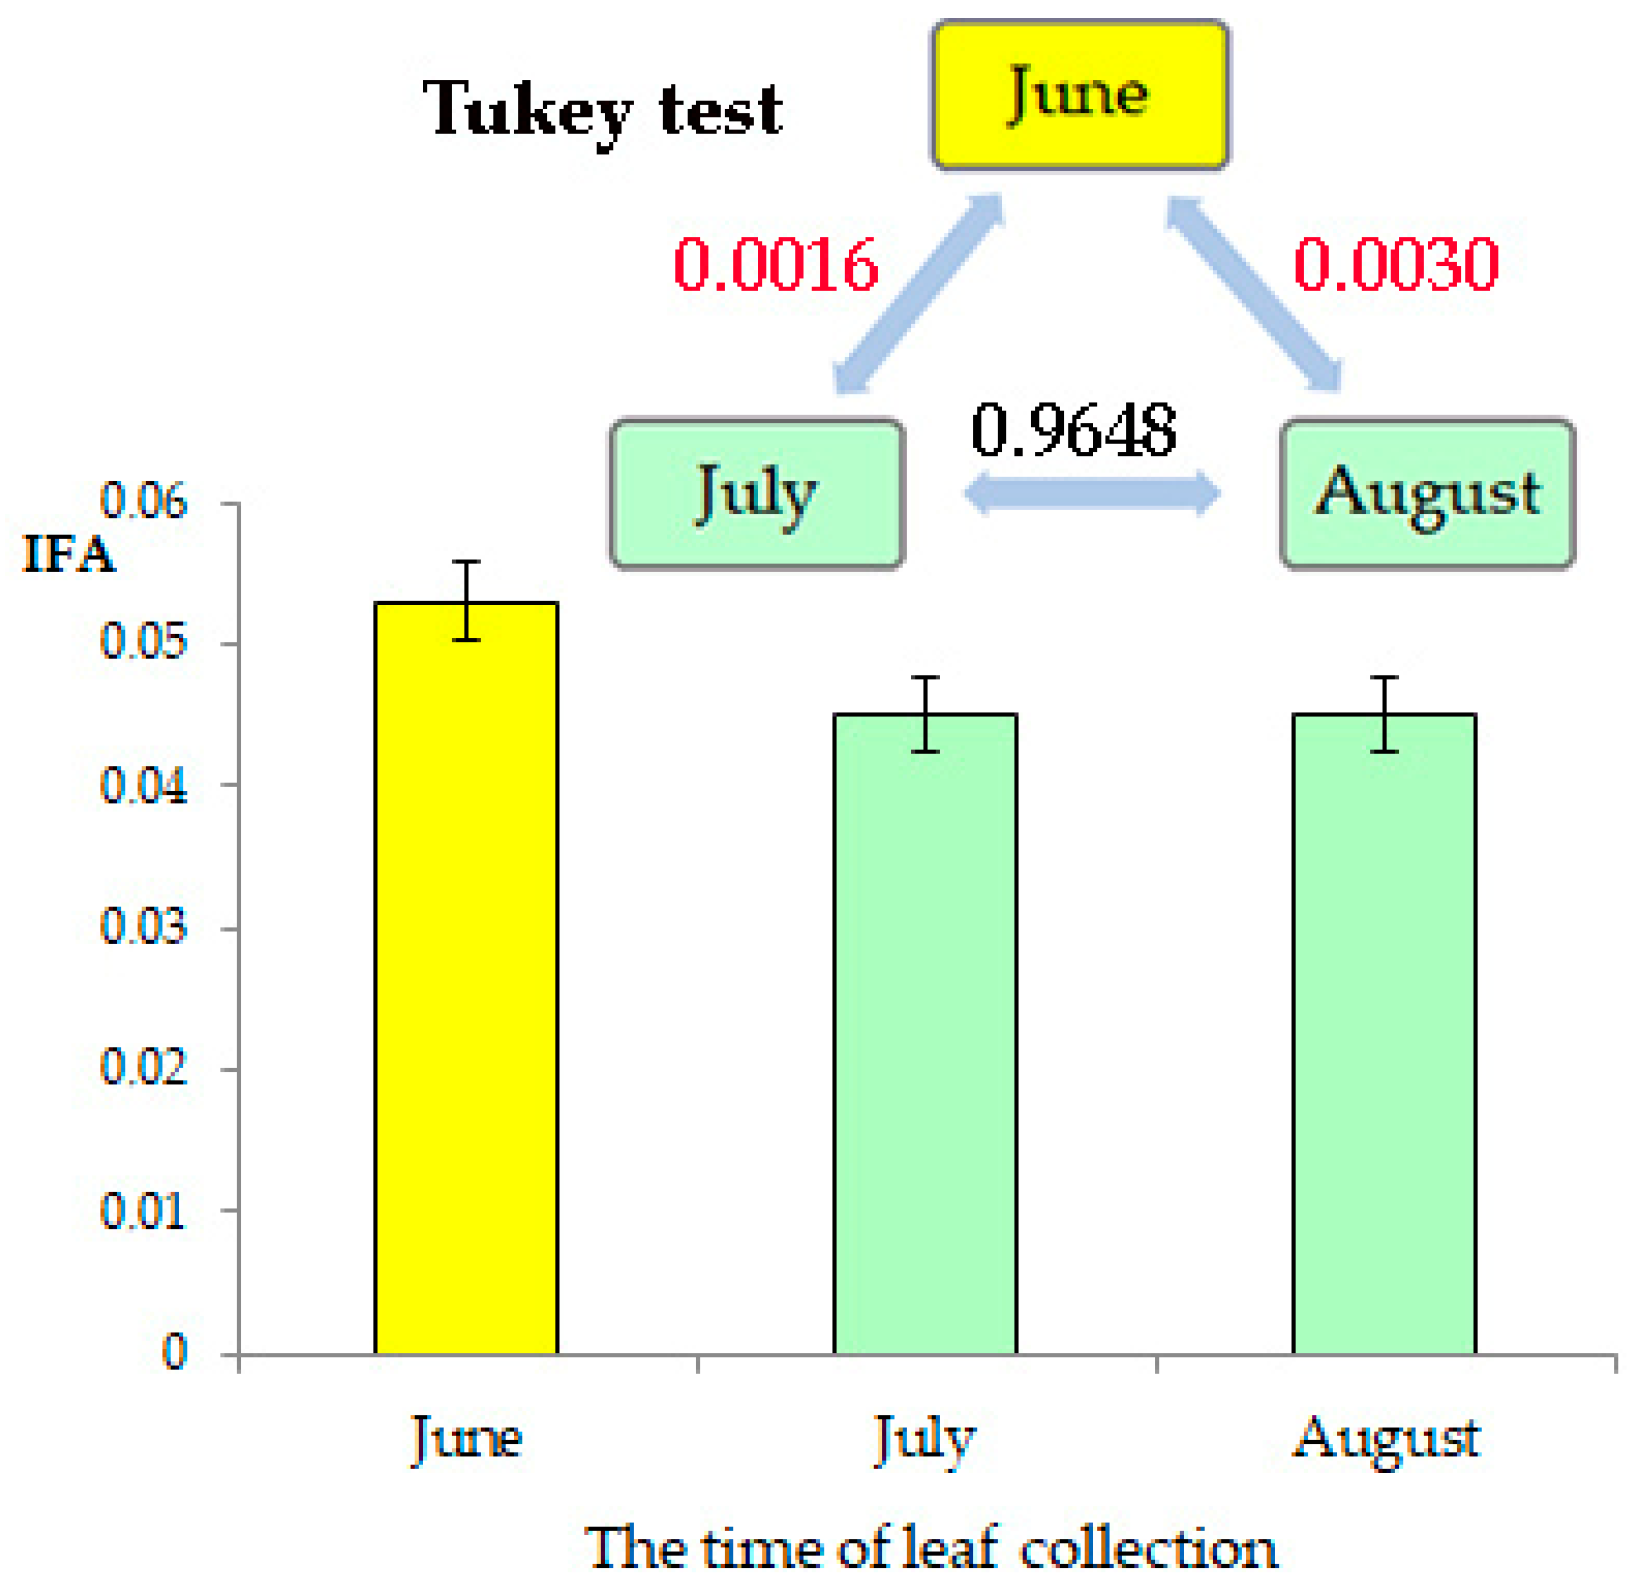
3.2. Intraindividual and Chronological Variability

Integrated FA in the examined natural biotopes of Yakutia varied from 0.032 to 0.064, which indicates high heterogeneity in the sample. Therefore, before estimating the magnitude of the effect that external factors have on the FA of Betula pendula leaves, we made an attempt to assess the effect of the state of the tree itself, i.e., internal factors. First of all, the FA of trees of different ages was examined, and we noted that very small and very large laminae are characterized by a higher FA level than the leaves of a medium (for a given plant) size collected from the same trees in the same time, which we also observed before [56]. For Central Yakutia, medium-size leaves of Betula pendula are those with a primary vein length of approximately 47–58 mm [77], so for small ones, we collected leaves with a length of less than 42–43 mm, and for large, those of more than 60–62 mm in length. It should be noted that this parameter can vary by biotope.
For the analysis of the age differences, we distinguished five age groups: young shoots developing from adventitious buds on the roots of Betula pendula and young (prereproductive), middle-age reproductive, old reproductive, and senile trees. Sharp deviations in FA level were observed only in the first and the last group (Figure 4a). Note that for root shoots, apparently, the lamina size and light conditions are important: higher FA levels were observed in the shoots with very large leaves. One-way ANOVA demonstrated the statistical significance of the “Age” factor on the FA level of Betula pendula (Figure 4a), mainly due to differences between the senile trees and the plants from age groups 2–4. Prereproductive individuals and the two reproductive-age groups were characterized by similar figures, and the root shoots had statistically significant differences only with the old reproductive trees.
It is possible that the increased FA in root shoots was the result of both endogenous factors (young shoots develop from old plants) and exogenous environmental factors: densely growing shoots can produce excessive shading, which leads to the development of very large asymmetric laminae. This relates to an observation that we made in Yakutsk, which had decided to protect several specimens of Betula pendula from dust with a temporary fence and a canopy for a city improvement project. By the mid-summer, the trees shaded by the canopy had laminae almost 1.5 times larger than usual, and their FA level was 0.057 ± 0.0028. By the next summer, the work was completed, the canopy was removed, and the same trees had leaves of the usual size, with FA of 0.046 ± 0.0027. The differences between the two samples were statistically significant with a high level of confidence (Student’s t-test 2.88, p < 0.01). Comparing these results with the FA of large leaves of the root shoots, one can assume that when the stress-inducing factor is removed, developmental homeostasis can stabilize.
Senile trees were characterized by FA of over 0.060, regardless of the size of the leaves. Considering that senile trees have lower reproductive function [78,79,80], aging is arguably accompanied by impaired reproductive function in both sexual and vegetative reproduction, as well as a decreased ability to maintain developmental homeostasis. Along with the combined Yakutia sample, there may be a trend in IFA that depends on the lamina size. This can be shown with the example of two regions. In region 10, a study of the leaf size in middle-age reproductive trees was conducted. Figure 4b appears to show an increasing trend in IFA for very small and very large laminae, but a Tukey test showed an absence of statistically significant differences. For region 3, we could compare both factors at the same time in the trees found within the same biotope. As in region 10, three age groups and two size groups were isolated: medium and large leaves. The same trend in IFA changes was observed, but in this sample, the trend was supported statistically, both by one-way and by multi-way factorial analyses (Figure 4c). Multi-way ANOVA showned that all three factors have a significant influence on the birch IFA, but the significance level was the highest for the factor “Age” and the lowest for “Collection month” (Figure 4c).
Thus, it can be assumed that the differences in FA level in leaves of different sizes are more pronounced in the extreme age groups. It is possible that such a dependency is characteristic only of plants living in the subpessimum zone. By the example of B. pendula observed in conditions of temperate climate, we found that the IFA level on short shoots does not depend on the ontogenetic state of the plant (p > 0.05), because the leaf morphogenesis in different-aged individuals of B. pendula in the reproductive period of ontogeny is fairly stable [22].
The impact of the time when the material was collected on the FA level is also notable (Figure 5). The method required that the leaves should be collected only after the lamina had formed completely, which for conditions inYakutia, is in late June to early July. For the leaves collected before that, statistically significant differences in FA level were recorded as compared with the same trees in mid to late summer. A Tukey test showed that the leaves collected in early summer could be characterized by a significantly higher FA level (Figure 5). This can be explained by the fact that, at that time, the lamina was not yet completely formed and unfolded; i.e., the increased FA level during that period does not indicate the destabilization of ontogenesis. In such a case, the increased FA level does not reflect the actual disturbance of developmental stability, but simply means that, by that moment, the formation of the lamina has not yet been completed.
(Intercept F = 484.80, p < 0.0001; Age F = 5.83, p < 0.0004; Leaf size F = 5.11, p < 0.0082; Time of leaf collection F = 3.35, p < 0.0401).
Therefore, in our assessment of the impact that biotopic and climatic conditions have on the developmental stability of Betula pendula, we took into account that the results can be affected by some internal factors. These factors were taken into consideration in our analysis of the combined data.

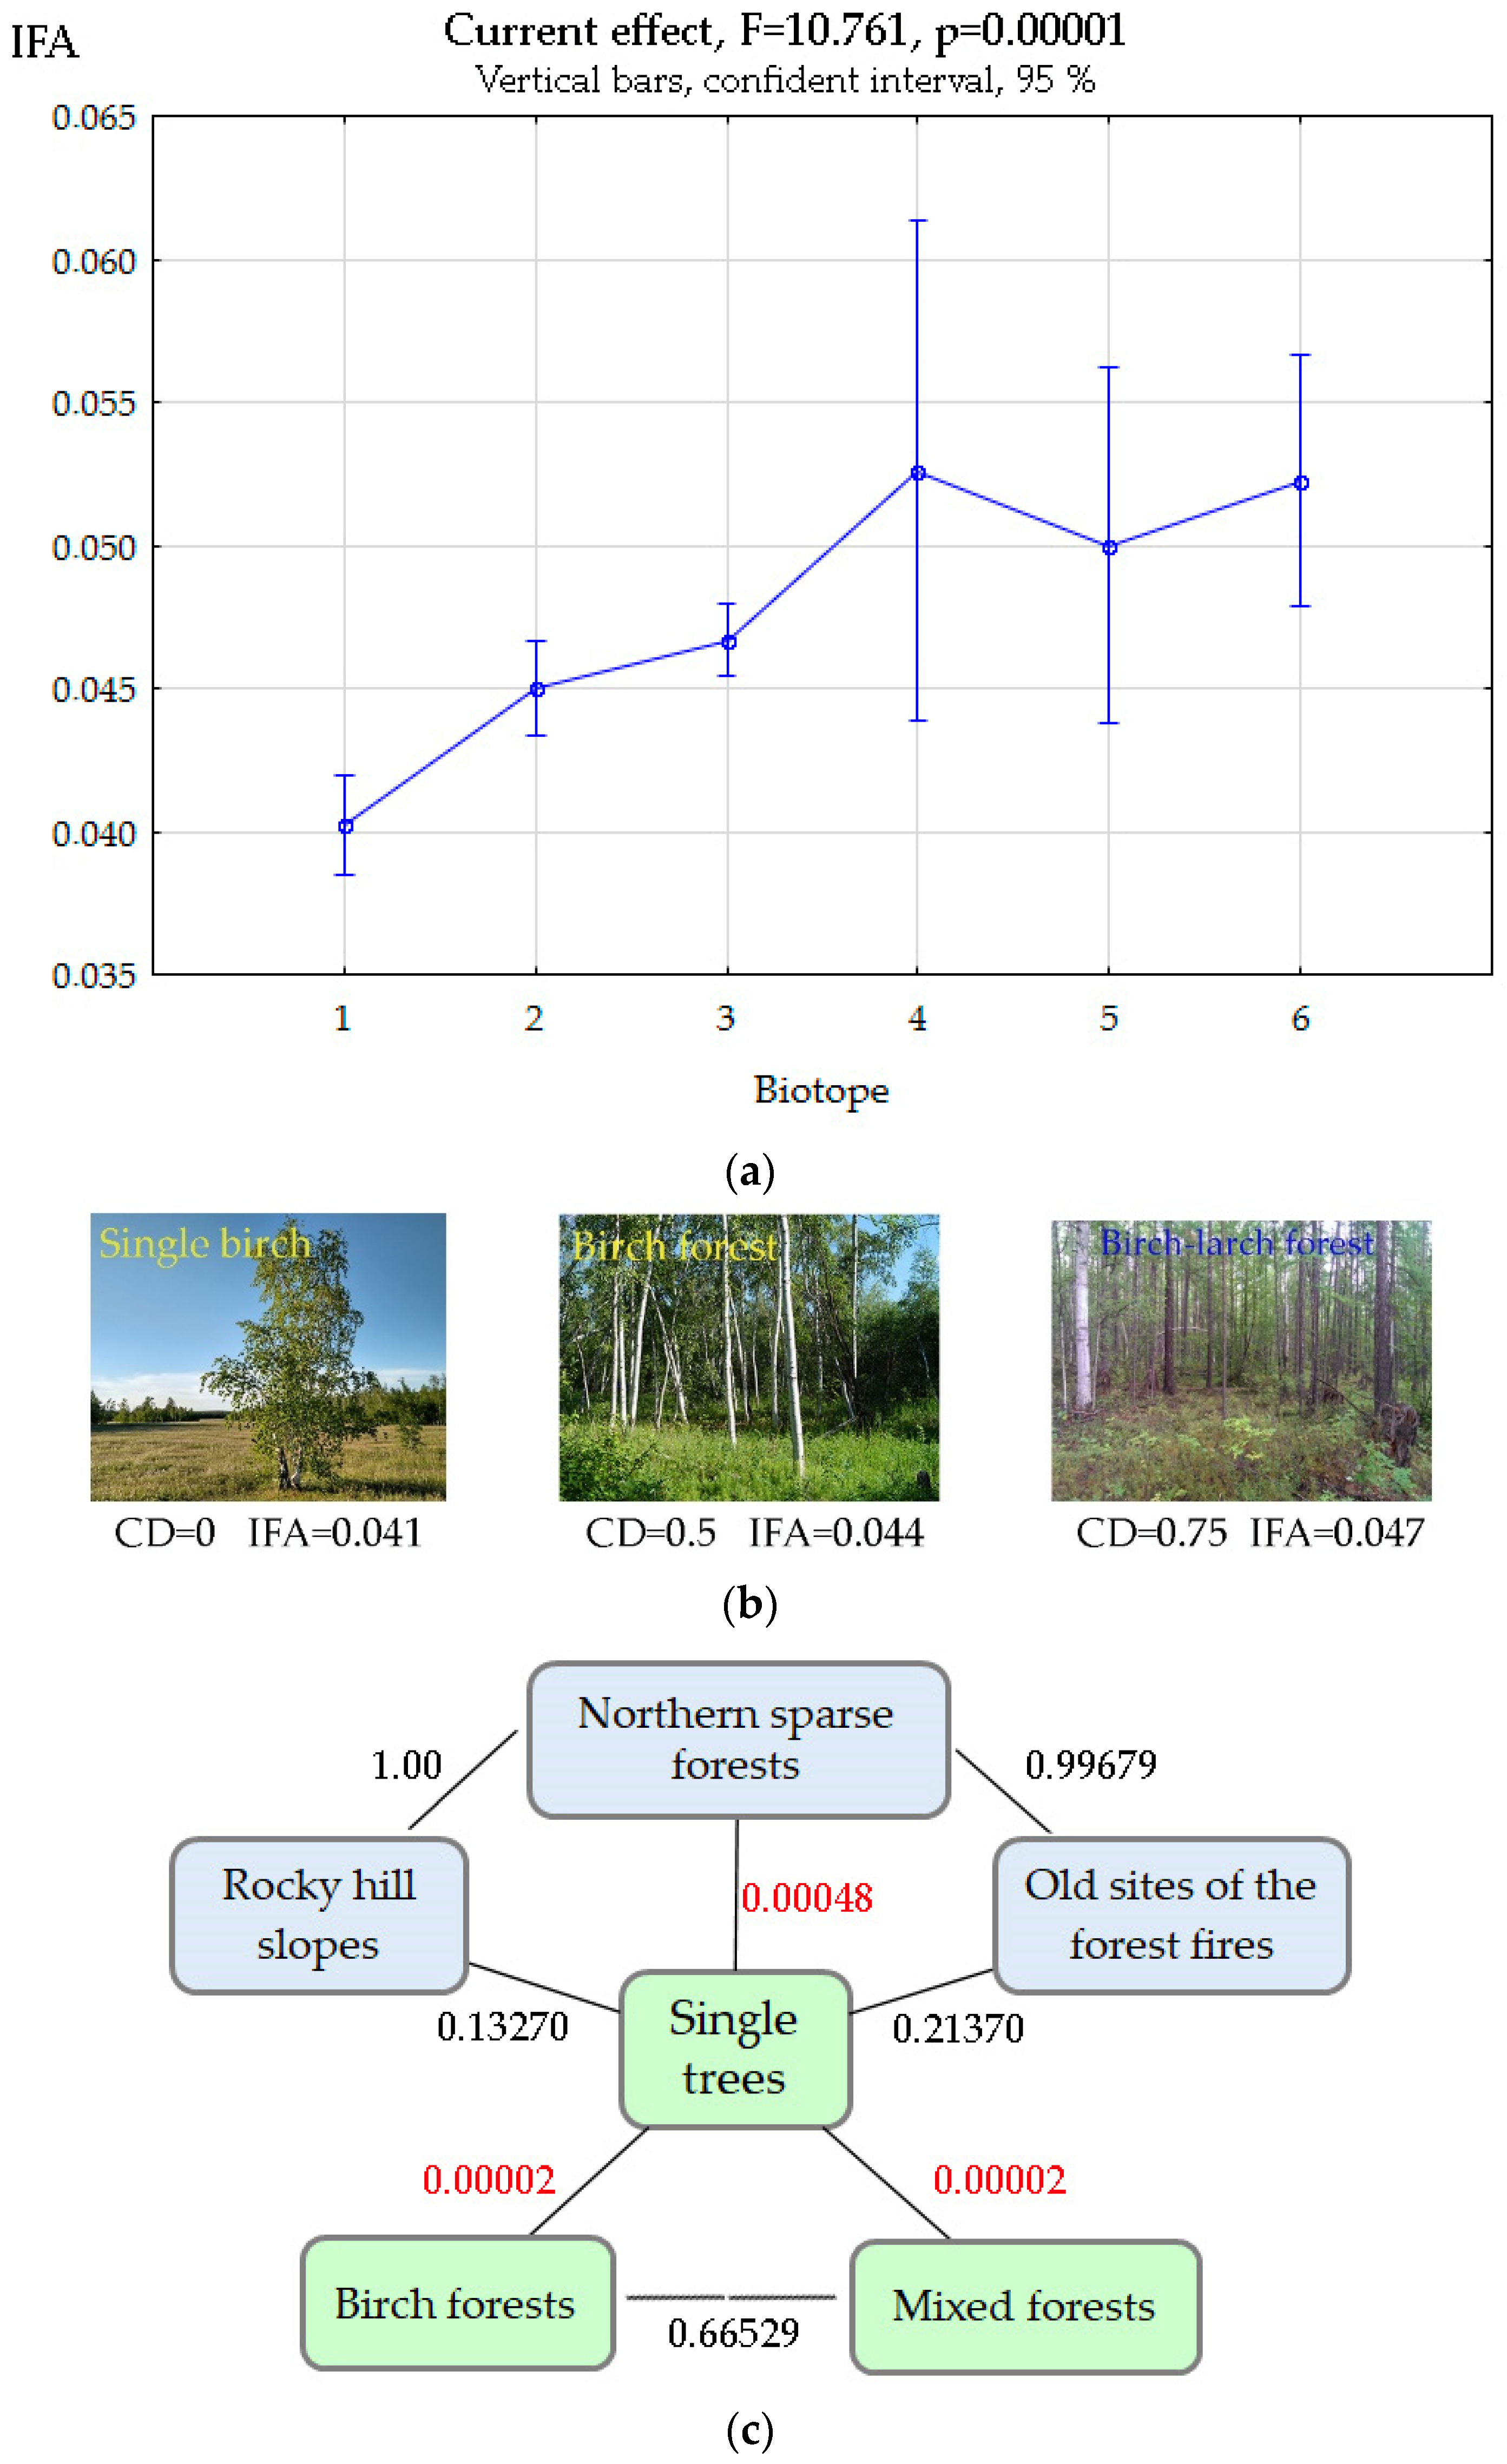
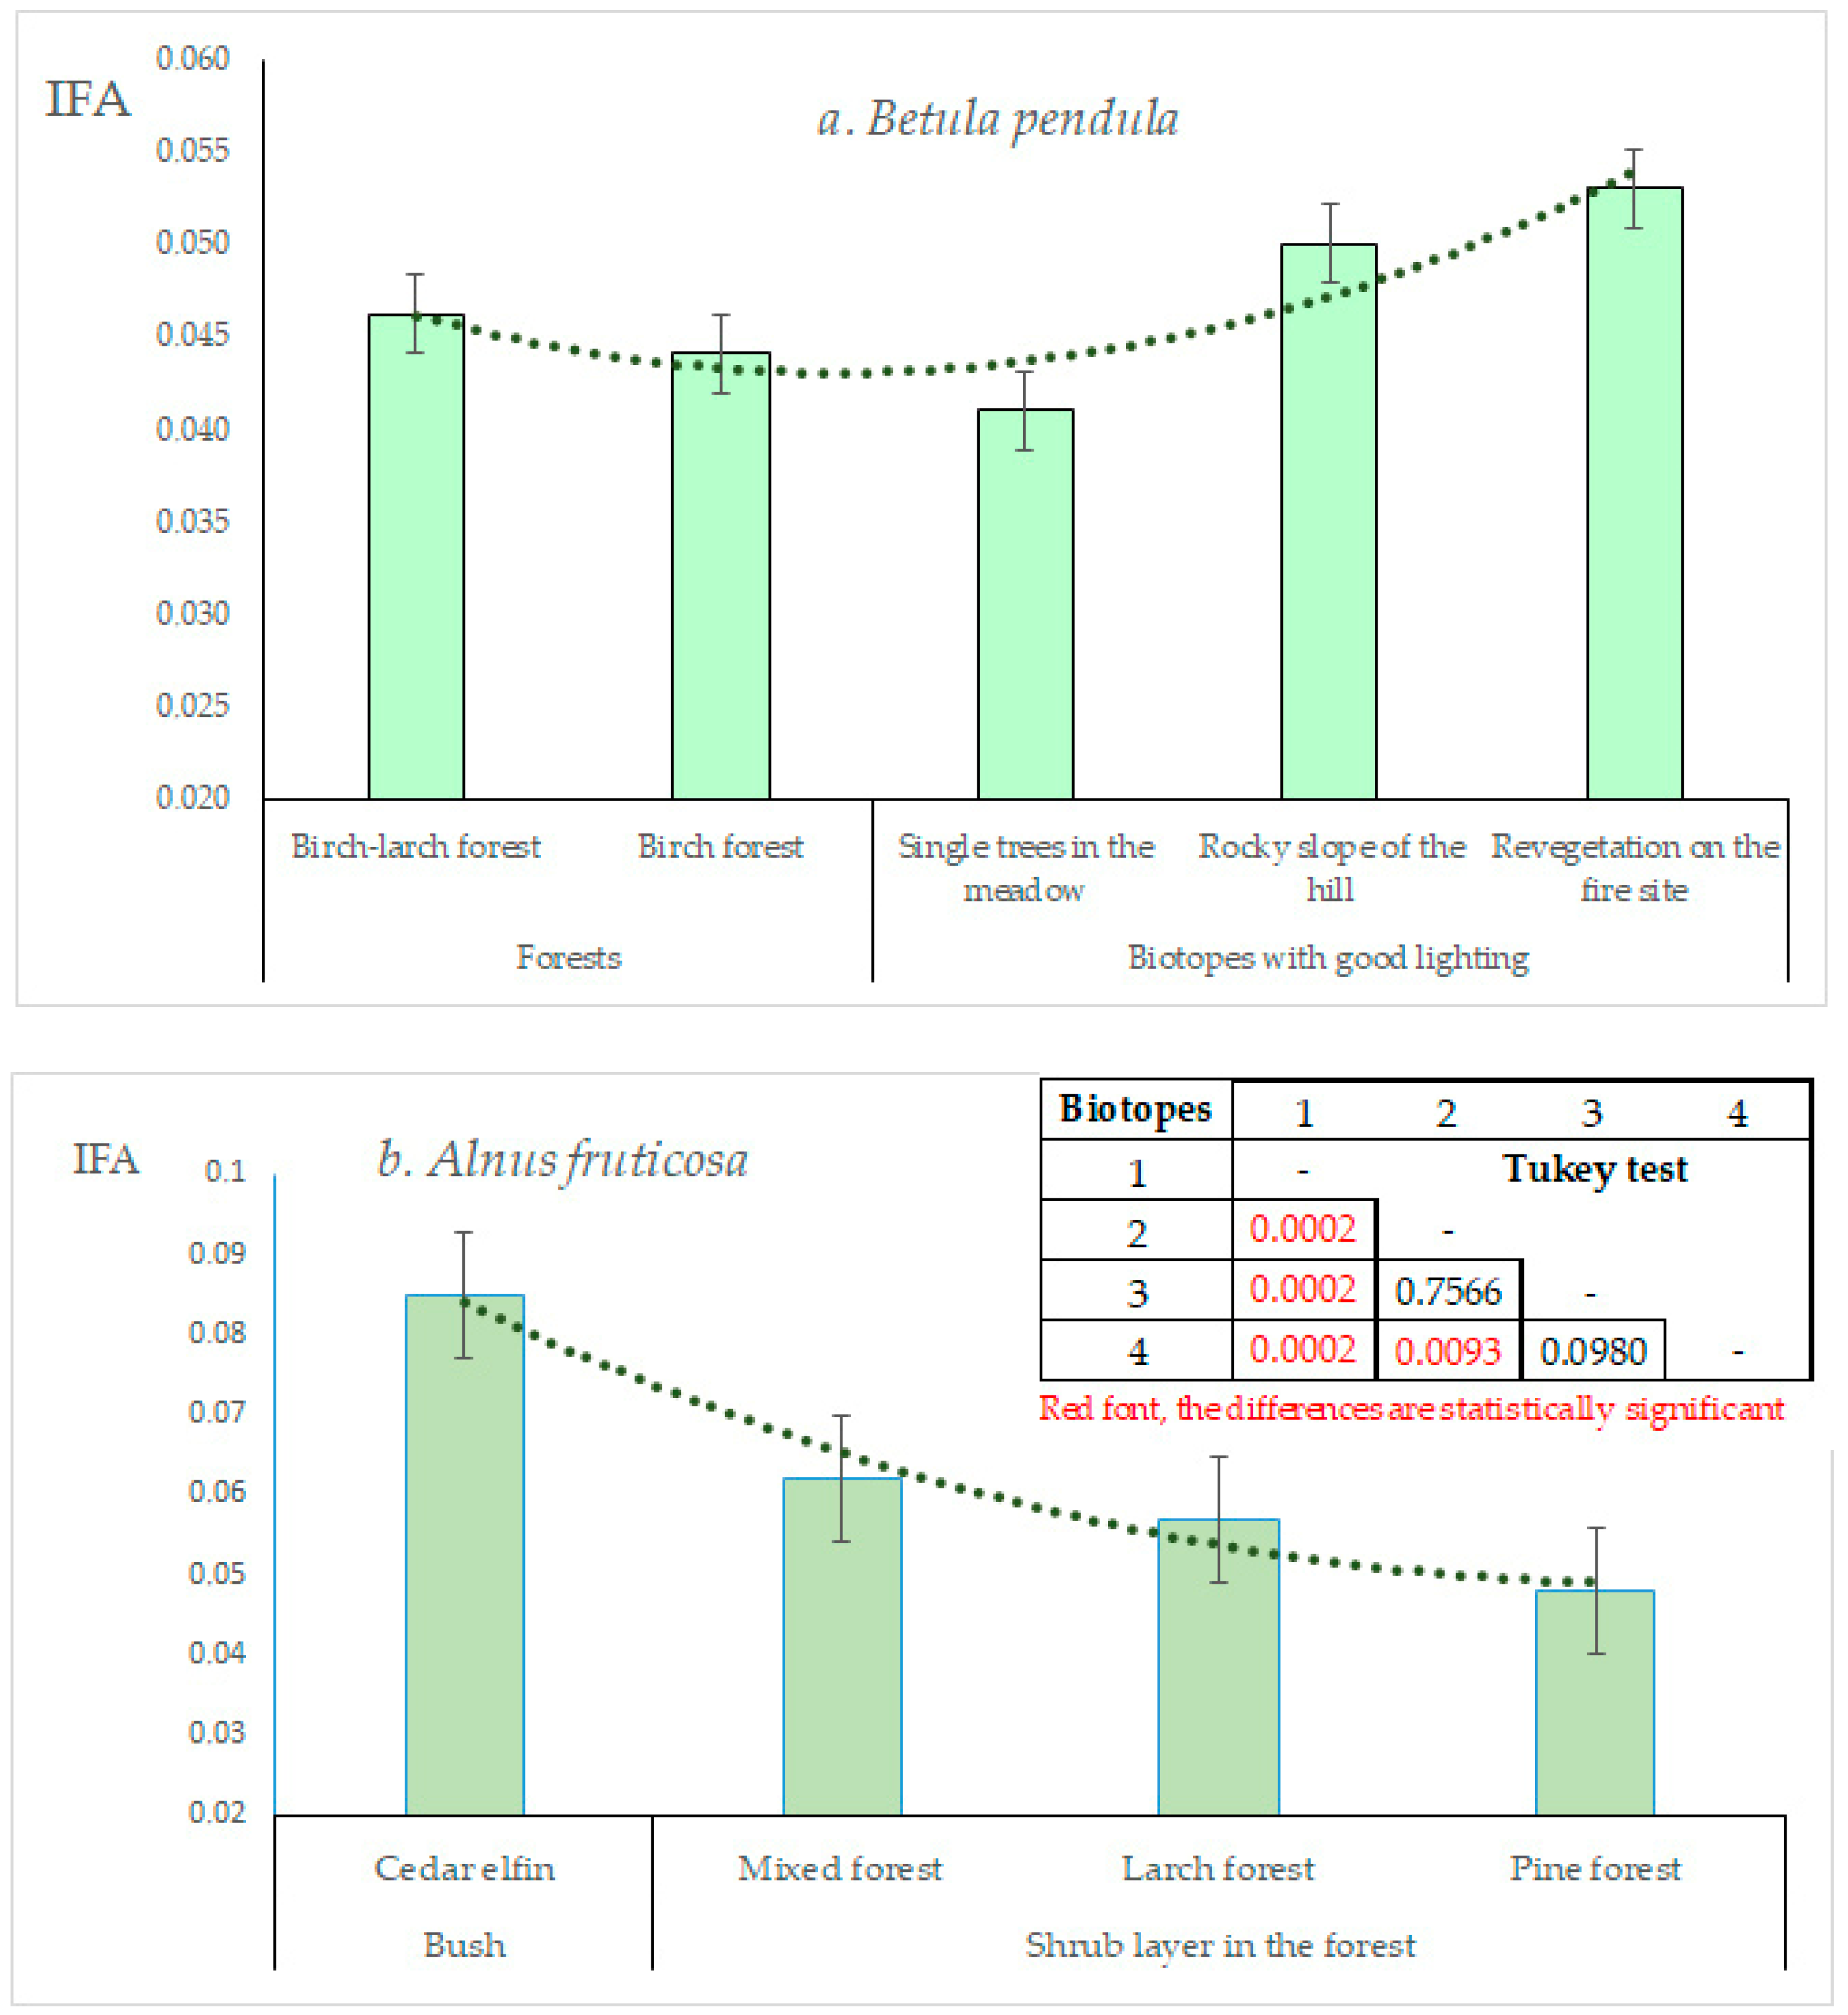
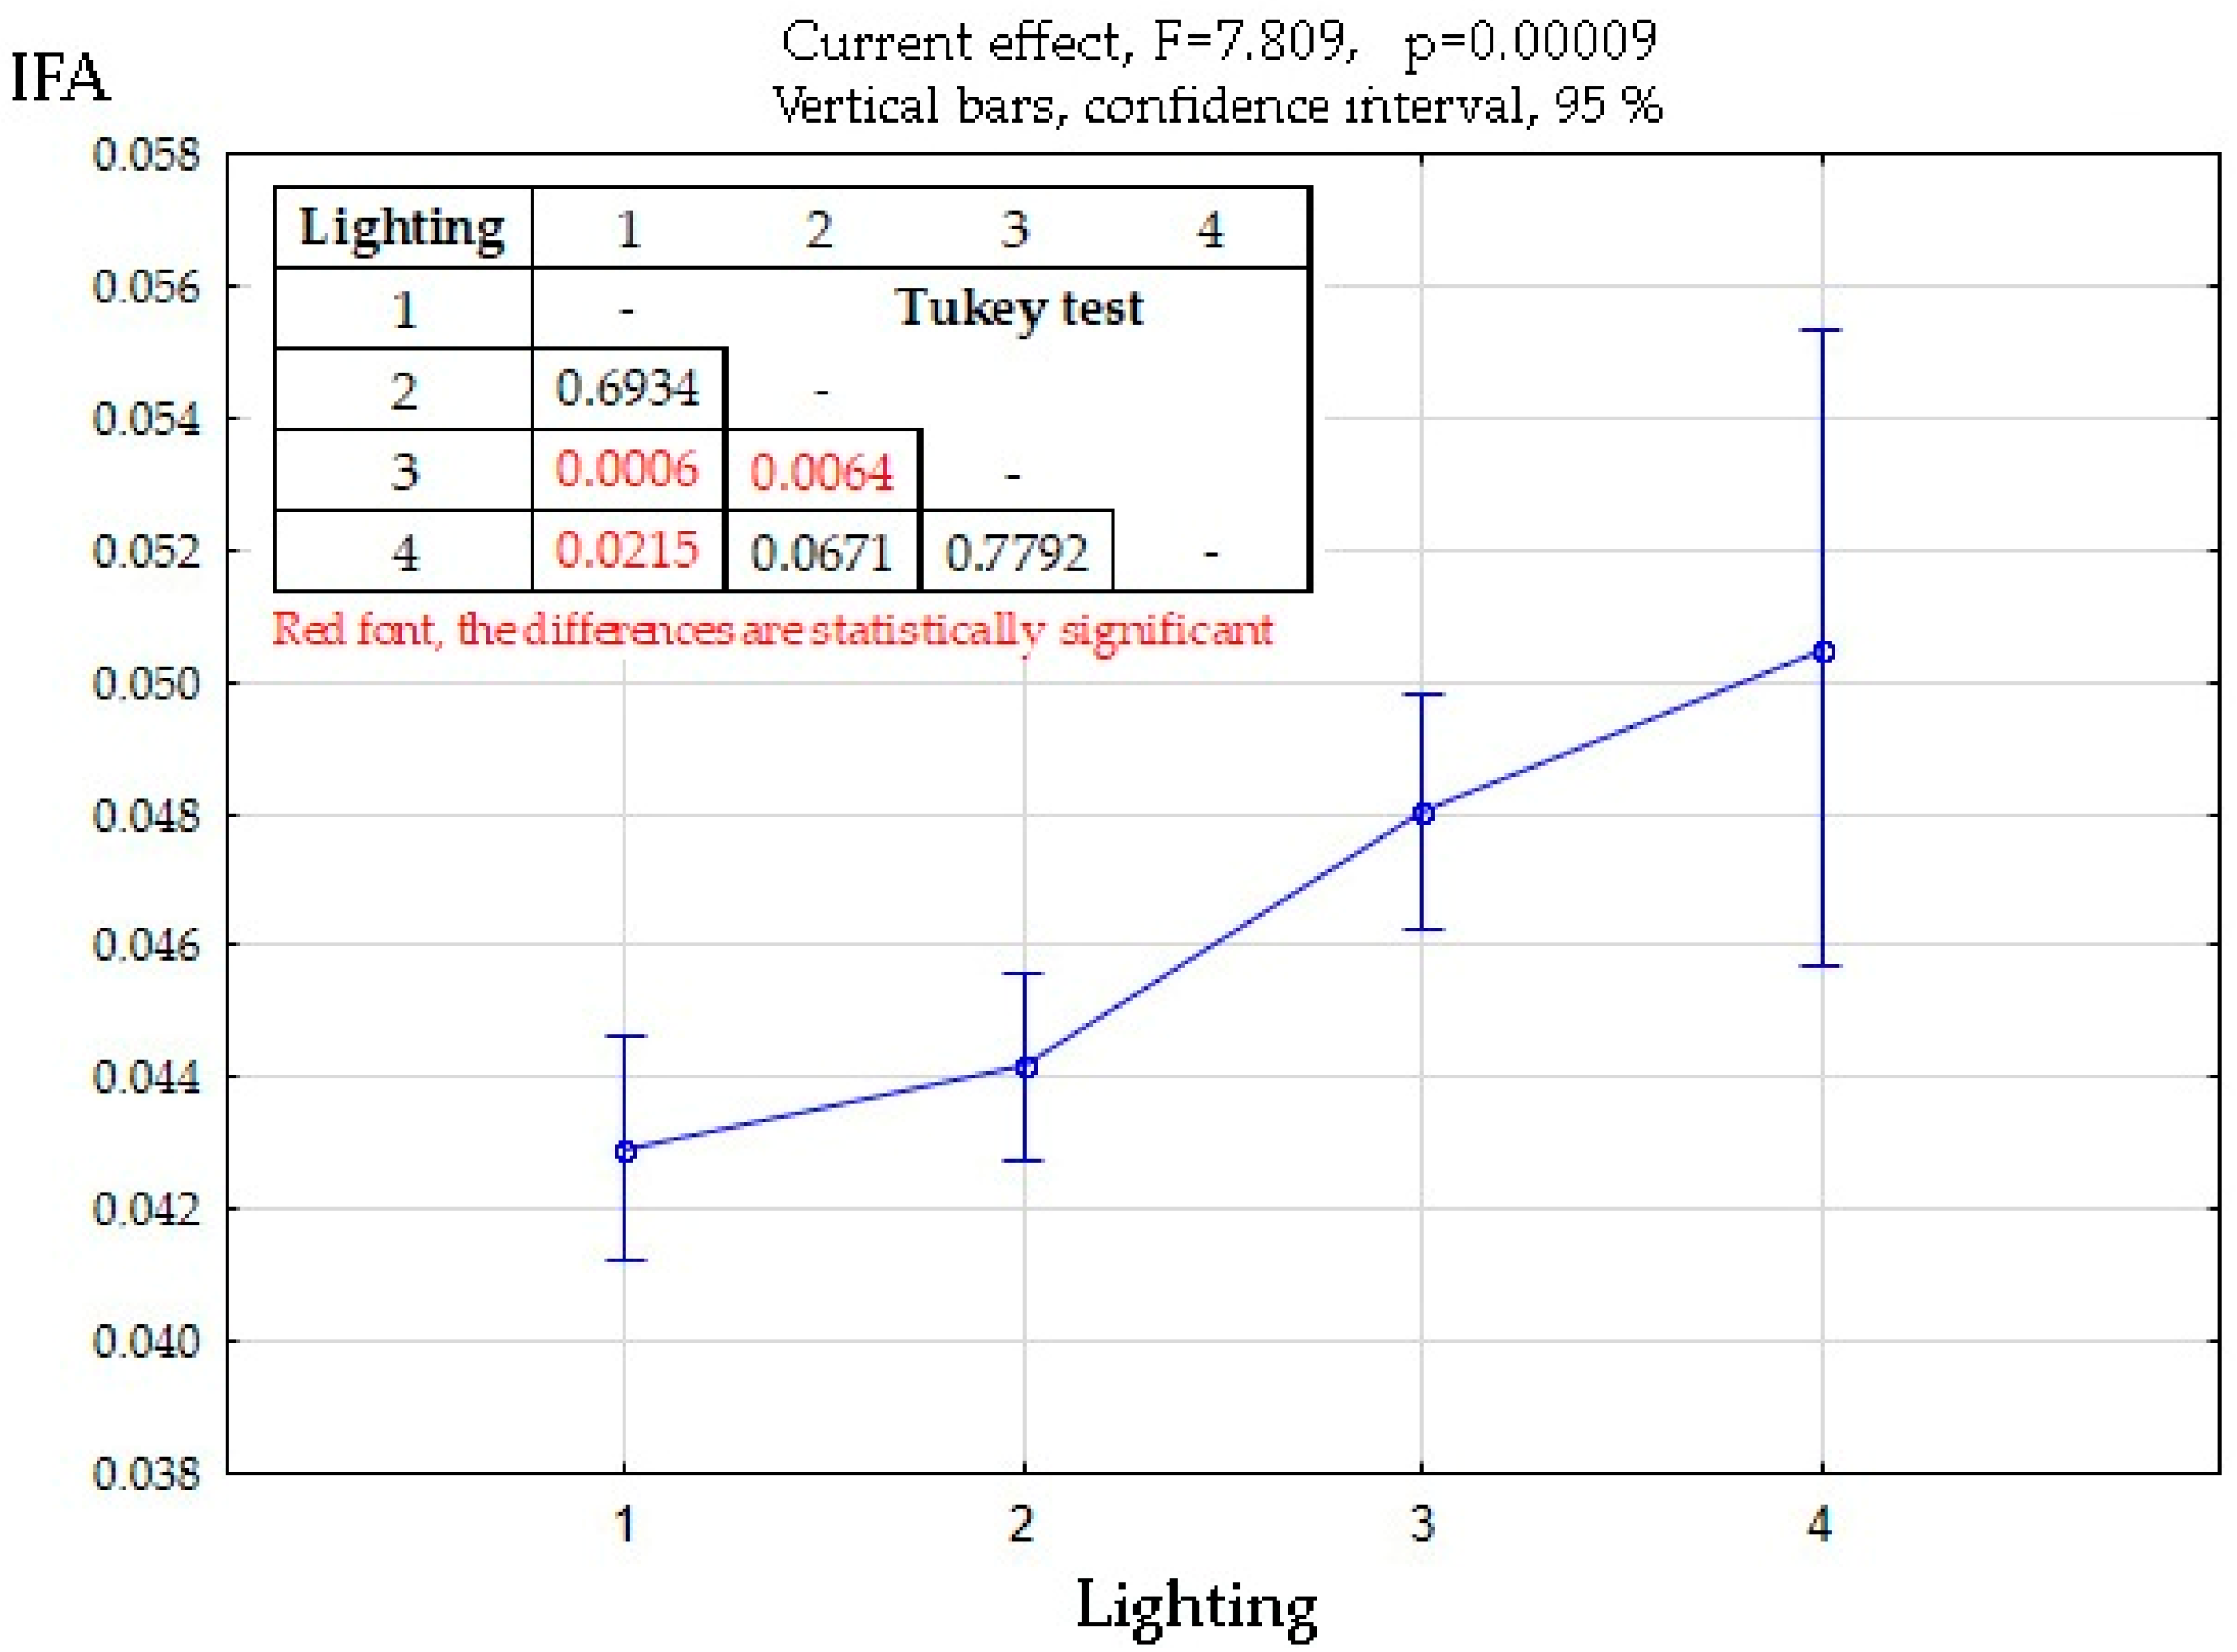
3.3. Biotopic Differences in FA Manifestations

Since Betula pendula is a photophilic species, biotope type plays an important role in its existence, both for species composition and the nature of the crown density (Figure 6a,b). Biotopic differences were considered for the trees found in birch forests, in the undergrowth of mixed forests dominated by the larch, and also for the trees occuring separately or in small groups in meadows. Some limited material, 2–4 samples, was taken per biotope group: old sites of forest fires, rocky hill slopes, and northern and mountain sparse forests. The parameters taken into account were the crown density, the dominating tree species, and light and moisture conditions. An increase in FA was observed in the following sequence: sparse stands, birch forest, mixed forest (Figure 6a). At the same time, even in the biotopes exposed to indirect technogenic impact, FA level in the birch was comparable to that of the plants from natural biotopes, provided that the light conditions were suitable and the soil cover was undisturbed, as was observed in a number of cases in West Yakutia in the vicinity of mining enterprises and in urban conditions [13,26]. One-way ANOVA showed a high degree of statistical significance for the biotope factor, F = 10.76, p < 0.001. A more detailed analysis showed that statistically significant differences are observed only when the birch trees found in conditions of low crown density are compared to the trees found in the forests and in the conditions of the northern and montane sparse forests (Figure 6c). The IFA of the birch trees found at old forest fire sites and on rocky slopes was high, but the differences did not reach a statistically significant level. All other comparison options also showed no statistically significant differences, and when comparing three biotopes with unfavorable conditions (4–6), the Tukey test yielded a value of 0.98–1.0, indicating very high similarity.
Other factors also should be taken into account, for example, the state of the soil cover and water availability. An increased asymmetry level was observed in trees growing on poor soils, for example, on the rocky slope of a hill and in a biotope formed as the result of post-fire succession (Figure 7a). There is evidence from other authors that plants growing on sites where a fire previously took place have an increased FA level, which according to Alves-Silva and Del-Claro, indicates a high stress level [81]. FA level can also be affected by intra- and interspecific competition in biotopes with high crown density. The presence of interspecific interactions for woody plants has long been known [82,83]. It turned out that in mixed forests dominated by the larch, FA level in birch usually was higher than in purely birch groves. A similar phenomenon can be observed in a related species, Alnus fruticosa Rupr. 1845, in which the most severe deviations from the symmetrical state of the leaf were observed in the biotopes where this species was in contact with the Siberian dwarf pine Pinus pumila (Pall.) Regel 1859, and a low level of IFA was found in the pine forest with dominant Pinus sylvestris L., 1753 (Figure 7b). ANOVA revealed high significance for the “biotope” factor, F = 37.04, p < 0.001, and a Tukey test yielded a statistically significant level when comparing the alder found in mixed biotopes with Pinus pumila and Betula pendula. It is possible that a certain role in the destabilization of development is played by interspecific interactions. In the presence of coniferous trees, the FA level of the birch and alder, as a rule, is higher than in deciduous forests with the same crown density; thus, it can be assumed that coniferous trees have a negative impact on these deciduous species.
Nevertheless, in general, one-way ANOVA showed a high statistically significant dependence of FA on light conditions (Figure 8). There is information in the literature that an increased level of FA can be observed in plants in conditions of insufficient lighting, increased intra- and interspeific competition, and soil disturbance [47,50,84]. As for the moisture level of a biotope, a negative impact from both insufficient and excessive moisture was found (F = 4.98, p <0.01). In the conditions of the so-called alas landscapes in the valley of the Vilyuy River, a specific study of moisture conditions on the edges of the meadows was carried out. In that region, excessive moisture had a pronounced negative impact on FA level (R = 0.50, t = 2.73, p < 0.01). MANOVA, on the whole, corroborated the results of one-way ANOVA, demonstrating high significance for these factors (Intercept F = 561.68, p < 0.0001; Biotope F = 7.97, p < 0.0001; Lighting F = 3.96, p < 0.0098; Soil moisture F = 4.29, p < 0.0159).

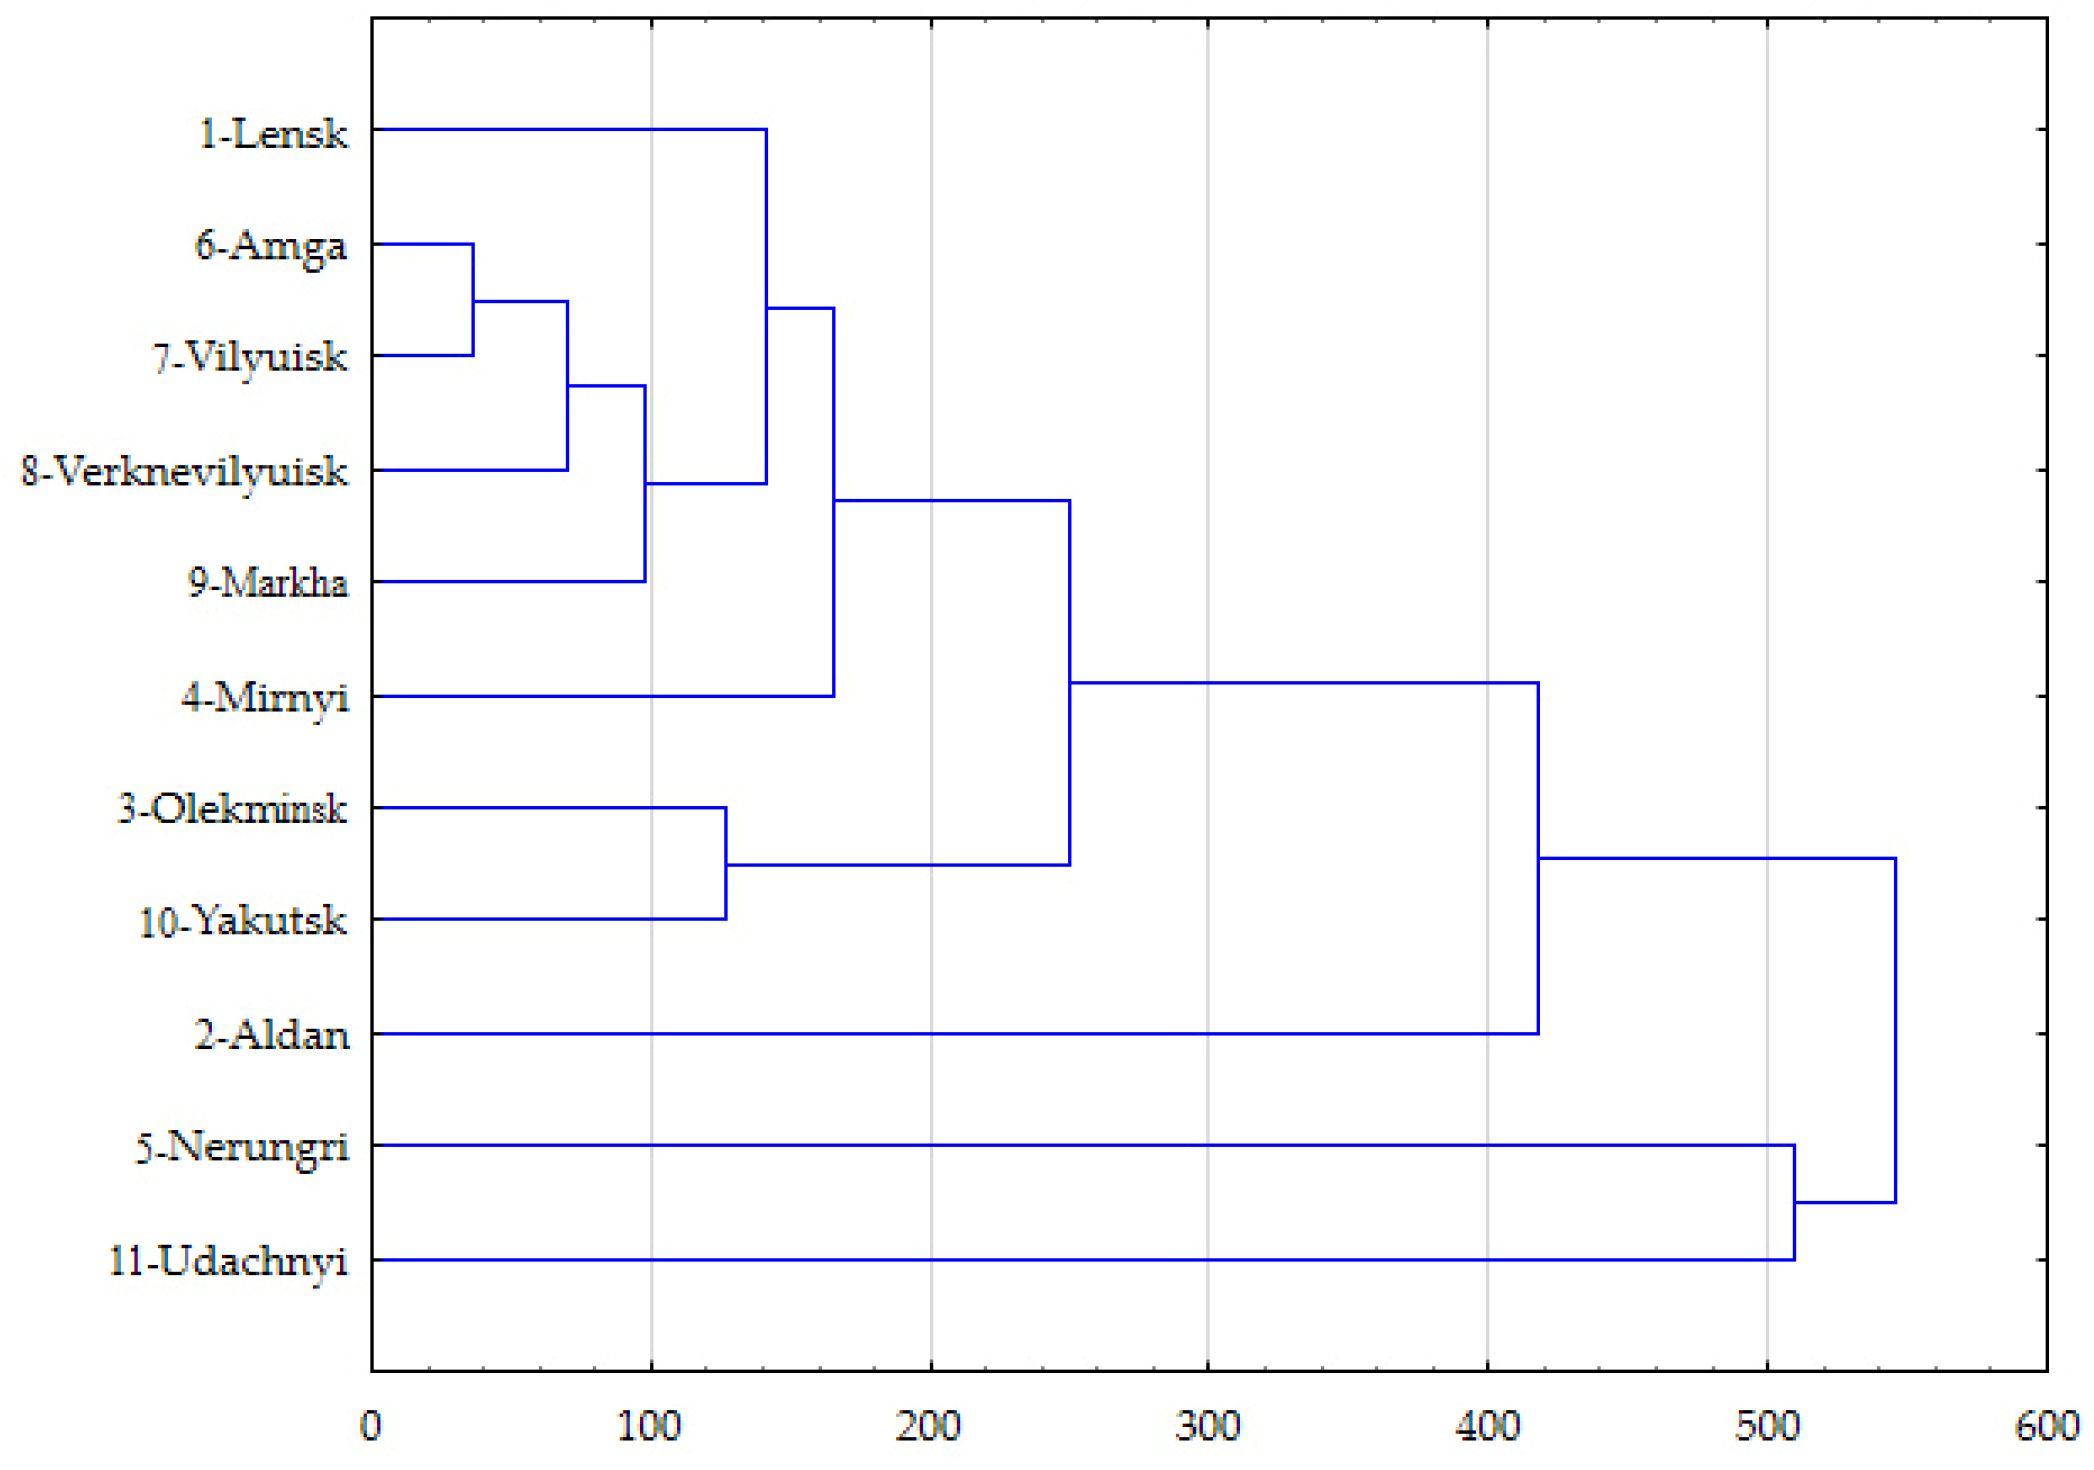
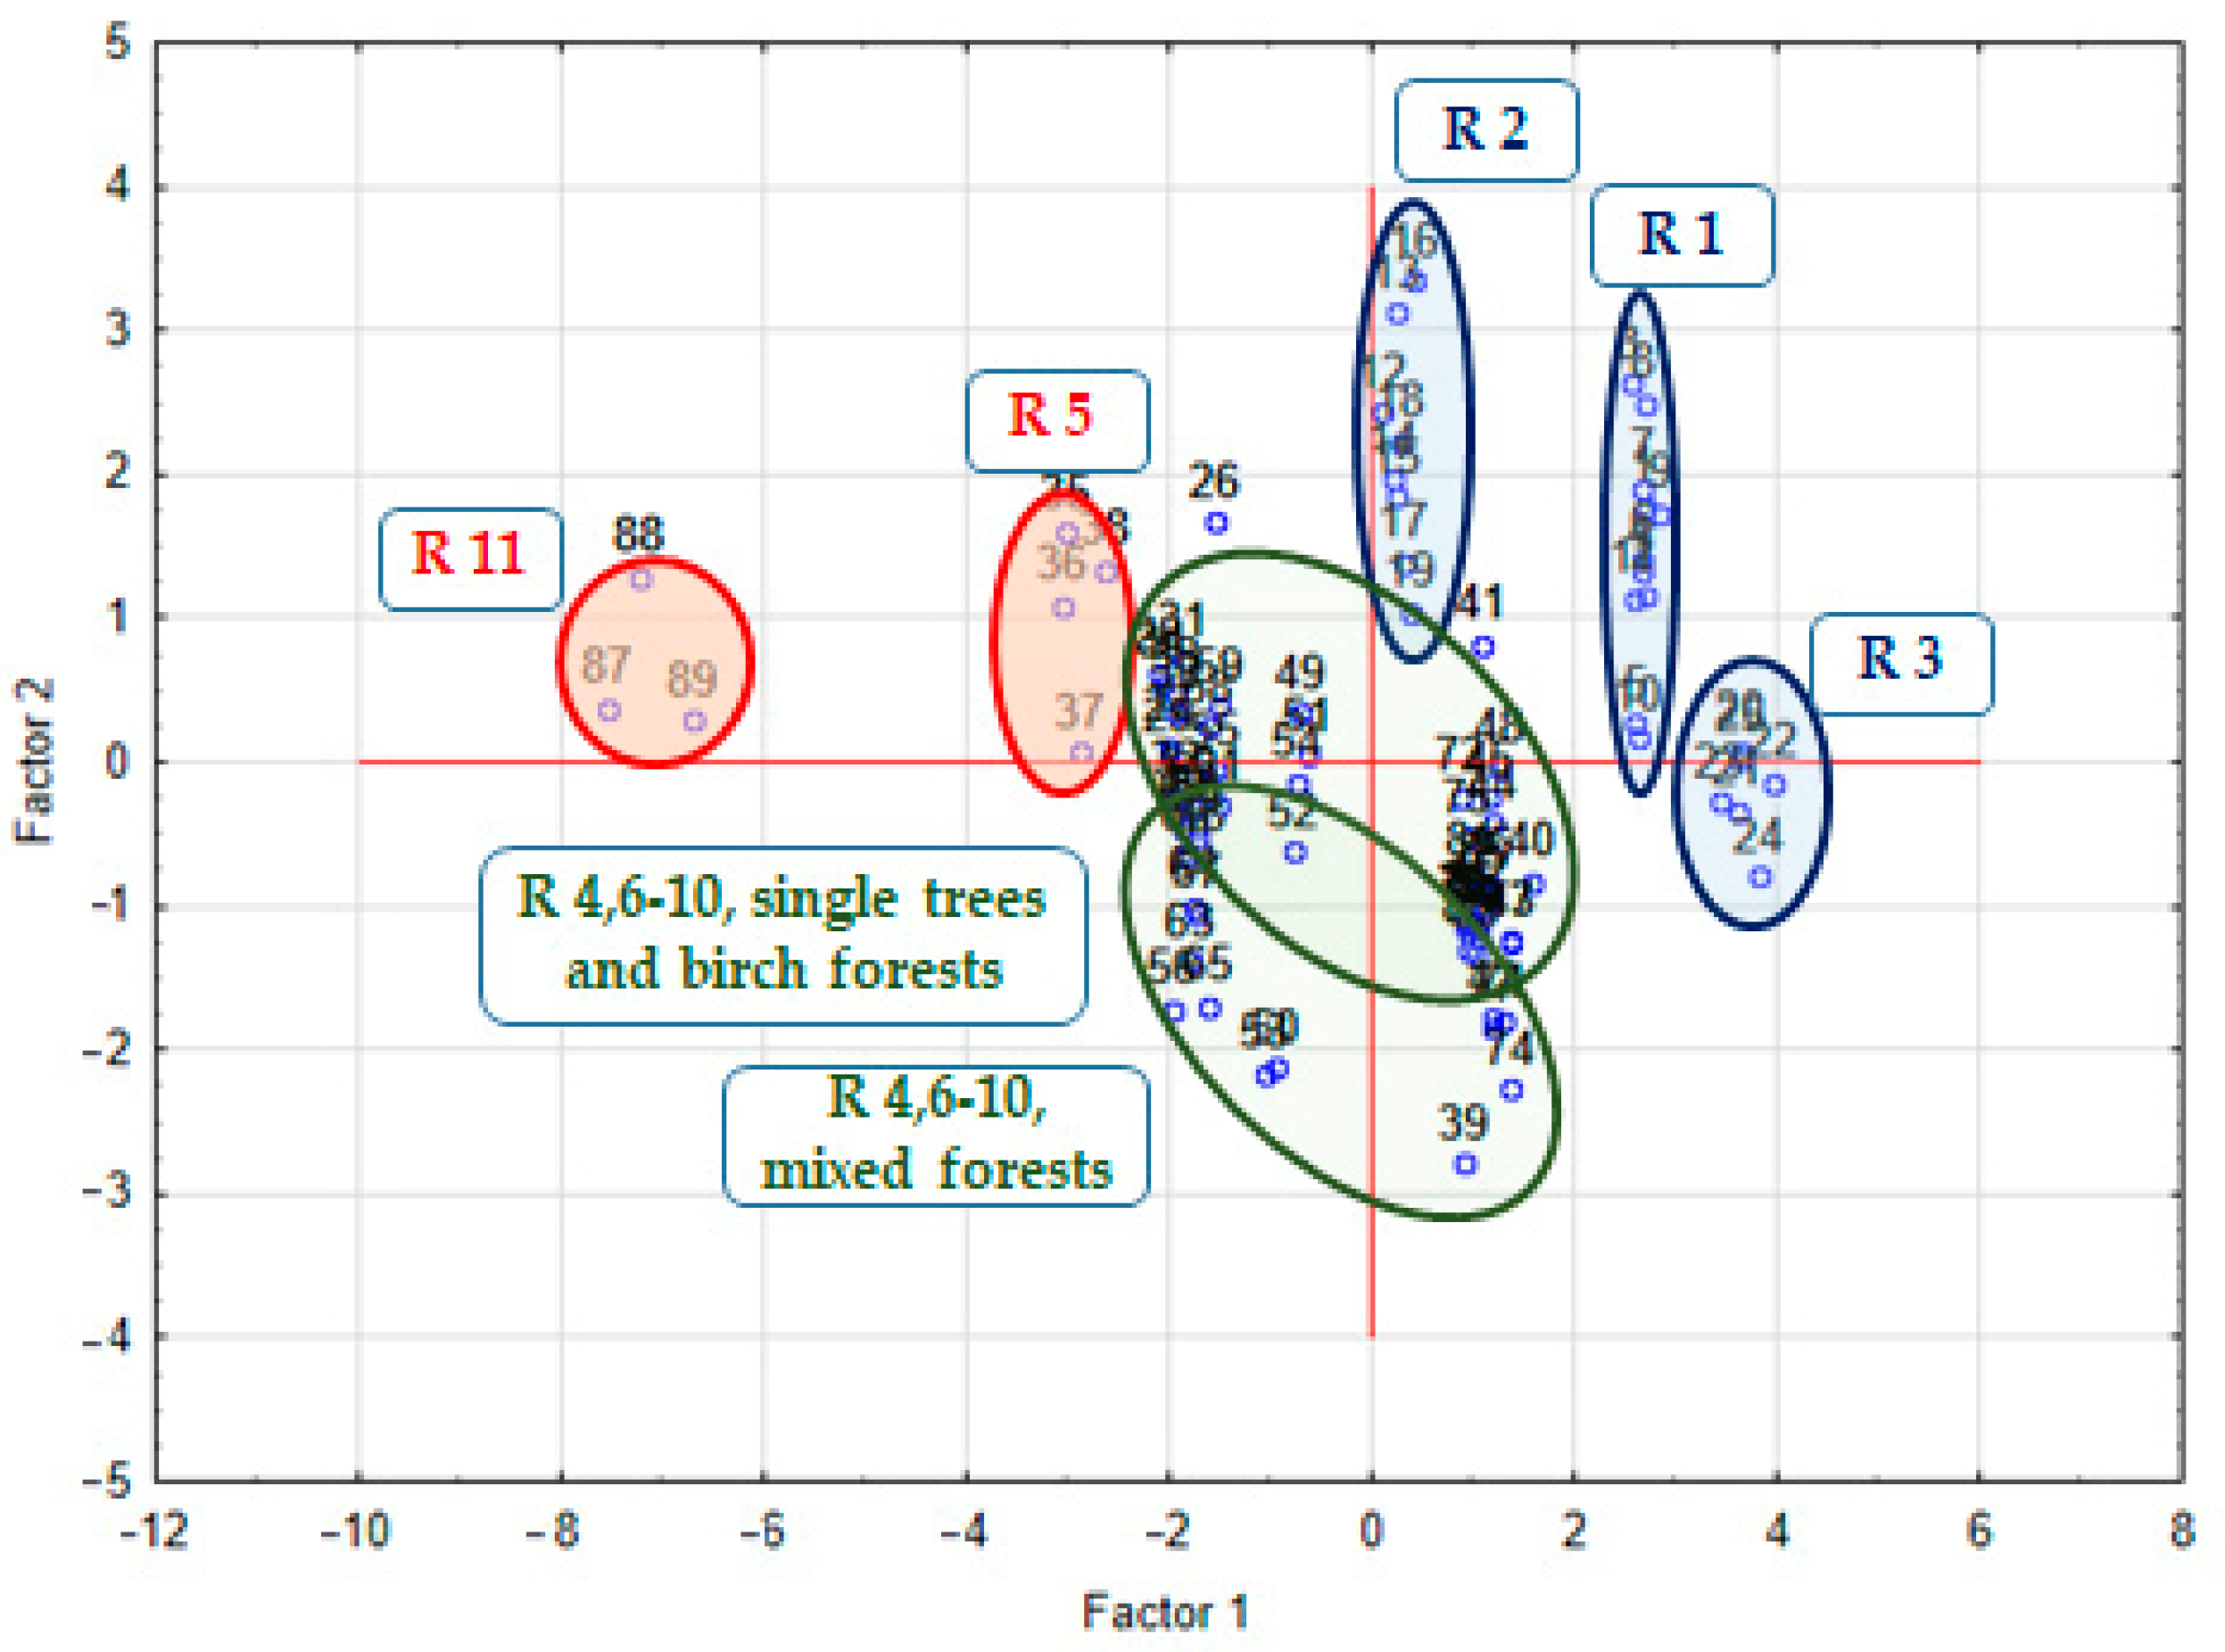
3.4. Geographical Differences in FA Manifestations

The analysis of geographical differences showed that within the middle taiga zone of Yakutia, the FA level of the silver birch from similar biotopes can be characterized by similar figures, 0.041–0.047 (Table 2), while in the north of Yakutia, near the edge of the natural range of the silver birch, the FA level was 0.048–0.054, which is significantly higher than in most natural biotopes of Central, South, and West Yakutia and is comparable to that of plants from technogenically transformed communities [13,15].
An increase in FA level was also observed in the region 5, on the northern spurs of the Stanovoy Range (South Yakutia), where FA level in sparse-forest biotopes varied within 0.048–0.054. The birch there is concentrated in biotopes located at a height of up to 800–850 m above sea level, characterized by depression of forest vegetation, and represented by birch and larch sparse forests with a pronounced undergrowth consisting of the dwarf birch Betula nana L., a species typical for tundra and forest–tundra. It should be noted that for even-aged trees of reproductive age, the differences between the regions within the taiga zone were observed mainly at the level of a tendency, and a statistically significant level was reached only when the birch trees from the northern sparse forest (region 11) were compared with the trees from regions 2 and 8 (Table 2). It is possible that the moderate statistical significance can be explained by the limitations of ANOVA. MANOVA showed a rather high significance for the “Region” factor along with other factors. A comparison of the average FA levels with the LEG by regions revealed a correlation of moderate significance between them (Spearman’s rho R = 0.66, t = 2.46, p < 0.05). An increase in FA level in the spurs of the Stanovoy Range and in the north of Yakutia (regions 5 and 11) indicates destabilization of ontogenetic processes. In the case of regions 5 and 11, we observed an effect of pessimization of the environment in the ecological periphery of the species range.
Disturbances in developmental stability in the mountains have also been observed by other authors [44,48,52,56]. Additionally, an increase in FA level, reflecting the destabilization of ontogeny, has been observed in plants and animals in the northern periphery of their geographic range [15,38,45,55,56].

3.5. Combined Effect of the Climatic, Biotic, and Abiotic Conditions on FA

The analysis of the combined effect of environmental factors revealed two groups of factors that significantly affect the developmental stability of Betula pendula. The first principal component, which makes up more than 35% of the total load, includes climatic and geographical conditions, such as the latitude–elevation gradient (LEG) and the general climate inclemency (GCI), and among the climatic conditions, the more important role is played by parameters of the warm seasons: the spring inclemency (expressed primarily in temperature conditions, because precipitation in spring is quite low), the summer inclemency, the sum of active temperatures of above +5 °C, and the duration of the vegetative period (Table 3). It appears that in conditions of sharply continental climate, winter precipitation plays an insignificant role. The studied territory is characterized by a high degree of water availability: the total length of the river network of Yakutia is over two million km, and the number of lakes with an area of more than 1 ha exceeds 800,000 [64]. Moreover, during summer, thawing permafrost makes a major contribution to the balance of the moisture regime of soils. Low winter temperatures also play a very small role in the study area, since during this period, the plants are in the state of winter dormancy. Naturally, this applies only within the limits of the species survivability. The share of the second principal component is 13.8%; it includes FA, lighting conditions, and the type of plant association. For visualization of the results, we removed the recurring values; as a result, not 130, but 89 samples were plotted in the space of the two principal components (Figure 9).
In Figure 9, there are two distinctly isolated groups of points related to the peripheral populations of the species (regions 5 and 11), while all other regions have a less pronounced distinction and overlap to one degree or another. Conditionally, one can distinguish among them three southern populations (1–3), i.e., regions with relatively high average annual temperatures. It should be noted that their contours almost do not overlap with each other, which are associated with the specifics of these regions and biotopes. Region 1 is characterized by the most favorable climate and is represented mainly by biotopes with good lighting conditions (within the examined material). This is also the only region in our study without continuous permafrost; it is assumed that the proximity of permafrost has a negative effect on the root system of woody plants [66]. Region 2, Aldan, as already mentioned, is characterized by a relatively higher precipitation, which in conditions of sharply continental climate is a positive characteristic. Region 3, Olekma, differs from the others in that, at the time when the material was being collected, deciduous trees there suffered heavily from damage caused by diseases and pests. We collected leaves from birches affected by leaf-eating insects and fungal diseases; eight samples of Betula pendula were examined, and the degree of the damage was assessed. For control, intact leaves from trees growing in the same biotope were collected in each case. For the affected leaves, FA level varied within 0.050–0.061; for the control, 0.046–0.047; and on the whole, the FA disturbances were more pronounced in the case of fungal damage (Spearman’s rho 0.89, p < 0.05). Previously, similar trends were found in the basket willow Salix viminalis L., 1753 and the bird cherry Prunus padus L., 1753 afflicted by gall-inducing insects and ticks [56]. A regression analysis of the combined data on the three species revealed that a statistically significant contribution to the increase in FA level was made only by the damage extent and lamina deformation extent (t = 4.19, p < 0.05). The effect of pests and parasites on developmental stability of plants at the moment appears to be understudied. There are different opinions on this matter; for example, Gelashvili et al. point out the effect of bacterial, fungal, and viral diseases on FA of the birch, while emphasizing that what is significant is not the fact of the disease, but the extent to which the tree is weakened [51]. Some authors have observed that the damage caused by insect pests correlates with an increased FA level of the tree [52,54,85,86,87]. At the current stage of research, we cannot argue with certainty that in the case of damage by pests, the increase in FA level reflects the destabilization of ontogeny; it is possible that this is a consequence of mechanical damage to the leaf.
It is noteworthy that during the PCA, a part of the previously examined parameters, significant within the limits of separate samples, did not show a significant factor load for the entire array of data as a whole. These include the tree age and the leaf size. In that regard, we should point out that in the course of the preliminary study, we noted their potential influence on FA of the silver birch, but our main goal in the present work was to study the influence of climatic and other external natural factors, so the main volume of the material was collected from the trees of reproductive age, and the size of the leaves collected was average for the species. It is also possible that the contribution of these factors to FA magnitude is only minor compared to more significant environmental factors.
It should be noted that the trends of the impact of climate on developmental stability of Betula pendula found in this study are not necessarily observed throughout its geographic range. In some previous studies, a comparison of FA of the birch from the European and Asian parts of its range showed that, firstly, the stress-inducing effect of climatic factors had less of an impact than anthropogenic factors [36,39], and secondly, when comparing more remote sites, the leading climatic factor was the duration of the growing season and the total precipitation [36,39]. The data we obtained previously do not contradict the results of the present study: the duration of the growing season was one of the leading factors affecting developmental stability of the birch in all three studies, and the role of the total precipitation is unequal due to the differences in the sites selected. In the first studies, we compared the influence of the moderate climate of the European part of the range with the continental climate of Central Siberia and the sharply continental climate of the north-east of Siberia. Their comparison showed the significance of the precipitation factor, while in this study, all the sites are characterized by a sharply continental climate with little precipitation (even region 2, Aldan, which we describe as relatively humid, is characterized by significantly lower precipitation than the European part of the Betula pendula range). It can be assumed that in this case, the minor differences in precipitation do not reach the threshold level, while changes in FA, being indicative of the developmental homeostasis, are threshold-level in nature [1,2,4,88,89].

4. Conclusions

Developmental stability and, consequently, the FA level of woody plant lamina in natural biotopes varies in a wide range. An increased FA level in the silver birch is characteristic of senile plants and young shoots developing from the radical buds of old plants; this is a reflection of the weakened state of the individuals from these intrapopulation groups. An increased FA level in senile plants and young shoots from radical buds at the final stages of their ontogeny presumably is associated with a general decrease in vitality with age. We noted a manifestation of intraindividual variability in manifestations of the leaf FA: in the same plant, this parameter can vary during summer and depend on the lamina size; these intraindividual differences are a reflection of the development of the organ, but are not indicative of disturbances in developmental stability of the individual.
The following factors were found to be of significance: climate, biotopic conditions, latitude, and elevation of the terrain above the sea level. An increase in FA level was observed in the ecological periphery of the range (northern or montane), in conditions of insufficient lighting or excessive soil moisture, and on poor rocky soils. In conditions of the sharply continental climate of the north-east of Siberia, developmental stability of deciduous trees was affected the most by the duration of the growing period, the sum of effective temperatures of above +5 °C, and the conditions of the warm season. The temperature conditions of spring had a slightly lesser effect. We assume that on the scale of the Betula pendula range, more favorable conditions of moderate climate are manifested primarily in more abundant precipitation, which leads to the FA of the leaf there being usually lower than in regions with a sharply continental climate, which indicates a lower stress level and, as a result, a higher developmental stability of the species. The data obtained demonstrate the high influence of natural stress-inducing factors on the stability of the individual development of plants.

Author Contributions

Conceptualization, E.S.; methodology, investigation, E.S. and V.S.; formal analysis, writing, visualization, E.S. and N.T. All authors have read and agreed to the published version of the manuscript.

Funding

This research received no external funding.

Institutional Review Board Statement

Not applicable.

Informed Consent Statement

Not applicable.

Data Availability Statement

Not applicable.

Acknowledgments

We thank the students and postgraduates who took part in the collection and processing of the material, Natalia Alekseeva, Lidia Makeeva, Sardana Kurchatova, and Evgenia Lutskan; we are also grateful to Nyurguyana Egorova for providing geobotanical descriptions and assessments of crown density in the forests. The investigations were performed as a part of the state assignment of Institute for biological problems of cryolithozone SB RAS, “Vegetation cover of the cryolithozone of the taiga Yakutia: biodiversity, environment-forming role, protection and rational use” (scientific topic code: FWRS-2021-0023; state registration number in the USISU: 1021061710089-0). This research was also funded by Mari State University Strategic Academic Leadership Program (PRIORITY-2030).

Conflicts of Interest

The authors declare no conflict of interest. The funders had no role in the design of the study; in the collection, analyses, or interpretation of data; in the writing of the manuscript; or in the decision to publish the results.

References

  1. Zakharov, V.M. Asimmetriya Zhivotnykh: Populyatsionno-Fenogeneticheskii Podkhod (Animal Asymmetry: Population-Phenogenetic Approach); Nauka: Moscow, Russia, 1987; p. 216. (In Russian) [Google Scholar]
  2. Leary, R.F.; Allendorf, F.W. Fluctuating asymmetry as an indicator of stress: Implications for conservation biology. Trends Ecol. Evol. 1989, 4, 214–217. [Google Scholar] [CrossRef] [PubMed]
  3. Palmer, R.A.; Strobeck, C. Fluctuating assymmetry: A measurement, analysis, patterns. Ann. Rev. Ecol. Syst. 1986, 17, 391–421. [Google Scholar] [CrossRef]
  4. Parsons, P.A. Fluctuating asymmetry: An epigenetic measure of stress. Biol. Rev. 1990, 65, 131–145. [Google Scholar] [CrossRef] [PubMed]
  5. Parsons, P.A. Fluctuating asymmetry: A biological monitor of environmental and genomic stress. Heredity 1992, 68, 361–364. [Google Scholar] [CrossRef] [PubMed] [Green Version]
  6. Zakharov, V.M.; Krysanov, E.Y. (Eds.) Posledstviya Chernobyl’skoi Katastrofy: Zdorov’e Sredy (Consequences of the Chernobyl Disaster: Environmental Health); Tsentr Ekologicheskoi Politiki Rossii: Moscow, Russia, 1996; p. 170. (In Russian) [Google Scholar]
  7. Oleksyk, T.K.; Novak, J.M.; Purdue, J.R.; Gashchak, S.P.; Smith, M.H. High levels of fluctuating asymmetry in populations of Apodemus flavicollis from the most contaminated areas in Chornobyl. J. Environ. Radioactiv. 2004, 73, 1–20. [Google Scholar] [CrossRef] [Green Version]
  8. Shadrina, E.G.; Soldatova, V.Y.; Shadrin, D.Y.; Kapitonova, N.N. Evaluation of Environmental Quality by the Indices of Disturbance of Stable Development in Plants and Animals in the Conditions of Permanently Increased Radiation Background over the Yakutia Territory. Reg. Environ. Issues 2008, 2, 91–95. [Google Scholar]
  9. Fuller, N.; Smith, J.T.; Nagorskaya, L.L.; Gudkov, D.I.; Ford, A.T. Does Chernobyl-derived radiation impact the developmental stability of Asellus aquaticus 30 years on? Sci. Total Environ. 2017, 576, 242–250. [Google Scholar] [CrossRef] [Green Version]
  10. Pankakoski, E.; Koivisto, I.; Hyvärinen, H. Reduced developmental stability as an indicator of heavy metal pollution in the common shrew Sorex araneus. Acta Zool. Fenn. 1992, 191, 137–144. [Google Scholar]
  11. Chubinishvili, A.T. Homeostasis in the populations of marsh frog (Rana ridibunda Pall) living in conditions of chemical pollution in the area of the Middle Volga. Russ. J. Ecol. 1998, 1, 71–74. [Google Scholar]
  12. Zakharov, V.M.; Chubinishvili, A.T.; Dmitriev, S.G.; Baranov, A.S.; Borisov, V.I.; Valetskii, A.V.; Krysanov, E.U.; Kryazheva, N.G.; Pronin, A.V.; Chistyakova, E.K. Zdorov’e Sredy: Praktika Otsenki (Health of the Environment: Assessment Practice); Tsentr Ekologicheskoi Politiki Rossii: Moscow, Russia, 2000; p. 320. (In Russian) [Google Scholar]
  13. Shadrina, E.G.; Vol’pert, Y.L.; Danilov, V.A.; Shadrin, D.Y. Bioindikatsiya Vozdeistviya Gornodobyvayushchei Promyshlennosti Na Nazemnye Ekosistemy Severa (Morfogeneticheskii Podkhod) (Bioindication Impact of Mining on Terrestrial Ecosystems of the North (Morphogenetic Approach)); Savvinov, D.D., Ed.; Nauka, Sib. Otdelenie: Novosibirsk, Russia, 2003; p. 110. (In Russian) [Google Scholar]
  14. Lens, L.; Eggermont, H. Fluctuating asymmetry as a putative marker of human-induced stress in avian conservation. Bird Conserv. Int. 2008, 18, S125–S143. [Google Scholar] [CrossRef] [Green Version]
  15. Shadrina, E.G.; Vol’pert, Y.L. Developmental Instability of the Organism as a Result of Pessimization of Environment under Anthropogenic Transformation of Natural Landscapes. Russ. J. Dev. Biol. 2014, 45, 117–126. [Google Scholar] [CrossRef]
  16. Zhelev, Z.M.; Popgeorgiev, G.S.; Arnaudov, A.D.; Georgieva, K.N.; Mehterov, N.H. Fluctuating Asymmetry in Pelophylax Ridibundus (Amphibia: Ranidae) as a Response to Anthropogenic Pollution in South Bulgaria. Arch. Biol. Sci. 2015, 67, 1009–1023. [Google Scholar] [CrossRef]
  17. Lutterschmidt, W.I.; Martin, S.L.; Schaefer, J.F. Fluctuating Asymmetry in Two Common Freshwater Fishes as a Biological Indicator of Urbanization and Environmental Stress within the Middle Chattahoochee Watershed. Symmetry 2016, 8, 124. [Google Scholar] [CrossRef] [Green Version]
  18. Guo, R.; Zhang, W.; Ai, S.; Ren, L.; Zhang, Y. Fluctuating asymmetry rather than oxidative stress in Bufo raddei can be an accurate indicator of environmental pollution induced by heavy metals. Environ. Monit. Assess 2017, 189, 293. [Google Scholar] [CrossRef] [PubMed]
  19. Shadrina, E.G.; Vol’pert, Y.L. Experience of Applying Plant and Animal Fluctuating Asymmetry in Assessment of Environmental Quality in Terrestrial Ecosystems: Results of 20-Year Studies of Wildlife and Anthropogenically Transformed Territories. Russ. J. Dev. Biol. 2018, 49, 23–35. [Google Scholar] [CrossRef]
  20. Zhelev, Z.M.; Tsonev, S.V.; Angelov, M.V. Fluctuating asymmetry in Pelophylax ridibundus meristic morphological traits and their importance in assessing environmental health. Ecol. Indic. 2019, 107, 105589. [Google Scholar] [CrossRef]
  21. Benítez, H.A.; Lemic, D.; Villalobos-Leiva, A.; Bažok, R.; Órdenes-Claveria, R.; Pajač Živković, I.; Mikac, K.M. Breaking Symmetry: Fluctuating Asymmetry and Geometric Morphometrics as Tools for Evaluating Developmental Instability under Diverse Agroecosystems. Symmetry 2020, 12, 1789. [Google Scholar] [CrossRef]
  22. Turmukhametova, N.V. Evaluation of the State of the Environment in Yoshkar-Ola Using Morphometric Indicators of Betula pendula Roth. Biol. Bull. 2020, 47, 191–197. [Google Scholar] [CrossRef]
  23. Kryazheva, N.G.; Chistyakova, E.K.; Zakharov, V.M. Analysis of stability of the development of Betula pendula under conditions of chemical pollution. Russ. J. Ecol. 1996, 27, 422–424. [Google Scholar]
  24. Turmukhametova, N.V.; Shivtsova, I.V. Morfologicheskii podhod k ocenke sostoyaniya sredy po asimmetrii lista Betula pendula Roth i Fragaria vesca L. (Morphological approach to assessing the state of the environment based on leaf asymmetry of Betula pendula Roth and Fragaria vesca L.). Lesn. Vestn. (For. Bull.) 2007, 5, 140–143. (In Russian) [Google Scholar]
  25. Vasil’ev, A.G.; Vasil’eva, I.A.; Marin, Y.F. Phenogenetic monitoring of the weeping birch (Betula pendula Roth.) in the Middle Urals: Testing a new method for assessing developmental instability in higher plants. Russ. J. Ecol. 2008, 39, 25–31. [Google Scholar] [CrossRef]
  26. Shadrina, E.G.; Volpert, Y.L.; Alekseeva, N.N.; Danilov, V.A.; Stepanova, T.M. Bioindikacionnaya ocenka izmeneniya kachestva okruzhayushchei sredy v rezul’tate vozdejstviya almazodobyvayushchih predpriyatii (Bioindicational Estimation of Environment Quality Changing As A Result of The Influence of Diamond Mining Companies). Gorn. Zhurnal 2012, 2, 84–87. (In Russian) [Google Scholar]
  27. Youssef, N.A.; Gurbanov, E.M.; Haciyeva, S.R.; Mammedova, A.O.; Khalilov, R.I. Antioxidant enzymes, fluctuating asymmetry and morphological changes of urban trees as an ecological indicators of heavy metal stress. Int. J. Pharm. Sci. Health Care 2013, 3. Available online: http://www.rspublication.com/ijphc/index.html (accessed on 15 April 2022).
  28. Erofeeva, E.A. Fluktuiruyushchaya asimmetriya lista Betula pendula (Betulacea) v usloviyah avtotransportnogo zagryazneniya (g. Nizhni Novgorod) (Dependence of leaf fluctuating asymmetry of Betula pendula (Betulacea) on motor traffic pollution intensity). Rastit. Resur. 2015, 51, 366–383. (In Russian) [Google Scholar]
  29. Ivanov, V.P.; Ivanov, Y.V.; Marchenko, S.I.; Kuznetsov, V.V. Application of fluctuating asymmetry indexes of silver birch leaves for diagnostics of plant communities under technogenic pollution. Russ. J. Plant Physiol. 2015, 62, 340–348. [Google Scholar] [CrossRef]
  30. Rodrigues, R.A.R.; Vaz, V.C.; Sato, A.; Arruda, R.C.O.; de Castro, W.A.C.; da Silva-Matos, D.M. Structural leaf changes in trees around a subway air duct. Rev. Árvore Viçosa-MG 2015, 39, 417–421. [Google Scholar] [CrossRef] [Green Version]
  31. Shadrina, E.; Vol’pert, Y.; Soldatova, V.; Alekseeva, N.; Pudova, T. Evaluation of Environmental Conditions in Two Cities of East Siberia Using Bioindication Methods (Fluctuating Asymmetry Value and Mutagenic Activity of Soils). Int. J. Biol. 2015, 7, 20–32. [Google Scholar] [CrossRef]
  32. Shadrina, E.G.; Pudova, T.M.; Soldatova, V.Y.; Legostaeva, Y.B. Bioindicational Assessment Of Environmental Quality In Habitats Exposed To Geological Exploration For Hydrocarbon (Oil And Gas) Deposits In The West Yakutia. In Proceedings of the 15th International Multidisciplinary Scientific Geoconference SGEM 2015—Ecology, Economics, Education and Legislation, Albena, Bulgaria, 18–24 June 2015; Volume 1, pp. 95–102. [Google Scholar]
  33. Mendes, G.; Boaventura, M.G.; Cornelissen, T. Fluctuating Asymmetry as a Bioindicator of Environmental Stress Caused by Pollution in a Pioneer Plant Species. Environ. Entomol. 2018, 47, 1479–1484. [Google Scholar] [CrossRef]
  34. Erofeeva, E.A.; Yakimov, B.N. Change of Leaf Trait Asymmetry Type in Tilia cordata Mill. and Betula pendula Roth under Air Pollution. Symmetry 2020, 12, 727. [Google Scholar] [CrossRef]
  35. Prihod’ko, S.A.; Shtirc, Y.A. Primenenie morfogeometricheskogo metoda dlya opredeleniya pokazatelej fluktuiruyushchej asimmetrii listovoj plastinki Aser pseudoplatanus L. (Application of the morphometric method for determining the indicators of fluctuating asymmetry leaf plate Acer pseudoplatanus L.). Ukr. J. Ecol. 2018, 8, 194–210. (In Russian) [Google Scholar]
  36. Shadrina, E.; Turmukhametova, N.; Soldatova, V.; Vol’pert, Y.; Korotchenko, I.; Pervyshina, G. Fluctuating Asymmetry in Morphological Characteristics of Betula Pendula Roth Leaf under Conditions of Urban Ecosystems: Evaluation of the Multi-Factor Negative Impact. Symmetry 2020, 12, 1317. [Google Scholar] [CrossRef]
  37. Turmukhametova, N.; Shadrina, E. Changes in the Fluctuating Asymmetry of the Leaf and Reproductive Capacity of Betula pendula Roth Reflect Pessimization of Anthropogenically Transformed Environment. Symmetry 2020, 12, 1970. [Google Scholar] [CrossRef]
  38. Zakharov, V.M.; Shadrina, E.G.; Turmukhametova, N.V.; Ivantsova, E.N.; Shikalova, E.A.; Soldatova, V.Y.; Sharova, N.A.; Trofimov, I.E. Assessment of Plant Status by Stability of Development in Natural and Anthropogenic Conditions (Fluctuating Asymmetry of Leaf Characters of Silver Birch, Betula pendula Roth). Biol. Bull. 2020, 47, 186–190. [Google Scholar] [CrossRef]
  39. Turmukhametova, N.V.; Shadrina, E.G.; Soldatova, V.Y.; Ivantsova, E.N. Fluctuating asymmetry of the lamina of Betula pendula Roth in the context of different cities and industrial load. IOP Conf. Ser. Earth Environ. Sci. 2021, 839, 052011. [Google Scholar] [CrossRef]
  40. Murphy, H.T.; Lovett-Doust, J. Landscape-Level Effects on Developmental Instability: Fluctuating Asymmetry across the Range of Honey Locust, Gleditsia triacanthos (Fabaceae). Int. J. Plant Sci. 2004, 165, 795–803. [Google Scholar] [CrossRef]
  41. Ambo-Rappe, R.; Lajus, D.L.; Schreider, M.J. Translational Fluctuating Asymmetry and Leaf Dimension in Seagrass, Zostera capricorni Aschers in a Gradient of Heavy Metals. Environ. Bioindic. 2007, 2, 99–116. [Google Scholar] [CrossRef]
  42. Koroteeva, E.V.; Veselkin, D.V.; Kuyantseva, N.B.; Chashchina, O.E. The size, but not the fluctuating asymmetry of the leaf, of silver birch changes under the gradient influence of emissions of the Karabash Copper Smelter Plant. Dokl. Biol. Sci. 2015, 460, 36–39. [Google Scholar] [CrossRef]
  43. Sandner, T.M.; Matthies, D. Fluctuating asymmetry of leaves is a poor indicator of environmental stress and genetic stress by inbreeding in Silene vulgaris. Ecol. Indic. 2017, 79, 247–253. [Google Scholar] [CrossRef]
  44. Zverev, V.; Lama, A.D.; Kozlov, M.V. Fluctuating asymmetry of birch leaves did not increase with pollution and drought stress in a controlled experiment. Ecol. Indic. 2018, 84, 283–289. [Google Scholar] [CrossRef]
  45. Zakharov, V.M.; Zhdanova, N.P.; Kirik, E.F.; Shkil, F.N. Ontogenesis and Population: Evaluation of Developmental Stability in Natural Populations. Russ. J. Dev. Biol. 2001, 32, 336–351. [Google Scholar] [CrossRef]
  46. Freeman, D.C.; Graham, J.H.; Emlen, J.M. Developmental stability in plants: Symmetries, stress and epigenesis. Genetica 1993, 89, 97–119. [Google Scholar] [CrossRef]
  47. Rettig, J.E.; Fuller, R.C.; Corbett, A.L.; Getty, T. Fluctuating Asymmetry Indicates Levels of Competition in an Even-Aged Poplar Clone. Oikos 1997, 80, 123–127. [Google Scholar] [CrossRef]
  48. Wilsey, B.J.; Haukioja, E.; Koricheva, J.; Sulkinoja, M. Leaf fluctuating asymmetry increases with Hybridization and elevation in tree-line birches. Ecology 1998, 79, 2092–2099. [Google Scholar] [CrossRef]
  49. Hagen, S.B.; Folstad, I.; Jakobsen, S.W. Autumn colouration and herbivore resistance in mountain birch (Betula pubescens). Ecol. Lett. 2003, 6, 807–811. [Google Scholar] [CrossRef]
  50. Freeman, D.C.; Brown, M.L.; Duda, J.J.; Graraham, J.H.; Emlen, J.M.; Krzysik, A.J.; Balbach, H.; Kovacic, D.A.; Zak, J.C. Leaf fluctuating asymmetry, soil disturbance and plant stress: A multiple year comparison using two herbs, Ipomoea pandurata and Cnidoscolus stimulosus. Ecol. Indic. 2005, 5, 85–95. [Google Scholar] [CrossRef]
  51. Gelashvili, D.B.; Lobanova, I.V.; Yerofeeva, E.A.; Naumova, M.M. Vliyanie lesopatologicheskogo sostoyaniya breezy povisloj na velichinu fluktuiruyushchej asimmetrii listovoj plastinki (Influence of the phytopathologic state of Betula pendula Roth. fluctuating asymmetry of its leaf laminae). Povolzhskiy J. Ecol. 2007, 2, 106–115. (In Russian) [Google Scholar]
  52. Hagen, S.B.; Ims, R.A.; Yoccoz, N.G.; Sørlibraten, O. Fluctuating asymmetry as an indicator of elevation stress and distribution limits in mountain birch (Betula pubescens). Plant Ecol. 2008, 195, 157–163. [Google Scholar] [CrossRef]
  53. Xu, Z.; Hu, T.; Zhang, Y. Effects of experimental warming on phenology, growth and gas exchange of treeline birch (Betula utilis) saplings, Eastern Tibetan Plateau, China. Eur. J. Forest Res. 2012, 131, 811–819. [Google Scholar] [CrossRef]
  54. Santos, J.C.; Alves-Silva, E.; Cornelissen, T.G.; Fernandes, G.W. The effect of fluctuating asymmetry and leaf nutrients on gall abundance and survivorship. Basic Appl. Ecol. 2013, 14, 489–495. [Google Scholar] [CrossRef]
  55. Shadrina, E.; Volpert, Y. Fluctuating Asymmetry of Craniological Features of Small Mammals as a Reflection of Heterogeneity of Natural Populations. Symmetry 2016, 8, 142. [Google Scholar] [CrossRef] [Green Version]
  56. Shadrina, E.G.; Soldatova, V.Y. Vliyanie bioticheskih i abioticheskih faktorov na proyavleniya fluktuiruyushchei asimmetrii v populyaciyah drevesnyh rastenii (na primere Yakutii) (Influence of biotic and abiotic factors on the manifestations of fluctuating asymmetry in populations of woody plants (on the example of Yakutia)). In Proceedings of the Problemy Populyacionnoi Biologii (Problems of Population Biology), Yoshkar-Ola, Russia, 11–14 April 2017; p. 260262. (In Russian). [Google Scholar]
  57. Zakharov, V.M.; Sikorski, M.D. Inbreeding and developmental stability in a laboratory strain of the bank vole Clethrionomys glareolus. Acta Theriol. 1997, 4, 73–78. [Google Scholar] [CrossRef] [Green Version]
  58. Siikamaki, P. Developmental instability in hybrids between Lychnis viscaria and Lychnis alpina (Caryophyllaceae). Am. J. Bot. 1999, 86, 1683–1686. [Google Scholar] [CrossRef] [PubMed]
  59. Botanic Gardens, Kew and Missouri Botanical (Garden). The Plant List. A working List of All Plant Species. Betula pendula Roth is an Accepted Name. Version 1.1. Published on the Internet; 2013. Available online: http://www.theplantlist.org/ (accessed on 31 July 2020).
  60. Afonin, A.N.; Greene, S.; Frolov, A. Interactive Agricultural Ecological Atlas of Russia and Neighboring Countries. Economic Plants and their Diseases, Pests and Weeds. 2009. Available online: http://www.agroatlas.ru (accessed on 22 April 2022).
  61. Kuznetcova, L.V.; Zakharova, V.I. Konspekt Flory Yakutii: Sosudistye Rasteniya (A Compendium of the Flora of Yakutia); Nauka: Novosibirsk, Russia, 2012; p. 272. (In Russian) [Google Scholar]
  62. Zhukova, L.A.; Dorogova, Y.A.; Turmuhametova, N.V.; Zhukova, L.A. (Eds.) Ekologicheskie Shkaly i Metody Analiza Ekologicheskogo Raznoobraziya Rastenii (Ecological Indicator Values and Methods of Analysis of Ecological Diversity of Plants); Mari State University: Yoshkar-Ola, Russia, 2010; p. 368. [Google Scholar]
  63. Dorogova, Y.A.; Zhukova, L.A.; Turmuhametova, N.V.; Polyanskaya, T.A.; Notov, A.A.; Dementyeva, S.M. Methods of Analysis of Environmental Diversity of Plants. Biol. Med. 2016, 8, 354. [Google Scholar] [CrossRef]
  64. Volpert, Y.K.; Danilov, P.P.; Danilov, Y.G.; Isaev, A.P.; Nikolin, E.G.; Pakhomova, L.S.; Pestryakova, L.A.; Petrova, A.N.; Savvinov, D.D.; Savvinov, G.N.; et al. Republic of Sakha (Yakutia). 7.3. Physical geography. In Geography of Siberia in the Early 21st Century; Korytny, L.M., Tulokhonov, A., Eds.; Geo: Novosibirsk, Russia, 2016; Volume 6, pp. 317–336. (In Russian) [Google Scholar]
  65. Ivanov, I.N. (Ed.) Yakutia, Historical and Cultural Atlas; Publishing and Production Center “Design, Information. Cartography”: Moscow, Russia, 2007; p. 869. (In Russian) [Google Scholar]
  66. Shcherbakov, I.P. Lesnoi Pokrov Severo-Vostoka SSSR (Forest Cover of the North-East of the USSR). Nauka, Siberian Branch: Novosibirsk, Russia, 1975. (In Russian) [Google Scholar]
  67. Timofeev, P.A. Lesa Yakutii. Sostav, Resursy, Ispol’zovanie i Ohrana (Forests of Yakutia. Composition, Resources, Use and Protection); Isaev, A.P., Ed.; Publishing House of the Siberian Branch of the Russian Academy of Sciences: Novosibirsk, Russia, 2003; p. 194. (In Russian) [Google Scholar]
  68. Sukachev, V.N.; Zonn, S.V. Metodicheskie Ukazaniya k Izucheniyu Tipov Lesa (Methodological Guidelines for the Study of Forest Types); Publishing House of the USSR Academy of Sciences: Moscow, Russia, 1961. [Google Scholar]
  69. Weather Archives. Yakutia, Russia. Pogodaiklimat (Weather and Climate). Available online: http://www.pogodaiklimat.ru/history/24959_3.htm (accessed on 15 April 2020). (In Russian).
  70. Agroklimaticheskij Spravochnik po Yakutskoi ASSR (Agro-Climatic Guide of the Yakut ASSR); Hydrometeoizdat: Leningrad, Russia, 1963. (In Russian)
  71. Smirnova, N.S. (Ed.) Nauchno-Prikladnoj Spravochnik po Klimatu SSSR (Scientific and Applied Reference Book on the Climate of the USSR); Ser. 3, Book 1; Hydrometeoizdat: Leningrad, Russia, 1989; Volume 24, p. 607. (In Russian) [Google Scholar]
  72. Zakharov, V.M.; Baranov, A.S.; Borisov, V.I.; Valetskii, A.V.; Kryazheva, N.G.; Chistyakova, E.K.; Chubinishvili, A.T. Zdorov’eSredy: Metodika Otsenki (Health of the Environment: Metodology Evaluation); Tsentr Ekologicheskoi Politiki Rossii: Moscow, Russia, 2000; p. 68. (In Russian) [Google Scholar]
  73. Statistica. StatSoft Russia. Available online: http://statsoft.ru/company/ (accessed on 19 April 2021).
  74. Sokal, R.R.; Rohlf, F.J. Biometry: The Principles and Practice of Statistics in Biological Research, 3rd ed.; W.H. Freeman and Co.: New York, NY, USA, 1995; p. 887. [Google Scholar]
  75. Voropaev, G.V.; Avakian, A. (Eds.) Vodohranilishcha i ih Vozdejstvie na Okruzhayushchuyu Sredu (Reservoirs and Their Impact on the Environment); Nauka: Moscow, Russia, 1986; p. 366. (In Russian) [Google Scholar]
  76. Shadrina, E.G. Vilyujskij Gidrouzel: Social’no-Ekologicheskie Posledstviya (Vilyuysky Hydroelectric Power Plant: Socio-ECOLOGICAL Consequences). Available online: https://www.plotina.net/experts/vilyujskij-gidrouzel-socialno-ekologicheskie-posledstviya/ (accessed on 22 April 2022). (In Russian).
  77. Soldatova, V.Y.; Samsonova, A.P. Vliyanie ekologicheskih uslovij gorodskoj sredy na kachestvo semyan i morfologicheskie pokazateli listovoj plastinki berezy povisloj Betula pendula Roth (The influence of environmental conditions of the urban environment on the quality of seeds and morphological indicators of the Birch leaf blade (Betula pendula Roth). Probl. Reg. Ekol. 2018, 6, 12–15. (In Russian) [Google Scholar]
  78. Dolgoshov, V.I. Urozhainost’ plodov glavneishikh drevesnykh porod i kustarnikov (Fruit yield of the main species of trees and shrubs). Geogr. Sb. 1963, 16, 131–149. (In Russian) [Google Scholar]
  79. Stukov, V.I. Osobennosti tsveteniya i plodonosheniya berezy borodavchatoi v Saratovskom Povolzh’e (Specifics of blossoming and fruit producing in the silver birch in Povolzhye in the vicinity of Saratov). Lesn. Khozyaistvo (For. Manag.) 1967, 8, 37–38. (In Russian) [Google Scholar]
  80. Danchenko, A.M. Biologiya Plodonosheniya i Osnovy Semenodostva Berezy (Biology of Fruit Bearing and the Basics of Seed Farming of the Birch); ILID Publisher: Krasnoyarsk, Russia, 1992; p. 126. (In Russian) [Google Scholar]
  81. Alves-Silva, E.; Del-Claro, K. Effect of post-fire resprouting on leaf fluctuating asymmetry, extrafloral nectar quality, and ant–plant–herbivore interactions. Naturwissenschaften 2013, 100, 525–532. [Google Scholar] [CrossRef]
  82. Turskii, M.K. Lesovodstvo (Silviculture); Gosudarstvennoe Izdatel’stvo Selskokhozyaistvennoi Literatury: Moscow, Russia, 1954; p. 352. (In Russian) [Google Scholar]
  83. Tikhonov, A.S. Lesovedenie (Forestry); Oblizdat: Kaluga, Russia, 2011; p. 329. (In Russian) [Google Scholar]
  84. Alves-Silva, E. The influence of Ditylenchus (Nematoda) galls and shade on the fluctuating asymmetry of Miconia fallax (Melastomataceae). Ecol. Austral. 2012, 22, 53–61. [Google Scholar]
  85. Moller, A.P. Leaf-mining Insects and fluctuating asymmetry in elm Ulmus glabra leaves. J. Anim. Ecol. 1995, 64, 697–707. [Google Scholar] [CrossRef]
  86. Martel, J.; Lempa, K.; Haukioja, E. Effect of stress and rapid growth on fluctuating asymmetry and insect damage in birch leaves. OIKOS 1999, 86, 208–216. [Google Scholar] [CrossRef]
  87. Cuevas-Reyes, P.; Canché-Delgado, A.; Maldonado-López, Y.; Fernandes, G.W.; Oyama, K.; González-Rodríguez, A. Patterns of herbivory and leaf morphology in two Mexican hybrid oak complexes: Importance of fluctuating asymmetry as indicator of environmental stress in hybrid plants. Ecol. Ind. 2018, 90, 164–170. [Google Scholar] [CrossRef]
  88. Graham, J.H.; Raz, S.; Hel-Or, H.; Nevo, E. Fluctuating asymmetry: Methods, theory, and applications. Symmetry 2010, 2, 466–540. [Google Scholar] [CrossRef] [Green Version]
  89. Zakharov, V.M.; Shadrina, E.G.; Trofimov, I.E. Fluctuating Asymmetry, Developmental Noise Biology Approach. Symmetry 2020, 12, 1376. [Google Scholar] [CrossRef]
Figure 1. Regions where material was collected on the territory of Yakutia. For the region key, see Table 1.
Symmetry 15 00700 g001
Figure 2. Scheme of the birch leaf characteristics used for assessment of fluctuating asymmetry.
Symmetry 15 00700 g002
Figure 3. Similarity between the studied regions in a complex of 23 climatic parameters. Euclidean distance.
Symmetry 15 00700 g003
Figure 4. Dependency of the FA level in Betula pendula on tree age and leaf size. (a) Summarized data on Yakutia (n = 13,000). Age groups: 1, young shoots developing from adventitious buds; 2, prereproductive trees; 3, middle-age reproductive trees; 4, old reproductive trees; 5, senile trees. (b) Middle-age trees, one ecotope in region 10 (n = 300). (c) Comparison of different leaf sizes in different age groups, one ecotope, region 3 (n = 600). Note: red font indicates statistically significant differences; Tukey test. IFA, integrated fluctuating asymmetry.
Symmetry 15 00700 g004
Figure 5. FA level in Betula pendula in different months. Region 2, middle-age trees (n = 300). Note: red font indicates statistically significant differences; Tukey test.
Symmetry 15 00700 g005
Figure 6. FA level in Betula pendula in different biotopes. (a) Summarized data. Biotopes: 1, single trees in the meadows; 2, birch forests; 3, undergrowth in mixed forests dominated by the larch; 4, old sites of forest fires; 5, rocky hill slopes; 6, northern and mountain sparse forests. (b) Middle taiga, biotopes with different crown density (CD). (c) Red font indicates statistically significant differences; Tukey test.
Symmetry 15 00700 g006
Figure 7. Biotopic differences in FA level of woody plants of Yakutia; (a) Betula pendula, region 1; (b) Alnus fruticosa, region 2.
Symmetry 15 00700 g007
Figure 8. Dependence of FA level in Betula pendula on lighting conditions. Combined sample, reproductive-age plants, medium-sized leaves (n = 11,000). Lighting: 1, high; 2, moderate; 3, low; 4, very low.
Symmetry 15 00700 g008
Figure 9. PCA results, ecotope ordination along the significant factors, Factor 1 and Factor 2. Note: Red outlines denote the periphery of the range; 35–38, region 5, mountains; 87–89, region 11, north; dark blue outlines, South Yakutia, regions 1, 2, 3; dark green outlines, regions 4, 6–10, different biotopes.
Symmetry 15 00700 g009
Table 1. Regions of the study and the volume of the examined material.
NumberRegion **Average Temperature, °CGeographical Coordinates *Material
Latitude, NorthLongitude, EastElevation, AMSL, mSites/Leaves Amount
1Lensk−5.2960.72114.824114/1400
2Aldan−5.5358.6125.367910/1000
3Olekminsk−5.8560.4120.42307/700
4Mirny−6.8262.53114.0435211/1100
5Nerungri−6.9456.83124.868584/400
6Amga−9.9760.9131.914612/1200
7Vilyuisk−8.0263.77121.612310/1000
8Verkhnevilyuisk−8.0663.45120.211524/2400
9Markha−8.2063.28118.311914/1400
10Yakutsk−8.8462.0129.623021/2100
11Udachny−9.5766.73112.435013/300
Total 130/13,000
Notes: * Geographical coordinates of the weather stations are quoted using the data of http://www.pogodaiklimat.ru/ (accessed on 15 April 2020) [69]. ** Region 1, South-Western Yakutia; Regions 2, 3, 5, Southern Yakutia; Regions 4, 7, 8, 9, Western Yakutia; Regions 6, 10, Central Yakutia; Region 11, North-Western Yakutia.
Table 2. FA levels of middle-age and young trees of Betula pendula growing in different regions of Yakutia 1.
Region 2Amount of SitesIFA 3
nM ± m
11212000.043 ± 0.0019
299000.041 ± 0.0017 *
41111000.046 ± 0.0007
533000.050 ± 0.0019
655000.047 ± 0.0016
72424000.044 ± 0.0010
82424000.042 ± 0.0010 *
91414000.046 ± 0.0010
101111000.046 ± 0.0005
1133000.051 ± 0.0018 *
Notes: 1 In all samples, medium-size leaves that were undamaged by pests were used. 2 Data on the trees of this category from region 3 could not be gathered. 3 IFA, integral fluctuating asymmetry; n, leaves amount; M, arithmetic mean; m, standard error. * Tukey test p < 0.05 for the pairs “regions 2–11” and “regions 8–11”.
Table 3. PCA results, ecotope load by basic ecological factors.
ParametersComponents
III
IFA0.200−0.715 **
Biotope−0.281−0.772 **
Soil moisture−0.239−0.148
Lighting0.105−0.704 **
Tree age0.212−0.250
Leafe size0.04420.031
SAT-50.767 **0.194
Duration of vegetative period (from +5 °C)0.833 **0.141
Spring climate inclemency−0.930 **0.139
Winter climate inclemency−0.631−0.029
Summer climate inclemency−0.951 **0.168
General climate inclemency−0.847 **0.044
LEG−0.849 **−0.066
Total variance0.3940.138
Note: Loads > 0.700 are given; ** significance p < 0.01 and above.
Disclaimer/Publisher’s Note: The statements, opinions and data contained in all publications are solely those of the individual author(s) and contributor(s) and not of MDPI and/or the editor(s). MDPI and/or the editor(s) disclaim responsibility for any injury to people or property resulting from any ideas, methods, instructions or products referred to in the content.

