Article

Concordance of Lateralization Index for Brain Asymmetry Applied to Identify a Reliable Language Task

1
Graduate School of Informatics and Engineering, The University of Electro-Communications, Chofu-shi, Tokyo 182-8585, Japan
2
Center for Research Collaboration and Support, School of Medicine, Dokkyo Medical University, Mibu-machi, Shimotsuga-gun, Tochigi 321-0293, Japan
3
Department of Psychiatry, School of Medicine, Dokkyo Medical University, Mibu-machi, Shimotsuga-gun, Tochigi 321-0293, Japan
4
Department of Radiology, Faculty of Medicine, Shimane University, Izumo-shi, Shimane 693-0021, Japan
5
Department of Radiology, School of Medicine, Dokkyo Medical University, Mibu-machi, Shimotsuga-gun, Tochigi 321-0293, Japan
6
Kawada Hospital, Okayama-shi, Okayama 700-0031, Japan
7
Department of Biological Psychiatry and Neuroscience, School of Medicine, Dokkyo Medical University, Mibu-machi, Shimotsuga-gun, Tochigi 321-0293, Japan
*
Author to whom correspondence should be addressed.
Symmetry 2023, 15(1), 193; https://doi.org/10.3390/sym15010193
Submission received: 15 December 2022 / Revised: 31 December 2022 / Accepted: 3 January 2023 / Published: 9 January 2023
(This article belongs to the Special Issue Neuroscience, Neurophysiology and Asymmetry)

Abstract

:
How can we determine which language task is relevant for examining functional hemispheric asymmetry? A problem in measuring brain asymmetry using functional magnetic resonance imaging lies in the uncertain reliability of the computed index regarding the “true” asymmetry degree. Strictly speaking, the results from the Wada test or direct cortical stimulation cannot be an exact “ground truth”, specifically for the degree of asymmetry. Therefore, we developed a method to evaluate task performance using reproducibility independent of the phenomenon of functional lateralization. Kendall’s coefficient of concordance (W) was used as the statistical measure. The underlying idea was that although various algorithms to compute the lateralization index show considerably different index values for the same data, a superior language task would reproduce similar individual ranking sequences across the algorithms; the high reproducibility of rankings across various index types would indicate a reliable task to investigate functional asymmetry regardless of index computation algorithms. Consequently, we found specificity for brain locations; a verb-generation task demonstrated the highest concordance across index types along with sufficiently high index values in the inferior frontal gyrus, whereas a narration–listening task demonstrated the highest concordance in the posterior temporo-parietal junction area.

Graphical Abstract

1. Introduction

The difficulty in measuring brain asymmetry using functional magnetic resonance imaging (fMRI) lies in the absence of the “ground truth”. In any case, we can calculate the lateralization index (LI) after an fMRI session accompanied by a language task. Multiple algorithms are proposed for LI computation, and the results are considerably different from each other [1,2,3]. Nonetheless, we do not have a reliable judgment criterion for defining which LI value is preferable. Certainly, researchers often apply direct clinical examinations, including the Wada test [4,5,6] and direct cortical stimulation (DCS) [7,8,9,10] as the “ground truth” [9], or the “golden standard” [5,6]. Unfortunately, these examinations occur on an all-or-nothing basis, that is, classification into left or right lateralization, bilaterality, or unknown, and are not necessarily apt for estimating the degree of asymmetry. In this situation, we developed a method for evaluating LI computation types using a measure of concordance or reproducibility: Kendall’s coefficient of concordance (W) of the LI values across tasks [1,2,3]. The underlying idea is that an individual who shows leftward (or rightward) asymmetry in a task is also likely to show leftward (or rightward) asymmetry in another task. We can capture this consistent trend in individual language function using the concordance coefficient: a reliable LI estimation would consistently show similar values across various language tasks.
In this study, we apply the same concordance procedure to evaluate language tasks, that is, which task is the most preferable for estimating language asymmetry. We first explain the efficiency of the concordance evaluation, including previous applications of LI computation algorithms [1,2,3]. The same datasets were then reanalyzed by changing the direction of the analysis, and we examined the concordance of individual rankings across various LI computation types to find a reliable language task that was robust against the LI-type difference. The discussion regarding the concordance of LI rankings provides insight into the core of language processing in both hemispheres.

2. Rationale

2.1. Efficacies and Drawbacks of Direct Clinical Examinations

Before discussing the concordance method, we summarize the efficacies and drawbacks of direct clinical examinations as a tool to examine brain functional asymmetry, and how far they are reliable as “ground truth” or “golden standard”. Medical doctors often look at hemispheric dominance in language function before neurosurgery to avoid damage to the language cortex and obtain optimal outcomes [11,12]. There are mainly two types of examinations: direct clinical assessments and indirect assessments using non-invasive equipment, including fMRI [5], magnetoencephalography [13] and functional transcranial Doppler sonography [14]. The former includes the Wada test [4,6,15,16] and DCS [10,17,18,19], being regarded as invasive at least to some extent, with a possibility of adverse side effects. The Wada test introduces an anesthetic (typically amobarbital) to one of the left or right brain hemispheres and observes how patients’ language performance is affected; if counting numbers orally by a patient is disturbed during left hemisphere anesthetization, it can be considered that their language center is located in the left hemisphere. Thereafter, the other hemisphere should also be examined to see the impact of anesthetization of that side on the patient’s speech. If both sides show the influence of the anesthetic, the patient may have a language center in both hemispheres, that is, bilaterality. Using this procedure, it is difficult to determine which location or brain part in the examined hemisphere is specifically involved in language.
Intraoperative DCS is also frequently used. DCS directly stimulates cortical locations using electrodes during neurosurgery and observes the influence of this on patients’ speech. For example, to determine a language positive area, a “2/3 rule” applies, where at least two of three stimulations lead to a language error [9]. In contrast to the Wada test, DCS can specify a location crucially involved in language. In this procedure, stimulating the counterpart location on the other side of the hemisphere targeted for the operation is often unnecessary.
The value of these direct clinical examinations is evident in their immediacy in obtaining functional information about the eloquent cortex considered for the resection. However, the results may not always efficiently work as “ground truth” or the “golden standard”, particularly regarding the degree of functional asymmetry [6]. First, their invasiveness prevents the application of these direct methods to healthy controls [6]. We can compare the results from the direct methods with those from the indirect methods using only patients. We expect that the comparison results obtained from patients would also be accurate in healthy controls, but we cannot determine the accuracy strictly.
Second, as mentioned earlier, the results from direct clinical examinations occur on an all-or-nothing basis and are not necessarily capable of simulating LI values. In reality, most of us naturally use both hemispheres, emphasizing one side for language processing. As per Broca, we speak with the left hemisphere [20]. Recent advancements in neuroimaging tools have revealed that most individuals increase signals not only in the left hemisphere but also in the right hemisphere during language tasks, although the degree depends on the individual. Usually, the calculated LIs are continuous variables ranging from −1 (most rightward) to 1 (most leftward). In contrast, the Wada test typically provides individuals with leftward, rightward, or bilateral hemispheric dominance. Some studies using the Wada test have attempted to calculate the degree by the percentage of correct answers during the right minus the left injections (i.e., testing the left hemisphere minus the right hemisphere) [15,21]. However, many studies using the Wada test did not always calculate the percentage, and many DCS examinations did not always examine the hemispheric side opposite to the operation. It is also notable that some individuals show “crossed dominance”, that is, an interhemispheric discrepancy between expressive (anterior) and receptive (posterior) language functions; in this case, the Wada test would fail to determine the hemispheric dominance or indicate mixed dominance, showing different results according to the test materials [15,22,23].
Third, language tasks during direct clinical examinations were limited. We must satisfy ourselves with only a few tasks and trials because of time limitations and patient burden. In contrast, if necessary, we can conduct as many tasks as possible during indirect examinations, although, of course, we also have to consider the patients’ burden. The Wada test typically involves object naming, simple command comprehension, sentence repetition, counting or naming of the days of the week [5,6]. DCS also often conducts object naming [9], counting and reciting the days of the week and months of the year [24]. In contrast, fMRI employs sentence completion, silent word generation, rhyming, object naming, antonym generation (for children), and/or passive story listening (in the US [25]), and phonemic verbal fluency and auditory comprehension (in Europe [26]) among others for presurgical examinations. If we consider that the coincidence between the results from the direct methods and those from fMRI is essential, it is advantageous to conduct a similar task in the fMRI to those in the direct methods, for example, picture naming, which is specifically relevant to temporal lobe epilepsy, itself often associated with naming impairment [9,27,28]. However, a different idea is also possible; we can conduct types other than the direct ones to examine the potential functional roles of the brain location to be excised. Indeed, all language tasks may not always evoke all language cortices as left dominant; as mentioned earlier, the Wada test occasionally detected dissociation among functions varying in left or right dominance, that is, crossed dominance [15,22,23]. If we integrate various types of information efficiently, medical treatment will become more sophisticated [29]. These considerations lead us to question whether the coincidence between direct and indirect methods is the only plausible “standard”.
Finally, with some overlap with the third point, the results from indirect methods may intrinsically differ from those from the direct methods. The discrepancies between indirect and direct tests were occasionally reported [21,30,31,32,33]. A meta-analysis estimated the concordance between fMRI and Wada test to be at least 80% [31]. One reason for these discrepancies could be that fMRI measures activation, whereas the Wada test (as well as DCS for language) observes the deactivation of functions [4,6]; areas intensively activated in fMRI may not necessarily be essential to core language processing. Another reason is crossed dominance, which may yield a false classification by the Wada test [15,22]. For methodological issues of fMRI, the statistical threshold varies the LI values and then varies the concordance with the Wada test [30]. In addition, LI is considerably affected by computation algorithms [1,2,3]. Considering this situation, it appears ambiguous to consider direct tests as a “standard” of indirect methods.
Thus, the importance of indirect methods is evident. First, they are noninvasive and can be applied to healthy controls. Second, the asymmetry degree can be estimated using a specific algorithm. Third, they can conduct various tasks to examine multiple functions if necessary. Finally, they provide unique information regarding lateralization. These virtues could help clinicians obtain fine details before neurosurgery that are different from data obtained by direct examinations.
In summary, direct clinical examinations (e.g., the Wada test and DCS) have merit in their immediacy in examining patients’ brain locations before and during neurosurgery. However, their efficacy in being the “ground truth” or “golden standard” of functional asymmetry degrees is not necessarily adequate because of their invasiveness, insufficiency in calculating asymmetry degrees, the limited number of applicable tasks and the intrinsic difference in methodology from indirect tests. Direct and indirect examinations can be used jointly to obtain unique and complementary information to achieve optimal outcomes.

2.2. Reproducibility/Concordance as a Basis for Evaluation

In this situation, we found that the reproducibility or concordance, of LI values across tasks worked efficiently to evaluate LI computation algorithms [1,2,3]. We now explain reproducibility’s efficiency and further feasibility in brain asymmetry research. First, we assume that individuals stably hold intrinsic hemispheric asymmetry, although this may not always be true. For example, a patient with epilepsy due to a glioma in the left hemisphere may shift their language center from the left to the right hemisphere [34,35]. However, generally speaking, we assume that an individual who shows strong leftward lateralization during a language task would also show, more or less, a leftward asymmetry during another language task. Direct clinical examinations depend on this assumption; we accept the results of clinical assessments because we assume that they can capture the patients’ consistent language asymmetry in their daily language communications, which may show a variety or fluctuation in reality.
The idea of measuring consistent asymmetry from various language tasks may make some cognitive neuroscientists feel uncomfortable. In contrast, we observe considerable diversities in brain activation between employed language tasks, and our main business is to discuss the differences per se. Is there any sense of capturing consistency between task effects? The answer in the current paper is “yes”, and a model called “implicit language processing” supports this. According to implicit language processing theory, a language stimulus evokes a language function, reflecting specific language characteristics even when the processing occurs implicitly [36]. For example, the Japanese syllabic character, kana, and ideographic character, kanji, retain their respective brain activation features when they appear in a size judgment task [36]. Similarly, we could expect consistency in hemispheric asymmetry of activation as long as the task presents language stimuli, at least to some extent. Indeed, we admit that diversity exists, but at the same time, consistency or reproducibility/concordance also exists. Our idea here is to utilize reproducibility to evaluate functional asymmetry in the brain.

2.3. Evaluating LI Computation Algorithms

Under these considerations, we evaluated newly invented LI algorithms using Kendall’s coefficient of concordance (W) across multiple language tasks [2,3]. The underlying idea was that a reliable LI computation algorithm could efficiently capture individuals’ consistent functional asymmetry, regardless of the task types. Kendall’s W is a non-parametric statistic that assesses agreement using multiple ratings ranging from 0 (no agreement) to 1 (complete agreement). For example, an individual may show an LI value of 0.9 for task A and 0.8 for task B, whereas another individual may show 0.6 for task A and 0.5 for task B. In this case, the ranks of leftward asymmetry for the first individual were always higher than those for the second individual across tasks A and B. Thus, if an LI algorithm yields similar rankings in individuals’ LI values across tasks, Kendall’s W becomes high, suggesting a high concordance of individuals’ asymmetric distributions among multiple tasks. Such an LI algorithm with high concordance is clinically convenient because it increases the choice of task types to be employed, as it would yield similar LI asymmetry distributions regardless of task type.
The concordance method was first applied to evaluate AveLI [1,2]. AveLI is a threshold-free LI computation algorithm that computes the following standard formula:
(Left − Right)/(Left + Right)
where Left is the sum of contrast estimate values of above-threshold voxels in a region of interest (ROI) in the left hemisphere, and Right is that in the right hemisphere, using all voxel values in the ROIs as thresholds and averaging these sub-LIs [1]. Four intentionally diverse language tasks were applied to pose a “challenge” to six LI algorithms, including AveLI [2]. Identical datasets of four tasks were used to compute six different LI computation algorithms, and AveLI showed the highest concordance of LI value rankings across the four tasks. Therefore, AveLI yielded similar rankings of individuals’ LI values across tasks, whereas the other algorithms yielded various rankings compared with AveLI. We also evaluated another new index, HomotopicLI, using the same concordance procedure [3]. In both cases, the concordance of the LI value rankings across language tasks worked well in characterizing LI algorithms.

2.4. Evaluating Language Tasks

The selection of a preferable task, the topic of this study, is yet another problem in examining language lateralization [25]. In this study, we approached this problem by applying the concordance method, considering that a reliable language task would reproduce similar LI value rankings across various LI algorithms. We used the same datasets as those used for evaluating LI types above [3], while the direction of the analysis using Kendall’s W was the opposite. For example, suppose language task A yields similar left-dominance rankings in individuals between two LI computation algorithms; in contrast, task B yields considerably different ranking patterns for the two LI algorithms. Therefore, we could trust task A more than task B because task A provided more stable ranking patterns than task B.
The difficulty in selecting a language task paradigm lies again in the absence of the “ground truth”. To date, various language tasks have been proposed. There are three main criteria for deciding a preferable language task to examine lateralization. One is whether the task has already been used for popularity [25]. This is a pragmatic reason because taking a majority is advantageous in building a standard platform for clinical practice and comparisons. Another is more theoretical and empirical: whether the task has yielded extensive activation in the left language cortex. For example, to investigate naming impairment in patients with epilepsy, some studies assessed the impairment using a behavioral test (e.g., the Boston Naming Test) while measuring hemispheric language lateralization using fMRI tasks other than a naming task, for example, semantic and tone decision tasks [37], an auditory description decision task [38] or a verbal fluency task in addition to using a verb-generation task [39]. The reason for the task selection was the intensive detection of the left language cortex validated previously. This logic depends on a theory or our belief that humans generally have hemispheric language lateralization. Although intelligible, it sounds somewhat tautological, because we seek a task that is consistent with what is difficult to fully prove: authenticity. That is, language function should have lateralization, in many cases, to the left hemisphere. We can claim that it is empirically robust because many studies have confirmed the left asymmetry of human language function [40,41].
Another criterion for the task choice is again consistent with direct clinical examinations. One representative is a naming task [9,27,28]. As mentioned earlier, the reason for employing a naming task is that the Wada test and DCS frequently conduct object naming during examinations. A naming task also has legitimacy because temporal lobe resection of patients with epilepsy may cause a naming decline afterward [27]. However, particularly with regard to measuring the degree of hemispheric asymmetry, the efficacy of direct clinical examinations is limited, as described earlier. In addition, we conducted an analogous task during fMRI to that during direct examinations to obtain compatibility. Again, this sounds like intentional consistency, and it is unclear whether this is what we should solely pursue.
The last two criteria include intentional consistency or tautology, depending on the existence of hemispheric language asymmetry. It would not matter if language asymmetry has been repeatedly confirmed and regarded as scientific truth. However, it is also possible to entertain doubts regarding this phenomenon. At least, this is not always true on an individual level; what can we do if we collect more participants with rightward asymmetry than usual for some reason? In addition, there is no assurance that the selected task applies similarly to all people of any cultural or ethnic background [42]. Moreover, the universal existence of language lateralization and whether it is intrinsic to humans remains uncertain, although its presence and inherence appear to be highly likely.
In contrast, the concordance method is independent of hemispheric language asymmetry. It simply and statistically examines the concordance among multiple rating sequences. If task A provided a high concordance of ratings while task B did not, we could regard task A as more reliable than task B. Thus, in addition to the criteria above, we can perform a concordance test to enhance the reliability of the task selection. One agenda for this method is the preparation of multiple rating sequences. In this study, we use those of multiple LI computation algorithms because we know that LI values are considerably different among these algorithms [2,3]. Of particular interest was whether tasks with more hemispheric lateralization, relating to the second criterion of task selection above, had a higher concordance in LI value rankings across LI types than other tasks.

3. Materials and Methods

3.1. Participants

Among the participants analyzed in the previous study [3], 38 selected participants were used in this study (male/female = 20/18, mean age 36.1 ± 13.5 years, ranging from 18–66 years). All participants gave written informed consent, and the study protocol was approved by the Institutional Review Board (Bioethics Committee, Dokkyo Medical University; university 28,008) and adhered to the Declaration of Helsinki. Their Edinburgh handedness inventory scores [43] ranged from −100 to 100 (mean 51.9 ± 63.9); four participants usually wrote with their left hand and the others with their right hand. We intentionally recruited left-handed individuals to include the highest proportion of right hemispheric language dominance possible [44,45,46,47]. The details of the participants have been described elsewhere [3]. In essence, all participants were native Japanese speakers, had no neurological or psychiatric diseases according to the Structured Clinical Interview for DSM-IV-TR (SCID-I/NP for normal participants), had normal hearing, and had either normal or corrected-to-normal eyesight. The 38 participants performed all four language tasks during fMRI sessions, achieved a certain level of task performance (see Table 1 of [3]), and exhibited activation at p < 0.001, uncorrected, in all ROIs for all tasks.

3.2. Magnetic Resonance Imaging (MRI) Parameters

A 3-Tesla MRI with a 32-channel phased-array head coil (Siemens MAGNETOM Prisma 3T, Siemens Healthineers, Erlangen, Germany) was used to conduct fMRI that covered the whole brain. An echo-planar imaging (EPI) sequence was used with the following parameters: multi-band factor, 2; echo time (TE), 22; repetition time (TR), 1250; flip angle, 90 degrees; field of view (FOV), 192; matrix, 64 × 64; slice thickness, 3.6 mm (3 mm plus 0.6 mm gap), 46 slices of axial-coronal oblique sections per volume and 226 volumes per run. A 3-dimensional T1-weighted image was also obtained using a sequence of magnetization-prepared rapid gradient-echoes (MPRAGE), with a generalized autocalibrating partially parallel acquisitions (GRAPPA) option (factor 2), using the following parameters: TE, 2.26; TR, 2300; inversion time, 900; flip angle, 8 degrees; FOV, 256; matrix, 256 × 256; slice thickness, 1 mm; and 256 slices for reconstruction.

3.3. Language Tasks

Four language tasks were performed during the four fMRI runs, respectively, as described elsewhere [2,3]. The tasks were our creations, developed by referring to previous research, including recommendations by the American Society of Functional Neuroradiology (ASFNR) [25]. We deliberately included a wide variety of task types because our primary purpose in the task development was to diversify to evaluate the abilities of the employed LI types to yield reproducible rankings (see Table 2 of [2]). A resting-state fMRI scan preceded the four language tasks, and another followed these five fMRI runs, whose details are not discussed here. Japanese language was used throughout the experiment.
The Thanks task was a narration–listening task with word detection in a block design. This task was similar to the Passive Story Listening task recommended by the ASFNR [25]. Nevertheless, we added a word detection procedure to maintain participants’ alertness and monitor their attendance. Participants listened to narratives and pressed a button under the index finger of the hand they preferred to write with when they heard the word “thanks”. Nine contrast blocks displayed a plus mark as a fixation point, while eight narration blocks included a different narration for each block in addition to a plus mark; alternations of the contrast and narration blocks occurred after a 10 s dummy period. The block duration was 16 s (272 s for 17 blocks).
The Verb task was a verb-generation task with an event-related design. The Verb Generation task was included in the “second tier” and not officially recommended as the first choice in the ASFNR paper [25], but has been frequently applied [28,30,39,48,49]. Among the first tier of the ASFNR, the Silent Word Generation task was similar to the Verb task in that it included an expressive function. Participants covertly recalled a verb related to a noun presented aurally. The nouns used were those with two to four moras (number of sound units), but without homonyms, which were deliberately selected according to word familiarity and appearance frequency in addition to their basic linguistic attributes [2]. A plus mark was presented as the fixation point throughout the run. The participants were told beforehand that they would be asked what verbs they recalled after the scan session. An algorithm [50] arranged the event onset timing to present 45 nouns and 45 null events during the 270 s after a 10 s dummy period. We prepared two schedules and applied them in a counterbalanced order across participants. We further varied the onset by delaying for 0.15, 0.35, 0.55, 0.75 or 0.95 s after the assigned onset time.
Animal_aud and Animal_vis are lexical–semantic decision tasks with an event-related design. Auditory word sounds were presented for Animal_aud, and visual word displays were presented for Animal_vis. Semantic decision tasks are not included in the ASFNR recommendations [25], but similar semantic tasks have been applied in language investigations [51,52,53]. Participants pressed a button, as in the Thanks task, when they heard or read an animal’s name. Word attributes, for example, word familiarity, were also controlled, as in the Verb task [2]. An algorithm [50] arranged the event timing to present 30 animal words, 30 non-animal words and 30 null events (plus mark) during a 270 s period after a 10 s dummy period. We prepared two schedules and applied them in a counterbalanced order between Animal_aud and Animal_vis and across participants. We also varied the onset of the events in the same manner as in the Verb task. For Animal_vis, the words were presented on a monitor for 1 s using a syllabic script (katakana).
All the tasks concluded the respective runs within the acquisition time (226 volumes with TR 1250; about 4.7 min). The Thanks task was performed first for all participants, while the order of the other three tasks was counterbalanced across participants. The order of the stimuli (narrations and words) within a run was pseudo-randomly arranged using a computer. For each of the Verb, Animal_aud, and Animal_vis tasks, we prepared two schedules for stimuli presentation and assigned one schedule for each participant to minimize the order effect. A plus mark was presented as a fixation point throughout the tasks, except for the visual word stimuli. The visual stimuli were shown in white on a black background. All stimulus presentations and button presses were controlled using E-Prime3 (Psychology Software Tools, Inc., Sharpsburg, PA, USA) and synchronizing equipment (GETS3, Physio-Tech, Co., Ltd., Tokyo, Japan). MRI-compatible devices were used for visual stimulation (InroomViewingDevice LCD 3.0, NordicNeuroLab, Bergen, Norway), auditory stimulation (Silent Scan, Avotec Inc., Stuart, FL, USA) and button press (Current Designs, Inc., Philadelphia, PA, USA). The participants’ eyesight was corrected to approximately normal if necessary, using non-magnetic glasses (MediGoggles, Namoto Co., Chiba, Japan). Participants viewed the LCD monitor through a mirror attached to the head coil.

3.4. Image Processing
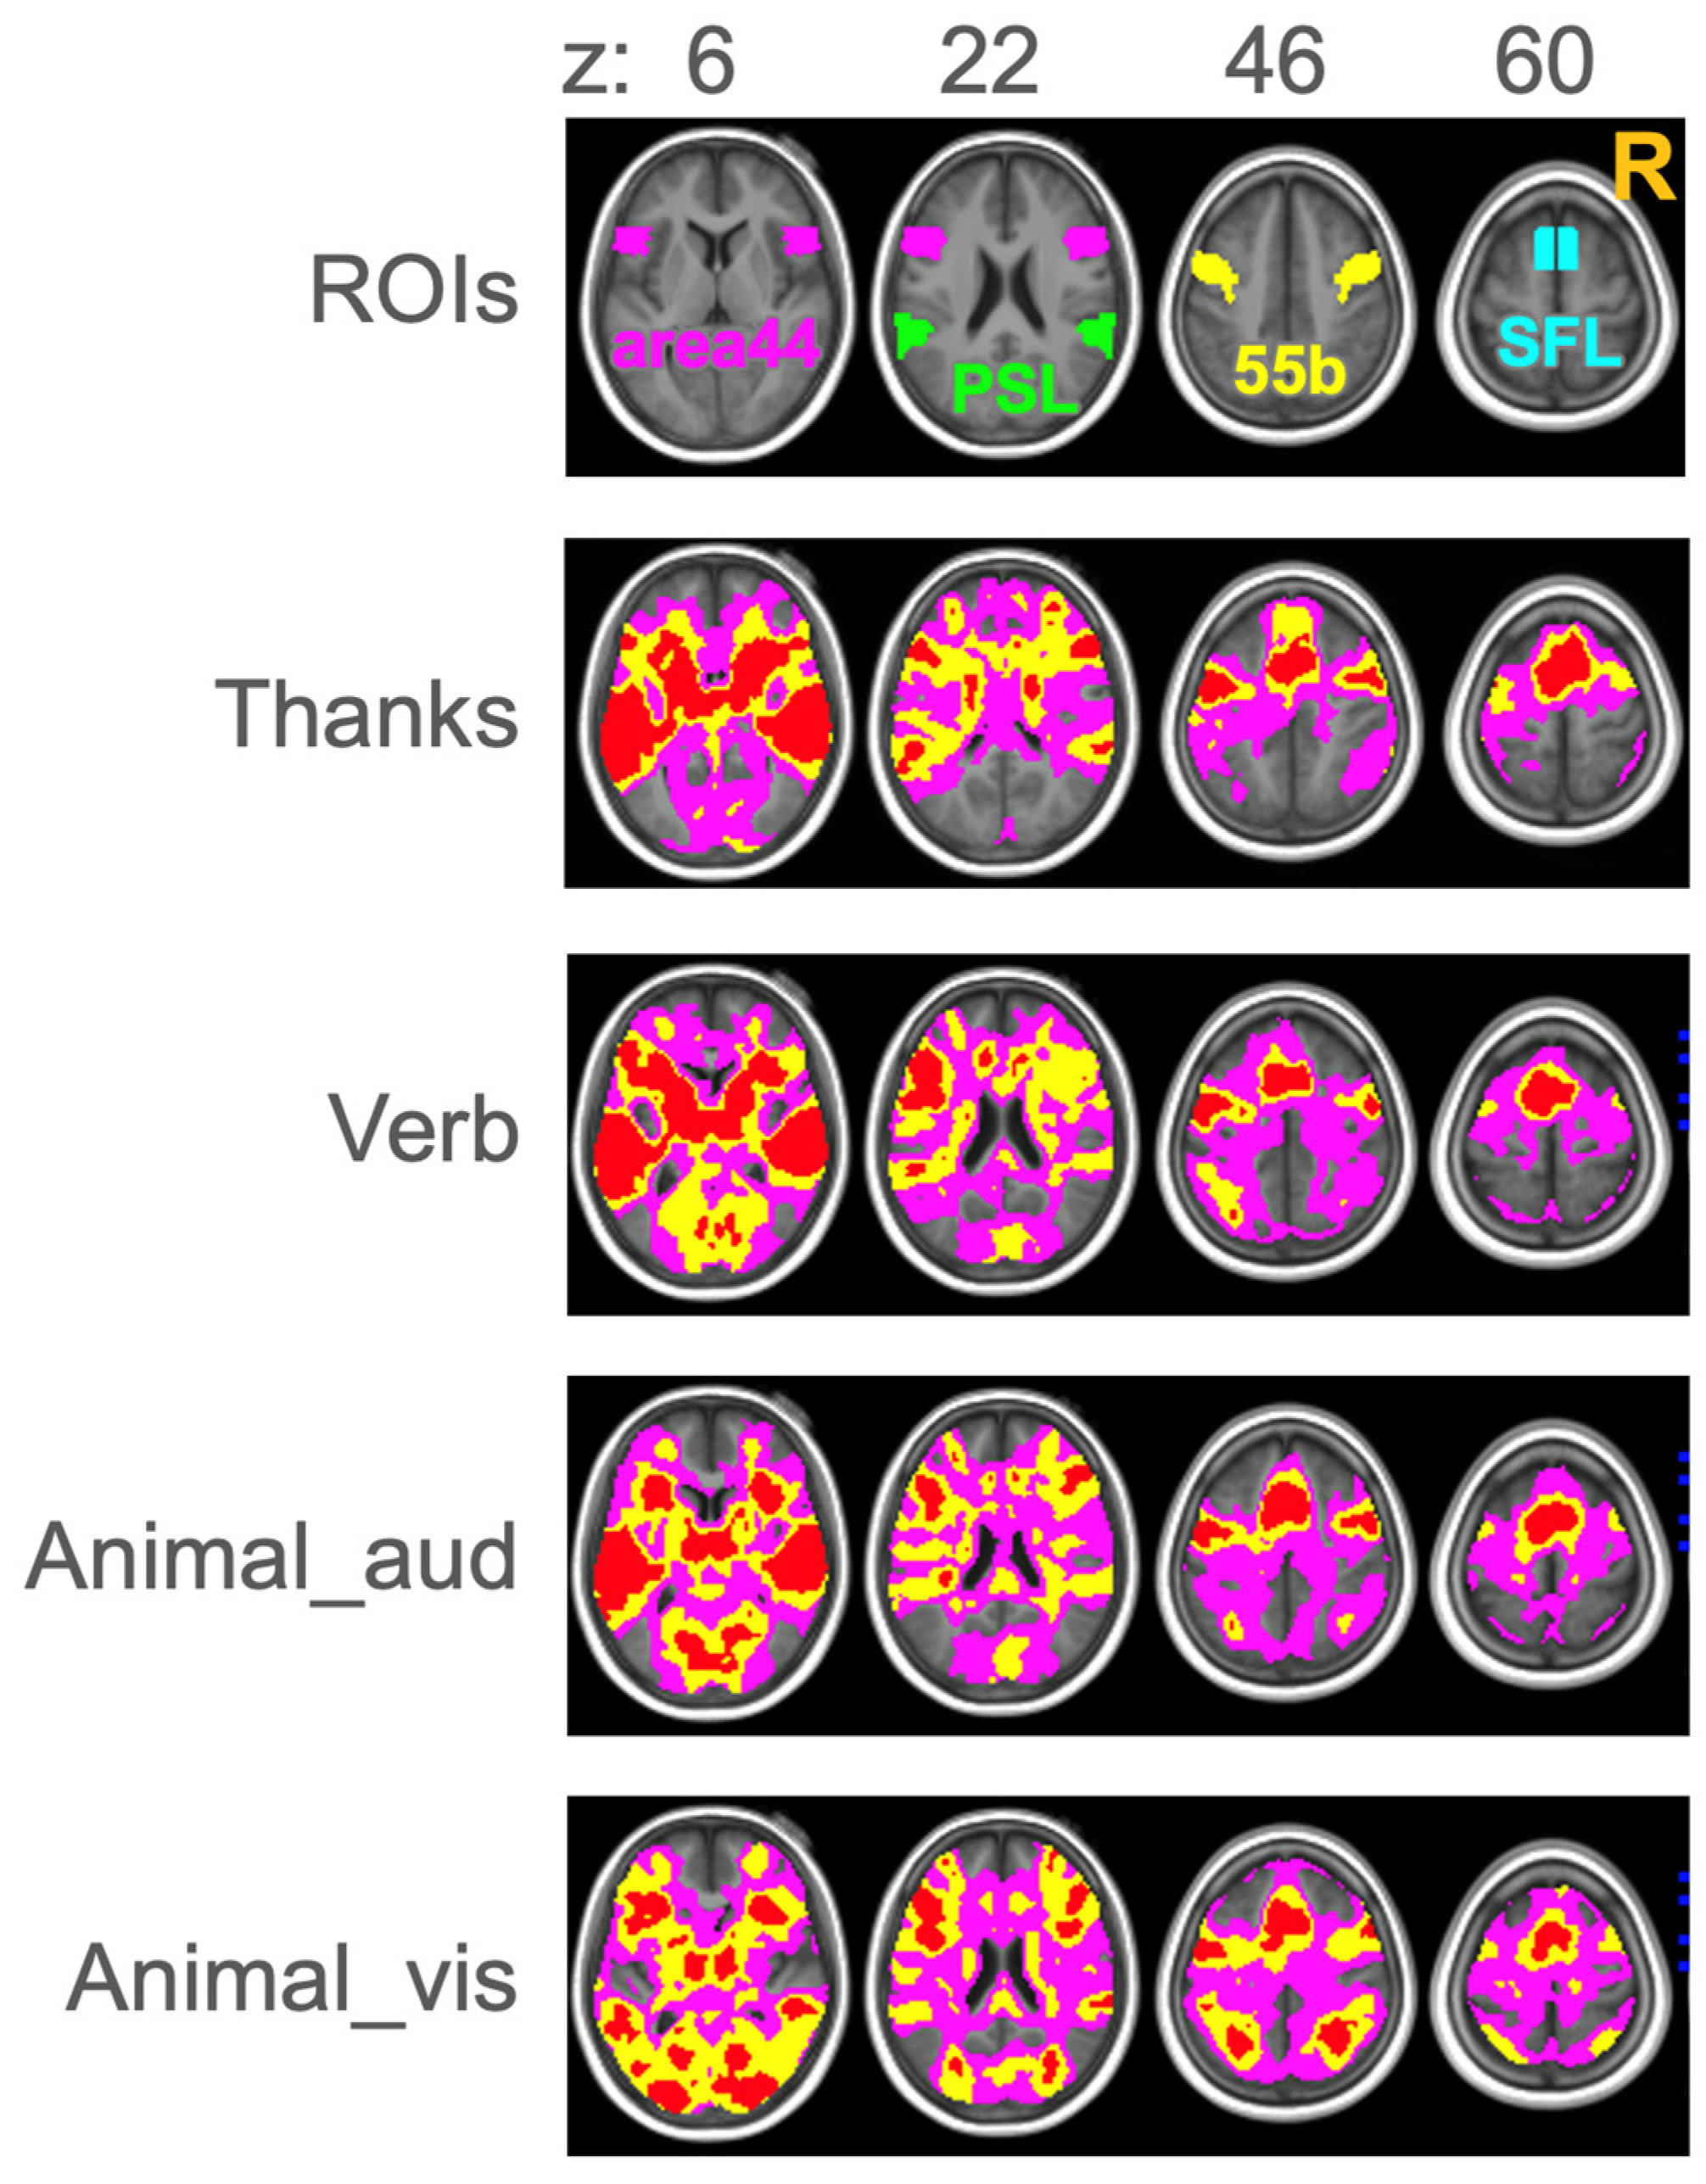
Image analyses were conducted using statistical parametric mapping software (SPM12, Wellcome Centre for Human Neuroimaging, University College London, London, UK) and MATLAB (MathWorks, Inc., Natick, MA, USA). Functional images first underwent preprocessing of slice timing to the first slice, realignment to the first volume, coregistration to the individual skull-stripped T1-weighted image, spatial normalization into standard space (Montreal Neurological Institute [MNI] template space) using individually obtained parameters during segmentation of the T1-weighted image, and spatial smoothing (full width at half maximum of the Gaussian kernel of 6 mm isotropic). Functional activities were then statistically estimated using preprocessed data. To make the design matrix of a general linear model for each task separately, we involved button-press information as a covariate to minimize undesirable effects as follows. For the Thanks task, the number of times the button was pressed during the narration blocks was included in the field “Parametric Modulations” of the narration condition. For the Animal_aud and Animal_vis tasks, we added a covariate regressor based on the timing of pressing the button. We also included the realignment parameters in the model. Using these design matrices, task-specific signals were calculated as follows. For the Thanks task, signals in the narration blocks were contrasted with those in the contrast blocks; for the Verb task, signals in the noun events were estimated against the baseline signals (including the null events); and for the Animal_aud and Animal_vis tasks, only the non-animal word events were used for the examination because of the minimal involvement of motor responses. We used these four types of contrast estimate volumes in subsequent analyses. Random-effects group analysis was also performed to separately observe the overall activation for each task. Maps were generated at the thresholds of p < 1 × 10⁻⁷, p < 0.001, and p < 0.5 (all uncorrected for multiple comparisons).

3.5. ROIs

We used the same five types of ROI masks as those used in the previous studies [2,3] (Figure 1). They were conceptually derived from cortical parcellation by the Human Connectome Project (HCP; https://www.humanconnectome.org/ (accessed on 14 December 2022)), which is currently one of the most reliable resources based on large sample data worldwide. HCP parcellation indicated marked hemispheric asymmetry in four locations: area 55b, area 44, SFL, and PSL (explained hereafter) [54]. Based on the literature and supporting materials, we created masks of corresponding locations using templates of automated anatomical labeling (AAL) [55] with modifications using the WFU PickAtlas toolbox platform (version 3.0.5b; https://www.nitrc.org/projects/wfu_pickatlas/ (accessed on 14 December 2022)) [56]. The 55b ROI was located approximately within the mid-precentral gyrus. The area44 ROI was located approximately at the opercular part of the inferior frontal gyrus, but also extended to the triangular part. The PSL ROI (corresponding to the perisylvian language area) was roughly located within the junction areas of the superior temporal and supramarginal gyri. The SFL ROI (corresponding to the superior frontal language area) roughly corresponds to the pre-supplementary motor area (pre-SMA). Finally, the 4rois ROI was a combination of the four ROIs. We first created the left and right ROI masks separately, and then took the overlaps of the flipped and original masks to obtain symmetric ROIs along the midsagittal line. Naturally, the masks created were completely different from the original AAL templates. More details of the creation process can be found elsewhere [2].

3.6. LIs

We employed the same seven types of LI computation algorithms as in a previous study [3], which were computed using the same contrast estimate volumes of individuals across LI types: AveLI, AveLI_v, HomotopicLI, BaseLI, BaseLI_v, P001unc and P001unc_v. As explained above, AveLI [1] resulted from the computation of Formula #1 using voxel intensity values of a contrast estimate volume (which contained betas of contrast of interest calculated using the general linear model) as the terms at thresholds defined by all voxel intensity values (>0) within both ROIs (sub-LIs), and the average was calculated. AveLI_v followed the same procedure as AveLI, but used the number of voxels instead of voxel intensity values as the terms in Formula #1 for the computation of sub-LIs. HomotopicLI resulted from the computation of Formula #1 using voxel intensity values as the terms by selecting voxels located at symmetric positions against the midsagittal line in the left and right ROIs. We used only positive voxel values (>0); if one of the left or right ROI voxels of the homotopic pair had a negative value, the voxel value was converted to 0. If both voxels had negative values or 0, they were not used in the computations. These values were averaged within the left ROI, ignoring not-a-number voxels that resulted from 0 divided by 0. BaseLI resulted from Formula #1 using the summation of all voxel intensity values (>0) within the ROIs as the term. BaseLI_v was the same as BaseLI, except that the number of voxels was used as the term. P001unc was obtained from the computation of Formula #1 using the summation of the intensity values of above-threshold voxels at p < 0.001 (uncorrected) as the term. P001unc_v was the same as P001unc, except that the number of voxels was used as the term. The threshold p < 0.001 was the default threshold specified in the used software (SPM). Values by all LI types could range from −1 (most rightward) to 1 (most leftward).

3.7. Analysis of Lateralization

Among the seven types of LI computation algorithms, we selected AveLI for the primary representative estimation of the overall lateralization degrees of tasks because it is a threshold-free index that is robust against both noise and outliers [1]. Moreover, AveLI is reproducible across tasks, yielding similar LI values for individuals [2]. Two types of two-way analysis of variance (ANOVA) were applied. One was an ANOVA with four tasks and five ROI types as independent variables and LI values as the dependent variable. LI values in advance underwent an arcsine transformation because they were ratio data, where value 1 (or value −1) was replaced with (n − 0.25)/n (or the negative of that), and value 0 with 0.25/n. The total voxel number was input in both the left and right ROI masks for the term n. This ANOVA, in effect, compared the leftward asymmetry degrees of independent variables, which included an ambiguity about whether the differences were caused by a shift in the distribution of LI values from leftward to rightward asymmetries (or vice versa), or by a concentration around zero (bilaterality). Thus, we also conducted an ANOVA with the same independent variables, but used the absolute values of indices (after an arcsine transformation) as the dependent variable. Holm’s sequentially rejective Bonferroni procedure was used for post hoc paired comparisons (p < 0.05). We also computed the generalized omega squared (G.O.^2) to estimate the effect size.

3.8. Analysis of Concordance

We computed Kendall’s coefficient of concordance (W) to test the degree to which individual rankings were concordant across the seven LI types for each language task by ROI type. Consequently, 20 Ws were obtained for the four tasks by five ROI types. These 20 Ws underwent a one-way repeated-measures ANOVA after an angular transformation to ascertain differences among the task types (five data per task). As this ANOVA did not fully clarify the interaction effects of tasks by ROI type, we adopted the following approach to statistically estimate differences among task effects within each ROI type. First, we computed Pearson’s product-moment correlation coefficient between all pairs of LI value sequences for each task by ROI type; consequently, 21 correlation coefficients (6 + 5 + 4 + 3 + 2 + 1 as seven LI types) were obtained for each task, totaling 84 per ROI type. These correlation coefficients were subjected to Fisher’s z transformation before a one-way ANOVA to estimate the task effects. The computation was conducted separately for each ROI type; a two-way ANOVA similar to W’s was avoided to minimize the multiple comparisons problem.

4. Results

4.1. Lateralization

All four tasks activated both hemispheres, showing a leftward asymmetry (Figure 1; Table 1); boxplots of LI values also showed overall left dominance (Figure 2a). ANOVA indicated intense main and interaction effects for both AveLI values (Table 1) and absolute AveLI values (Table 1). For both the AveLI and absolute AveLI values, the Verb task indicated the overall most intensive lateralization among the four tasks. In contrast, the Animal_vis task tended to show the weakest, that is, bilaterality (Figure 2). Looking at the results according to ROI, 55b revealed no significant differences among tasks for either AveLI or absolute AveLI values. In contrast, SFL showed a significant difference with the Verb task greater than the other three tasks for AveLI values; whereas, there were no significant differences among the tasks for absolute AveLI values (Figure 2), which indicated a large amount of right asymmetry and/or bilaterality in the tasks other than the Verb task. The other three ROIs showed a similarity between AveLI and absolute AveLI, as follows. For area44 and 4rois, the Verb task showed higher left lateralization than the other three tasks. For PSL, Animal_vis showed greater bilaterality than the other three tasks.

4.2. Concordance

All Kendal’s W values (computed by ROI by task type) indicated significant concordance across the LI types (ranging from 0.756 to 0.946; p < 0.000) (Figure 3). The ANOVA for W showed a significant trend of differences among tasks (p < 0.10), while the post hoc test indicated no significant differences (Table 2). The average W (standard deviation) was 0.877 (0.058) for Verb, 0.863 (0.039) for Thanks, 0.813 (0.023) for Animal_vis, and 0.812 (0.064) for Animal_aud. Given the significant post hoc differences by ANOVA for correlation coefficients between task types (Table 2), we characterized the results by ROI as follows. Verb showed the highest concordance for W in area44, 55b, and SFL in general. In contrast, Thanks showed the highest concordance with PSL. Finally, Verb and Thanks had a higher concordance than the other two tasks when all four ROIs were combined (4rois) (Figure 3).

5. Discussion

5.1. Verb Task Showing Superiority in Both Lateralization and Concordance

The most exciting coherence found in this study was the Verb task showing higher lateralization, which was estimated using AveLI and absolute AveLI values, as well as the higher concordance of LI value rankings, which was estimated using Kendall’s W. From these findings, we could recommend a verb-generation task for the examination of functional hemispheric asymmetry as the first choice, not only because of its high ability to detect language asymmetry, but also because of the stability of LI rankings regardless of LI computation algorithms. Although Kendall’s W for all tasks showed sufficiently highly significant concordance across LI computation types in each ROI type, the overall superiority of the Verb task was evident in the analysis of W in addition to the analysis of AveLI values.
The superiority of the Verb task was explicitly revealed in the area44 ROI, which was located in the lower part of the inferior frontal gyrus. Kendall’s W of the Verb task was specifically high in area44 (Figure 3), indicating a high concordance of LI rankings across LI types. In addition, the AveLI and absolute AveLI values of the Verb task were significantly higher than those of the other tasks in area44 (Figure 2). Given these findings, the Verb task could be specifically recommended to examine the language asymmetry in the lower part of the inferior frontal gyrus, which is thought to correspond to Broca’s area.
The SFL ROI also revealed that the Verb task showed more left lateralization than the other tasks and excellent concordance in LI rankings. The results might be due to the fundamental role of the presupplementary motor area, which is close to the SFL, in the initiation of language processing, which was involved in the Verb task [57]. In contrast, no significant differences in task types were found in the 55b ROI for the LI values (Figure 2). However, the concordance of the LI rankings was higher in the Verb task than in the other tasks (Figure 3). We can also use the Verb task to examine functional asymmetry in 55b, because it similarly ranks the individuals regardless of LI algorithms according to functional lateralization in this location.

5.2. Thanks Task Showing Superiority in PSL

The following exciting finding was that the Thanks task showed a high concordance of LI rankings, specifically in the PSL (Figure 3). In fact, the high concordance of the Thanks task in PSL appeared to prevent the ANOVA for W from indicating that the Verb task had the highest W of all tasks (Figure 3). Interestingly, in the PSL, the lateralization of the Thanks task was as high as that of the Verb task for both AveLI and absolute AveLI values (Figure 2). Given these findings, the Thanks task, not the Verb task, could be specifically recommended to examine language asymmetry in the PSL, the junction areas of the superior temporal and supramarginal gyri, which is supposed to correspond to Wernicke’s area.
The 4rois ROI condition showed another interesting finding regarding the Verb and Thanks tasks. These tasks were not significantly different in the AveLI values but were different in the absolute AveLI values (Figure 2; Table 1). The results indicated that the left lateralization in the Verb task was generally greater than that in the Thanks task, which was enhanced in the absolute AveLI analysis. In contrast, the concordance of LI rankings was not significantly different between the Verb and Thanks tasks (Figure 3; Table 2). Thus, in the case of examining all four ROIs to be combined at the same time (i.e., 4rois condition), the Verb tasks might be favorable for use because the left lateralization of this task was greater than that of the other tasks, including the Thanks task, while the concordance of LI rankings was similar to that of the Thanks task. This was in contrast to the 55b ROI, which showed no significant differences in the LI, but a significant difference in the concordance of W. Only the 4rois condition presented the reason for the task recommendation in the LI values, but not in concordance (W) (Table 3).

5.3. The Implication of LI Ranking Concordance

Differences among ROIs were evident in the above analyses (Table 3). Previous studies also indicated different characteristics and appropriate task paradigms to examine functional asymmetry for various brain locations [58]. The most remarkable ROI characterizations found in this study were that area44 was good for examination using the Verb task, whereas the PSL was to be examined using the Thanks task. The results admirably correspond to conventional conceptions that Broca’s area, which is close to the area44, has been associated with language production, which is involved in the Verb task. In addition, Wernicke’s area, which is close to the PSL, has been associated with language comprehension, which is involved in the Thanks task.
The mechanism of LI ranking changes for identical datasets depends on the distributions of the activated voxels in ROIs, as follows. Figure 4 illustrates the schemas of various voxel distributions according to voxel intensity. Ideally, the activated voxels would be distributed in a triangular shape, as shown in Figure 4a. The voxel number increases as the intensity decreases; lower intensities near zero are considered noise products, which usually exist in abundance. In the ideal case shown in Figure 4a, the ratio of left (l) to right (r) is the same at any intensity level. In contrast, if the voxel numbers at lower intensities are enlarged in the right ROI, as shown in Figure 4b, the ratio (l:r) varies by intensity. When a threshold is applied when computing the LI, the result of the standard formula (Formula #1) for the above-threshold voxels of distribution 4b may be the same as that of distribution 4a if the threshold is applied at a high intensity level; however, if no threshold is applied and all voxels are used to compute Formula #1, the LI of distribution 4b will shift bilaterally compared with 4a. Subsequently, the ranking of the left asymmetry degree was lowered. Thus, the ranking of LI algorithms with a threshold (p < 0.001, uncorrected, for P001unc and P001unc_v) and those without a threshold will vary. Similarly, as shown in Figure 4c, the ratio l to r varies according to the intensity level when an outlier exists; the LI using the above-threshold voxels would indicate a right dominance at a certain high intensity level, whereas the LI without a threshold would indicate a left dominance. This type of LI change between the left and right dominance for an identical dataset sometimes occurs in reality [1,30,40,59]. The ranking of left asymmetry was dramatically converted in this case.
The LI computation algorithms differ not only in terms of with or without a threshold, but also in the terms used in Formula #1. In Figure 4d, the total number of activated voxels is the same as in the left and right ROIs; the LI using a voxel number (e.g., BaseLI_v) is 0, that is, bilateral. However, the voxels’ intensity frequencies were considerably different for the left and right ROIs; the left ROI included abundant high-intensity voxels but relatively poor low-intensity voxels, whereas the right ROI did the opposite. Then, the LI using voxel intensity (e.g., BaseLI) shifts to left dominance, lifting the left asymmetry ranking. In this case, the left-to-right ratio varies according to the intensity level. By contrast, in Figure 4e, the ratio (l:r) is constant across the intensity level. This distribution indicates complete bilaterality, and the LI value will be 0 for any computational algorithms with minimal change in the LI rankings by the algorithms. Figure 4e shows a rectangular shape; however, a triangular shape, as shown in Figure 4a, which has a constant left-to-right ratio according to the intensity level, will also have the same property of little impact on the LI rankings. These considerations regarding voxel distributions lead us to understand that the changes in LI rankings across LI algorithms depend on the changes in the left-to-right ratio according to the intensity level in the voxel distributions in the left and right ROIs; if the ratio is stable according to the intensity, the LI ranking would also be stable across the computational algorithms.
Returning to the ROI differences in this study, the area44 ROI indicated the top concordance of LI rankings by the Verb task, as described earlier (Figure 3; Table 3). Applying the voxel distribution theory above, the Verb task would induce activation with a constant left-to-right ratio according to the intensity level in the left and right area44 ROIs. The ratio may be varied by other tasks compared with the Verb task in this location. Similarly, the PSL ROI had the highest concordance with the Thanks task, presumably inducing a constant left-to-right ratio for all intensity levels in the voxel distribution of the PSL. Although the details are unknown, a task paradigm that yields stable individual LI rankings across LI algorithms may employ left and right counterpart locations in a constant allocation regarding the intensity level, which may presumably indicate synergetic collaborations by both hemispheres required during language processing.

5.4. Limitations

Only four tasks were examined in this study, and the concordance of LI rankings in the other task paradigms is worth exploring in the future. The multiple comparisons problem could not be prevented because the purpose of the statistics was to characterize the overall features of the tasks. Right dominance was more frequent in this study because we intentionally recruited left-handed individuals to increase the population of right hemisphere dominance [44,45,46,47]. Comparisons between left- and right-handed individuals [44,45,47] should be conducted in a focused manner in the future. We focused on four ROIs, plus their combination, referring to an HCP parcellation [54]. The other brain locations are worth examining in the future; in the clinical context, the determination of ROIs should be carefully conducted because a lesion may distort the functional localization [9].

6. Conclusions

The concordance of individual rankings across various LI computation algorithms, in conjunction with LI values per se, successfully contributes to characterizing task paradigms associated with language-related brain locations with hemispheric asymmetry. The specificity of the ROIs for relevant language tasks was determined. The Verb task, a verb-generation task, had the advantage of examining functional asymmetry specifically in the inferior frontal gyrus, whereas the Thanks task, a listening comprehension task, worked effectively to examine specifically the posterior language area, that is, the junction area of the superior temporal and supramarginal gyri. These brain locations were presumably employed by a constant allocation to the left and right sides of the brain when relevant tasks were performed. Concordance analysis provides a unique contribution independent of lateralization per se, enhancing the qualification performance of task paradigms in elucidating functional hemispheric asymmetry.

Author Contributions

Conceptualization, methodology, investigation, data curation, writing—original draft preparation, K.M.; writing—review and editing, N.Y.-F., K.S., Y.K. and K.A.; resources, Y.K. All authors have read and agreed to the published version of the manuscript.

Funding

This research was funded by a Grant-in-Aid for Scientific Research (C), Japan (JSPS KAKENHI), grant number JP20K07951.

Data Availability Statement

Raw data were generated at Dokkyo Medical University Hospital. The data that support the findings of this study cannot be shared publicly because of the policy of our Institutional Review Board.

Acknowledgments

We would like to thank the MRI technicians at Dokkyo Medical University Hospital for their kind support of the study.

Conflicts of Interest

The authors declare no conflict of interest.

References

  1. Matsuo, K.; Chen, S.H.; Tseng, W.Y. AveLI: A robust lateralization index in functional magnetic resonance imaging using unbiased threshold-free computation. J. Neurosci. Methods 2012, 205, 119–129. [Google Scholar] [CrossRef] [PubMed]
  2. Matsuo, K.; Kono, K.; Shimoda, K.; Kaji, Y.; Akiyama, K. Reproducibility of the lateralization index in functional magnetic resonance imaging across language tasks. J. Neurolinguistics 2021, 57, 100943. [Google Scholar] [CrossRef]
  3. Matsuo, K.; Kono, K.; Yasui-Furukori, N.; Shimoda, K.; Kaji, Y.; Akiyama, K. HomotopicLI: Rationale, characteristics, and implications of a new threshold-free lateralization index of functional magnetic resonance imaging. Laterality 2022, 1–31. [Google Scholar] [CrossRef] [PubMed]
  4. Baxendale, S. The Wada test. Curr. Opin. Neurol. 2009, 22, 185–189. [Google Scholar] [CrossRef] [PubMed]
  5. Massot-Tarrús, A.; Mousavi, S.R.; Mirsattari, S.M. Comparing the Intracarotid Amobarbital Test and Functional MRI for the Presurgical Evaluation of Language in Epilepsy. Curr. Neurol. Neurosci. Rep. 2017, 17, 54. [Google Scholar] [CrossRef] [PubMed]
  6. Abou-Khalil, B. An update on determination of language dominance in screening for epilepsy surgery: The Wada test and newer noninvasive alternatives. Epilepsia 2007, 48, 442–455. [Google Scholar] [CrossRef]
  7. Drane, D.L.; Roraback-Carson, J.; Hebb, A.O.; Hersonskey, T.; Lucas, T.; Ojemann, G.A.; Lettich, E.; Silbergeld, D.L.; Miller, J.W.; Ojemann, J.G. Cortical stimulation mapping and Wada results demonstrate a normal variant of right hemisphere language organization. Epilepsia 2012, 53, 1790–1798. [Google Scholar] [CrossRef] [Green Version]
  8. Austermuehle, A.; Cocjin, J.; Reynolds, R.; Agrawal, S.; Sepeta, L.; Gaillard, W.D.; Zaghloul, K.A.; Inati, S.; Theodore, W.H. Language functional MRI and direct cortical stimulation in epilepsy preoperative planning. Ann. Neurol. 2017, 81, 526–537. [Google Scholar] [CrossRef] [Green Version]
  9. Ille, S.; Sollmann, N.; Hauck, T.; Maurer, S.; Tanigawa, N.; Obermueller, T.; Negwer, C.; Droese, D.; Boeckh-Behrens, T.; Meyer, B.; et al. Impairment of preoperative language mapping by lesion location: A functional magnetic resonance imaging, navigated transcranial magnetic stimulation, and direct cortical stimulation study. J. Neurosurg. 2015, 123, 314–324. [Google Scholar] [CrossRef] [Green Version]
  10. Giussani, C.; Roux, F.E.; Ojemann, J.; Sganzerla, E.P.; Pirillo, D.; Papagno, C. Is preoperative functional magnetic resonance imaging reliable for language areas mapping in brain tumor surgery? Review of language functional magnetic resonance imaging and direct cortical stimulation correlation studies. Neurosurgery 2010, 66, 113–120. [Google Scholar] [CrossRef]
  11. Vakharia, V.N.; Duncan, J.S.; Witt, J.A.; Elger, C.E.; Staba, R.; Engel, J. Getting the best outcomes from epilepsy surgery. Ann. Neurol. 2018, 83, 676–690. [Google Scholar] [CrossRef] [PubMed]
  12. Duncan, J.S.; Winston, G.P.; Koepp, M.J.; Ourselin, S. Brain imaging in the assessment for epilepsy surgery. Lancet Neurol. 2016, 15, 420–433. [Google Scholar] [CrossRef] [PubMed]
  13. Bowyer, S.M.; Zillgitt, A.; Greenwald, M.; Lajiness-O’Neill, R. Language Mapping with Magnetoencephalography: An Update on the Current State of Clinical Research and Practice with Considerations for Clinical Practice Guidelines. J. Clin. Neurophysiol. 2020, 37, 554–563. [Google Scholar] [CrossRef]
  14. Knake, S.; Haag, A.; Hamer, H.M.; Dittmer, C.; Bien, S.; Oertel, W.H.; Rosenow, F. Language lateralization in patients with temporal lobe epilepsy: A comparison of functional transcranial Doppler sonography and the Wada test. NeuroImage 2003, 19, 1228–1232. [Google Scholar] [CrossRef] [PubMed]
  15. Massot-Tarrús, A.; Mirsattari, S.M. Roles of fMRI and Wada tests in the presurgical evaluation of language functions in temporal lobe epilepsy. Front. Neurol. 2022, 13, 884730. [Google Scholar] [CrossRef]
  16. Wada, J.A. A fateful encounter: Sixty years later--reflections on the Wada test. Epilepsia 2008, 49, 726–727. [Google Scholar] [CrossRef] [PubMed]
  17. Ritaccio, A.L.; Brunner, P.; Schalk, G. Electrical Stimulation Mapping of the Brain: Basic Principles and Emerging Alternatives. J. Clin. Neurophysiol. 2018, 35, 86–97. [Google Scholar] [CrossRef]
  18. Szelényi, A.; Bello, L.; Duffau, H.; Fava, E.; Feigl, G.C.; Galanda, M.; Neuloh, G.; Signorelli, F.; Sala, F. Intraoperative electrical stimulation in awake craniotomy: Methodological aspects of current practice. Neurosurg. Focus 2010, 28, E7. [Google Scholar] [CrossRef]
  19. Sanai, N.; Mirzadeh, Z.; Berger, M.S. Functional outcome after language mapping for glioma resection. N. Engl. J. Med. 2008, 358, 18–27. [Google Scholar] [CrossRef]
  20. Berker, E.A.; Berker, A.H.; Smith, A. Translation of Broca’s 1865 report. Localization of speech in the third left frontal convolution. Arch. Neurol. 1986, 43, 1065–1072. [Google Scholar] [CrossRef]
  21. Janecek, J.K.; Swanson, S.J.; Sabsevitz, D.S.; Hammeke, T.A.; Raghavan, M.; Rozman, M.R.; Binder, J.R. Language lateralization by fMRI and Wada testing in 229 patients with epilepsy: Rates and predictors of discordance. Epilepsia 2013, 54, 314–322. [Google Scholar] [CrossRef] [Green Version]
  22. Lee, D.; Swanson, S.J.; Sabsevitz, D.S.; Hammeke, T.A.; Scott Winstanley, F.; Possing, E.T.; Binder, J.R. Functional MRI and Wada studies in patients with interhemispheric dissociation of language functions. Epilepsy Behav. 2008, 13, 350–356. [Google Scholar] [CrossRef] [PubMed] [Green Version]
  23. Rutten, G.J.; Ramsey, N.F.; van Rijen, P.C.; Alpherts, W.C.; van Veelen, C.W. FMRI-determined language lateralization in patients with unilateral or mixed language dominance according to the Wada test. NeuroImage 2002, 17, 447–460. [Google Scholar] [CrossRef]
  24. Brennan, N.P.; Peck, K.K.; Holodny, A. Language Mapping Using fMRI and Direct Cortical Stimulation for Brain Tumor Surgery: The Good, the Bad, and the Questionable. Top. Magn. Reson. Imaging 2016, 25, 1–10. [Google Scholar] [CrossRef] [Green Version]
  25. Black, D.F.; Vachha, B.; Mian, A.; Faro, S.H.; Maheshwari, M.; Sair, H.I.; Petrella, J.R.; Pillai, J.J.; Welker, K. American Society of Functional Neuroradiology-Recommended fMRI Paradigm Algorithms for Presurgical Language Assessment. AJNR Am. J. Neuroradiol. 2017, 38, E65–E73. [Google Scholar] [CrossRef] [Green Version]
  26. Bargalló, N.; Cano-López, I.; Rosazza, C.; Vernooij, M.W.; Smits, M.; Vitali, P.; Alvarez-Linera, J.; Urbach, H.; Mancini, L.; Ramos, A.; et al. Clinical practice of language fMRI in epilepsy centers: A European survey and conclusions by the ESNR Epilepsy Working Group. Neuroradiology 2020, 62, 549–562. [Google Scholar] [CrossRef] [Green Version]
  27. Trimmel, K.; van Graan, L.A.; Gonzálvez, G.G.; Haag, A.; Caciagli, L.; Vos, S.B.; Bonelli, S.; Sidhu, M.; Thompson, P.J.; Koepp, M.J.; et al. Naming fMRI predicts the effect of temporal lobe resection on language decline. Ann. Clin. Transl. Neurol. 2019, 6, 2186–2196. [Google Scholar] [CrossRef] [Green Version]
  28. Rosazza, C.; Ghielmetti, F.; Minati, L.; Vitali, P.; Giovagnoli, A.R.; Deleo, F.; Didato, G.; Parente, A.; Marras, C.; Bruzzone, M.G.; et al. Preoperative language lateralization in temporal lobe epilepsy (TLE) predicts peri-ictal, pre- and post-operative language performance: An fMRI study. NeuroImage Clin. 2013, 3, 73–83. [Google Scholar] [CrossRef] [Green Version]
  29. Polczynska, M.M.; Benjamin, C.F.A.; Moseley, B.D.; Walshaw, P.; Eliashiv, D.; Vigil, C.; Jones, M.; Bookheimer, S.Y. Role of the Wada test and functional magnetic resonance imaging in preoperative mapping of language and memory: Two atypical cases. Neurocase 2015, 21, 707–720. [Google Scholar] [CrossRef]
  30. Liegeois, F.; Connelly, A.; Salmond, C.H.; Gadian, D.G.; Vargha-Khadem, F.; Baldeweg, T. A direct test for lateralization of language activation using fMRI: Comparison with invasive assessments in children with epilepsy. NeuroImage 2002, 17, 1861–1867. [Google Scholar] [CrossRef]
  31. Dym, R.J.; Burns, J.; Freeman, K.; Lipton, M.L. Is functional MR imaging assessment of hemispheric language dominance as good as the Wada test? A meta-analysis. Radiology 2011, 261, 446–455. [Google Scholar] [CrossRef] [PubMed] [Green Version]
  32. Omisade, A.; O’Grady, C.; Sadler, R.M. Divergence between functional magnetic resonance imaging and clinical indicators of language dominance in preoperative language mapping. Hum. Brain Mapp. 2020, 41, 3867–3877. [Google Scholar] [CrossRef] [PubMed]
  33. Benke, T.; Köylü, B.; Visani, P.; Karner, E.; Brenneis, C.; Bartha, L.; Trinka, E.; Trieb, T.; Felber, S.; Bauer, G.; et al. Language lateralization in temporal lobe epilepsy: A comparison between fMRI and the Wada Test. Epilepsia 2006, 47, 1308–1319. [Google Scholar] [CrossRef]
  34. Hamberger, M.J.; Cole, J. Language organization and reorganization in epilepsy. Neuropsychol. Rev. 2011, 21, 240–251. [Google Scholar] [CrossRef]
  35. Dijkstra, K.K.; Ferrier, C.H. Patterns and predictors of atypical language representation in epilepsy. J. Neurol. Neurosurg. Psychiatry 2013, 84, 379–385. [Google Scholar] [CrossRef]
  36. Thuy, D.H.; Matsuo, K.; Nakamura, K.; Toma, K.; Oga, T.; Nakai, T.; Shibasaki, H.; Fukuyama, H. Implicit and explicit processing of kanji and kana words and non-words studied with fMRI. NeuroImage 2004, 23, 878–889. [Google Scholar] [CrossRef] [PubMed]
  37. Binder, J.R.; Tong, J.Q.; Pillay, S.B.; Conant, L.L.; Humphries, C.J.; Raghavan, M.; Mueller, W.M.; Busch, R.M.; Allen, L.; Gross, W.L.; et al. Temporal lobe regions essential for preserved picture naming after left temporal epilepsy surgery. Epilepsia 2020, 61, 1939–1948. [Google Scholar] [CrossRef]
  38. You, X.; Zachery, A.N.; Fanto, E.J.; Norato, G.; Germeyan, S.C.; Emery, E.J.; Sepeta, L.N.; Berl, M.M.; Black, C.L.; Wiggs, E.; et al. fMRI prediction of naming change after adult temporal lobe epilepsy surgery: Activation matters. Epilepsia 2019, 60, 527–538. [Google Scholar] [CrossRef]
  39. Bonelli, S.B.; Thompson, P.J.; Yogarajah, M.; Vollmar, C.; Powell, R.H.W.; Symms, M.R.; McEvoy, A.W.; Micallef, C.; Koepp, M.J.; Duncan, J.S. Imaging language networks before and after anterior temporal lobe resection: Results of a longitudinal fMRI study. Epilepsia 2012, 53, 639–650. [Google Scholar] [CrossRef] [Green Version]
  40. Bradshaw, A.R.; Bishop, D.V.M.; Woodhead, Z.V.J. Methodological considerations in assessment of language lateralisation with fMRI: A systematic review. PeerJ 2017, 5, e3557. [Google Scholar] [CrossRef]
  41. Güntürkün, O.; Ströckens, F.; Ocklenburg, S. Brain Lateralization: A Comparative Perspective. Physiol. Rev. 2020, 100, 1019–1063. [Google Scholar] [CrossRef] [PubMed]
  42. Bless, J.J.; Westerhausen, R.; Torkildsen, J.v.K.; Gudmundsen, M.; Kompus, K.; Hugdahl, K. Laterality across languages: Results from a global dichotic listening study using a smartphone application. Laterality 2015, 20, 434–452. [Google Scholar] [CrossRef] [PubMed] [Green Version]
  43. Oldfield, R.C. The assessment and analysis of handedness: The Edinburgh inventory. Neuropsychologia 1971, 9, 97–113. [Google Scholar] [CrossRef]
  44. Mazoyer, B.; Zago, L.; Jobard, G.; Crivello, F.; Joliot, M.; Perchey, G.; Mellet, E.; Petit, L.; Tzourio-Mazoyer, N. Gaussian mixture modeling of hemispheric lateralization for language in a large sample of healthy individuals balanced for handedness. PLoS ONE 2014, 9, e101165. [Google Scholar] [CrossRef] [PubMed] [Green Version]
  45. Knecht, S.; Drager, B.; Deppe, M.; Bobe, L.; Lohmann, H.; Floel, A.; Ringelstein, E.B.; Henningsen, H. Handedness and hemispheric language dominance in healthy humans. Brain 2000, 123, 2512–2518. [Google Scholar] [CrossRef] [PubMed] [Green Version]
  46. Szaflarski, J.P.; Binder, J.R.; Possing, E.T.; McKiernan, K.A.; Ward, B.D.; Hammeke, T.A. Language lateralization in left-handed and ambidextrous people: FMRI data. Neurology 2002, 59, 238–244. [Google Scholar] [CrossRef] [PubMed] [Green Version]
  47. Isaacs, K.L.; Barr, W.B.; Nelson, P.K.; Devinsky, O. Degree of handedness and cerebral dominance. Neurology 2006, 66, 1855–1858. [Google Scholar] [CrossRef]
  48. Wong, S.W.; Jong, L.; Bandur, D.; Bihari, F.; Yen, Y.F.; Takahashi, A.M.; Lee, D.H.; Steven, D.A.; Parrent, A.G.; Pigott, S.E.; et al. Cortical reorganization following anterior temporal lobectomy in patients with temporal lobe epilepsy. Neurology 2009, 73, 518–525. [Google Scholar] [CrossRef] [Green Version]
  49. Lukic, S.; Licata, A.E.; Weis, E.; Bogley, R.; Ratnasiri, B.; Welch, A.E.; Hinkley, L.B.N.; Miller, Z.; Garcia, A.M.; Houde, J.F.; et al. Auditory Verb Generation Performance Patterns Dissociate Variants of Primary Progressive Aphasia. Front. Psychol. 2022, 13, 887591. [Google Scholar] [CrossRef]
  50. Wager, T.D.; Nichols, T.E. Optimization of experimental design in fMRI: A general framework using a genetic algorithm. NeuroImage 2003, 18, 293–309. [Google Scholar] [CrossRef]
  51. Moore-Parks, E.N.; Burns, E.L.; Bazzill, R.; Levy, S.; Posada, V.; Müller, R.A. An fMRI study of sentence-embedded lexical-semantic decision in children and adults. Brain Lang. 2010, 114, 90–100. [Google Scholar] [CrossRef] [PubMed] [Green Version]
  52. Backes, W.; Vuurman, E.; Wennekes, R.; Spronk, P.; Wuisman, M.; van Engelshoven, J.; Jolles, J. Atypical brain activation of reading processes in children with developmental dyslexia. J. Child Neurol. 2002, 17, 867–871. [Google Scholar] [CrossRef] [PubMed] [Green Version]
  53. Liebig, J.; Froehlich, E.; Morawetz, C.; Braun, M.; Jacobs, A.M.; Heekeren, H.R.; Ziegler, J.C. Neurofunctionally dissecting the reading system in children. Dev. Cogn. Neurosci. 2017, 27, 45–57. [Google Scholar] [CrossRef] [PubMed]
  54. Glasser, M.F.; Coalson, T.S.; Robinson, E.C.; Hacker, C.D.; Harwell, J.; Yacoub, E.; Ugurbil, K.; Andersson, J.; Beckmann, C.F.; Jenkinson, M.; et al. A multi-modal parcellation of human cerebral cortex. Nature 2016, 536, 171–178. [Google Scholar] [CrossRef] [Green Version]
  55. Tzourio-Mazoyer, N.; Landeau, B.; Papathanassiou, D.; Crivello, F.; Etard, O.; Delcroix, N.; Mazoyer, B.; Joliot, M. Automated anatomical labeling of activations in SPM using a macroscopic anatomical parcellation of the MNI MRI single-subject brain. NeuroImage 2002, 15, 273–289. [Google Scholar] [CrossRef]
  56. Maldjian, J.A.; Laurienti, P.J.; Kraft, R.A.; Burdette, J.H. An automated method for neuroanatomic and cytoarchitectonic atlas-based interrogation of fMRI data sets. NeuroImage 2003, 19, 1233–1239. [Google Scholar] [CrossRef]
  57. Ahmadi, Z.Z.; DiBacco, M.L.; Pearl, P.L. Speech Motor Function and Auditory Perception in Succinic Semialdehyde Dehydrogenase Deficiency: Toward Pre-Supplementary Motor Area (SMA) and SMA-Proper Dysfunctions. J. Child Neurol. 2021, 36, 1210–1217. [Google Scholar] [CrossRef]
  58. Bradshaw, A.R.; Thompson, P.A.; Wilson, A.C.; Bishop, D.V.M.; Woodhead, Z.V.J. Measuring language lateralisation with different language tasks: A systematic review. PeerJ 2017, 5, e3929. [Google Scholar] [CrossRef]
  59. Nagata, S.I.; Uchimura, K.; Hirakawa, W.; Kuratsu, J.I. Method for quantitatively evaluating the lateralization of linguistic function using functional MR imaging. AJNR Am. J. Neuroradiol. 2001, 22, 985–991. [Google Scholar]
Figure 1. ROIs and activation by a group study. z, z-coordinate of an MNI space; R, right. In the rows other than ROIs, the red part indicates activation at a threshold of p < 1 × 10⁻⁷, uncorrected (T > 6.3675); yellow indicates that of p < 0.001, uncorrected (T > 3.3256); and magenta indicates that of p < 0.5, uncorrected (T > 0.000). N = 38. The background anatomy is the average T1-weighted images of the 38 participants.
Symmetry 15 00193 g001
Figure 2. Boxplots of AveLI values (a) and absolute AveLI values (b) of four tasks by five ROI types. AveLI values could range from −1 (most rightward) to 1 (most leftward); 0 indicates bilaterality. Boxes of 55b, area44, PSL, SFL, and 4rois are displayed in this order, each of which includes boxes of Thanks (magenta), Verb (pink), Animal_aud (pale blue), and Animal_vis (blue) tasks. In each box, the middle thick line indicates the median, whereas the top and bottom of the box indicate 75% and 25% points of data, respectively. The upper extension reaches the greatest data within (3Q−1Q) × 1.5 beyond the 75% line, whereas the lower extension reaches the smallest data within (3Q−1Q) × 1.5 below the 25% line. Data are shown in dots (n = 38). Asterisks (*) represent significant differences (p < 0.05) between tasks by post hoc tests summarized in ANOVA tables (Table 1).
Symmetry 15 00193 g002
Figure 3. Kendall’s W across LI types. All W data are displayed (20 in total). W values could range from 0 (no agreement) to 1 (complete agreement). All values presented in the panel indicate significantly high agreement across individual rankings (p < 0.000). N = 38. Asterisks (*) represent significant post hoc results (p < 0.05) of ANOVA of correlation coefficients (CC) between tasks (Table 2). Note that the order of the CC results was not necessarily the same as that of the W.
Symmetry 15 00193 g003
Figure 4. Schemas of voxel distributions according to voxel intensity. Left (mustard) and Right (grass green) indicate voxels in the left and right counterpart ROIs, respectively. The horizontal length indicates the activated voxel number at the corresponding intensity level. (a) A distribution having the greatest numbers of voxels in the left and right ROIs near intensity 0 and constantly decreasing the voxel numbers according to the elevation of activation intensity. The ratio l:r is constant across the intensity levels. (b) A distribution having abundant lower-intensity voxels (that is, noise) in the right ROI. (c) A distribution having an outlier in the right ROI. (d) A distribution having the greatest number of voxels in the right ROI but no voxels in the left ROI near the intensity 0. A constant decrease in voxel number occurs in the right ROI, and a constant increase occurs in the left ROI, according to the elevation of the intensity level, resulting in the greatest number of voxels in the left ROI, but no voxels in the right ROI near the top intensity. This shifts the ratio l:r from 0:1 (intensity 0) to 1:0 (top intensity). (e) A distribution having no changes of voxel number in regard to the intensity level. (d’,e’) Simulations of activation maps corresponding to distributions of panels (d,e), respectively. In panel (d’), the right ROI activation involves a lot of lower intensity voxels colored pale yellow, whereas the left ROI activation involves a lot of higher intensity voxels colored red. In panel (e’), the maps are the same between the left and right ROIs because both left and right ROIs involve the same number of voxels at any intensity level. See text for detailed discussion.
Symmetry 15 00193 g004
Table 1. Results of lateralization index values.
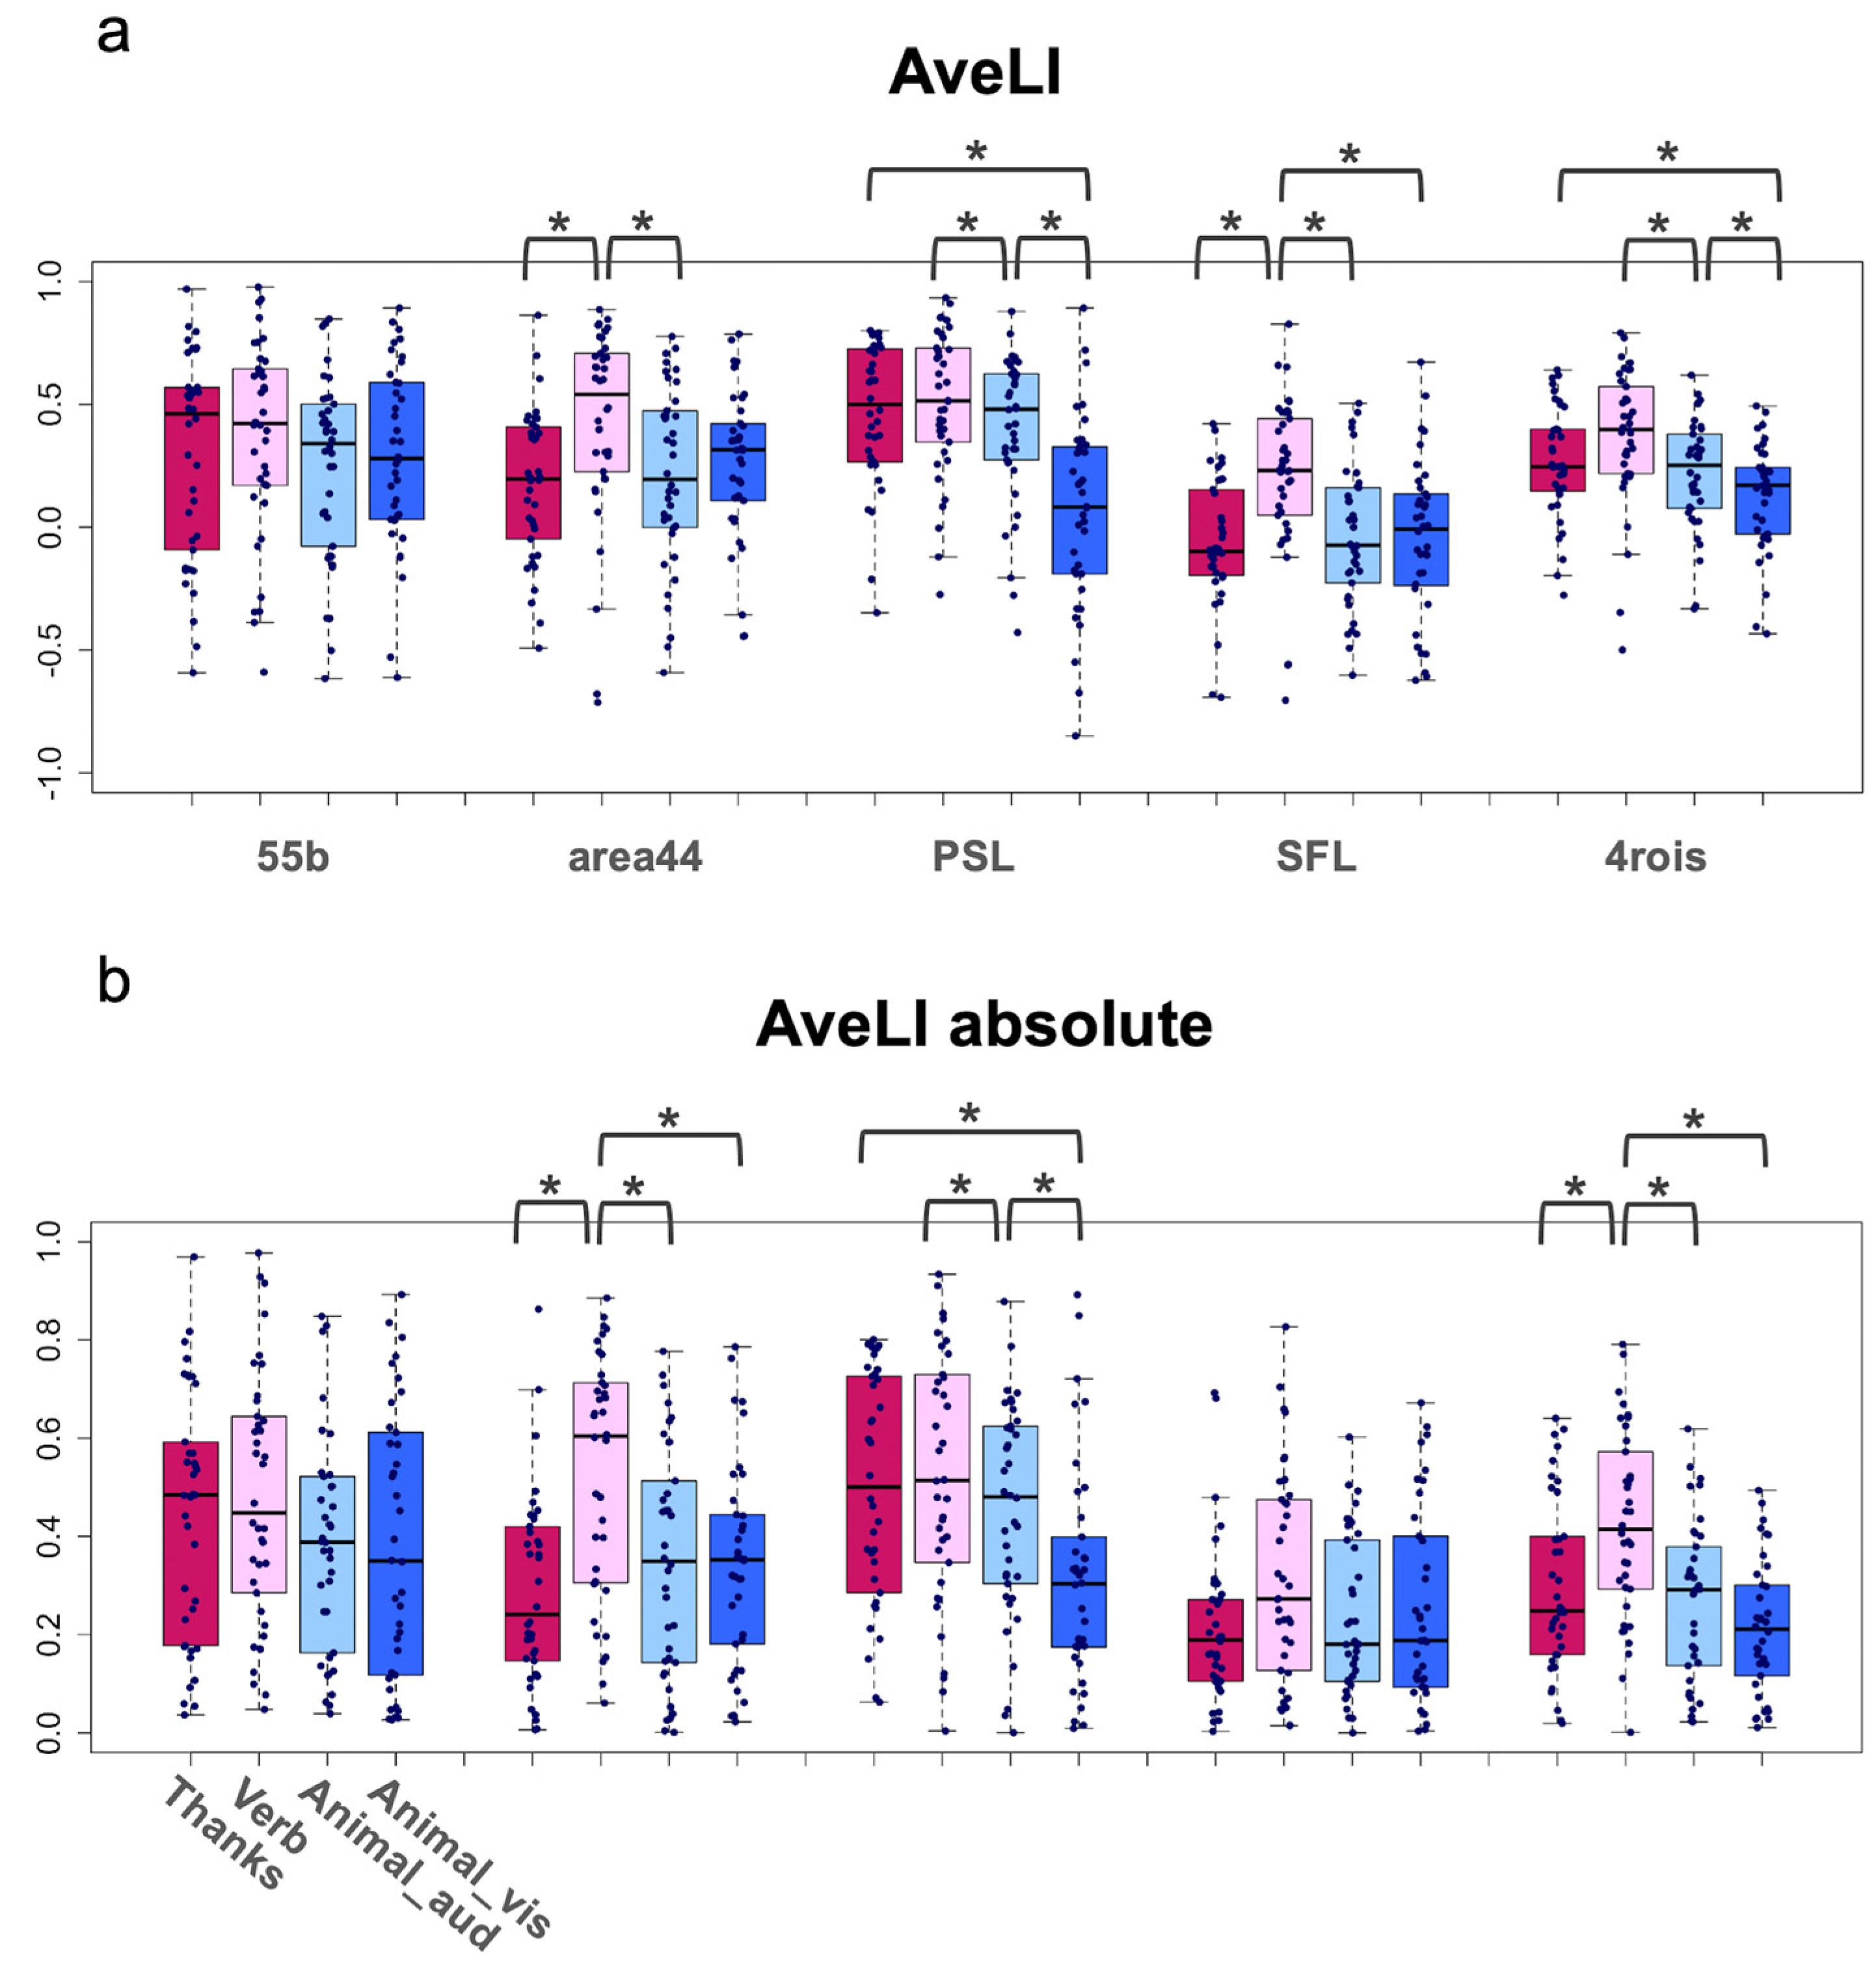
Summary of AveLI Values
ROITaskMeanSDMinMax
55bThanks0.293 0.420 −0.592 0.969
Verb0.370 0.400 −0.590 0.977
Animal_aud0.246 0.371 −0.616 0.848
Animal_vis0.294 0.369 −0.612 0.892
area44Thanks0.172 0.306 −0.492 0.863
Verb0.430 0.393 −0.713 0.885
Animal_aud0.207 0.366 −0.592 0.777
Animal_vis0.261 0.303 −0.444 0.786
PSLThanks0.467 0.287 −0.348 0.801
Verb0.505 0.295 −0.274 0.934
Animal_aud0.405 0.302 −0.429 0.878
Animal_vis0.064 0.384 −0.849 0.892
SFLThanks−0.064 0.259 −0.692 0.421
Verb0.203 0.325 −0.704 0.827
Animal_aud−0.039 0.283 −0.602 0.505
Animal_vis−0.048 0.320 −0.623 0.672
4roisThanks0.263 0.228 −0.277 0.640
Verb0.372 0.279 −0.500 0.791
Animal_aud0.216 0.224 −0.332 0.619
Animal_vis0.129 0.219 −0.433 0.494
Grand 0.237 0.357 −0.849 0.977
ANOVA for AveLI Values
SourceF-Valuedfp-ValueG.O.^2Post hoc test
Main effects
Task15.1973, 1110 ***0.055T2 > T1 = T3 = T4
ROI15.2954, 1480 ***0.107R3 = R1 = R5 = R2 > R4
Interaction effects
Task × ROI *111.31712, 4440 ***0.044R2: T2 > T3 = T1
R3: T2 > T3 > T4, T1 > T4
R4: T2 > T4 = T3 = T1
R5: T2 > T3 > T4, T1 > T4
ANOVA for Absolute AveLI Values
SourceF-Valuedfp-ValueG.O.^2Post hoc test
Main effects
Task15.2823, 1110 ***0.060T2 > T1 = T3 = T4
ROI13.1884, 1480 ***0.092R3 = R1 > R5 = R4, R2 > R4
Interaction effects
Task × ROI *13.83412, 4440 ***0.022R2: T2 > T4 = T3 = T1
R3: T2 > T3 > T4, T1 > T4
R5: T2 > T1 = T3 = T4
Notes: SD, standard deviation; Min, minimum; Max, maximum. T1 to T4 represent Thanks, Verb, Animal_aud, and Animal_vis, respectively; R1 to R5 represent 55b, area44, PSL, SFL, and 4rois. df, degree of freedom; G.O.^2, generalized omega squared; *** p < 0.001. *1 The post hoc test column for interaction effects only summarizes the comparisons between tasks at each ROI type.
Table 2. Results of Kendal’s W.
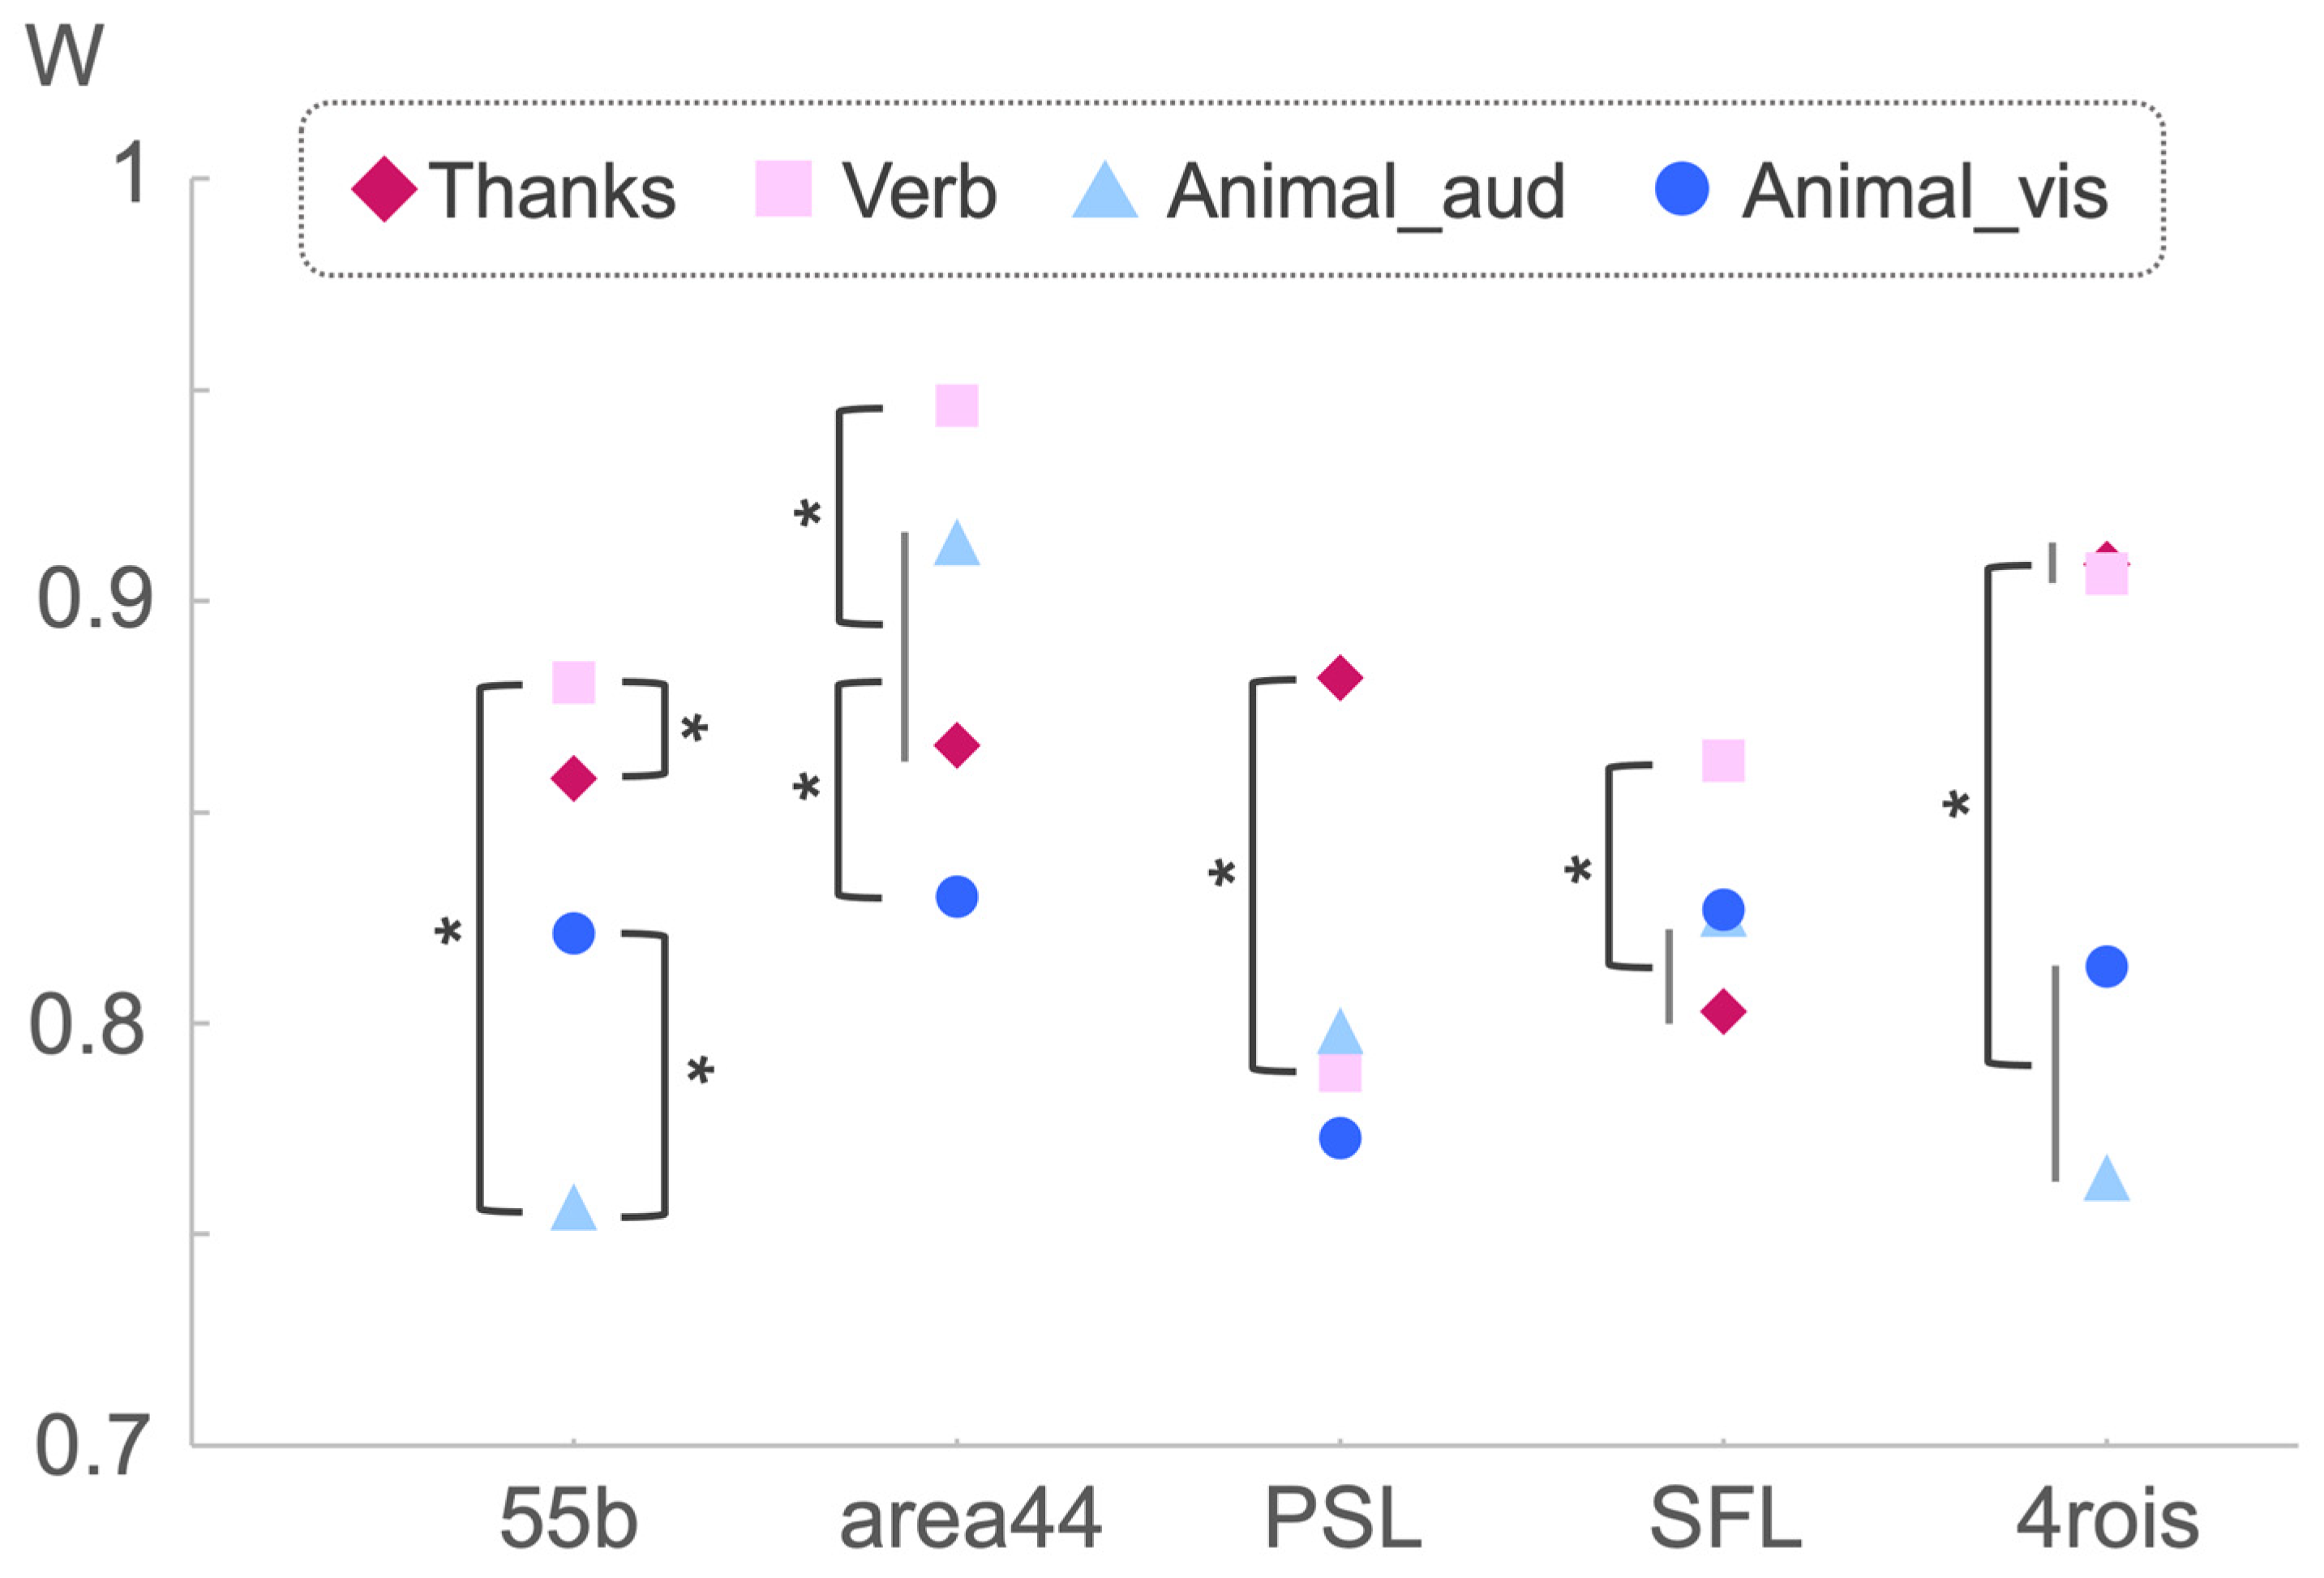
ANOVA Results of Kendal’s W
SourceF-Valuedfp-ValueG.O.^2
Tasks2.9103, 120.078 +0.187
ANOVA results of correlation coefficients between tasks
ROI typesF-Valuedfp-ValueG.O.^2Post hoc test
55b9.694 3, 600.000 ***0.044 T2 > T1 = T3, T4 > T3
area4437.152 3, 600.000 *** 0.084 T2 > T3 = T1 > T4
PSL2.937 3, 600.040 * 0.017 T1 > T2
SFL10.532 3, 600.000 *** 0.033 T2 > T3 = T1
4rois14.824 3, 600.000 *** 0.062 T2 = T1 > T4 = T3
Notes: df, degree of freedom; G.O.^2, generalized omega squared; +, p < 0.10; *, p < 0.05; ***, p < 0.001. For the lower part, the source of the effects was all from task differences. T1 to T4 represents Thanks, Verb, Animal_aud, and Animal_vis, respectively.
Table 3. Summary of ROIs and recommended task paradigms to examine functional asymmetry.
ROIRecommendAveLIAbs. AveLIW
55bVerbn.s.n.s.Top
area44VerbTopTopTop
PSLThanksTop
(Verb = Thanks)
Top
(Verb = Thanks)
Top
SFLVerbTopn.s.Top
4roisVerbTop
(Verb = Thanks)
TopTop
(Verb = Thanks)
Notes. Abs. AveLI, absolute AveLI; n.s., no significant difference in the post hoc test; Top, having the highest values among the tasks for the task indicated in the recommend column, with significant differences in the post hoc test. The decisive factors for recommending the task paradigm for each ROI are in bold.
Disclaimer/Publisher’s Note: The statements, opinions and data contained in all publications are solely those of the individual author(s) and contributor(s) and not of MDPI and/or the editor(s). MDPI and/or the editor(s) disclaim responsibility for any injury to people or property resulting from any ideas, methods, instructions or products referred to in the content.

