Abstract
Due to the difference in distance cognition between virtual and real symmetric space, it is difficult for users to accurately interact with the target in the Digital Twin system. In order to study the cross-effects of interaction task, target size and target location on the accuracy of egocentric peripersonal distance cognition, a 2 × 5 × 9 × 5 asymmetric experiment was designed and carried out. There were two kinds of interaction tasks, five kinds of interaction target widths and nine kinds of spatial locations set to estimate the five egocentric peripersonal distances. Based on the experimental data, with interaction task, target width and the actual spatial location as independent variables and virtual interaction location as a dependent variable, the mapping model between the actual physical location and virtual interaction location of different interaction targets was constructed and evaluated by multiple linear regression method. The results showed that the prediction model constructed by stepwise regression method was simple and less computationally intensive, but it had better stability and prediction ability. The correlation coefficients R2 on xp, yp and zp were 0.994, 0.999 and 0.998, RMSE values were 2.583 cm, 1.0774 cm and 1.3155 cm, rRMSE values were 26.57%, 12.60% and 1.15%, respectively. The research of relevant experiments and the construction of models are helpful to solve the layout optimization problem of virtual interactive space in the Digital Twin system.
1. Introduction
Distance cognition refers to the observer’s estimation of the distance between external objects or between himself and an external object. The distance estimated by distance cognition is called perceptual distance. Research shows that the perceptual distance in real space is generally 87~91% of the actual distance, while in VR space it is generally 41~72% [1]. The process of distance cognition consists of three basic and continuous psychological stages: perception stage; analysis stage; and report stage.
The perception stage refers to the observer using his eyes or other senses to perceive the distance of the target object to himself or its location relative to a reference object. In the perceptual stage, people usually make judgments based on visual cues, which are various sources of information collected and used by the visual system to understand and perceive the natural depth of field. Page et al. [2] divided visual cues into 10 categories: occlusion; relative size; relative density; visual field height; and perspective of motion. Faure et al. [3] divided visual cues into four categories: graphic cues; motion-generated cues; oculomotor cues; and binocular parallax.
In the analysis stage, distance estimation is one of the important problems to be solved [4]. Paes et al. [2] proposed that the distance estimation region can be divided into three self-centered circular regions according to the location of the target object relative to the observer, which are as follows: near space (within 1.5 m); action space (between 1.5–30 m); and distant space (beyond 30 m), and are also called near field, middle field and far field by Ping et al. [5], as shown in Figure 1. According to the reference frame, distance cognition can be divided into egocentric distance and exocentric distance. The egocentric distance takes the observer as the center to estimate the distance from the target object, while the exocentric distance refers to the distance between the other two target objects in the environment, except the observer [6]. The egocentric distance can be divided into egocentric peripersonal distance (within 1.5 m) and egocentric extrapersonal distance (1.5 m away) according to the location of the target object relative to the observer. According to the definition, distance judgment includes absolute distance, relative distance and sequential judgment. Absolute distance judgment means that the observer uses predefined criteria (meters, inches, etc.) to judge the distance; relative distance judgment means that the observer compares two or more target objects to judge their near and far relationship; sequential judgment means that the observer sorts the depth of multiple target objects.
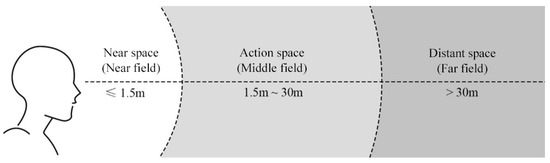
Figure 1.
Range estimation region division (according to the location of the target object relative to the observer).
There are three main reporting methods: verbal reporting; perceptual matching; and visual orientation method (such as blind walking matching, blind throwing and triangulation) [7]. Verbal reporting is the simplest method, in which the observer only needs to orally tell the relative location or absolute distance of the target object. In the perceptual matching method, the observer needs to determine the spatial location of one target object and then move the other target object to a similar location [8]. The deviation in the perceptual matching method is much lower than that of the verbal reporting method. The most commonly used method of visual orientation is blind walking, which requires the observer to walk blindfolded to the location of the target object, so there is no visual clue for support [9]. Triangulation is an improved form of blind walking, in which the observer moves a slanted distance and then estimates the distance by walking or pointing. As triangulation does not require the observer to walk to the target location, it saves time on distance estimation and helps in customizing experiments and setting up experimental sites. Blind throwing requires the observer, with his eyes covered, to throw a specific object (such as a sandbag) at the spatial location he previously perceived the target to be in. Although this method does not require walking, the observer also lacks the support of visual cues, so it is used only when blind walking is not appropriate or due to the danger of the environment.
2. Related Work
In order to analyze the difference of distance cognition in different environments, a total of 324 pieces of literature were collected, including works on the distance cognition of real and virtual symmetric spaces, two symmetric distances: egocentric peripersonal and egocentric extrapersonal, and outer center distance. Articles without research methods, which did not meet the definition of stereoscopic display and distance cognition, and which had no data to extract, were excluded. Finally, 39 articles were selected for data extraction and quantitative analysis.
Since the analyzed data came from different journals, in order to conduct accurate analysis and evaluation, the overall distance cognition deviation was calculated by using the overall distance cognition accuracy (PO).
In Equation (1), Pj is the distance cognition accuracy in study j (expressed by the ratio of perceived distance to actual distance), nj is the sample size in the jth study (i.e., the number of participants), and k is the total number of studies under certain conditions.
2.1. Quantitative Analysis of Egocentric Distance Cognition
2.1.1. Egocentric Extrapersonal Distance
Figure 2 and Figure 3, respectively, summarized the egocentric extrapersonal distance cognition of real space and VR space. Figure 2 and Figure 3 showed that for a different range of distance, people’s cognition of distance in real space was more accurate than that in VR space. The distance cognition accuracy of users in real space and VR space was shown in Table 1. According to Equation (1), the overall distance cognition accuracy of users in real space and VR space were 94% and 80%, respectively. In the study of Willemsen et al. [10], it was found that users’ estimation of egocentric extrapersonal distance was as low as 44% of the actual distance. It could be seen from previous studies that users tended to underestimate the egocentric extrapersonal distance cognition in the VE (virtual environment).
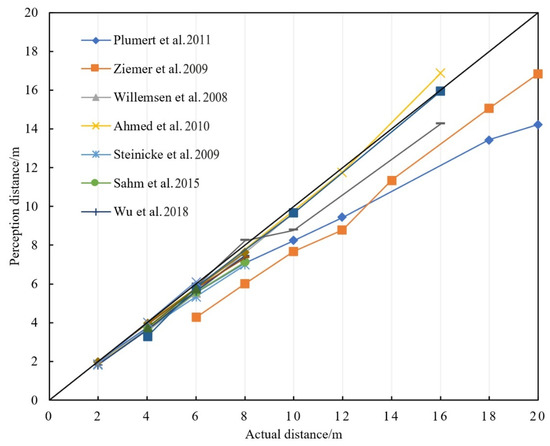
Figure 2.
Egocentric extrapersonal distance cognition in real space [2,6,10].
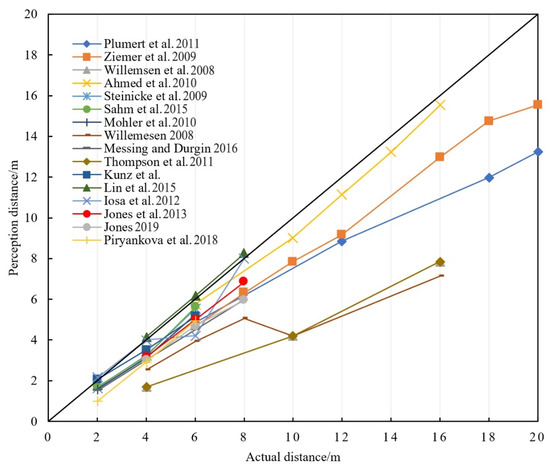
Figure 3.
Egocentric extrapersonal distance cognition in VR space [2,6,8,10].

Table 1.
Distance cognition accuracy of users in real and VR space.
2.1.2. Egocentric Peripersonal Distance
Relevant studies showed that egocentric peripersonal distance cognition was more accurate than egocentric extrapersonal distance cognition in both real space and VR space. Naceri et al. [11] showed that it was easier and more accurate for users to perform interaction tasks in the near space of VR space. Armbruster et al. [12] found that users could identify objects in the correct order when performing interaction tasks in the near space of VR space, and the error rate was very small when performing pointing tasks. The egocentric peripersonal distance cognition difference in VR space was shown in Figure 4.

Figure 4.
Egocentric peripersonal distance cognition in VR space [5,11,12].
2.2. Research of Egocentric Distance Cognition
There were relatively few studies on the exocentric distance cognition. Nikolić et al. [13] and Joe et al. [14] showed that users’ exocentric distances cognition in real space was accurate, but they tended to underestimate in VR space. The research of Gralak [15] showed that users’ exocentric distances cognition was overestimated in both real space and VR space. Li [16] conducted two experiments to observe the effect of a larger GFOV (geometric field of view) on the accuracy of distance judgment. In the first experiment, HMD (Head-Mounted Display) with limited GFOV was used to find any overestimation of distance cognition. The second experiment found that distance cognition was more accurate through extended GFOV. In the experiment of Lin et al. [17,18], perceptual matching task was used to analyze and evaluate distance cognition in VR and AR space. They found that in VR and AR space, users’ overall distance cognition accuracy was only 80% and 84% of the actual distance, respectively.
2.3. Research of Egocentric Distance Cognition
In VR space, users’ distance cognition is mainly characterized by underestimation. Such wrong judgment of distance will directly affect the interaction efficiency of VR space. Therefore, scholars at home and abroad have studied the causes of this phenomenon and summarized them as follows:
2.3.1. Report Method
Some scholars believed that the participants adopted different reporting methods when performing distance cognition tasks, resulting in inaccurate data. The experimental results of Malbos et al. [19] showed that perceptual matching method was more accurate than verbal reporting method in distance cognition. Makaremi et al. [20] evaluated the impact of blind throwing and blind walking in peripersonal distance cognition. Willemsen et al. [21] compared the difference in distance cognition between blind walking and triangulation walking. The overall research showed that perceptual matching and visual orientation methods were more effective than verbal reporting methods, which was consistent with the conclusion reached by Marsh et al. [22] in real space.
2.3.2. Quality of Computer Graphics
Another factor affecting distance cognition accuracy is the quality of computer graphics in the VE. Cardoso et al. [23] emphasized the importance of creating an accurate VE for improving distance perception and stated that the transition between the real environment and VE should be smooth enough for users to better understand the latter. Yu et al. [24] found that texture had a significant impact on distance cognition. When users performed perceptual matching tasks, better texture quality resulted in smaller error in distance estimation. Naceri et al. [11] compared the influence of dark, moderate and bright environmental brightness in VR space, and found that distance cognition was the most accurate in a bright room environment, while the tendency to underestimate distance cognition was the most serious in a dark room.
2.3.3. Technology of Stereoscopic Display
Some scholars attributed the underestimation of distance cognition in VR space to the limitations of FOV, while others believed it was caused by the mass and inertia of HMD itself.
2.3.4. VR Experience of Participants
Bremers et al. [25] analyzed the importance of training participants who participated in distance cognition experiments and found that VR experience could indeed improve the accuracy of distance cognition through experimental comparison. Similarly, the study of Hong et al. [26] found that in the same space, the participants’ second distance cognition would be improved by the first experience.
2.3.5. Other Factors
In addition to these main factors, the researchers found other potential factors. Grabowski et al. [27] found that tactile feedback could effectively improve users’ distance cognition. Harris et al. [28] studied the influence of viewing the simulated body (static and dynamic) of oneself in HMD-based VR on measured egocentric extrapersonal distance. It is worth noting that the influence of each factor is not independent, and is usually a combination of multiple factors. Hecht et al. [29] studied the effect of graphic quality on distance cognition in VR without visual feedback and visual clues. They found that graphic quality had a positive effect on distance perception accuracy when using verbal reporting, but not when using blind walking.
To sum up, it is difficult for users to accurately interact with the target in Digital Twin system due to the difference in distance cognition between virtual space and real space, which is manifested as the virtual interaction location Qp (the location that the user touches when completing the interaction) cannot coincide with the actual physical location Qa of each interactive control, as shown in Figure 5.
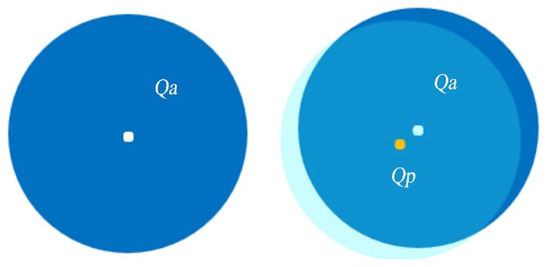
Figure 5.
The Qp and the Qa of interactive controls.
The main contribution of this paper is as follows: (1) A asymmetric 2 × 5 × 9 × 5 experiment was designed and carried out, with two kinds of interaction tasks, five kinds of interaction target widths and nine kinds of spatial locations to estimate the egocentric peripersonal distance. According to the experimental results, the separate and cross effects of interaction task, target width and target location on distance cognition were studied. (2) The machine learning method was used to construct the matching relationship between the actual and virtual symmetric positions of the interaction target, so as to realize the prediction of the virtual interaction location. (3) The optimal model was determined by comparing and evaluating the prediction models established by multiple linear regression and stepwise regression.
3. Virtual Interactive Space Distance Cognition Experiment
3.1. Experimental Equipment and Related Tools
HTC Vive Pro, a VR experience device produced by HTC Company (Taoyuan City, Taiwan), was selected as the experimental device. The viewing angle of the device is 110 degrees, matching the maximum viewing angle of the human eyes. HMD’s monocular and binocular resolutions are 1440 × 1600 pixels and 2880 × 1200 pixels, respectively. The refresh rate of stereoscopic display is 90 Hz. The HMD is equipped with 32 photoelectric sensors for the locator to capture and support the user to rotate and move 360 degrees in all directions. HTC motion sensing controller (handle) was used as the input device in the experiment. The handle is equipped with 24 photoelectric sensors for location. Users can trigger interactive events by pressing the trigger button below the handle. Figure 6 shows the HTC Vive’s devices.
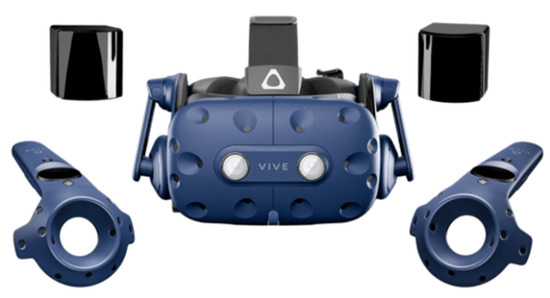
Figure 6.
HTC Vive Pro device.
The experiment set up five egocentric peripersonal distance interaction tasks of 50 cm, 75 cm, 100 cm, 125 cm and 150 cm. In the VR system, the participants interacted with the target objects in different distance planes through rays, and the ray lengths were set to 30 cm, 50 cm, 70 cm, 90 cm and 110 cm, respectively. To provide a similar experience to real space, five light hollow sticks of the same length as the rays provided in the VR system were used and fastened to the gamepad. To make the mass difference between the five sticks small enough that it did not affect the participants’ interaction and hardware performance, the researchers carefully selected the materials of the sticks. The end of the stick is equipped with a reflection mark for location. In the experiment, Microsoft Kinect 2.0 (SN: WA 98052-6399) motion capture device (as shown in Figure 7) was used to identify the reflection mark attached to the end of the stick, and the corresponding location data was tracked and recorded at the speed of 120 frames per second.
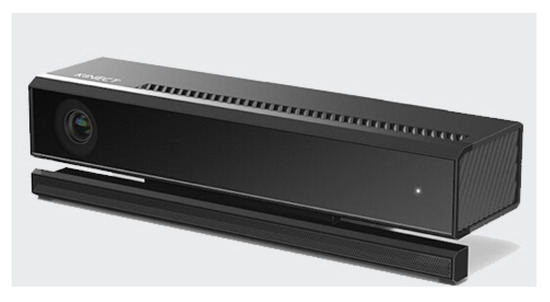
Figure 7.
Microsoft Kinect 2.0 motion capture device.
3.2. VR System and Experiment Participants
The VR system was developed by the UE4 platform, and the experimental platform was built by HTC Vive Pro. The participants used the matching HMD and gamepad input devices to interact with the VR system. According to the “Research Report on VR User Behavior in China” released in 2016, most VR system users are between 20 and 40 years old. Therefore, this experiment selected 10 graduate students (six male and four female) with VR system development or play experience. The average age of the participants is 24.6 years old. The SD (Standard Deviation) is 1.35, and all of them are right-handed. The visual function of the participants is normal or normal after correction, and no symptoms of 3D vertigo appeared during the VR experience.
3.3. Experimental Scheme Design
In this experiment, a 2 × 5 × 9 × 5 repeated measurement design was adopted. A total of two interaction tasks (pointing task and placing task), five interactive target widths (five spheres with diameters of 2 cm, 4 cm, 6 cm, 8 cm and 10 cm) and nine spatial locations were set, respectively, to estimate five egocentric peripersonal distances (as shown in Figure 8). The pointing task required the participants to click the random target spheres in turn, and before each pointing task, they needed to click the initial location (S), which was set 25 cm from the viewpoint. The placing task required the participants to place the target sphere at the initial location in turn. Each participant performed 450 non-repetitive interaction tasks, including 225 pointing tasks and 225 placing tasks.
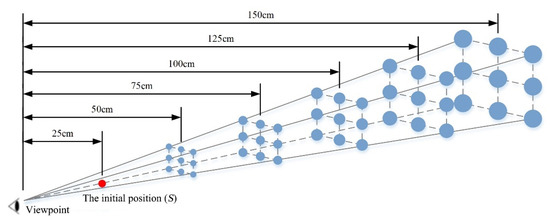
Figure 8.
Nine spatial locations of the interactive target at each egocentric distance.
The experiment uses Fitts law to determine the difficulty of the user interaction task. Fitts law was proposed by Paul M. Fitts [30]. He studied the movement rule, movement range, task time and task accuracy of users in the process of interaction. It was found that the time consumed by users to move any point to the target center in the interaction process was related to the distance from the point to the target center and the width of the target. The distance is proportional to time, while the target width is inversely proportional to time. The Equation is expressed as follows:
where a and b are constant terms, is the task time of the user from the initial location to the target location, ID is the difficulty coefficient, A is the movement amplitude, and W is the interactive target width.
To ensure the same difficulty coefficient of participants performing interaction tasks at different distances, five difficulty coefficients (ID) were set according to five different interactive target widths, and the interactive target widths (sphere diameters) at different distances were modified according to the difficulty coefficient Equation of Fitts law (as shown in Equation (3)). The relevant parameter values are shown in Table 2.
Table 2.
The five task difficulty coefficients corresponding to the movement amplitude and target width values.
3.4. Experimental Environment Layout
The experiment was carried out in the VR laboratory with no other interference factors and good lighting. The VE was set to free mode according to the room settings in Steam VR, and the size of the VE was delimited in a 3 m × 4 m rectangular area, with adjustable height chairs placed in the middle of the area. After wearing HTC Vive Pro, the participants sat on a chair and adjusted the seat to achieve the specified HMD eye height. HMD eye height was 115 cm for males and females at the 50th percentile according to the sitting standard of the adult human body in China. The Kinect 2.0 motion capture device was hung directly above the viewpoint location (O) to record the spatial location of the markers fixed at the end of the stick when the participants performed interaction tasks. The specific layout of the VR laboratory is shown in Figure 9.
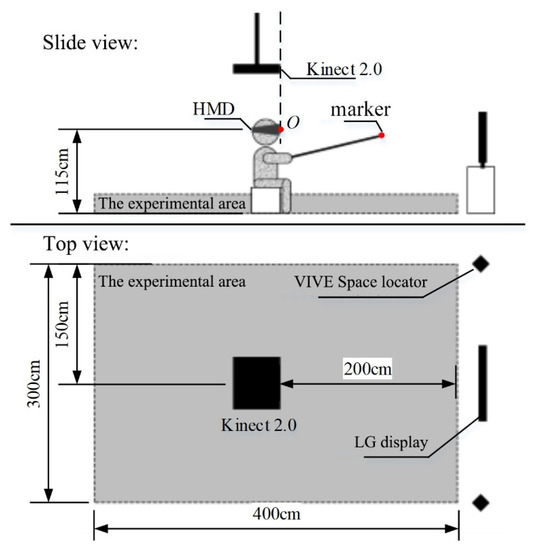
Figure 9.
Side and top view of VR lab space layout.
The participants were immersed into the VR experimental system by wearing the HMD device, and the space inside the system was set as a rectangular area with a size of 3 m × 4 m. Figure 10 shows the location of the interactive target in the VR experimental system, and the view location (O) in the figure is 115 cm above the center of the rectangular area. Each interactive target was placed in the optimal eye rotation zone according to the spatial location shown in Figure 8 (the rotation amplitude of the eye was determined to be 60°) to determine the spacing between each interactive target. A spatial Cartesian coordinate system was established by taking the viewpoint’s landing point (G) on the floor as the origin of coordinates, and the visual direction of the participant was the positive direction of x-axis, the right direction of the participant was the positive direction of y-axis, and the vertical direction of z-axis. The spatial location of each interactive target in the VR system could be obtained, namely Qa = (x, y, z). Table 3 shows the coordinate values of Qa for five different egocentric distances.
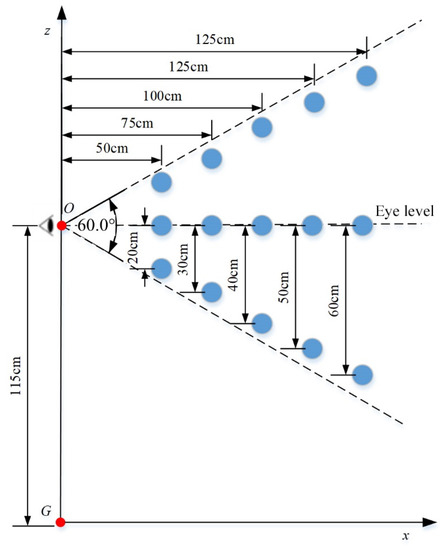
Figure 10.
Side view and the coordinate system of the target placement location in a VR experimental system.
Table 3.
Coordinate values of Qa for five different egocentric distances.
3.5. Experimental Process
First, the researchers described the tasks and procedures to the participant through verbal descriptions and demonstrations. Then, the participant wore relevant equipment and entered the test module in the VR system to complete the simulation experiment. After the participants were familiar with the task and process of the experiment, they entered the experimental stage formally.
The experiment was divided into two stages. The first stage was the pointing task. After adjusting the sitting location and viewpoint location, the participant selected the random spherical interactive target in a cyclic sequence, from initial location to spherical interactive target to initial location, by pressing the trigger button of the handle. The spherical interactive target appeared only once in a certain location, disappeared after being clicked, and then appeared in another location, with a total of 45 spatial locations (as shown in Table 3). The pointing task stage was divided into five parts according to the value of ID, so 45 pointing tasks that needed to be performed under a specific ID, were counted as a part. Participants needed to rest 30–60 s for each part. Participants were given a 5-min rest after completing the first phase of the experiment, followed by a second phase of the experiment. The second stage was the placing task, in which the participants needed to place the target object at the initial location in 45 random spatial locations successively. The experimental process was similar to the pointing task stage. It took about 70 min for each participant to complete 225 pointing tasks and 225 placing tasks. Figure 11 shows a flow chart of the experiment.
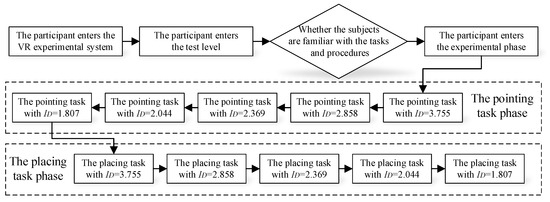
Figure 11.
Process of virtual interactive space cognitive experiment.
3.6. Analysis of the Experimental Results
3.6.1. The Independent Variable
The independent variables of this experiment included the difficulty coefficient ID (determined by controlling the width of the interaction target W), the actual value of the egocentric distance Da, and the spatial location of the interaction target Qa (xa, ya, za). xa = Da, plus or minus ya value represents the spatial location relative to the right and left of the participant, and za value represents the height of the spatial location relative to the ground.
3.6.2. The Dependent Variable
The dependent variable in the experiment was the spatial location of the marker when the participant completed each interaction task in the VR experimental space, namely the virtual interactive location Qp (xp, yp, yp). According to the value of xp, the estimated value Dp of egocentric distance could be obtained, and the accuracy E and marking error S of egocentric distance cognition could be, respectively, calculated from Equations (4) and (5). E is used to indicate the closeness between the estimated value and the actual value, and S is used to judge whether distance cognition tends to overestimate (S is positive) or underestimate (S is negative).
3.6.3. Cognitive Characteristics of Egocentric Peripersonal Distance
The experimental results showed that, when the participants performed the pointing task, the distance at 50 cm, 75 cm, 100 cm, 125 cm and 150 cm, the overall estimated values Dp were 49.30 cm (SD = 0.51), 73.29 cm (SD = 1.05), 97.28 cm (SD = 1.23), 120.37 cm (SD = 1.86) and 141.51 cm (SD = 3.94), respectively. The accuracy E calculated by Equation (3) on the corresponding distance was 0.985 (SD = 0.010), 0.977 (SD = 0.014), 0.973 (SD = 0.012), 0.963 (SD = 0.015) and 0.943 (SD = 0.026), respectively. While the participants performed the placing task, the overall estimated values of the five egocentric distances were 49.51 cm (SD = 0.44), 73.73 cm (SD = 1.34), 98.81 cm (SD = 1.32), 121.91 (SD = 4.18) and 146.25 cm (SD = 4.13), respectively. The corresponding accuracy E was 0.990 (SD = 0.009), 0.983 (SD = 0.018), 0.988 (SD = 0.013), 0.978 (SD = 0.033) and 0.945 (SD = 0.28), respectively. Similarly, the tendency to underestimate or overestimate distance cognition was judged according to the marking error S of the participants when performing different interaction tasks. The marking errors of the participants in the pointing task were −0.014 (SD = 0.010), −0.023 (SD = 0.014), −0.027 (SD = 0.012), −0.037 (SD = 0.015), −0.057 (SD = 0.026), respectively. S in the placing task were −0.010 (SD = 0.009), −0.017 (SD = 0.018), −0.012 (SD = 0.013), −0.025 (SD = 0.033), −0.025 (SD = 0.028).
Figure 12, Figure 13 and Figure 14, respectively, show the comparison of Dp, E and S at different distances of the participants when performing the pointing task and the placing task. As can be seen from the figures, participants tend to underestimate the egocentric peripersonal distance no matter what kind of interaction task they perform, but the degree of underestimation is not serious. The E values in the placing task were better than those in the pointing task, indicating that the users had more accurate cognition of the egocentric peripersonal distance when performing the placing task. According to the observation, no matter what kind of interaction task the participants performed, E value showed a downward trend with the increase in egocentric distance, indicating that the cognition and estimation ability of egocentric peripersonal distance decreased with the increase in distance, and users could more accurately and easily handle the interaction task close to them.
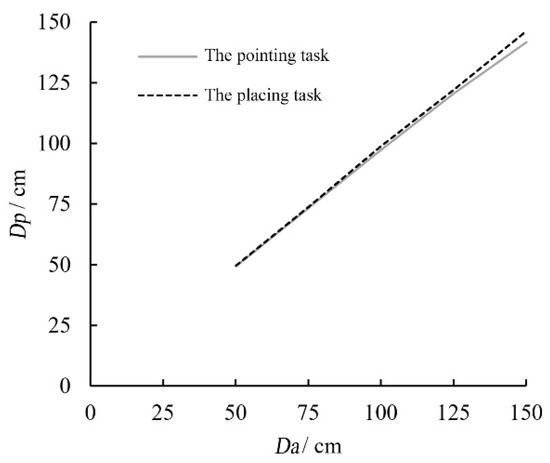
Figure 12.
Dp values at different distances of the pointing and placing tasks.
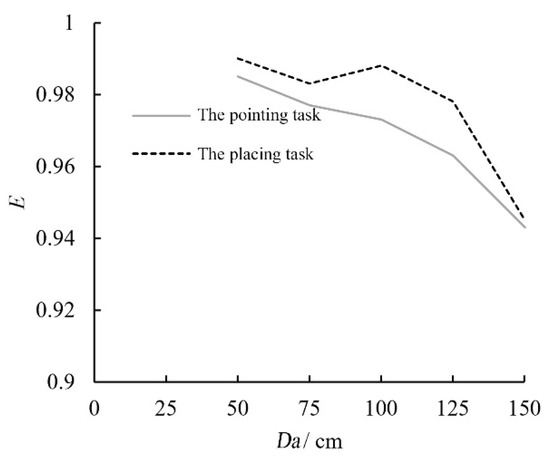
Figure 13.
E values at different distances of the pointing and placing tasks.
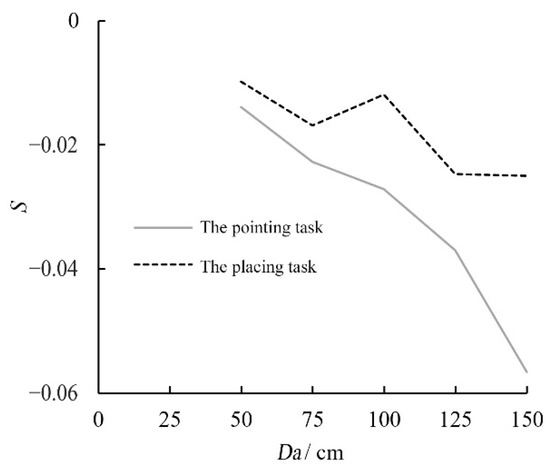
Figure 14.
S values at different distances of the pointing and placing tasks.
To study the influence of the interaction task, task difficulty coefficient (target width) and target location on the egocentric peripersonal distance cognition accuracy E and marking error S, the following actions were taken. The pointing task and placing task were set as J1 and J2, the five difficulty coefficients were set as ID1 to ID5, and the nine target locations were set as Q1 to Q9 in the order of top left, top, top right, front right, front, front left, bottom left, bottom, bottom right. The results shown in Table 4 and Table 5 obtained by multivariate analysis of variance. The results showed that the difference of accuracy E (F[1360] = 48.868, p < 0.001) and marking error S (F[1360] = 47.269, p < 0.001) between pointing task and placing task was very significant, the difference of accuracy E (F[4360] = 3.695, p = 0.006) and marking error S (F[4360] = 3.803, p = 0.005) between difficulty coefficient was significant, and the difference of accuracy E (F[8360] = 3.070, p = 0.002) and marking error S (F[8360] = 3.112, p = 0.002) between target location was also significant. Therefore, the interaction task, difficulty coefficient and target location are all important factors affecting the egocentric peripersonal distance cognition accuracy and marking error, and interaction task is the primary factor affecting the difference.
Table 4.
Results of multivariate analysis of variance of E.
Table 5.
Results of multivariate analysis of variance of S.
The experiment also considered the influence of interaction between the interaction task, difficulty coefficient and target location on E (F[4360] = 8.601, p < 0.001) and S (F[4360] = 8.772, p < 0.001). Data analysis showed that the interaction between the interaction task and difficulty coefficient had an extremely significant influence on E and S. However, the interaction between the interaction task and target location (F[8360] = 1.367, p = 0.209; F[8360] = 1.330, p = 0.227), difficulty coefficient and target location (F[32,360] = 0.704, p = 0.886; F[32,360] = 0.734, p = 0.855) and the interaction among the three (F[32,360] = 0.825, p = 0.740; F[32,360] = 0.806, p = 0.767) had no significant influence on E and S.
As can be seen from Figure 15a,b, when the difficulty coefficient ID is at the first and second levels, i.e., ID = 3.755 and ID = 2.858, E and S values of users performing different interaction tasks have little difference. As ID decreases gradually, when ID = 2.369, ID = 2.044 and ID = 1.807, E and S values show more obvious differences. It can be seen that the influence of interaction tasks on egocentric peripersonal distance cognition weakens with the increase in ID. As can be seen from Figure 15c,d, only at the first target location, i.e., at the upper left corner, there is no significant difference in E and S values, while at other locations there are significant differences. However, the interaction between difficulty coefficient and target location in Figure 15e,f shows no obvious trend or difference in the influence on E and S.
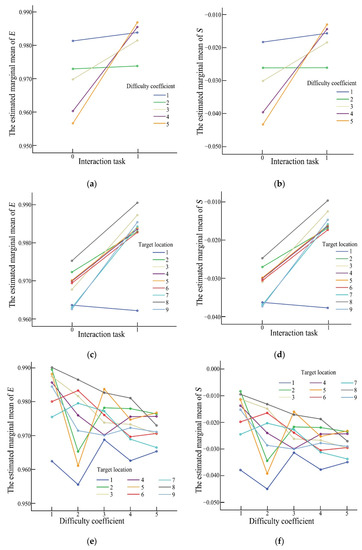
Figure 15.
The cross effects of the interaction task, difficulty factor and target location on the estimated boundary mean of E and S. (a) Interaction task and difficulty coefficient on E. (b) Interaction task and difficulty coefficient on S. (c) Interaction task and target location on E. (d) Interaction task and target location on S. (e) Difficulty coefficient and target location on E. (f) Difficulty coefficient and target location on S.
Through experiments, it was found that in the VR environment provided by HMD, users’ overall accuracy of egocentric peripersonal distance reached 97.53%, and they all tended to underestimate the distance. Different from the previous verbal reporting method, perceptual matching method and blind walking matching method, this experiment directly contacted the target object by setting the pointing task and placing task, which not only helped users to evaluate spatial perception ability, but also helped to evaluate users to improve their decision-making ability according to the visual information and the possible differences among the nine target locations. When studying the interaction of the interaction task, difficulty coefficient (target size) and target location, it was found that interaction task, difficulty coefficient and spatial location all had significant effects on egocentric peripersonal distance cognition, and the interaction task was the most significant influencing factor.
4. Virtual Interaction Location Prediction Model Based on Linear Regression Analysis
First, according to the setting of experimental independent variables, the value of independent variables of regression analysis was determined; then, the experimental data were screened and processed, and the corresponding dependent variable values were counted after the abnormal data were eliminated. Then the IBM SPSS Statistics 25.0 software was used for linear regression analysis of the data of virtual interaction location, and the prediction model of virtual interaction location was established. Finally, different prediction models were compared and evaluated.
4.1. Data Processing
Considering that interaction task, difficulty coefficient (target size) and target location all have a significant influence on E and S. The interaction task J, the target size W, and the spatial location of the interaction target Qa (xa, ya, za) were taken as independent variables, while the virtual interaction location Qp (xp, yp, zp) was taken as dependent variables. J was used as a classification variable to classify interaction tasks. When J = 0, it refers to the pointing task, and when J = 1, it refers to the placing task. Each participant completed the experiment consisting of 450 different combinations of independent variables under these two tasks, so there were 450 independent variable samples in total. Each sample corresponds to a dependent variable Qp. There were 10 participants in the experiment, so 10 measurements had been obtained for each Qp. Taking the average value of 10 measurements as the dependent variable, a total of 450 cases of corresponding Qp were obtained.
In order to facilitate the calculation and fitting of the model, the three-dimensional variables Qa and Qp were divided into one-dimensional variables, after which the independent variables were subdivided into J, W, xa, ya and za, and the dependent variables were subdivided into xp, yp and zp. Therefore, the corresponding prediction models were obtained by regression analysis of xp, yp and zp.
4.2. Data Analysis
SPSS software was used for a collinearity test, linear regression analysis and back test. First, the VIF (variance inflation factor) was calculated according to the correlation coefficient between independent variables and Equation (6). VIF was an indicator used to judge whether independent variables were collinear. If VIF value was greater than 10, it could be considered that there was collinearity among independent variables.
where r is the correlation coefficient between independent variables.
In linear regression analysis, the coefficient of determination R2, RMSE (root mean square error, as shown in Equation (7) and rRMSE (relative root mean square error, as shown in Equation (8)) were selected as the evaluation indexes of the prediction accuracy of the fitted regression model.
where n represents the number of samples, Si represents the measured value in the experiment, and represents the predicted value of the regression model. Generally speaking, the larger R2 and the smaller RMSE and rRMSE indicate the better regression effect of the experimental data involved in the analysis.
In order to test the significance of each parameter in the regression model, the p-value method was used in this paper, and the evaluation criteria are as follows:
When , the difference between the parameters is very significant. When , the difference between the parameters is highly significant. When , it means that there are significant differences among the parameters involved in the analysis. When , it indicates that there is no significant difference between the data. Under the condition of , one-way analysis of variance was performed on the regression models to evaluate the differences between different regression models [31].
4.3. Construction of Virtual Interaction Location Prediction Regression Model
In order to build the matching relationship between the actual spatial location of the interaction target and the virtual interaction location in VR space, a regression model for predicting the virtual interaction location was established. Firstly, the basic analysis of the sample data was carried out to master the sample characteristics. Then the collinearity analysis of the respective variables was carried out to determine whether the respective variables could be used to establish the regression model. Then, multiple linear regression analysis and stepwise regression analysis were carried out on the experimental data, and the corresponding regression model was established. Finally, the regression models were compared and analyzed.
4.3.1. Sample Characteristics
The data of 450 groups of samples in an egocentric distance cognition experiment were analyzed, and the minimum (Min), maximum (Max), Mean (Mean) and standard deviation (SD) of independent variables and dependent variables were sorted out. The main characteristic parameters of the sample were shown in Table 6.
Table 6.
The main characteristic parameters of the sample.
4.3.2. Test for Collinearity of Independent Variables
In order to ensure the accuracy of linear regression analysis of sample data, collinearity test was carried out on the independent variable of J, W, , and . The correlation coefficient r between the five parameters and the variance inflation factor VIF value are shown in Table 7. It can be found from the table that except for the VIF value between W and , which is 1.818, the VIF values of other independent variables are all close to zero, which satisfies the condition of VIF < 10, indicating that the collinearity among the five variables is negligible, so it can be used to establish multiple linear regression models.
Table 7.
Correlation coefficient and VIF value of independent variables.
4.3.3. Construction of Multiple Regression Model
Multiple regression models are established with , and as single independent variables or their combination with other variables as independent variables.
For the dependent variable , need to be taken as a fixed independent variable. When the regression model is a single independent variable, the model can be written as follows:
When the regression model has two independent variables, there are four equation forms in the model, as shown below:
When the regression model has three independent variables, there are six equation forms in the model, as shown below:
When the regression model has four independent variables, there are four equation forms in the model, as shown below:
When the regression model has five independent variables, the model can be written as follows:
In the above 16 equation forms, is a constant term, and to are independent variable coefficients. Similarly, the regression model for the dependent variables and also has 16 equation forms. The multiple regression model of , and can be obtained by using SPSS software, and the results are shown in Table 8, Table 9 and Table 10.
Table 8.
Regression model and evaluation of virtual interaction location .
Table 9.
Regression model and evaluation of virtual interaction location .
Table 10.
Regression model and evaluation of virtual interaction location .
The R value and R2 value of the above model were close to one, indicating that the fitting degree of the model was very good. The p values of ANOVA results also meet , indicating that the statistical results have a very significant effect. It can be seen from the RMES and rRMSE values of the above different regression models:
(1) Among all regression models for xp prediction of virtual interaction location, regression model 1-16 established with J, W, xa, ya and za as input showed the highest correlation with xp, and the prediction effect was the best. The R2 of model 1-16 was 0.994. The RMSE and rRMSE were 2.577 cm and 26.51%, respectively. From model 1-2 to model 1-5, when the independent variables of the model were two, the regression model (model 1-2) established with xa and J as input quantities showed a good fitting effect (R2 = 0.994, RMSE = 2.621 cm, rRMSE = 26.97%), indicating that the influence of J on xp was second only to xa. Models 1-6 to models 1-11 showed that when the independent variables of the model were three, it could be found that the model with xa, J, and W, as the inputs (model 1-6) showed a good fitting effect (R2 = 0.994, RMSE = 2.583 cm, rRMSE = 26.57%). This indicated that the influence of W on xp was better than that of ya and za. However, when the independent variables of the model were four, as shown in Models 1–12 to 1–15, the model with xa, J, W and ya as inputs (models 1-12) had a better fitting effect (R2 = 0.994, RMSE = 2.578cm, rRMSE = 26.52%).
(2) Among all regression models for yp prediction of virtual interaction location, Model 2-14 showed the optimal correlation with yp and prediction effect (R2 = 0.999, RMSE = 1.0769 cm, rRMSE = 12.59%). This model had four independent variables ya, J, xa and za. It was better than model 2-16 with five inputs (R2 = 0.999, RMSE = 1.0780 cm, rRMSE = 12.60%). According to model 2-2 to model 2-5, when the independent variables of the regression model were two, the model 2-5 established with ya and za as the input showed a good fitting effect (R2 = 0.999, RMSE = 1.0822 cm, rRMSE = 12.65%), and the influence of za on yp was second only to ya. When the independent variables of the model were three, as shown in model 2-6 to model 2-11, the model 2-11 established by ya, xa, and za had a better fitting effect (R2 = 0.999, RMSE = 1.0774 cm, rRMSE = 12.60%), and it could be found that J and W did not have a good positive effect on the establishment of the model. W even played a negative role in the establishment of regression models.
(3) Among all regression models for zp prediction of virtual interaction location, regression model 3-16 established with J, W, xa, ya and za as input showed the highest correlation with zp and the best fitting effect (R2 = 0.998, RMSE = 1.3134 cm, rRMSE = 1.14%). It showed that the model with five independent variables as inputs had the best prediction effect on zp. At the same time, by observing and comparing the regression model 3-2 to 3-5 established with two independent variables as inputs, it could be found that the model 3-2 established with za and J as inputs showed a better fitting effect (R2 = 0.998, RMSE = 1.3276 cm, rRMSE = 1.16%), similar to the regression model of xp. In the regression model of zp prediction, J was the influencing factor second only to za. When three independent variables were selected to establish the regression model, the model 3-7 established by za, J and xa showed a good fitting effect (R2 = 0.998, RMSE = 1.3201 cm, rRMSE = 1.15%). By comparing model 3-12 to model 3-15, it could be found that when the independent variables of the regression model were four, the fitting effect of model 3-12 established with za, J, W and xa as inputs was better (R2 = 0.998, RMSE = 1.3155 cm, rRMSE = 1.15%).
Therefore, multiple linear regression models 1-16, 2-14 and 3-16 were selected as the prediction models of virtual interaction locations xp, yp, and zp, respectively, and the results were shown in Equation (15):
where J represents the interaction task, and the values of J are zero and one; when J = 0, it is the pointing task; when J = 1, it is the placement task; W is the width of the interaction target; xa, ya, and za are the x-axis, y-axis and z-axis coordinate values corresponding to the actual spatial location coordinate Qa of the interaction target in the three-dimensional Cartesian coordinate system with respect to the G point.
4.3.4. Construction of Stepwise Regression Model
In the establishment of a multiple linear regression model, there were many independent variables that had no significant influence on the dependent variables (p > 0.05 for independent variables). In order to exclude these independent variables, the stepwise linear regression method was used to establish a regression model for the prediction of virtual interactive location, taking J, W, xa, ya and za as independent variables and xp, yp and zp as dependent variables. The model is shown in Equation (16):
According to Equation (16), the regression model of xp abandoned ya and za variables and adopted models 1-6 in Table 8 (R2 = 0.994, RMSE = 2.583 cm, rRMSE = 26.57%). In the regression model of yp, J and W were discarded, and model 2-11 in Table 9 was used (R2 = 0.999, RMSE = 1.0774 cm, rRMSE = 12.60%). Only one variable ya was discarded in the regression model of zp, and model 3-12 in Table 10 was used (R2 = 0.998, RMSE = 1.3155 cm, rRMSE = 1.15%). Figure 16, Figure 17 and Figure 18, respectively, show the scatter plots of the model predicted values and the actual measured values of xp, yp and zp. The results showed that the established model has good stability and predictive ability. Although the R2, RMSE and rRMSE values in the stepwise linear regression model are slightly inferior compared with the previously selected model, the model can be relatively simple while ensuring the prediction accuracy, and no significant factors are required to participate in the calculation, which reduces the workload of the model.
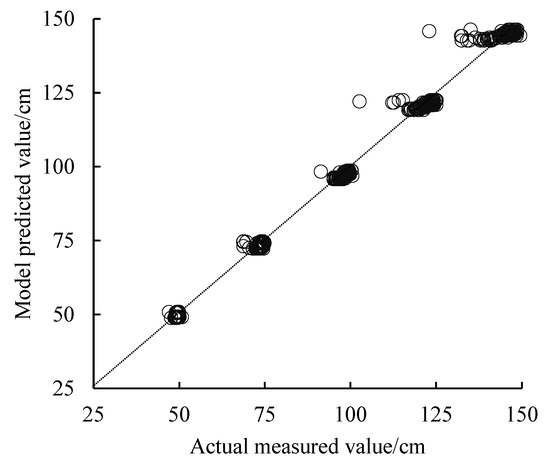
Figure 16.
Comparison of the predicted and measured values of the virtual interaction location xp.
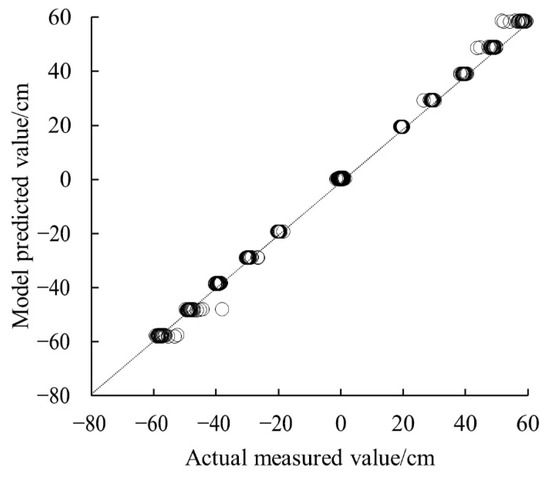
Figure 17.
Comparison of the predicted and measured values of the virtual interaction location yp.
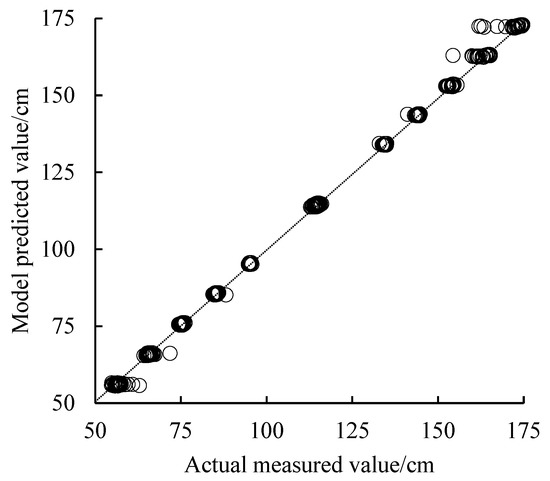
Figure 18.
Comparison of the predicted and measured values of the virtual interaction location zp.
5. Conclusions
Aimed at the difference between the actual and virtual symmetric locations of the interaction targets in Digital Twin system, this paper designed and carried out an egocentric peripersonal distance cognition experiment. The experiment adopted a 2 × 5 × 9 × 5 repeated measurement design, and set two interaction tasks, five interaction target widths and nine spatial locations to estimate the five egocentric peripersonal distances. Through the analysis of the experimental data, it was found that:
(1) In the VR environment provided by HMD, the accuracy of egocentric peripersonal distance cognition was 97.53% on the whole, and all the users tended to underestimate the distance.
(2) Whether users performed pointing tasks or placing tasks in VR space, they tended to underestimate the egocentric peripersonal distance, but the degree of underestimatation was not serious.
(3) Users’ egocentric peripersonal distance cognition was more accurate when performing placement tasks.
(4) Users’ egocentric peripersonal distance estimation ability decreased with the increase in the distance, and the user was more likely to deal with the interaction tasks close to him.
(5) The interaction task, difficulty coefficient (target width) and target location were all important factors affecting the cognitive accuracy and labeling error of egocentric peripersonal distance. Among them, the interaction task had the most significant effect, but the significance would weaken with the increase in difficulty coefficient ID.
Based on the experimental data, with the interaction task J, the target width W, xa, ya and za in the actual spatial location of the interaction target Qa as independent variables, and xp, yp and zp in the virtual interaction location Qp as dependent variables, the prediction model was established and compared by multiple linear regression and stepwise regression methods. Finally, a prediction model with a good fitting effect was determined. From the model, it was found that the independent variables J, W and xa had a significant impact on xp, while xa, ya and za had a significant impact on yp, and zp was affected by J, W, xa and za.
The constraints of the prediction model proposed in this paper are limited to the interaction task, target width and the actual spatial location, and the interaction task only involves the pointing task and placing task. However, the interaction tasks and constraints in a VR system are diverse. Therefore, in future research, more constraints will be added, such as target color and target transparency, and the types of interaction tasks will be expanded, such as picking task and transmitting task.
Author Contributions
Conceptualization, Z.L. and Q.C.; methodology, Z.L., H.Z., Q.X. and J.L.; writing—original draft preparation, Z.L., H.Z. and J.L.; validation, Z.L. and Q.X. All authors have read and agreed to the published version of the manuscript.
Funding
This work was financially supported by the National Natural Science Foundation of China (Grant No.: 52105248), the science and technology top talent project of Guizhou Provincial Department of Education (Grant No.: [2022]086), the special funding of Guiyang science and technology bureau and Guiyang University (GYU-KY-[2022]), the Open Fund of Key Laboratory of Advanced Manufacturing Technology, Ministry of Education (GZUAMT2021KF[07] and GZUAMT2021KF[08]).
Institutional Review Board Statement
Not applicable.
Informed Consent Statement
Not applicable.
Data Availability Statement
The authors confirm that the data supporting the findings of this study are available within the article.
Conflicts of Interest
The authors declare no conflict of interest.
References
- Zhao, Z.Y.; Lv, J.; Pan, W.J.; Hou, Y.K.; Fu, Q.W. Research on VR spatial cognition based on virtual reproduction behavior. Chin. J. Eng. Des. 2020, 27, 340–348. [Google Scholar]
- Paes, D.; Irizarry, J.; Pujoni, D. An evidence of cognitive benefits from immersive design review: Comparing three-dimensional perception and presence between immersive and non-immersive virtual environments. Autom. Constr. 2021, 130, 103849. [Google Scholar] [CrossRef]
- Faure, C.; Limballe, A.; Bideau, B.; Kulpa, R. Virtual reality to assess and train team ball sports performance: A scoping review. J. Sport. Sci. 2020, 38, 192–205. [Google Scholar] [CrossRef] [PubMed]
- Woldegiorgis, B.H.; Lin, C.J.; Liang, W.Z. Impact of parallax and interpupillary distance on size judgment performances of virtual objects in stereoscopic displays. Ergonomics 2019, 62, 76–87. [Google Scholar] [CrossRef] [PubMed]
- Ping, J.; Thomas, B.H.; Baumeister, J.; Guo, J.; Weng, D.; Liu, Y. Effects of shading model and opacity on depth perception in optical see-through augmented reality. J. Soc. Inf. Disp. 2020, 28, 892–904. [Google Scholar] [CrossRef]
- Paes, D.; Arantes, E.; Irizarry, J. Immersive environment for improving the understanding of architectural 3D models: Comparing user spatial perception between immersive and traditional virtual reality systems. Autom. Constr. 2017, 84, 292–303. [Google Scholar] [CrossRef]
- Sahu, C.K.; Young, C.; Rai, R. Artificial intelligence (AI) in augmented reality (AR)-assisted manufacturing applications: A review. Int. J. Prod. Res. 2021, 59, 4903–4959. [Google Scholar] [CrossRef]
- Lin, C.J.; Woldegiorgis, B.H. Interaction and visual performance in stereoscopic displays: A review. J. Soc. Inf. Disp. 2015, 23, 319–332. [Google Scholar] [CrossRef]
- Buck, L.E.; Young, M.K.; Bodenheimer, B. A comparison of distance estimation in HMD-based virtual environments with different HMD-based conditions. ACM Trans. Appl. Percept. (TAP) 2018, 15, 1–15. [Google Scholar] [CrossRef]
- Willemsen, P.; Gooch, A.A.; Thompson, W.B.; Creem-Regehr, S.H. Effects of Stereo Viewing Conditions on Distance Perception in Virtual Environments. Presence (Camb. Mass.) 2008, 17, 91–101. [Google Scholar] [CrossRef]
- Naceri, A.; Chellali, R.; Hoinville, T. Depth perception within peripersonal space using headmounted display. Presence Teleoperators Virtual Environ. 2011, 20, 254–272. [Google Scholar] [CrossRef]
- Armbrüster, C.; Wolter, M.; Kuhlen, T.; Spijkers, W.; Fimm, B. Depth Perception in Virtual Reality: Distance Estimations in Peri- and Extrapersonal Space. Cyberpsychology Behav. 2008, 11, 9–15. [Google Scholar] [CrossRef] [PubMed]
- Nikolić, D.; Whyte, J. Visualizing a new sustainable world: Toward the next generation of virtual reality in the built environment. Buildings 2021, 11, 546. [Google Scholar] [CrossRef]
- Joe Lin, C.; Abreham, B.T.; Caesaron, D.; Woldegiorgis, B.H. Exocentric distance judgment and accuracy of head-mounted and stereoscopic widescreen displays in frontal planes. Appl. Sci. 2020, 10, 1427. [Google Scholar] [CrossRef]
- Gralak, R. A method of navigational information display using augmented virtuality. J. Mar. Sci. Eng. 2020, 8, 237. [Google Scholar] [CrossRef]
- Li, H.; Mavros, P.; Krukar, J.; Hölscher, C. The effect of navigation method and visual display on distance perception in a large-scale virtual building. Cogn. Process. 2021, 22, 239–259. [Google Scholar] [CrossRef] [PubMed]
- Lin, C.J.; Woldegiorgis, B.H.; Caesaron, D. Distance estimation of near-field visual objects in stereoscopic displays. J. Soc. Inf. Disp. 2014, 22, 370–379. [Google Scholar] [CrossRef]
- Lin, C.J.; Woldegiorgis, B.H.; Caesaron, D.; Cheng, L. Distance estimation with mixed real and virtual targets in stereoscopic displays. Displays 2015, 36, 41–48. [Google Scholar] [CrossRef]
- Malbos, E.; Burgess, G.H.; Lançon, C. Virtual reality and fear of shark attack: A case study for the treatment of squalophobia. Clin. Case Stud. 2020, 19, 339–354. [Google Scholar] [CrossRef]
- Makaremi, M.; N’Kaoua, B. Estimation of Distances in 3D by Orthodontists Using Digital Models. Appl. Sci. 2021, 11, 8285. [Google Scholar] [CrossRef]
- Willemsen, P.; Colton, M.B.; Creem-Regehr, S.H.; Thompson, W.B. The effects of head-mounted display mechanical properties and field of view on distance judgments in virtual environments. ACM Trans. Appl. Percept. (TAP) 2009, 6, 1–14. [Google Scholar] [CrossRef]
- El Jamiy, F.; Marsh, R. Survey on depth perception in head mounted displays: Distance estimation in virtual reality, augmented reality, and mixed reality. IET Image Process. 2019, 13, 707–712. [Google Scholar] [CrossRef]
- Cardoso, J.C.S.; Perrotta, A. A survey of real locomotion techniques for immersive virtual reality applications on head-mounted displays. Comput. Graph. 2019, 85, 55–73. [Google Scholar] [CrossRef]
- Yu, M.; Zhou, R.; Wang, H.; Zhao, W. An evaluation for VR glasses system user experience: The influence factors of interactive operation and motion sickness. Appl. Ergon. 2019, 74, 206–213. [Google Scholar] [CrossRef] [PubMed]
- Bremers, A.W.D.; Yöntem, A.Ö.; Li, K.; Chu, D.; Meijering, V.; Janssen, C.P. Perception of perspective in augmented reality head-up displays. Int. J. Hum. Comput. Stud. 2021, 155, 102693. [Google Scholar] [CrossRef]
- Hong, J.Y.; Lam, B.; Ong, Z.T.; Ooi, K.; Gan, W.S.; Kang, J.; Tan, S.T. Quality assessment of acoustic environment reproduction methods for cinematic virtual reality in soundscape applications. Build. Environ. 2019, 149, 1–14. [Google Scholar] [CrossRef]
- Grabowski, A. Practical skills training in enclosure fires: An experimental study with cadets and firefighters using CAVE and HMD-based virtual training simulators. Fire Saf. J. 2021, 125, 103440. [Google Scholar] [CrossRef]
- Harris, D.J.; Buckingham, G.; Wilson, M.R.; Vine, S.J. Virtually the same? How impaired sensory information in virtual reality may disrupt vision for action. Exp. Brain Res. 2019, 237, 2761–2766. [Google Scholar] [CrossRef]
- Hecht, H.; Welsch, R.; Viehoff, J.; Longo, M.R. The shape of personal space. Acta Psychol. 2019, 193, 113–122. [Google Scholar] [CrossRef]
- Fitts, P.M. The information capacity of the human motor system in controlling the amplitude of movement. J. Exp. Psychol. Gen. 1992, 121, 262–269. [Google Scholar] [CrossRef]
- Li, W.; Niu, Z.; Chen, H.; Li, D.; Wu, M.; Zhao, W. Remote estimation of canopy height and aboveground biomass of maize using high-resolution stereo images from a low-cost unmanned aerial vehicle system. Ecol. Indic. 2016, 67, 637–648. [Google Scholar] [CrossRef]
Publisher’s Note: MDPI stays neutral with regard to jurisdictional claims in published maps and institutional affiliations. |
© 2022 by the authors. Licensee MDPI, Basel, Switzerland. This article is an open access article distributed under the terms and conditions of the Creative Commons Attribution (CC BY) license (https://creativecommons.org/licenses/by/4.0/).