Abstract
Minimizing between-limb asymmetries during running is often a goal of training, as increased asymmetries are related to decreased efficiency and increased energy expenditure. However, it is unknown if asymmetries change with increased running exposure or are related to actual race performance. The purpose of this study was to determine (1) if pre-season asymmetries changed year-to-year among collegiate cross country runners, and (2) if these asymmetries were associated with within-season personal records (PRs). Pre-season biomechanical test results and race performance data were analyzed for 54 unique runners (28 female) across six seasons, totaling 152 assessments (age: 19.1 (0.9) years, height: 1.71 (0.10) m, weight: 61.7 (7.7) kg (values = mean [standard deviation])). Biomechanical asymmetries included ground reaction forces; ground contact time; base of gait; foot inclination angle; and peak hip flexion, hip extension, hip adduction, pelvic drop, knee flexion, and ankle dorsiflexion. Year of collegiate eligibility was used to quantify training exposure. Asymmetries during running did not change across years of eligibility (p ≥ 0.12), except propulsive impulse, which decreased over time (p = 0.03). PR times were faster with decreased propulsive impulse asymmetry and increased AVLR and peak ankle dorsiflexion asymmetries. This is the first study to assess longitudinal asymmetries over time and provide potential targets for interventions aimed at modifying asymmetries to improve performance.
1. Introduction
Running mechanics and between-limb asymmetries are often assessed by clinicians and coaches to gain insight into an individual’s running performance potential [1,2,3]. The mechanics of a healthy runner are presumed to be symmetrical [4]; however, some level of asymmetry is common among healthy runners, with the level of asymmetry varying considerably depending on the metric of interest [5,6]. Nevertheless, minimizing between-limb asymmetry during running is often a goal of training, as increased asymmetry is thought to be related to decreased performance. Indeed, increased asymmetry was correlated with decreased mechanical efficiency (r = 0.66) during a 10 km run in amateur trained runners [7]. Similarly, among active individuals, a 10% increase in step time asymmetry and average vertical ground reaction force asymmetry resulted in a 3.5% increase in net metabolic power (e.g., energy expenditure), while a 10% increase in ground contact time asymmetry resulted in a 7.8% increase in metabolic power [8]. Although increases in asymmetry result in decreased mechanical efficiency and increased metabolic power, it is unknown if increased asymmetries also translate to increased race times (e.g., worse performance).
While asymmetries have been related to performance in cross-sectional studies [9,10,11], how asymmetries change over time or with increased running exposure and what impact those changes may have on performance is less well understood. Prior work has suggested asymmetries in running mechanics may decrease with increased running experience, as elite runners have demonstrated significantly less asymmetry than competitive runners with regard to vertical displacement [9]. Similarly, competitive runners showed smaller asymmetries than recreational and novice runners in flight time and vertical loading rate, particularly at speeds greater than 10 km/h [10]. Conversely, when assessing mechanics across the entire stride cycle, as a time series, in a cohort of children and adolescents who participated in long-distance running, no influence of maturation on asymmetry was observed [11].
Presently, no studies have described longitudinal changes in asymmetries of running mechanics, and it remains unknown if expected levels of asymmetry remain consistent as a runner increases training volume and running exposure, such as often occurs when transitioning from a high school to collegiate cross country program. Furthermore, the relationship between asymmetries and race performances or personal records (PRs) has not been explored. Clarifying these relationships may be of particular interest to competitive runners and coaches, such as in the collegiate setting, who are working towards optimizing mechanics and improving race times. Therefore, the primary aim was to determine if pre-season between-limb asymmetries change year-to-year in healthy, collegiate cross country runners. A secondary aim was to determine if between-limb asymmetries at pre-season were associated with race PRs during the subsequent season. It was hypothesized that asymmetries would decrease over time and that reduced asymmetries would be related to improved race PRs.
2. Materials and Methods
This study analyzed routinely collected running mechanics data and race results from the 2015–2020 National Collegiate Athletic Association (NCAA) Division I cross country seasons stored in the Badger Athletic Performance Database. The database contains results from a standardized battery of pre-season assessments every runner undergoes each year while at the University of Wisconsin–Madison, as well as measures related to athletic exposure such as race participation and results. The records review was approved by the university’s Health Sciences Institutional Review Board.
2.1. Subject Selection
Data for a given runner and season (year) were extracted if the runner: (1) was cleared for full sport participation at the time of a given pre-season running assessment; (2) had no surgical history prior to the pre-season running assessment; and (3) ran at his or her preferred speed during the running assessment for at least 2 seasons. Preferred speed was defined as the speed at which runners performed the majority of their training, excluding speed workouts and long runs, and was chosen as the speed for analysis based on prior work showing running speed does not influence the magnitude of asymmetries observed [5,6]. After identifying eligible running assessment sessions, the year of collegiate athletic eligibility for each runner at the time of testing was also extracted. Year of athletic eligibility, as opposed to age, was used to capture the number of years a runner had been exposed to a collegiate running program. Corresponding within-season PRs for each runner and the respective season were also recorded from the cross country results reporting system database. For female runners, 6 km distance PRs were included, while 8 km distance PRs were included for male runners, as these distances are the most common for each sex, respectively, among NCAA cross country events.
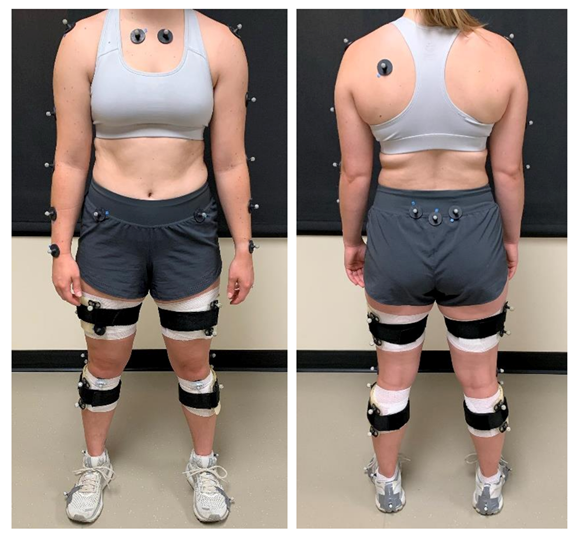
2.2. Data Acquisition and Processing
Whole body kinematics and ground reaction forces (GRFs) during running were collected using a protocol previously described in detail [12]. Briefly, a single researcher (MRSJ) placed 42 reflective markers on each athlete, 23 of which were located on anatomical landmarks (Figure 1). The running assessment began with runners walking to acclimate to the testing setup. Speed was then gradually increased until a speed representative of a moderate intensity training run was achieved and verbally confirmed by the runners. Fifteen seconds of data were recorded at the preferred running speed after the runner acclimated to the speed for at least 30 s.
Figure 1.
Marker placement for the running analysis protocol.
Kinematic marker data were recorded at 200 Hz using a passive marker system (Motion Analysis Corporation, Santa Rosa, CA, USA), while synchronous three-dimensional GRF were recorded at 2000 Hz using an instrumented treadmill (Bertec Corporation, Columbus, OH, USA). Kinematic data were low-pass filtered with a 12 Hz cutoff frequency, while GRF were low-pass filtered with a 50 Hz cutoff frequency [12]. The body was modeled as a 14 segment, 31 degree-of-freedom articulated linkage. Segments were individually scaled using each runner’s height, mass, and respective segment lengths. Stance phase was defined between initial contact and toe off, where the vertical GRF (VGRF) curve rose above and fell below 50 N, respectively.
Biomechanical variables considered for analysis reflect those which are commonly evaluated clinically and may have relevance to running performance. Some variables were excluded to minimize type I statistical errors and avoid redundancy. The included variables were: GRFs—peak VGRF, average vertical loading rate (AVLR), braking impulse, and propulsive impulse; spatiotemporal variables—ground contact time, base of gait at midstance; and joint kinematics during stance—foot inclination angle at initial contact, peak hip flexion, extension, and adduction, peak pelvic drop, peak knee flexion, and peak ankle dorsiflexion. Detailed calculations for each variable of interest are provided in Table 1.
Table 1.
Definitions and calculations of variables of interest and corresponding units of asymmetry.
2.3. Statistical Analysis
Consistent with prior work [5], asymmetry for biomechanical variables with units of measurement in degrees and cm were calculated as the absolute value of the between-limb difference. All other asymmetries were expressed as a percentage, calculated as the absolute between-limb difference divided by the between-limb average [|left − right|/((left + right)/2) × 100]. Data for each variable were averaged across 15 strides for each limb before asymmetries were calculated.
Univariable linear mixed effects models were used to assess the influence of year of eligibility on asymmetry values. Each runner was modelled with a random effect to account for the within-subject asymmetry correlation induced by repeated measures across years. Least square means were also calculated for each year of eligibility for each variable. Significance was set a priori at p ≤ 0.05.
Separate linear mixed effects models were also used to assess the influence of asymmetry on within-season PR times (in seconds), controlling for sex to account for the sex-specific difference in PR times due to running distances. The models also accounted for within-subject correlation in PR times resulting from repeated measures across years. Asymmetry variables demonstrating an association with the PR times at the level of p ≤ 0.2 were included in a final multivariable model to determine independent associations of asymmetry variables with the performance outcome. Model parameter estimates and 95% confidence intervals (CI) for multivariable models adjusted for sex were also calculated. All analyses were performed in RStudio (version 1.4.1106, RStudio Team, Boston, MA, USA).
3. Results
Records for 54 unique runners (28 female) and 152 total pre-season running assessment sessions were included in the analysis (age: 19.1 (0.9) years, height: 1.71 (0.10) m, weight: 61.7 (7.7) kg (values are mean [standard deviation]); Table 2). The majority of runners had data available for two (N = 23, 43%) or three (N = 20, 37%) seasons, with eight (15%) and two (4%) runners having data available for four and five seasons, respectively.
Table 2.
Subject demographics. Values represent mean (standard deviation) unless otherwise noted.
None of the asymmetry variables of interest changed significantly as year of eligibility increased (p-values ≥ 0.12, Table 2), with the exception of propulsive impulse (p = 0.03). However, post hoc analyses revealed no significant pair-wise differences in least square mean propulsive impulse asymmetry between any years of eligibility (p-values ≥ 0.08). Least square mean asymmetry values, averaged across all years of eligibility, for GRF variables ranged from 2.6 to 13.9% and 1.4 to 3.4° for kinematic variables. Least square mean ground contact time asymmetry, averaged across all years of eligibility, was 1.6%, while base of gait asymmetry was 1.2 cm. Least square mean values for all variables and years of eligibility are provided in Table 3.
Table 3.
Least square mean asymmetry values (95% confidence interval) for each biomechanical variable of interest. p-values reflect the association between year of eligibility and levels of asymmetry.
The linear mixed effect model of the relationship between each asymmetry variable and PR times, adjusted for sex, identified potential associations between PR time and asymmetries in AVLR (p = 0.17), propulsive impulse (p < 0.01), and peak ankle dorsiflexion (p = 0.08) during stance (Table 4).
Table 4.
Associations between each asymmetry variable of interest and within-season personal record times.
These variables were included in the multivariable model (Table 5), in addition to controlling for sex. Propulsive impulse asymmetry maintained a positive association with PR time. For every 5% increase in propulsive impulse asymmetry, PR times increased (worse performance) by 16.0 s (95% CI: 6.0, 25.8 s). Conversely, for every 1° increase in peak ankle dorsiflexion asymmetry, PR times decreased by 7.6 s (95% CI: −14.4, −1.5 s). Although it did not reach statistical significance, after adjusting for all other variables in the model, a 5% increase in AVLR asymmetry suggested a potential 4.3 s (95% CI: −8.7, 0.2 s) decrease in PR times.
Table 5.
Multivariable associations between each asymmetry variable of interest and season personal record times.
4. Discussion
This study broadly aimed to assess longitudinal changes in running asymmetries of collegiate cross country runners. Specifically, the primary purpose of this study was to determine the association between year of collegiate athletic eligibility and between-limb asymmetries during running. Although the overall model for propulsive impulse asymmetry was significant (p = 0.03), post hoc analyses revealed no significant pair-wise differences in the magnitude of propulsive impulse asymmetry across year of eligibility (p ≥ 0.08). While year-to-year changes in propulsive impulse asymmetry were not statistically significant, propulsive impulse asymmetry showed a trend towards decreasing over time (Table 3), with 7.4% (95% CI: 5.6, 9.2%) asymmetry observed in the first year of eligibility and 3.1% (95% CI: 0.1, 7.0%) asymmetry observed in the fifth year of eligibility. No other asymmetries of interest varied with year of eligibility (p-values ≥ 0.12).
In the present study, generally low levels of asymmetry were observed for ground contact time, base of gait, and kinematic variables (Table 2). Asymmetries in GRF variables tended to be more varied, with peak VGRF and AVLR displaying 2.6 (95% CI: 2.0–3.3%) and 13.9% (95% CI: 9.7–18.1%) asymmetry on average, respectively. Braking and propulsive impulses displayed 8.1 (95% CI: 6.0–10.3%) and 7.6% (95% CI: 5.9–9.3%) asymmetry, on average.
Between-limb asymmetries have been shown to be lower in highly trained runners compared to recreational or novice runners [10,13]. Given that the current study population was comprised of high-level, NCAA Division I runners, it was expected that the overall magnitude of asymmetries observed would be low, and that this may contribute to the lack of association between year of athletic eligibility (e.g., increased training exposure) and asymmetry magnitudes. It is possible that a training effect on asymmetries may be more pronounced among less trained runners.
The secondary purpose of this study was to determine if between-limb asymmetries at pre-season were associated with race PRs within the subsequent season. With every 5% increase in propulsive impulse asymmetry, PR times were 16.0 s slower (95% CI: 6.0, 25.8 s). To provide perspective, in the 2021 NCAA cross country championships, there was a 45 s difference between first and tenth place among men and a 25 s difference between first and tenth place among women. Thus, a 16 s difference in race time related to propulsive impulse asymmetry could substantially impact an individual’s finishing position and overall team performance.
While propulsive impulse asymmetry has not specifically been assessed relative to performance, the importance of propulsive impulse for overall running performance is well recognized. For example, forward propulsion is a primary contributor to the metabolic cost of running [14,15]. Furthermore, propulsive impulse explains 57% of the variance in sprint velocity [16], with decreases in running speeds during sprinting related to an inability to maintain propulsive force [17]. While the present study does not support causal inferences regarding the relationship between propulsive impulse asymmetries and race performance, our findings suggest that symmetrical propulsive impulse, in addition to greater overall propulsive impulse in accordance with prior work, may be beneficial for improving race PRs.
Interestingly, an opposite effect was observed for AVLR and peak ankle dorsiflexion asymmetries, with PR times being 4.3 (95% CI: −8.7, 0.2 s) and 7.6 s (95% CI: −14.4, −1.5 s) faster for every 5% and 1° increase in asymmetry, respectively. Peak ankle dorsiflexion occurring later in stance has been related to improvements in running economy [18], but how increased asymmetry may result in improved running performance is unclear. Additionally, although AVLR did not achieve statistical significance in the final multivariable model, the magnitude of the 95% CI indicates a possible inverse association between AVLR asymmetry and PR times. A considerable number of studies have investigated AVLR with regard to injury occurrence, but there is no evidence regarding potential mechanisms by which increased asymmetry in AVLR may improve PR times.
This study provides initial evidence supporting that asymmetries generally do not change over time among collegiate cross country runners, and propulsive impulse asymmetries may be important factors for optimizing performance. We utilized one method of asymmetry calculation, which we believe is most clinically useful, as the units are in degrees, cm, or percentages, as compared to other methods of calculating asymmetry, which remove the units of measurement. We also did not assess the influence of limb dominance, as our goal was to assess the overall magnitude of asymmetry and not the direction of asymmetry. Limb dominance has previously been shown to not influence side-to-side asymmetries [19,20], but may be an area of consideration for future work. Additionally, we did not account for other within-season factors, which may influence race PRs, such as training volume and injuries. Future work incorporating these metrics may help clarify the relationship between pre-season running mechanics and in-season performance. Finally, the pre-season running assessment was performed on a treadmill, and mechanics may differ between treadmill and overground running, although prior research suggests mechanics are comparable between the two surfaces [21]. It is possible asymmetries during treadmill running are smaller than during overground running [22], but the overall relationships observed in the present study are likely consistent across environments.
5. Conclusions
Asymmetries during running do not change across years of eligibility among NCAA Division I cross country runners. Asymmetries were associated with in-season race PRs, with PR times decreasing with decreased propulsive impulse asymmetry and increased AVLR and peak ankle dorsiflexion asymmetries. Future work should aim to clarify the mechanisms by which AVLR and peak ankle dorsiflexion may impact running performance. Additionally, interventional studies investigating the effect of minimizing propulsive impulse asymmetry on improving performance are also warranted.
Author Contributions
Conceptualization, M.R.S.-J., S.A.K., J.A.M., and B.C.H.; methodology, M.R.S.-J., C.S.T., and R.B.; formal analysis, M.R.S.-J. and S.A.K.; writing—original draft preparation, M.R.S.-J.; writing—review and editing, M.R.S.-J., S.A.K., J.A.M., C.S.T., R.B., and B.C.H. All authors have read and agreed to the published version of the manuscript.
Funding
The contributions of author J.A.M. were supported by a research grant from the Virginia Horne Henry Fund for Women’s Physical Education and Movement.
Institutional Review Board Statement
The study was conducted according to the guidelines of the Declaration of Helsinki, and approved by the Institutional Review Board of the University of Wisconsin-Madison (2018-0049, approved: 02/15/18).
Informed Consent Statement
Subject consent was waived as this study involved a review of routinely collected healthcare and performance data. The records review was approved by the university’s Health Sciences Institutional Review Board.
Data Availability Statement
Data and corresponding statistical analysis code may be made available by contacting the corresponding author.
Acknowledgments
The authors would like to acknowledge the Sports Medicine staff in the University of Wisconsin–Madison Division of Athletics for their commitment to the welfare of the student athletes and contributions to the Badger Athletic Performance program.
Conflicts of Interest
The authors declare no conflict of interest.
References
- Pipkin, A.; Kotecki, K.; Hetzel, S.; Heiderscheit, B. Reliability of a qualitative video analysis for running. J. Orthop. Sports Phys. Ther. 2016, 46, 556–561. [Google Scholar] [CrossRef] [PubMed]
- Dicharry, J. Kinematics and kinetics of gait: From lab to clinic. Clin. Sports Med. 2010, 29, 347–364. [Google Scholar] [CrossRef] [PubMed]
- Byrne, M. On the run: A coach’s perspective. J. Orthop. Sports Phys. Ther. 2014, 44, 729–730. [Google Scholar] [CrossRef] [PubMed]
- Zifchock, R.A.; Davis, I.; Higginson, J.; Royer, T. The symmetry angle: A novel, robust method of quantifying asymmetry. Gait Posture 2008, 27, 622–627. [Google Scholar] [CrossRef]
- Stiffler-Joachim, M.R.; Lukes, D.H.; Kliethermes, S.A.; Heiderscheit, B.C. Lower extremity kinematic and kinetic asymmetries during running. Med. Sci. Sports Exerc. 2020, 53, 945–950. [Google Scholar] [CrossRef]
- Furlong, L.M.; Egginton, N.L. Kinetic asymmetry during running at preferred and nonpreferred speeds. Med. Sci. Sports Exerc. 2018, 50, 1241–1248. [Google Scholar] [CrossRef] [Green Version]
- Melo, C.C.; Carpes, F.P.; Vieira, T.M.; Mendes, T.T.; de Paula, L.V.; Chagas, M.H.; Peixoto, G.H.C.; Andrade, A.G.P. Correlation between running asymmetry, mechanical efficiency, and performance during a 10 km run. J. Biomech. 2020, 109, 109913. [Google Scholar] [CrossRef]
- Beck, O.N.; Azua, E.N.; Grabowski, A.M. Step time asymmetry increases metabolic energy expenditure during running. Eur. J. Appl. Physiol. 2018, 118, 2147–2154. [Google Scholar] [CrossRef]
- Cavanagh, P.R.; Pollock, M.L.; Landa, J. A biomechanical comparison of elite and good distance runners. Ann. N. Y. Acad. Sci. 1977, 301, 328–345. [Google Scholar] [CrossRef] [PubMed]
- Mo, S.; Lau, F.O.Y.; Lok, A.K.Y.; Chan, Z.Y.S.; Zhang, J.H.; Shum, G.; Cheung, R.T.H. Bilateral asymmetry of running gait in competitive, recreational and novice runners at different speeds. Hum. Mov. Sci. 2020, 71, 102600. [Google Scholar] [CrossRef]
- Garcia, M.C.; Taylor-Haas, J.A.; Ford, K.R.; Long, J.T. Assessment of waveform similarity in youth long-distance runners. Gait Posture 2020, 77, 105–111. [Google Scholar] [CrossRef]
- Stiffler-Joachim, M.R.; Wille, C.M.; Kliethermes, S.A.; Johnston, W.; Heiderscheit, B.C. Foot angle and loading rate during running demonstrate a nonlinear relationship. Med. Sci. Sports Exerc. 2019, 51, 2067–2072. [Google Scholar] [CrossRef] [PubMed]
- Nakayama, Y.; Kudo, K.; Ohtsuki, T. Variability and fluctuation in running gait cycle of trained runners and non-runners. Gait Posture 2010, 31, 331–335. [Google Scholar] [CrossRef] [PubMed]
- Moore, I.S. Is there an economical running technique? A review of modifiable biomechanical factors affecting running economy. Sports Med. 2016, 46, 793–807. [Google Scholar] [CrossRef] [PubMed] [Green Version]
- Hoogkamer, W.; Kram, R.; Arellano, C.J. How biomechanical improvements in running economy could break the 2-h marathon barrier. Sports Med. 2017, 47, 1739–1750. [Google Scholar] [CrossRef] [PubMed]
- Hunter, J.P.; Marshall, R.N.; McNair, P.J. Relationships between ground reaction force impulse and kinematics of sprint-running acceleration. J. Appl. Biomech. 2005, 21, 31–43. [Google Scholar] [CrossRef] [Green Version]
- Nagahara, R.; Girard, O. Alterations of spatiotemporal and ground reaction force variables during decelerated sprinting. Scand. J. Med. Sci. Sports 2021, 31, 586–596. [Google Scholar] [CrossRef]
- Moore, I.S.; Jones, A.M.; Dixon, S.J. Mechanisms for improved running economy in beginner runners. Med. Sci. Sports Exerc. 2012, 44, 1756–1763. [Google Scholar] [CrossRef] [Green Version]
- Brown, A.M.; Sizchock, R.A.; Hillstrom, H.J. The effects of limb dominance and fatigue on running biomechanics. Gait Posture 2014, 39, 915–919. [Google Scholar] [CrossRef]
- Hamill, J.; Bates, B.T.; Knutzen, K.M. Ground reaction force symmetry during walking and running. Res. Q. Exerc. Sport 1984, 55, 289–293. [Google Scholar] [CrossRef]
- Van Hooren, B.; Fuller, J.T.; Buckley, J.D.; Miller, J.R.; Sewell, K.; Rao, G.; Barton, C.; Bishop, C.; Willy, R.W. Is motorized treadmill running biomechanically comparable to overground running? A systematic review and meta-analysis of cross-over studies. Sports Med. 2020, 50, 785–813. [Google Scholar] [CrossRef] [PubMed] [Green Version]
- Robadey, J.; Staudenmann, D.; Schween, R.; Gehring, D.; Gollhofer, A.; Taube, W. Lower between-limb asymmetry during running on treadmill compared to overground in subjects with laterally pronounced knee osteoarthritis. PLoS ONE 2018, 13, e0205191. [Google Scholar] [CrossRef] [PubMed]
Publisher’s Note: MDPI stays neutral with regard to jurisdictional claims in published maps and institutional affiliations. |
© 2021 by the authors. Licensee MDPI, Basel, Switzerland. This article is an open access article distributed under the terms and conditions of the Creative Commons Attribution (CC BY) license (https://creativecommons.org/licenses/by/4.0/).