
The Fluctuating Asymmetry of the Butterfly Wing Pattern Does Not Change along an Industrial Pollution Gradient


Abstract
1. Introduction
2. Materials and Methods
2.1. Study Region and Study Sites
2.2. Study Objects
2.3. Measurements
2.4. Chemical Analyses
2.5. Data Analysis
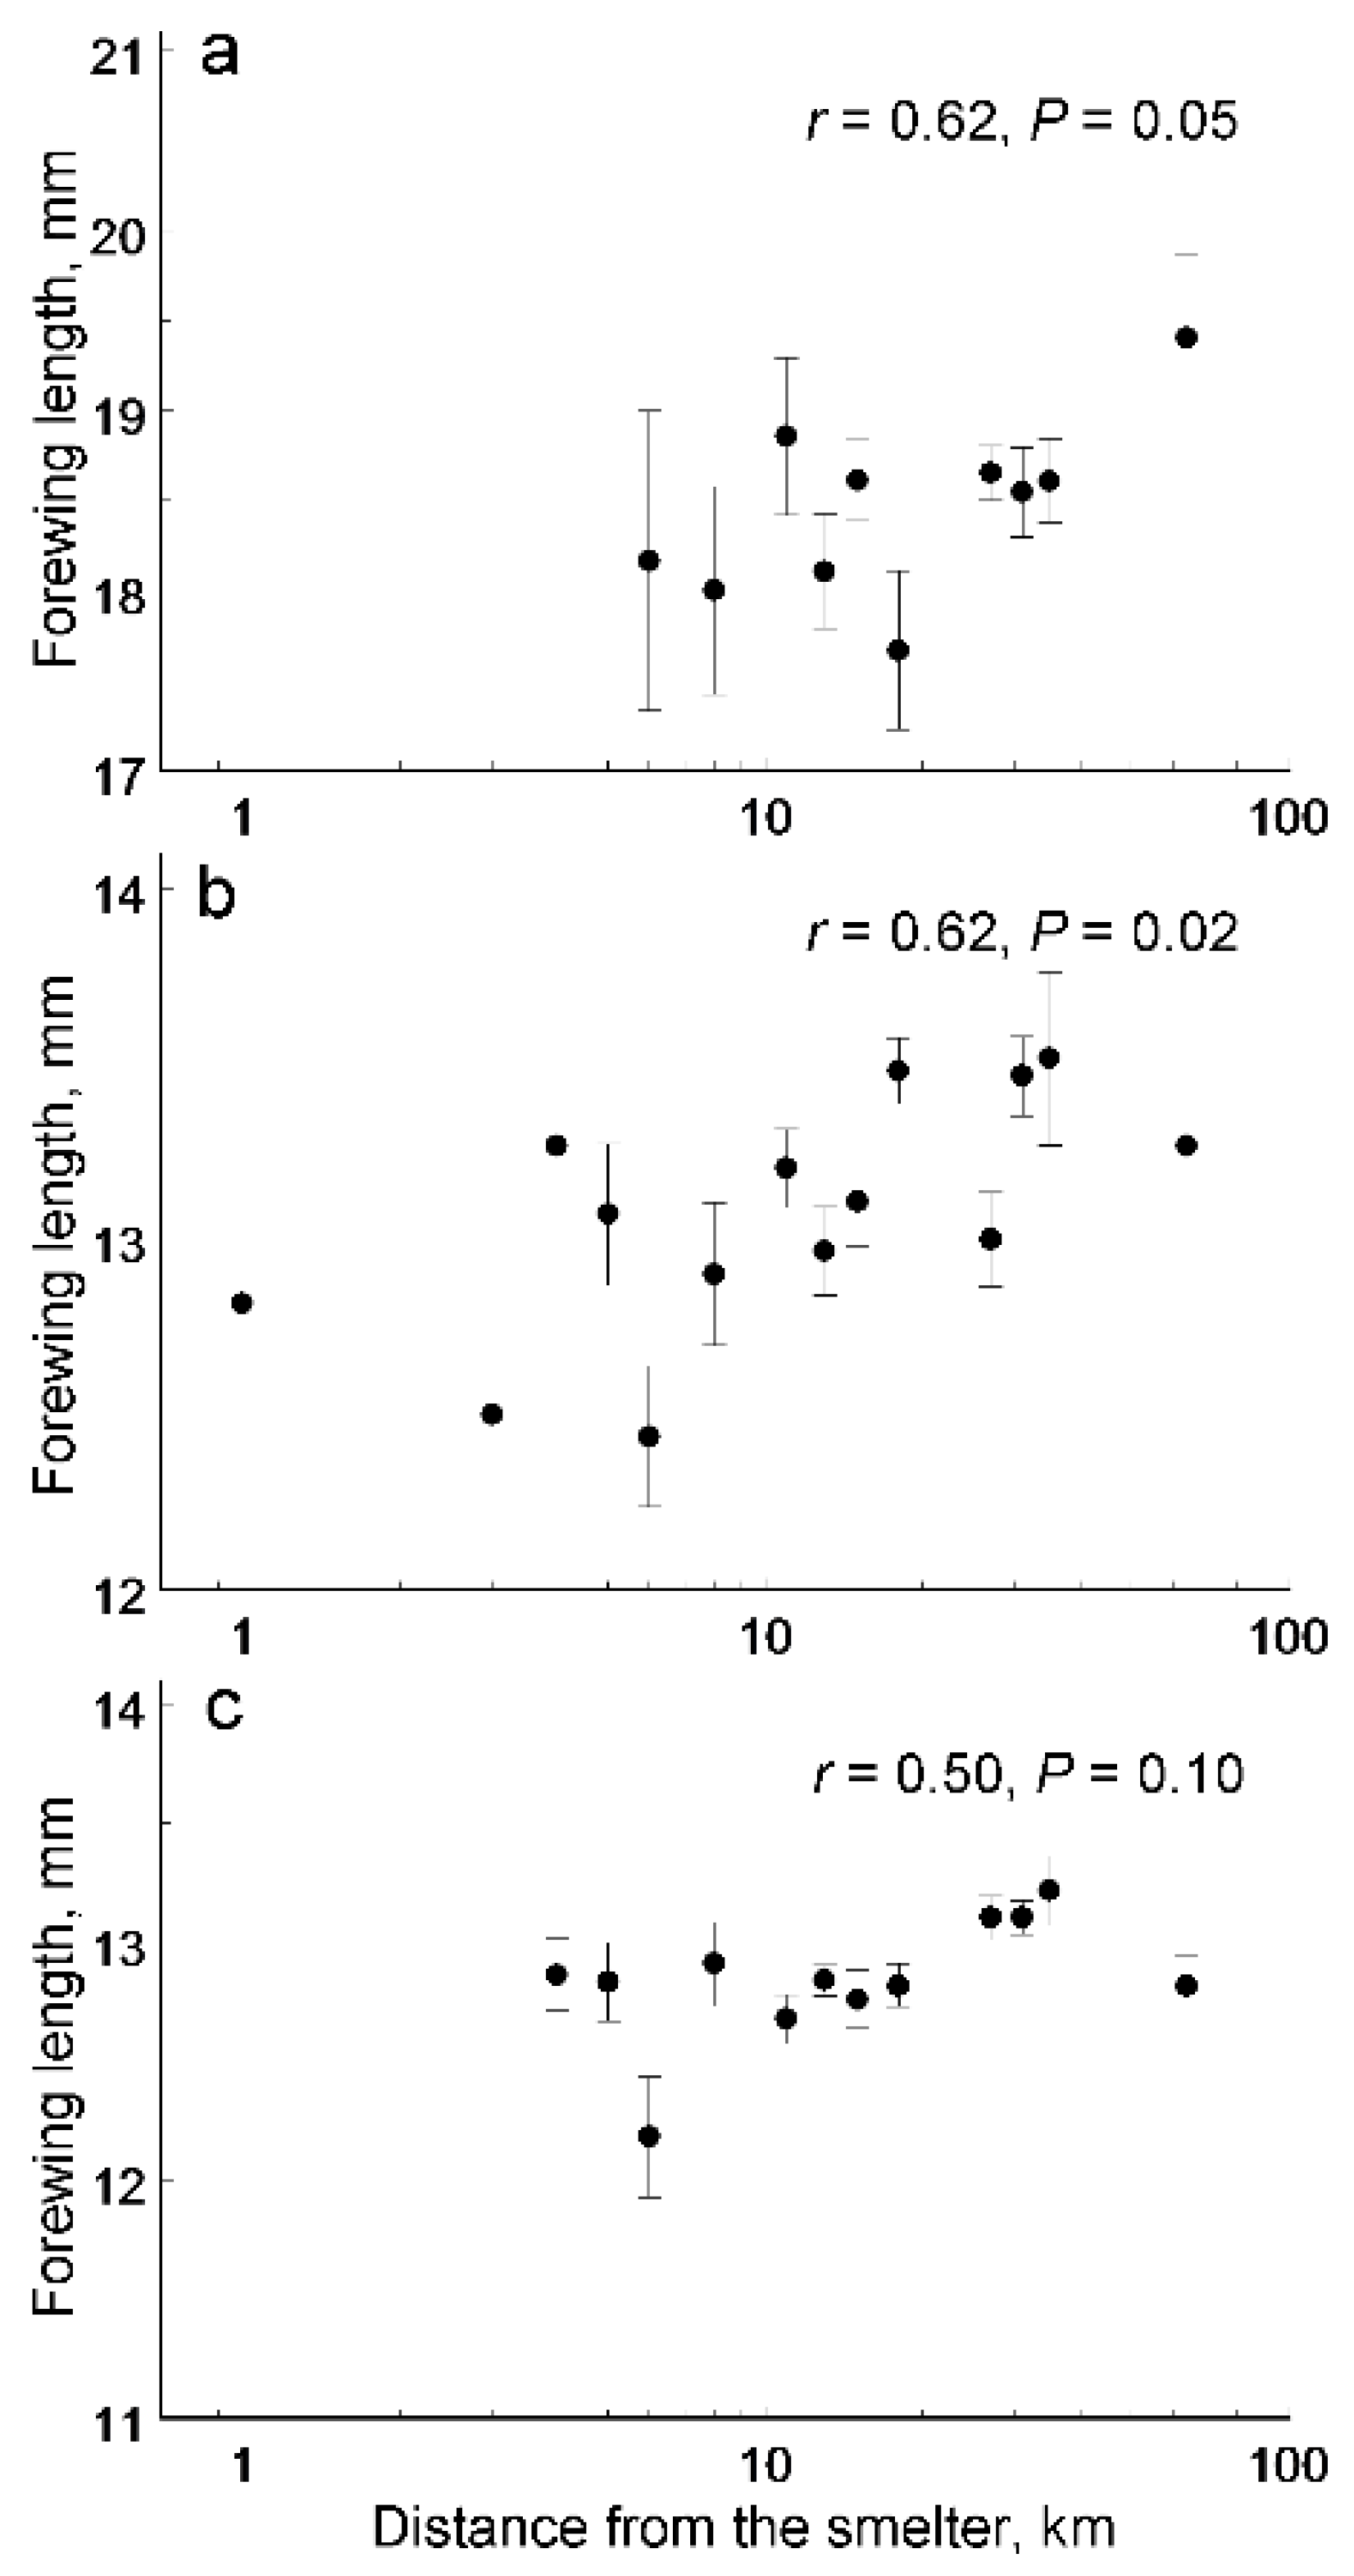
3. Results
4. Discussion
Supplementary Materials
Author Contributions
Funding
Institutional Review Board Statement
Informed Consent Statement
Data Availability Statement
Acknowledgments
Conflicts of Interest
References
- New, T.R. Are Lepidoptera an effective ‘umbrella group’ for biodiversity conservation? J. Insect Conserv. 1997, 1, 5–12. [Google Scholar] [CrossRef]
- Brereton, T.; van Swaay, C.; van Strien, A. Developing a butterfly indicator to assess changes in Europe’s biodiversity. Avocetta 2009, 33, 19–27. [Google Scholar]
- Kühn, E.; Feldmann, R.; Harpke, A.; Hirneisen, N.; Musche, M.; Leopold, P.; Settele, J. Getting the public involved in butterfly conservation: Lessons learned from a new monitoring scheme in Germany. Isr. J. Ecol. Evol. 2008, 54, 89–103. [Google Scholar] [CrossRef]
- Pollard, E.; Yates, T.J. Monitoring Butterflies for Ecology and Conservation: The British Butterfly Monitoring Scheme; Chapman and Hall: London, UK, 1993. [Google Scholar]
- Lee, M.S.; Comas, J.; Stefanescu, C.; Albajes, R. The Catalan butterfly monitoring scheme has the capacity to detect effects of modifying agricultural practices. Ecosphere 2020, 11, e03004. [Google Scholar] [CrossRef]
- Girardello, M.; Chapman, A.; Dennis, R.; Kaila, L.; Borges, P.A.; Santangeli, A. Gaps in butterfly inventory data: A global analysis. Biol. Conserv. 2019, 236, 289–295. [Google Scholar] [CrossRef]
- IPBES. Summary for Policymakers of the Global Assessment Report on Biodiversity and Ecosystem Services of the Intergovernmental Science-Policy Platform on Biodiversity and Ecosystem Services; IPBES Secretariat: Bonn, Germany, 2019. [Google Scholar]
- Barker, J.R.; Tingey, D.T. (Eds.) Air Pollution Effects on Biodiversity; Van Nostrand Reinhold: New York, NY, USA, 1992. [Google Scholar]
- Kozlov, M.V.; Zvereva, E.L.; Zverev, V.E. Impacts of Point Polluters on Terrestrial Biota: Comparative Analysis of 18 Contaminated Areas; Springer: Dordrecht, The Netherlands, 2009. [Google Scholar]
- Collins, N.M.; Morris, M.G. Threatened Swallowtail Butterflies of the World. The IUCN Red Data Book; IUCN: Gland, Switzerland, 1985. [Google Scholar]
- Kudrna, O. Aspects of the Conservation of Butterflies in Europe. Butterflies of Europe; Aula: Wiesbaden, Germany, 1986; Volume 8. [Google Scholar]
- Heliövaara, K.; Väisänen, R. Insects and Pollution; CRC Press: Boca Raton, FL, USA, 1993. [Google Scholar]
- deVries, M.W.; van Swaay, C. Global warming and excess nitrogen may induce butterfly decline by microclimatic cooling. Glob. Chang. Biol. 2006, 12, 1620–1626. [Google Scholar]
- Kozlov, M.V.; Lvovsky, A.; Mikkola, K. Abundance of day-flying Lepidoptera along an air pollution gradient in the northern boreal forest zone. Èntomol. Fenn. 1996, 7, 137–144. [Google Scholar] [CrossRef]
- Alstad, D.N.; Edmunds, G.F.; Weinstein, L.H. Effects of air pollutants on insect populations. Annu. Rev. Èntomol. 1982, 27, 369–384. [Google Scholar] [CrossRef]
- Zvereva, E.L.; Kozlov, M.V. Responses of terrestrial arthropods to air pollution: A meta-analysis. Environ. Sci. Pollut. Res. 2010, 17, 297–311. [Google Scholar] [CrossRef]
- Kozlov, M.V.; Haukioja, E.; Bakhtiarov, A.V.; Stroganov, D.N. Heavy metals in birch leaves around a nickel-copper smelter at Monchegorsk, Northwestern Russia. Environ. Pollut. 1995, 90, 291–299. [Google Scholar] [CrossRef]
- Odum, E.P. Trends expected in stressed ecosystems. BioScience 1985, 35, 419–422. [Google Scholar] [CrossRef]
- Palmer, A.R.; Strobeck, C. Fluctuating asymmetry: Measurement, analysis, patterns. Annu. Rev. Ecol. Syst. 1986, 17, 391–421. [Google Scholar] [CrossRef]
- Møller, A.P.; Swaddle, J.P. Asymmetry, Developmental Stability, and Evolution; Oxford University Press: Oxford, UK, 1997. [Google Scholar]
- Leamy, L.J.; Klingenberg, C.P. The genetics and evolution of fluctuating asymmetry. Annu. Rev. Ecol. Evol. Syst. 2005, 36, 1–21. [Google Scholar] [CrossRef]
- Graham, J.H.; Raz, S.; Hel-Or, H.; Nevo, E. Fluctuating asymmetry: Methods, theory, and applications. Symmetry 2010, 2, 466–540. [Google Scholar] [CrossRef]
- Manninen, S.; Zverev, V.; Bergman, I.; Kozlov, M.V. Consequences of long-term severe industrial pollution for aboveground carbon and nitrogen pools in northern taiga forests at local and regional scales. Sci. Total Environ. 2015, 536, 616–624. [Google Scholar] [CrossRef]
- Barcan, V.S. Nature and origin of multicomponent aerial emissions of the copper–nickel smelter complex. Environ. Int. 2002, 28, 451–456. [Google Scholar] [CrossRef]
- Polak, M.; Møller, A.P.; Gangestad, S.W.; Kroeger, D.E.; Manning, J.T.; Thornhill, R. Does an individual asymmetry parameter exist? A meta-analysis. In Developmental Instability: Causes and Consequences; Polak, M., Ed.; Oxford University Press: New York, NY, USA, 2003; pp. 81–96. [Google Scholar]
- Palmer, A.R.; Strobeck, C. Fluctuating asymmetry analyses revisited. In Developmental Instability: Causes and Consequences; Polak, M., Ed.; Oxford University Press: New York, NY, USA, 2003; pp. 279–319. [Google Scholar]
- SAS Institute. SAS/Stat. User’s Guide, Version 9.2; SAS Institute: Cary, NC, USA, 2009. [Google Scholar]
- Freedman, B.; Hutchinson, T.C. Long-term effects of smelter pollution at Sudbury, Ontario, on forest community composition. Can. J. Bot. 1980, 58, 2123–2140. [Google Scholar] [CrossRef]
- Brändle, M.; Amarell, U.; Auge, H.; Klotz, S.; Brandl, R. Plant and insect diversity along a pollution gradient: Understanding species richness across trophic levels. Biodivers. Conserv. 2001, 10, 1497–1511. [Google Scholar] [CrossRef]
- Zverev, V.; Kozlov, M.V. Decline of Eulia ministrana (Lepidoptera: Tortricidae) in polluted habitats is not accompanied by phenotypic stress responses. Insect Sci. 2021. [Google Scholar] [CrossRef]
- Kenward, M.G.; Roger, J.H. An improved approximation to the precision of fixed effects from restricted maximum likelihood. Comput. Stat. Data Anal. 2009, 53, 2583–2595. [Google Scholar] [CrossRef]
- Littell, R.C.; Milliken, G.A.; Stroup, W.W.; Wolfinger, R.D.; Schabenberger, O. SAS for Mixed Models, 2nd ed.; SAS Institute: Cary, NC, USA, 2006. [Google Scholar]
- Kozlov, M.V.; Haukioja, E.; Kovnatsky, E.F. Uptake and excretion of nickel and copper by leaf-mining larvae of Eriocrania semipurpurella (Lepidoptera: Eriocraniidae) feeding on contaminated birch foliage. Environ. Pollut. 2000, 108, 303–310. [Google Scholar] [CrossRef]
- Zvereva, E.; Serebrov, V.; Glupov, V.; Dubovskiy, I. Activity and heavy metal resistance of non-specific esterases in leaf beetle Chrysomela lapponica from polluted and unpolluted habitats. Comp. Biochem. Physiol. Part C Toxicol. Pharmacol. 2003, 135, 383–391. [Google Scholar] [CrossRef]
- Isaeva, L.G.; Sukhareva, T. Elemental composition of wild small shrubs in the area of influence of “Severonickel” combine: Data of long-term monitoring. Tsvetnye Met. 2013, 10, 87–92. (In Russian) [Google Scholar]
- Zhulidov, A.V. Excretion of heavy metals from organisms of invertebrates. In Ecotoxicology and Nature Protection; Krivolutsky, D.A., Bocharov, V.F., Eds.; Nauka: Moscow, Russia, 1988; pp. 170–176. (In Russian) [Google Scholar]
- Andrzejewska, L.; Czarnowska, K.; Matel, B. Distribution of heavy metal pollution in plants and herbivorous Spodoptera littoralis L. (Lepidoptera). Ekol. Pol. 1990, 38, 185–199. [Google Scholar]
- Laskowski, R. Are the top carnivores endangered by heavy metal biomagnification? Oikos 1991, 60, 387–390. [Google Scholar] [CrossRef]
- Huang, D.; Kong, J.; Seng, Y. Effects of the heavy metal Cu2+ on growth, development, and population dynamics of Spodoptera litura (Lepidoptera: Noctuidae). J. Econ. Èntomol. 2012, 105, 288–294. [Google Scholar] [CrossRef]
- Kobieva, M.E.; Snell-Rood, E.C. Nickel exposure has complex transgenerational effects in a butterfly. Integr. Comp. Biol. 2018, 58, 1008–1017. [Google Scholar]
- Ruohomäki, K.; Kaitaniemi, P.; Kozlov, M.V.; Tammaru, T.; Haukioja, E. Density and performance of Epirrita autumnata (Lepidoptera: Geometridae) along three air pollution gradients in Northern Europe. J. Appl. Ecol. 1996, 33, 773–785. [Google Scholar] [CrossRef]
- Boyd, R.S.; Martens, S.N. Nickel hyperaccumulated by Thlaspi montanum var. montanum is acutely toxic to an insect herbivore. Oikos 1994, 70, 21–25. [Google Scholar]
- Jhee, E.M.; Boyd, R.S.; Eubanks, M.D.; Davis, M.A. Nickel hyperaccumulation by Streptanthus polygaloides protects against the folivore Plutella xylostella (Lepidoptera: Plutellidae). Plant Ecol. 2005, 183, 91–104. [Google Scholar] [CrossRef]
- Hughes, L.; Chang, B.S.-W.; Wagner, D.; Pierce, N.E. Effects of mating history on ejaculate size, fecundity, longevity, and copulation duration in the ant-tended lycaenid butterfly, Jalmenus evagoras. Behav. Ecol. Sociobiol. 2000, 47, 119–128. [Google Scholar] [CrossRef]
- Bauerfeind, S.S.; Fischer, K. Maternal body size as a morphological constraint on egg size and fecundity in butterflies. Basic Appl. Ecol. 2008, 9, 443–451. [Google Scholar] [CrossRef]
- Mulder, C.; Aldenberg, T.; De Zwart, D.; Van Wijnen, H.J.; Breure, A.M. Evaluating the impact of pollution on plant-Lepidoptera relationships. Environmetrics 2005, 16, 357–373. [Google Scholar] [CrossRef]
- Zvereva, E.L.; Kozlov, M.V. Growth and reproduction of dwarf shrubs, Vaccinium myrtillus and V. vitis-idaea, in a severely polluted area. Basic Appl. Ecol. 2005, 6, 261–274. [Google Scholar] [CrossRef]
- Waddington, C.H. Canalization of development and the inheritance of acquired characters. Nature 1942, 150, 563–565. [Google Scholar] [CrossRef]
- Lens, L.; Eggermont, H. Fluctuating asymmetry as a putative marker of human-induced stress in avian conservation. Bird Conserv. Int. 2008, 18, S125–S143. [Google Scholar] [CrossRef]
- Beasley, D.A.E.; Bonisoli-Alquati, A.; Mousseau, T.A. The use of fluctuating asymmetry as a measure of environmentally induced developmental instability: A meta-analysis. Ecol. Indic. 2013, 30, 218–226. [Google Scholar] [CrossRef]
- Zakharov, V.M. Analysis of fluctuating asymmetry as a method of biomonitoring at the population level. In Bioindications of Chemical and Radioactive Pollution; Krivolutsky, D.A., Ed.; Mir Publishers: Moscow, Russia, 1990; pp. 187–198. [Google Scholar]
- Clarke, G.M. Fluctuating asymmetry: A technique for measuring developmental stress of genetic and environmental origin. Acta Zool. Fenn. 1992, 191, 31–35. [Google Scholar]
- Parsons, P.A. Fluctuating asymmetry—A biological monitor of environmental and genomic stress. Heredity 1992, 68, 361–364. [Google Scholar] [CrossRef] [PubMed]
- Kozlov, M.V. Plant studies on fluctuating asymmetry in Russia: Mythology and methodology. Russ. J. Ecol. 2017, 48, 1–9. [Google Scholar] [CrossRef]
- Bonada, N.V.; Rieradevall, M.; Prat, N. Relationship between pollution and fluctuating asymmetry in the pollution-tolerant caddisfly Hydropsyche exocellata (Trichoptera, Insecta). Arch. Hydrobiol. 2005, 162, 167–185. [Google Scholar] [CrossRef]
- Rabitsch, W.B. Levels of asymmetry in Formica pratensis Retz. (Hymenoptera, Insecta) from a chronic metal-contaminated site. Environ. Toxicol. Chem. 1997, 16, 1433–1440. [Google Scholar] [CrossRef]
- Zverev, V.; Kozlov, M.V. Variation in leaf size and fluctuating asymmetry of mountain birch (Betula pubescens var. pumila) in space and time: Implications for global change research. Symmetry 2020, 12, 1703. [Google Scholar] [CrossRef]
- Brookes, M.I.; Graneau, Y.A.; King, P.; Rose, O.C.; Thomas, C.D.; Mallet, J.L.B. Genetic analysis of founder bottlenecks in the rare British butterfly Plebejus argus. Conserv. Biol. 1997, 11, 648–669. [Google Scholar] [CrossRef]
- Torres, M.A.J.; Sarte, C.E.; Demayo, C.G. Developmental independence of the eyespots in the wings of the nymphalid butterfly Ypthima lisandra Cramer 1782. Asia Life Sci. 2008, 17, 91–107. [Google Scholar]
- Kark, S.; Lens, L.; Van Dongen, S.; Schmidt, E. Asymmetry patterns across the distribution range: Does the species matter? Biol. J. Linn. Soc. 2004, 81, 313–324. [Google Scholar] [CrossRef]
- Campero, M.; De Block, M.; Ollevier, F.; Stoks, R. Metamorphosis offsets the link between larval stress, adult asymmetry and individual quality. Funct. Ecol. 2008, 22, 271–277. [Google Scholar] [CrossRef]
- Gangestad, S.W.; Thornhill, R. Individual differences in developmental precision and fluctuating asymmetry: A model and its implications. J. Evol. Biol. 1999, 12, 402–416. [Google Scholar] [CrossRef]
- Kozlov, M.V.; Zvereva, E.L. Confirmation bias in studies of fluctuating asymmetry. Ecol. Indic. 2015, 57, 293–297. [Google Scholar] [CrossRef]
- Forstmeier, W.; Wagenmakers, E.J.; Parker, T.H. Detecting and avoiding likely false-positive findings—A practical guide. Biol. Rev. 2017, 92, 1941–1968. [Google Scholar] [CrossRef]
- Lane, A.; Luminet, O.; Nave, G.; Mikolajczak, M. Is there a publication bias in behavioural intranasal oxytocin research on humans? Opening the file drawer of one laboratory. J. Neuroendocr. 2016, 28. [Google Scholar] [CrossRef] [PubMed]


| Site † | Latitude, N | Longitude, E | Nickel in Birch Leaves ‡, µg g−1 | Stand Basal Area §, m2 ha−1 | Cover of Field Layer §, % | Habitat Type ¶ | |
|---|---|---|---|---|---|---|---|
| 1991–1993 | 2008 | ||||||
| 15N | 68°03′ | 33°01′ | 40 | 26 | 5.3 | 40.5 | DF |
| 13N | 68°02′ | 32°59′ | 30 | - | - | - | SDF |
| 11N | 68°01′ | 32°57′ | 68 | 35 | 2.3 | 15.0 | SDF |
| 5N | 67°58′ | 32°52′ | 138 | 66 | 0.3 | 0 | IB |
| 3N | 67°57′ | 32°51′ | 208 | 100 | 0 | 0 | IB |
| 1N | 67°56′ | 32°49′ | 338 | 223 | 0.3 | 0.4 | IB |
| 1S | 67°55′ | 32°48′ | 168 | - | 0.2 | - | BWC |
| 4S | 67°53′ | 32°47′ | 195 | 95 | 0 | 12.6 | BWC |
| 6S | 67°52′ | 32°48′ | 186 | 119 | 0 | 1 | IB |
| 8S | 67°51′ | 32°48′ | 153 | 92 | 0 | 0.7 | IB |
| 13S | 67°48′ | 32°47′ | 90 | 59 | 2.0 | 16.6 | SDF |
| 18S | 67°46′ | 32°48′ | 62 | 34 | 3.0 | - | DF |
| 27S | 67°41′ | 32°50′ | 35 | 21 | 12.0 | 48.5 | DF |
| 31S | 67°38′ | 32°45′ | 37 | 17 | 6.3 | 56.0 | DF |
| 40S | 67°35′ | 32°33′ | 19 | 19 | 11.0 | 52.0 | UF |
| 64SE | 67°32′ | 33°58′ | 10 | 8 | 18.7 | 29.0 | UF |
| Source of Variation | Nickel | Copper | ||
|---|---|---|---|---|
| Test Statistics | p | Test Statistics | p | |
| Species | F1, 18.4 = 0.39 | 0.54 | F1, 17.8 = 0.01 | 0.92 |
| Distance | F1, 8.97 = 7.25 | 0.02 | F1, 10.4 = 6.01 | 0.03 |
| Species × Distance | F1, 19.0 = 0.46 | 0.51 | F1, 17.3 = 0.11 | 0.75 |
| Site | χ21 = 0.26 | 0.61 | χ21 = 0.71 | 0.40 |
| Source of Variation | Forewing Length | Fluctuating Asymmetry | ||
|---|---|---|---|---|
| Test Statistics | p | Test Statistics | p | |
| Species | F2, 199.9 = 66.3 | <0.0001 | F2, 378.4 = 5.00 | 0.0072 |
| Sex | F1, 704.6 = 2.92 | 0.09 | F1, 667.5 = 1.95 | 0.16 |
| Species × Sex | F2, 705.3 = 2.31 | 0.10 | F2, 670.5 = 0.58 | 0.56 |
| Distance | F1, 37.6 = 33.4 | <0.0001 | F1, 37.4 = 1.20 | 0.28 |
| Sex × Distance | F1, 704.9 = 0.04 | 0.83 | F1, 667.7 = 1.63 | 0.20 |
| Species × Distance | F2, 250.5 = 1.83 | 0.16 | F2, 401.5 = 1.47 | 0.23 |
| Species × Sex × Distance | F2, 704.8 = 2.43 | 0.09 | F2, 671.4 = 0.80 | 0.45 |
| Site | χ21 = 0.20 | 0.65 | χ21 = 3.78 | 0.05 |
| Species | Spot † | DA ‡, mm | Source of Variation: Side | FA § | Source of Variation: Side × Individual | Reproducibility (ME5) | ||
|---|---|---|---|---|---|---|---|---|
| F1, 19 | p | F19, 38 | p | |||||
| Boloria euphrosyne | 1 | −0.072 | 6.74 | 0.02 | 0.068 | 2.08 | 0.02 | 0.350 |
| 2 | 0.008 | 1.01 | 0.33 | 0.044 | 8.04 | <0.0001 | 0.779 | |
| Plebejus idas | 1 | 0.041 | 5.71 | 0.03 | 0.078 | 2.20 | 0.02 | 0.375 |
| 2 | 0.024 | 1.64 | 0.22 | 0.100 | 13.57 | <0.0001 | 0.860 | |
| Agriades optilete | 1 | −0.004 | 0.05 | 0.83 | 0.051 | 2.09 | 0.02 | 0.350 |
| 2 | −0.006 | 0.32 | 0.58 | 0.083 | 7.19 | <0.0001 | 0.754 | |
Publisher’s Note: MDPI stays neutral with regard to jurisdictional claims in published maps and institutional affiliations. |
© 2021 by the authors. Licensee MDPI, Basel, Switzerland. This article is an open access article distributed under the terms and conditions of the Creative Commons Attribution (CC BY) license (https://creativecommons.org/licenses/by/4.0/).
Share and Cite
Zverev, V.; Kozlov, M.V. The Fluctuating Asymmetry of the Butterfly Wing Pattern Does Not Change along an Industrial Pollution Gradient. Symmetry 2021, 13, 626. https://doi.org/10.3390/sym13040626
Zverev V, Kozlov MV. The Fluctuating Asymmetry of the Butterfly Wing Pattern Does Not Change along an Industrial Pollution Gradient. Symmetry. 2021; 13(4):626. https://doi.org/10.3390/sym13040626
Chicago/Turabian StyleZverev, Vitali, and Mikhail V. Kozlov. 2021. "The Fluctuating Asymmetry of the Butterfly Wing Pattern Does Not Change along an Industrial Pollution Gradient" Symmetry 13, no. 4: 626. https://doi.org/10.3390/sym13040626
APA StyleZverev, V., & Kozlov, M. V. (2021). The Fluctuating Asymmetry of the Butterfly Wing Pattern Does Not Change along an Industrial Pollution Gradient. Symmetry, 13(4), 626. https://doi.org/10.3390/sym13040626