Abstract
Using the foundation pit at the Jianye Road Station of Hangzhou Metro Line 6 as a case study, the deformation characteristics of a foundation pit subjected to asymmetric loads is investigated in this paper using PLAXIS 3D numerical simulation software. The influence of active pressure zone reinforcement, passive pressure zone reinforcement, and increased thickness of the diaphragm wall at the loaded side on the maximum lateral displacement of diaphragm wall retaining structure of foundation pit is also systematically analyzed. The results show that the deformation of the diaphragm walls on both sides of the foundation pit is strongly inconsistent when subjected to asymmetric loads and is affected by the asymmetric load value and its distance to the foundation pit. In order to reduce the lateral deformations of foundation pit subjected to asymmetric load, two displacement control methods are adopted in the numerical simulations. It is shown that reinforcing the active pressure zone can reduce the maximum lateral displacement of the diaphragm wall on the loaded side to a certain extent but the reinforcement should have a certain depth, resulting in poor efficiency. On the other hand, reinforcing the passive pressure zone can effectively reduce the difference in lateral deformation between the two sides of the foundation pit by increasing the depth and width of the reinforcement zones. It is also observed that the increase in the thickness of the diaphragm wall can reduce the adverse effect of asymmetric loads on the foundation pit. The research results can provide reference for using measures to reduce the influence of asymmetric loads.
1. Introduction
In recent years, the rapid development of urban underground space has given rise to the emergence of a large number of complex foundation pit challenges, such as deep excavations, different depth excavations, and excavations close to roads, railways or high-rise buildings. The excavations in different subsurface conditions have been reported in the literature, such as the clayey strata in Hangzhou [1] and Shanghai [2], China; sandy deposit overlying karst in Guangzhou, China [3]; decomposed geomaterials in Hong Kong, China [4]; residual soils or sandy soils overlying soft to hard rocks in South Korea [5]; boulder clay in Dublin, Ireland [6]; modern lacustrine-marine deposits composed of sand of medium-grain and medium density in St. Petersburg, Russia [7], and clayey layer in Chicago, USA [8]. In the process of deep foundation pit excavation, unloading will cause soil stress changes, resulting in surface settlement, building settlement, and nearby pipeline deformations [9,10]. Many studies in foundation pit engineering combine numerical analysis and actual measurements to investigate the influence of foundation pit excavation on its own retaining structures and surrounding environment to obtained useful insights and experience for similar projects [11,12,13,14,15,16,17]. Zhou [11] presented a case history of a multi-bench retained excavation in Tianjin, China, and numerically analyzed the influencing factors on its performance and the optimal retaining layout. Lim and Ou [12] investigated the performance and mechanism of a strut-free wide excavation case history in soft soil through the results of field monitoring and three-dimensional finite element (FE) analysis using PLAXIS 3D. Hung and Phienwej [13] reviewed 18 cases of deep excavations in 4–16-m-thick soft clay in central Ho Chi Minh City (HCMC), and investigated the non-linear modulus values and strength values of HCMC soft clay obtained with the hardening soil model in a thorough laboratory testing program. Voottipruex et al. [14] presented the results of full-scale tests and three-dimensional FE analyses of deep cement mixing (DCM) and stiffened deep cement mixing (SDCM) columns under lateral loads and DCM and SDCM walls under deep excavation in soft clay, with the results discussed in terms of the profiles of lateral displacement, settlement and bending moment. Schwamb and Soga [15] investigated the deep circular excavation at Abbey Mills in London with the two-dimensional finite difference analysis, and stated that the diaphragm wall deflections were still very small (i.e., about 4 mm) when the depth of a circular excavation exceeded 71 m. Houhou et al. [16] conducted a three-dimensional finite difference analysis of a deep excavation braced by diaphragm walls. The results indicated that the maximum horizontal wall displacements were almost threefold compared to the maximum ground surface settlements. In addition, Ng et al. [17] conducted centrifuge tests of basement excavation effects on an existing tunnel in dry sand and carried out a numerical simulation for back-analysis.
In foundation pit engineering projects, the loads on both sides of the proposed excavation site are often unequal, which may be caused by the nearby slope, embankment and the stacking building materials. Researchers have measured, simulated, and analyzed the deformation characteristics of foundation pits subjected to asymmetric pressures [18,19,20]. Ou et al. [18] indicated that the deformation mode of deep excavation subjected to unsymmetrical surface loading is rotate deformation, and proposed optimized methods during the excavation process for practical applications. Guo et al. [19] described the displacement and force characteristics of a braced deep excavation under unsymmetrical surcharge effect with the beam on elastic foundation method and finite difference method, and found that the surcharge effect was detrimental to the wall and pile responses and the excavation stability. Rashidi and Shahir [20] estimated the displacement and internal forces of an anchored soldier pile wall used for deep excavation stabilization in the vicinity of buildings due to surcharge based on the FE analysis. The results show that the bending moments and deformations of the retaining structure on the loaded side are greater than those on the non-loaded side but the difference varies. When the asymmetric load is large enough, the entire retaining structure may shift to the non-loaded side [21]. It was also indicated that improving foundation pit soil and increasing support system stiffness can not only reduce the lateral deformations of the retaining structure and the settlement of soil behind the pit, but also decrease soil uplifting at the bottom of the pit [22]. The goal of foundation pit soil improvement is to enhance the physical and mechanical properties of soil, so as to improve the ability to resist deformations [23]. Furthermore, increasing the stiffness of support system directly enhances the ability of retaining structure to resist deformations [24].
Taking the foundation pit of Jianye Road Station of Hangzhou Metro Line 6 as a case study, three-dimensional numerical simulations of the lateral deformations of the foundation pit subjected to asymmetric loads are conducted and the numerical results are calibrated against the in situ measured data. In this paper, the lateral deformations of the diaphragm walls of the foundation pit under different types of asymmetric loads are presented and control measures for uneven deformations of the diaphragm walls on both sides are proposed, including soil reinforcement in the active and passive pressure zones, and thickening of the diaphragm wall at the loaded side.
2. Engineering Project Description
2.1. General Description of Foundation Pit
Jianye Road station is located at the intersection of Jiangnan Avenue and Jianye Road in Hangzhou City, Zhejiang Provence, China, and its plan view is shown in Figure 1. It is an underground two-story island station arranged along the east-west axis of Jiangnan Avenue. The total length of the station is 477 m and the width of the standard section of the foundation pit is 21.7 m. The width of both ends of the foundation pit is 25.6 m and the excavation depth is about 16.7 m. The foundation pit support design adopts a diaphragm wall and an internal support system. The diaphragm wall is 0.80 m thick and its installation depth is 44 m. Steel joints are adopted in the diaphragm walls. The standard section of foundation pit has four supports, as shown in Figure 2. The first layer is supported by C30 reinforced concrete with the cross-section of 800 mm × 1000 mm, and the concrete connecting beam cross-section is 600 mm × 700 mm; the second layer is supported by steel shotcrete with the cross-section of Ø609 mm × 16 mm; and the third and fourth layers are supported by steel shotcrete with the cross-section of Ø800 mm × 20 mm. There are five layers of oblique support at both ends of the pit: the first layer is supported by C30 reinforced concrete with the cross-section of 800 mm × 1000 mm and the remaining four layers are supported by steel shotcrete with the cross-section of Ø800 mm × 20 mm. The cross-sectional dimensions of the columns in the pit are 460 mm × 460 mm and the column piles are filled with a hole-in-the-wall pile of 850 mm. In order to ensure the safety of the foundation pit, high-pressure rotary jet piles are used at the bottom of the foundation pit, as shown in Figure 3. The installation of the high-pressure rotary jet piles can effectively enhance the physical and mechanical properties of soil, so as to improve the ability to resist deformations. The soil improvement can not only reduce the lateral deformations of the retaining structure and the settlement of soil behind the pit, but also decrease soil uplifting at the bottom of the pit. Soil reinforcement is applied as follows: the end of the foundation pit is fully reinforced within 5 m below the bottom of the pit, while the rest of the foundation pit is grid-reinforced within 3 m below the bottom of the pit, and the connection area between the end of foundation pit and the standard section is reinforced from 3 m below the ground to 5 m below the pit. The surroundings of the foundation pit are uncomplicated and there are no adjacent large buildings. There are several buildings along the northwest side of the foundation pit, but those are far away.
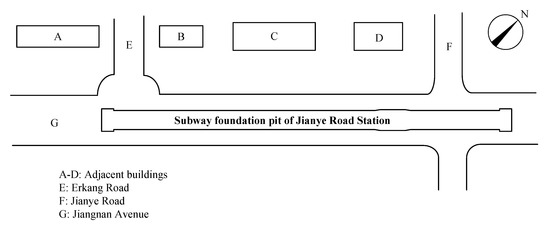
Figure 1.
Layout of foundation pit.
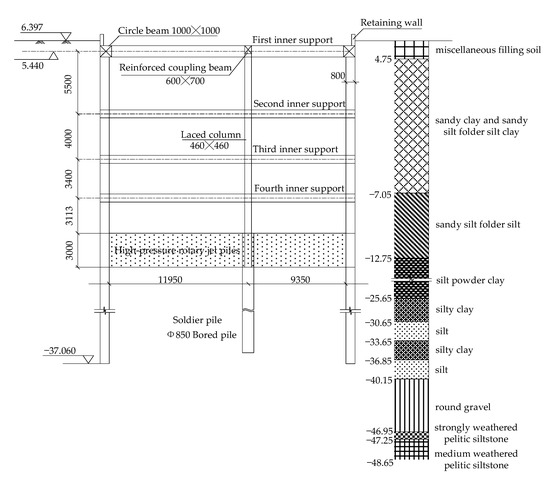
Figure 2.
Typical cross-section of supporting structure of foundation pit.
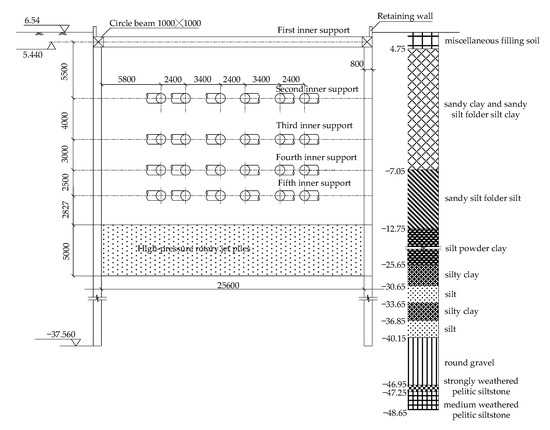
Figure 3.
End cross-section of supporting structure of foundation pit.
2.2. Geological and Hydrological Conditions
As shown in Figure 2, the soil underlying the foundation pit consists of: miscellaneous filling soil, sandy clay and sandy silt folder silt clay, sandy silt folder silt, silt powder clay, silty clay, silt, silty clay, silt, round gravel, strongly weathered pelitic siltstone, and medium weathered pelitic siltstone. The groundwater locates at the depth of 1.7–2.4 m according to the engineering geological survey report, and can be divided into two type, named phreatic water and confined water. Phreatic water mainly occurs in the upper miscellaneous filling, sandy silt and silty sand layer, and is mainly supplied by the runoff of atmospheric precipitation and the lateral supply of river water. The volume of the phreatic water is large, and the water level changes with seasons. While the confined water mainly occurs in the deep silt and round gravel. The physical and mechanical properties of the soil layers at the site are listed in Table 1.

Table 1.
Main soil parameters.
2.3. Construction Process
Using to the layout of the plugging wall of the foundation pit, the entire foundation pit can be divided into three smaller sections from left to right, as shown in Figure 4. Due to the long construction period of the foundation pit, and the symmetry of the structure, this paper mainly focuses on foundation pit no. I. The excavation of foundation pit no. I started on 21 May 2018 and finished on 27 September 2018, lasting for 137 days. The foundation pit was excavated in five stages, the first layer was excavated as a whole, and the remaining four layers in blocks. Table 2 lists the excavation sequence and timeline for foundation pit no. I.

Figure 4.
Foundation pit sections.

Table 2.
Construction stages.
2.4. Monitoring Program
In order to better understand the deformations of foundation pit and their impact on the surrounding environment during excavation, dynamic in situ tracking of the following data were conducted: (1) lateral deformations of diaphragm walls along the depth (ZQT01–ZQT06, ZQT25–ZQT30, and ZQT49), (2) lateral deformations at the top of diaphragm walls (ZQS01–ZQS06, ZQS25–ZQS30, and ZQS49), (3) surface subsidence outside pits (DBC1-1–DBC1-10 to DBC6-1–DBC6-10, and DBC25-1–DBC25-5), (4) column uplift and settlement (LZC01–LZC04), and (5) support axial force (ZCL01-1-5 to ZCL08-1 -4). The layout of the monitoring points is shown in Figure 5. The distance between the surface settlement monitoring points outside the pit and the edge of the diaphragm wall from near to far was 2 m, 5 m, 10 m, 17 m, and 25 m respectively.
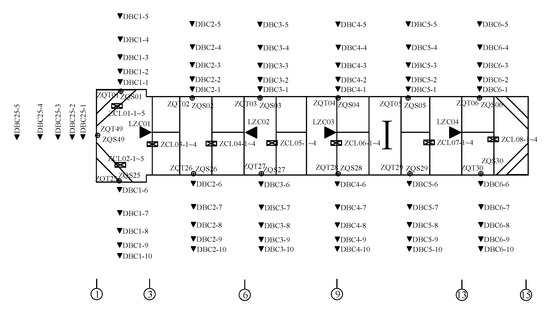
Figure 5.
Layout of monitoring points.
3. Finite Element Analysis
3.1. Numerical Parameters
In order to simplify the simulations, the soil hardening model (HS model) is adopted for some soil layers with small thickness. According to the research on foundation pits in Shanghai [25], the empirical relationships among E50ref, Eoedref and Eurref are as follows: for cohesive soils E50ref = 1.2Eoedref and Eurref = 7Eoedref, and for sandy soils E50ref = Eoedref and Eurref = 4Eoedref. According to Wang [25], the value of damage ratio Rinter is generally 0.6 or 0.9. As mentioned before, the pit bottom soil reinforcement is modelled by enhancing the strength and stiffness of the soil of the reinforced zone and the HS constitutive model is used for the cemented soil. The numerical parameters of each soil layer are shown in Table 3. The material of diaphragm wall is assumed to be elastic with the elastic modulus of 31.5 GPa. Both concrete and steel shotcrete are adopted as the supports of the foundation pit, with the elastic moduli of 30 GPa and 209 GPa, respectively. The value of parameters of the structural elements used in the numerical model are shown in Table 4.

Table 3.
Parameters of HS model used in numerical simulations.

Table 4.
Supporting structure parameters used in numerical simulations.
3.2. Finite Element Model
A calibrated FE model is established for foundation pit no.I using PLAXIS 3D software. According to Hsieh and Ou [26], the influence area of foundation pit excavation can be divided into the main and the secondary influence areas. The main influence area is located within two times of the excavation depth behind the diaphragm wall, while the secondary influence area 2–4 times of the excavation depth behind the diaphragm wall. In this paper, the distance from the edge of diaphragm wall to the boundary of the FE model is taken as four times the excavation depth. Therefore, the model size is 271 m × 176 m × 60 m. The boundary conditions of the FE model are such that the normal displacements are constrained on the side and the bottom surfaces. The soil is represented with 15-node triangular elements. The diaphragm walls, internal supports, and columns are simulated by plate elements, beam elements, and embedded pile elements, respectively, as shown in Figure 6. The soil reinforcement is simulated by enhancing the strength and stiffness of the soil in the reinforcement area.
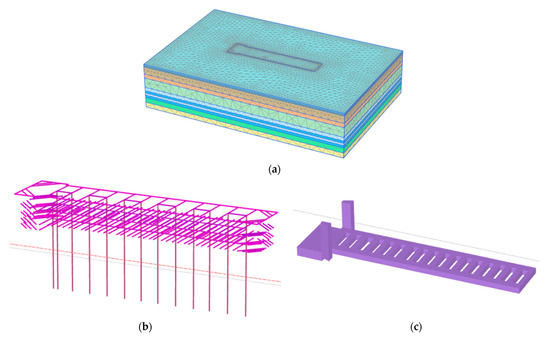
Figure 6.
Finite element model: (a) FE model of diaphragm walls and soil; (b) Support model; (c) Soil reinforcement model.
3.3. Simulation Procedure
The unlading sequence for numerical simulations was designed according to the actual construction stages and the support position of the standard section, as shown in Figure 7. Each layer was excavated to 0.5 m below the support position and the simulations followed the sequence of excavation in layers and blocks and support with excavation. The entire excavation process is summarized in Table 5.

Figure 7.
Step by step vertical unloading diagram of foundation pit.

Table 5.
Excavation stages.
3.4. Numerical Model Validation
In order to verify the accuracy of the numerical model and its parameters, the numerical results of lateral deformations of the diaphragm wall under various working conditions are validated against the measured data at monitoring point ZQT4, as shown in Figure 8. The maximum lateral deformation position, the maximum lateral deformation, and the deformation trend are generally the same between the simulations and monitoring data. The lateral deformation curve exhibits a bow shape with a large value in the middle and small values at both ends. The numerical results show good agreement with the measured data with the maximum difference in the lateral deformations less than 20%.
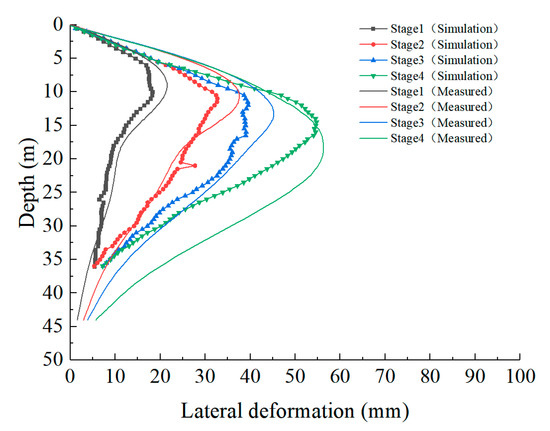
Figure 8.
Comparison of measured and simulated deformations at measurement location ZQT4.
4. Lateral Deformations of Diaphragm Walls Subjected to Asymmetric Load
In foundation pit engineering, it is inevitable that the retaining structures on both sides bear unbalanced loads. The reasons for the formation of asymmetric pressure include different ground elevations on both sides of the retaining structure, use of building materials or machinery, existing buildings or other structures, traffic loads near the pit, asymmetric excavation sequence, and uneven distribution of soil layers within the depth of the foundation pit. In this paper, the lateral deformation characteristics of diaphragm walls with existing buildings (structures) on one side of foundation pit are studied, including different magnitudes and distances of the asymmetric loads. The assumed location of the asymmetric loads acting near the foundation pit is shown in Figure 9. It should be noted that the asymmetric load is simulated as a pressure acting on a rectangular area with the width of 20 m, and its length is 20 m larger than the foundation pit no. I on both sides. In the numerical simulation, the asymmetric load is applied prior to the construction of diaphragm walls, columns, and soil reinforcement. This is to simulate the asymmetric pressure such as the different ground elevations on both sides of the retaining structure, use of building materials or machinery, existing buildings or other structures, traffic loads near the pit, asymmetric excavation sequence, or uneven distribution of soil layers within the depth of the foundation pit. The x in Figure 9 refers to the distance from the asymmetric load to the foundation pit.
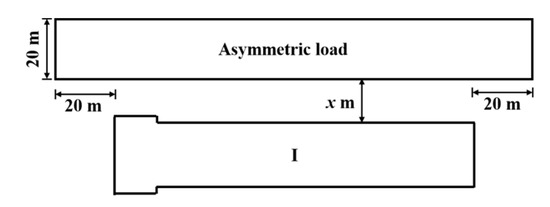
Figure 9.
Foundation pit subjected to asymmetric load.
4.1. Influence of Magnitude of Asymmetric Load
In this analysis, the numerical model and its parameters are the same as that in the calibrated FE model, and the distance from the asymmetric load to the foundation pit is assumed as 15 m. Figure 10 shows the lateral deformations of the diaphragm walls at both sides along the depth direction when the asymmetric load applied after the excavation of the foundation pit is in the range of 15–75 kPa. It shows that the maximum lateral deformation of the diaphragm wall at the loaded side increases with the increase in the asymmetric load value, but the maximum lateral deformation position remains essentially unchanged. On the other hand, for the non-loaded side, the maximum lateral deformation decreases with the increase in the asymmetric load value, but the variations are less obvious than those at the loaded side. Figure 11 shows the maximum lateral deformations of the diaphragm walls at both sides for different magnitudes of the asymmetric load. The maximum lateral deformation at the loaded side increases approximately linearly with the increase in the asymmetric load value, while at the non-loaded side it decreases approximately linearly, with the difference between both sides increasing gradually.
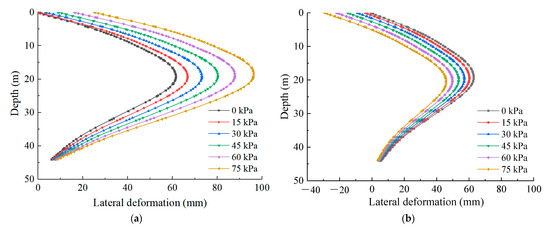
Figure 10.
Influence of different values of asymmetric load on lateral deformations of diaphragm walls after excavation: (a) Lateral deformations of diaphragm wall at loaded side; (b) Lateral deformations of diaphragm wall at non-loaded side.
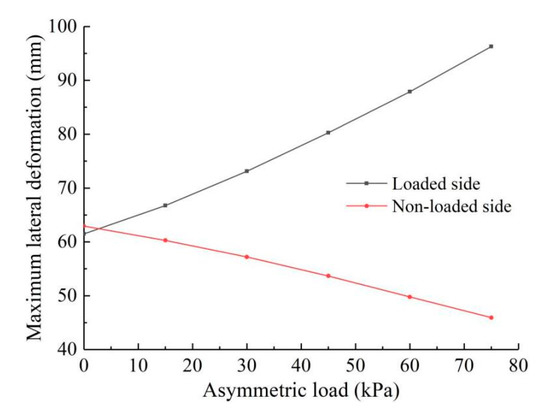
Figure 11.
Maximum lateral deformations of diaphragm walls for different values of asymmetric load.
4.2. Influence of Distance of Asymmetric Load
The deformations of diaphragm walls are analyzed in this section for variable distance between 5–30 m between the asymmetric load of 45 kPa and the edge of diaphragm wall. Figure 12 shows the variation of deformations with depth for the diaphragm walls on both sides of the standard section after excavation. It shows that the lateral deformation of the diaphragm wall at the loaded side decreases with the increase in the distance to the load and the position of the maximum lateral deformation moves gradually down. On the contrary, the lateral deformation of the diaphragm wall at the non-loaded side increases with the increase in the load distance, but the position of the maximum lateral deformation moves slightly up. As shown in Figure 13, the maximum lateral deformation decreases approximately linearly with the increase in the load distance at the loaded side, but it increases approximately linearly at the non-loaded side. The difference between the maximum lateral displacements at the two sides decreases gradually.
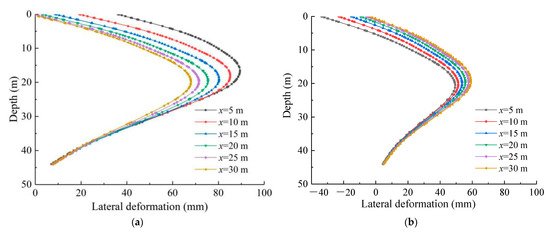
Figure 12.
Influence of different distances of asymmetric load on lateral displacements of diaphragm walls after excavation: (a) Lateral deformations of diaphragm wall at loaded side; (b) Lateral deformations of diaphragm wall at non-loaded side.
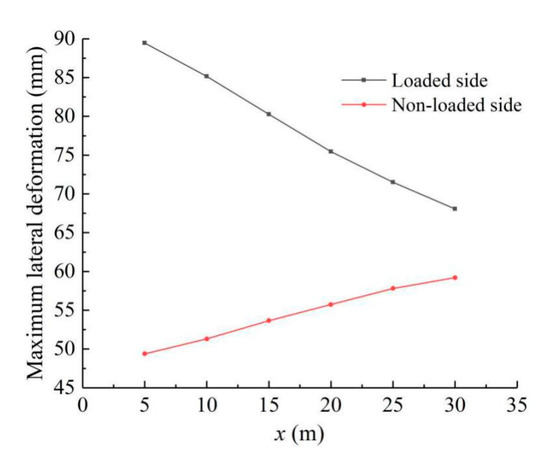
Figure 13.
Maximum lateral deformations of diaphragm wall for different distances of asymmetric load.
4.3. Discussion
The lateral deformation of the diaphragm wall at the loaded side increases with increasing the asymmetric load values, while at the non-loaded side it decreases. For the foundation pit subjected to an asymmetric load, the diaphragm walls at the two sides can only shift to the non-loaded side as a whole due to the large stiffness of support, resulting in different lateral deformations. As a result, the difference in lateral deformations may increase with the increase in the magnitude of the asymmetric load or decrease in the distance from the asymmetric load to the foundation pit. Thus, if the critical load for the loaded side is adopted while designing a foundation pit, the diaphragm wall may be overdesigned, while adopting the critical load for the non-loaded side may lead to underdesign.
5. Lateral Deformation Control in Foundation Pit Subjected to Asymmetric Load
5.1. Overview of Deformation Control Measures
In order to ensure the safety of the foundation pit itself and the surrounding environment, two lateral deformation control methods for the foundation pit subjected to asymmetric loads are investigated, namely, soil reinforcement and stiffness enhancement of the support system. The goal of foundation pit soil reinforcement is to enhance the cohesion and internal friction angle of the soil. The control measures of foundation pit soil consider soil reinforcement in the active and passive pressure zones. The main function of soil improvement in the active pressure zone is to block the transmission path of the surrounding soil displacements. The main approach to soil improvement in the passive pressure zone is to form a space cross-beam system with a firm support, which will effectively limit the rebound deformation of the underlying soil, so as to reduce the displacement of the soil outside the pit. In order to understand the influence of the stiffness of the support system, the relationship between the maximum lateral displacements of the diaphragm walls and their thickness at different sections at the loaded side is investigated.
5.2. Soil Reinforcement in Active Pressure Zone
5.2.1. Numerical Model
In order to study the effect of soil reinforcement in the active pressure zone of the foundation pit on the lateral deformations of the diaphragm wall at the loaded side, an FE model is established first with an asymmetric load of 45 kPa, distance between the load and the edge of the foundation pit of 15 m, width of the reinforced zone of 2 m, length the same as the loaded area, and the reinforcement depth of 5 m from the surface, as shown in Figure 14. The soil reinforcement parameters are shown in Table 3.

Figure 14.
Plan of foundation pit and soil reinforcement.
5.2.2. Influence of Soil Reinforcement Height
Figure 15 shows the variation of the maximum deformation of the diaphragm wall at the loaded side when reinforcement depth is 2–40 m. It can be seen that when the reinforcement depth is less than 14 m, the maximum lateral deformation of the diaphragm wall not only does not decrease, but actually increases. This is because when the reinforced zone depth is small it behaves similarly to a rigid body floating on the surface of the soil underneath. The reinforced zone not only does not prevent the transmission of soil displacements caused by the excavation, but produces a larger rigid extrusion force, which increases the stability of the diaphragm wall. When the depth of reinforcement is about 14 m, the maximum lateral deformation of the diaphragm wall decreases with the increase in reinforcement depth and the reduction rate is the largest when the reinforcement height is in the range of 18–30 m. This is because the soil in this depth range is silty clay, whose fluidity of is large. Reinforcement of this depth can effectively reduce the soil displacements and can therefore reduce the effect of active earth pressure on the diaphragm wall.
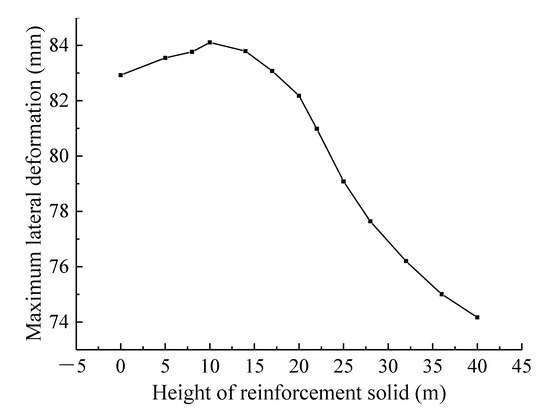
Figure 15.
Influence of reinforcement depth on maximum lateral displacement of diaphragm wall at loaded side.
5.2.3. Influence of Soil Reinforcement Location
The influence of the depth of reinforcement top surface on the maximum lateral deformations of the diaphragm wall is analyzed in this section. The size of reinforcement in this analysis is the same as that in Section 4.2. Figure 16 shows the maximum deformations of the diaphragm wall when the depth of the top surface of reinforced concrete and the ground surface is 0–36 m. It can be seen from the figure that the curve has a V-shape and the maximum lateral deformation of the diaphragm wall is the smallest when the depth of the reinforcement is about 22 m, indicating that the reinforcement effect here is the most beneficial. This is because the deformation of the diaphragm wall at this depth is the largest and the effect of the active earth pressure outside the pit on the diaphragm wall is the most obvious.
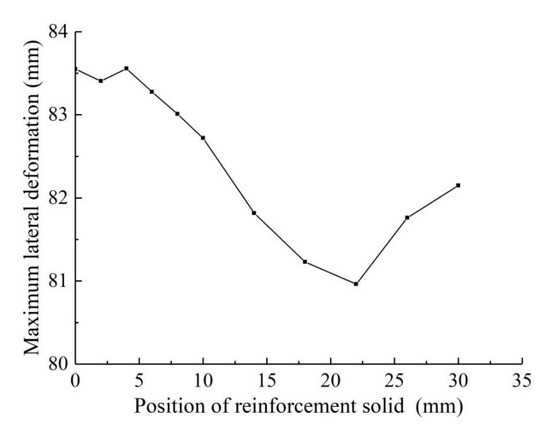
Figure 16.
Influence of reinforcement top surface depth on maximum lateral displacement of diaphragm wall at loaded side.
5.3. Soil Reinforcement in Passive Pressure Zone
5.3.1. Numerical Model
High-pressure rotary jet piles are used for grid reinforcement within 5 m below the original design end pit bottom and 3 m below the standard section pit bottom in this analysis, as shown in Figure 17. In this study, h1 and b1 near the diaphragm wall at the loaded side are defined as the height and width of the loaded side soil reinforcement. Similarly, h2 and b2 are defined as the height and width of the non-loaded side soil reinforcement. Soil reinforcement in the passive pressure zone can reduce the impact of soil displacement transfer on the retaining structure, thus this section explores its effects.
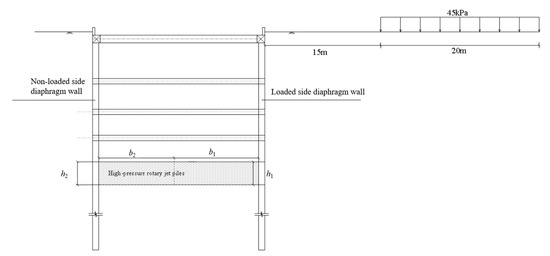
Figure 17.
Soil reinforcement in passive pressure zone along standard section.
5.3.2. Influence of Soil Reinforcement Area
Figure 18 shows the maximum lateral deformation of diaphragm wall at the loaded side when the height of reinforcement is h1 = h2 = 3–15 m. It can be seen that the maximum lateral deformation of the diaphragm wall decreases with the increase in the reinforcement zone size. When the reinforcement depth is greater than 9 m (i.e., 54% of the excavation depth), the maximum lateral deformation of the diaphragm wall remains essentially unchanged, i.e., the lateral deformation of the diaphragm wall cannot be reduced by increasing the reinforced zone depth. Therefore, the reinforcement depth of 9 m is adopted herein.
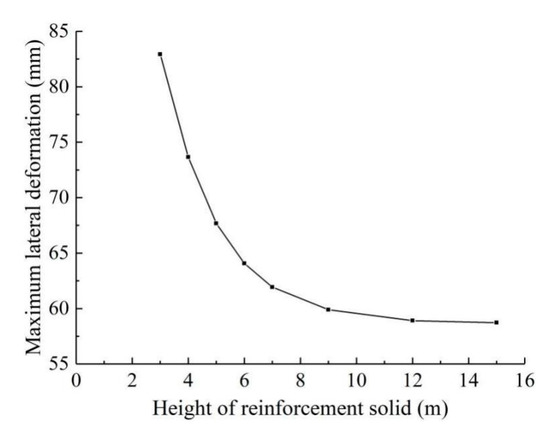
Figure 18.
Influence of soil reinforcement height on maximum lateral deformation of diaphragm wall at loaded side.
5.3.3. Influence of Height of Solid Zone on Loaded Side
Figure 19 shows the maximum lateral deformation of diaphragm wall at the loaded side when b1 = b2, h2 = 3 m, and h1 = 3–15 m. It can be seen that the maximum lateral deformation of the diaphragm wall remains essentially unchanged when the height of the loaded side soil reinforcement is larger than 12 m. Compared to Figure 17 and Figure 18, it can be seen that when h1 = h2 = 12 m, the maximum lateral deformation of diaphragm wall is 58.9 mm, and when h1 = 12 m and h2 = 3 m, the maximum lateral deformation of diaphragm wall is 54.2 mm, which indicates that non-equal depth reinforcement is better than equal depth reinforcement in controlling deformation differences, while also saving costs.
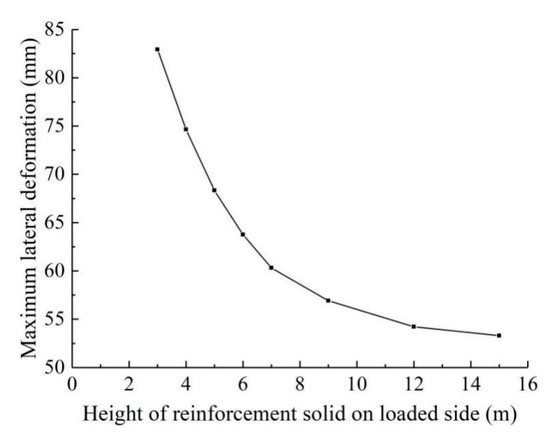
Figure 19.
Influence of soil reinforcement height h1 on maximum lateral deformation of diaphragm wall at loaded side.
5.3.4. Influence of Width of Solid Zone on Loaded Side
Figure 20 shows the maximum lateral deformation of the diaphragm wall at loaded side when h1 = 9 m, h2 = 3 m, and b1 = 0–22 m. It can be seen that the curve first decreases and then increases. When the width of the solid zone formed at the loaded side is 17 m, the maximum lateral deformation of the diaphragm wall is minimum, because the equal depth reinforcement is not necessarily better than the unequal depth reinforcement. In a way, reducing the reinforcement range added at the non-loaded side can be considered as forming the opposing load at that side, which causes an overall foundation pit shift to the loaded side, thus reducing the maximum lateral deformation of the diaphragm wall at the loaded side.
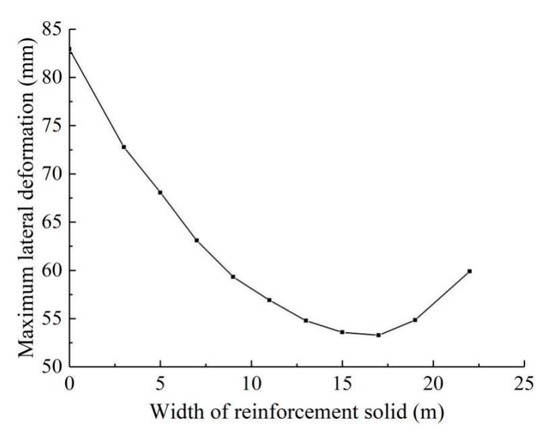
Figure 20.
Influence of reinforcement width on maximum lateral deformation of diaphragm wall at loaded side.
5.4. Influence of the Thickness of Diaphragm Wall at Loaded Side
The original design thickness of the diaphragm wall in this project is 0.80 m and the remaining specifications remain unchanged in this analysis. The lateral deformations of diaphragm wall at the loaded side can be reduced by changing the thickness of that diaphragm wall. The considered thickness range is 0.6–2.0 m and the calculation results are shown in Figure 21. It can be seen that the maximum lateral displacement of the diaphragm wall at the loaded side decreases steadily with the increase in the thickness of the diaphragm wall and there is no sign of stabilization, which indicates that increasing the thickness of the diaphragm wall at the loaded side can effectively inhibit the maximum lateral deformation of the diaphragm wall at this side.
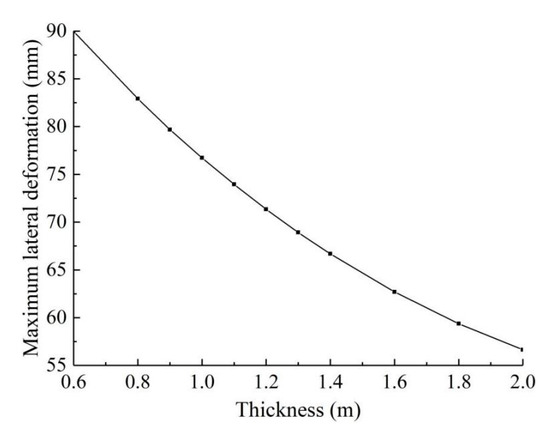
Figure 21.
Maximum deformation of diaphragm walls at loaded side with different thickness.
6. Conclusions
By using the FE method, the deformation characteristics of a foundation pit subjected to asymmetric loads is investigated. The influence of active and passive pressure zone soil reinforcement, and increasing the thickness of diaphragm wall at the loaded side on the maximum lateral displacement of diaphragm wall retaining structure of foundation pit is also systematically analyzed. The following conclusions can be drawn from this study:
(1) When subjected to an asymmetric load, the entire foundation pit moves towards the non-loaded side and the difference in lateral deformations between the two sides of the diaphragm wall are large. Moreover, the larger the asymmetric load or the closer the distance between the asymmetric load and the foundation pit, the larger the difference in lateral deformations of the diaphragm walls.
(2) The soil reinforcement in the active pressure zone should be of sufficient depth. It is also most efficient to control the deformations of the diaphragm walls by applying the reinforcement at the position with large fluidity and the maximum lateral deformation of the diaphragm wall.
(3) The soil reinforcement in the passive pressure zone at the bottom of the foundation pit should be arranged at different heights and the optimal performance can be obtained by controlling the width of the reinforcement zone on both sides.
(4) By increasing the thickness of the diaphragm wall at the loaded side, the maximum lateral deformation of the diaphragm wall can be effectively reduced.
Author Contributions
Conceptualization, methodology, software W.L.; original draft preparation, K.W.; data curation, H.S.; guidance, review and revision, H.D.; translation, editing and review, X.P.; validation, B.H. All authors have read and agreed to the published version of the manuscript.
Funding
The financial support of Zhejiang Provincial Natural Science Foundation of China (LQ20E080022, LQ21E090002), Natural Science Foundation of China (52009122) and General Research Project of Zhejiang Provincial Department of Education (Y201941345) is acknowledged.
Institutional Review Board Statement
Not applicable.
Informed Consent Statement
Not applicable.
Data Availability Statement
Not applicable.
Acknowledgments
The authors would also like to express their gratitude to EditSprings (https://www.editsprings.com/ accessed on 20 February 2021) for the expert linguistic services provided.
Conflicts of Interest
The authors declare no conflict of interest.
References
- Ding, Z.; Jin, J.K.; Han, T.C. Analysis of the zoning excavation monitoring data of a narrow and deep foundation pit in a soft soil area. J. Geophys. Eng. 2018, 15, 1231–1242. [Google Scholar] [CrossRef]
- Zeng, F.Y.; Zhang, Z.J.; Wang, J.H.; Li, M.G. Observed performance of two adjacent and concurrently excavated deep foundation pits in soft clay. J. Perform. Constr. Facil. 2018, 32, 04018040. [Google Scholar] [CrossRef]
- Elbaz, K.; Shen, S.L.; Tan, Y.; Cheng, J.W.C. Investigation into performance of deep excavation in sand covered karst: A case report. Soils Found. 2018, 58, 1–8. [Google Scholar] [CrossRef]
- Leung, E.H.Y.; Ng, C.W.W. Wall and ground movements associated with deep excavations supported by cast in situ wall in mixed ground conditions. J. Geotech. Geoenvironmental. Eng. 2007, 127, 129–143. [Google Scholar] [CrossRef]
- Seo, M.W.; Olson, S.M.; Yang, K.S.; Kim, M.M. Sequential analysis of ground movements at three deep excavations with mixed ground profiles. J. Geotech. Geoenvironmental. Eng. 2010, 136, 656–668. [Google Scholar] [CrossRef]
- Long, M.; Menkiti, C.; Skipper, J.; Brangan, C.; Looby, M. Retaining wall behaviour in Dublin’s estuarine deposits, Ireland. Geotechnical. Eng. 2012, 165, 351–365. [Google Scholar] [CrossRef]
- Mangushev, R.A.; Osokin, A.I.; Garnyk, L.V. Experience in preserving adjacent buildings during excavation of large foundation pits under conditions of dense development. Soil Mech. Found. Eng. 2016, 53, 291–297. [Google Scholar] [CrossRef]
- Finno, R.J.; Arboleda-Monsalve, L.G.; Sarabia, F. Observed performance of the one museum park west excavation. J. Geotech. Geoenvironmental. Eng. 2016, 141, 04014078. [Google Scholar] [CrossRef]
- Oka, F.; Takada, N.; Shimono, K.; Higo, Y.; Kimoto, S. A largescale excavation in soft holocene deposit and its elastoviscoplastic analysis. Acta Geotech. 2016, 11, 625–642. [Google Scholar] [CrossRef]
- Zhang, J.; Xie, R.; Zhang, H. Mechanical response analysis of the buried pipeline due to adjacent foundation pit excavation. Tunn. Undergr. Space Technol. 2018, 78, 135–145. [Google Scholar] [CrossRef]
- Zhou, H.Z.; Zheng, G.; He, X.P.; Wang, E.Y.; Ma, S.K. Numerical modelling of retaining structure displacements in multi-bench retained excavations. Acta Geotech. 2020, 15, 2691–2703. [Google Scholar] [CrossRef]
- Lim, A.; Ou, C.Y. Performance and three-dimensional analyses of a wide excavation in soft soil with strut-free retaining system. Int. J. Geomech. 2018, 18, 05018007. [Google Scholar] [CrossRef]
- Hung, N.K.; Phienwej, N. Practice and experience in deep excavations in soft soil of Ho Chi Minh City, Vietnam. KSCE J. Civ. Eng. 2016, 20, 2221–2234. [Google Scholar] [CrossRef]
- Voottipruex, P.; Jamsawang, P.; Sukontasukkul, P.; Jongpradist, P.; Chindaprasirt, P. Performances of sdcm and dcm walls under deep excavation in soft clay: Field tests and 3D simulations. Soils Found. 2019, 59, 1728–1739. [Google Scholar] [CrossRef]
- Schwamb, T.; Soga, K. Numerical modelling of a deep circular excavation at Abbey Mills in London. Géotechnique 2015, 65, 604–619. [Google Scholar] [CrossRef]
- Houhou, M.N.; Emeriault, F.; Belounar, A. Three-dimensional numerical back-analysis of a monitored deep excavation retained by strutted diaphragm walls. Tunn. Undergr. Space Technol. 2019, 83, 153–164. [Google Scholar] [CrossRef]
- Ng, C.W.W.; Shi, J.W.; Hong, Y. Three-dimensional centrifuge modeling of basement excavation effects on an existing tunnel in dry sand. Can. Geotech. J. 2013, 50, 874–888. [Google Scholar] [CrossRef]
- Ou, X.; Zhang, X.M.; Fu, J.Y.; Zhang, C.; Feng, H. Cause investigation of large deformation of a deep excavation support system subjected to unsymmetrical surface loading. Eng. Fail. Anal. 2020, 107, 104202. [Google Scholar] [CrossRef]
- Guo, P.P.; Gong, X.N.; Wang, Y.X. Displacement and force analyses of braced structure of deep excavation considering unsymmetrical surcharge effect. Comput. Geotech. 2019, 113, 103102. [Google Scholar] [CrossRef]
- Rashidi, F.; Shahir, H. Numerical investigation of anchored soldier pile wall performance in the presence of surcharge. Int. J. Geotech. Eng. 2019, 13, 162–171. [Google Scholar] [CrossRef]
- Liu, S.H.; Yang, J.S.; Liu, W.Y.; Wang, J.H. Mechanical and deformation properties of deep foundation pit supporting system subjected to asymmetric loadings. In New Prospects in Geotechnical Engineering Aspects of Civil Infrastructures. GeoChina 2018. Sustainable Civil Infrastructures; Khabbaz, H., Youn, H., Bouassida, M., Eds.; Springer: Cham, Switzerland, 2018. [Google Scholar]
- Chen, R.P.; Meng, F.Y.; Li, Z.C.; Ye, Y.H.; Ye, J.N. Investigation of response of metro tunnels due to adjacent large excavation and protective measures in soft soils. Tunn. Undergr. Space Technol. 2016, 58, 224–235. [Google Scholar] [CrossRef]
- Zhang, W.G.; Li, Y.Q.; Goh, A.T.C.; Zhang, R.H. Numerical study of the performance of jet grout piles for braced excavations in soft clay. Comput. Geotech. 2020, 124, 103631. [Google Scholar] [CrossRef]
- Wang, Z.F.; Shen, S.L.; Ho, C.E.; Kim, Y.H. Investigation of field-installation effects of horizontal twin-jet grouting in shanghai soft soil deposits. Can. Geotech. J. 2013, 50, 288–297. [Google Scholar] [CrossRef]
- Wang, W.D.; Wang, J.H.; Li, Q.; Xu, Z.H. Design and performance of large excavations for shanghai hongqiao international airport transport hub using combined retaining structures. J. Aerosp. Eng. 2014, 28, A4014002. [Google Scholar] [CrossRef]
- Hsieh, P.G.; Ou, C.Y. Simplified approach to estimate the maximum wall deflection for deep excavations with cross walls in clay under the undrained condition. Acta Geotech. 2016, 11, 177–189. [Google Scholar] [CrossRef]
Publisher’s Note: MDPI stays neutral with regard to jurisdictional claims in published maps and institutional affiliations. |
© 2021 by the authors. Licensee MDPI, Basel, Switzerland. This article is an open access article distributed under the terms and conditions of the Creative Commons Attribution (CC BY) license (http://creativecommons.org/licenses/by/4.0/).