You are currently viewing a new version of our website. To view the old version click .
Symmetry
  • Article
  • Open Access

2 November 2021

Categorizing Diseases from Leaf Images Using a Hybrid Learning Model

,
,
,
,
,
and
1
Department of Information Technology, Sri Venkateswara College of Engineering, Chennai 602117, India
2
Department of Electrical and Electronics Engineering, Sri Venkateswara College of Engineering, Chennai 602117, India
3
Department of Electrical Engineering, College of Electronics and Information Engineering, Sejong University, 209 Neungdong-ro, Gwangjin-gu, Seoul 05006, Korea
4
Department of Electrical and Computer Engineering, University of Ottawa, Ottawa, ON K1N 6N5, Canada

Abstract

Plant diseases pose a severe threat to crop yield. This necessitates the rapid identification of diseases affecting various crops using modern technologies. Many researchers have developed solutions to the problem of identifying plant diseases, but it is still considered a critical issue due to the lack of infrastructure in many parts of the world. This paper focuses on detecting and classifying diseases present in the leaf images by adopting a hybrid learning model. The proposed hybrid model uses k-means clustering for detecting the disease area from the leaf and a Convolutional Neural Network (CNN) for classifying the type of disease based on comparison between sampled and testing images. The images of leaves under consideration may be symmetrical or asymmetrical in shape. In the proposed methodology, the images of various leaves from diseased plants were first pre-processed to filter out the noise present to get an enhanced image. This improved image enabled detection of minute disease-affected regions. The infected areas were then segmented using k-means clustering algorithm that locates only the infected (diseased) areas by masking the leaves’ green (healthy) regions. The grey level co-occurrence matrix (GLCM) methodology was used to fetch the necessary features from the affected portions. Since the number of fetched features was insufficient, more synthesized features were included, which were then given as input to CNN for training. Finally, the proposed hybrid model was trained and tested using the leaf disease dataset available in the UCI machine learning repository to examine the characteristics between trained and tested images. The hybrid model proposed in this paper can detect and classify different types of diseases affecting different plants with a mean classification accuracy of 92.6%. To illustrate the efficiency of the proposed hybrid model, a comparison was made against the following classification approaches viz., support vector machine, extreme learning machine-based classification, and CNN. The proposed hybrid model was found to be more effective than the other three.

1. Introduction

More money has been spent on the detection and prevention of crop diseases. Often farmers solve this without appropriate scientific and technical knowledge, resulting in deprived yield and also harm to their land’s fertility. In tropical regions, crop damage increases dramatically due to reasons that include environmental situations, minimum expenditure for crop health monitoring, and low revenue. Even though large-scale plant breeders put effort into increasing crop yield, the impact of deprived yield for below-par farmers has been alarming due to lack of resources.
Nowadays, technology is playing a vital role in modernizing agro-based industries and farms. About 70% of the world industries are dependent on farming, either directly or indirectly. Crop diseases have turned into a nightmare, as they significantly reduce yield. It is a tedious task to monitor and identify plant diseases manually at the initial stage. It requires a lot of human resources and often is inefficient. Today’s agriculture sector is modernized using automation technology, which helps to enhance the yield quantity and quality. Modern technology enables farmers to increase crop yield by minimizing crop damage due to environmental conditions, thereby, improving the farmers’ revenue. Recent developments in image processing offer methods and solutions to mitigate some of the problems faced in agriculture. The agricultural sector employs image processing and computer vision techniques for a variety of reasons—viz., to detect diseased leaves, stems, and fruits; detect areas affected by diseases; and find the shape and color of affected areas. This paper focuses on creating a fully automated system, using a combination of image processing techniques, to detect diseases on leaves that are symmetric along the midrib and to classify them and display solutions. As a preventive measure, a notification message is sent to the farmers, alerting them about the diseases and possible follow-up actions to minimize the damage. Generally, plant diseases are classified into three categories—viz., bacterial, fungal, and viral, as shown in Figure 1 [1]. This paper focuses on the identification of plant diseases that affect plants on a large scale. Fungi obtain their energy from the plant they live upon and are responsible for significant amounts of damage. A study suggests that about 85% of all plant diseases are caused by fungi [2]. The main contributions of this paper include the following:
Figure 1. Categories of plant diseases.
  • Development of a hybrid learning model that uses a blend of image processing techniques for detecting and classifying leaf diseases.
  • Performance evaluation of the proposed hybrid learning model.
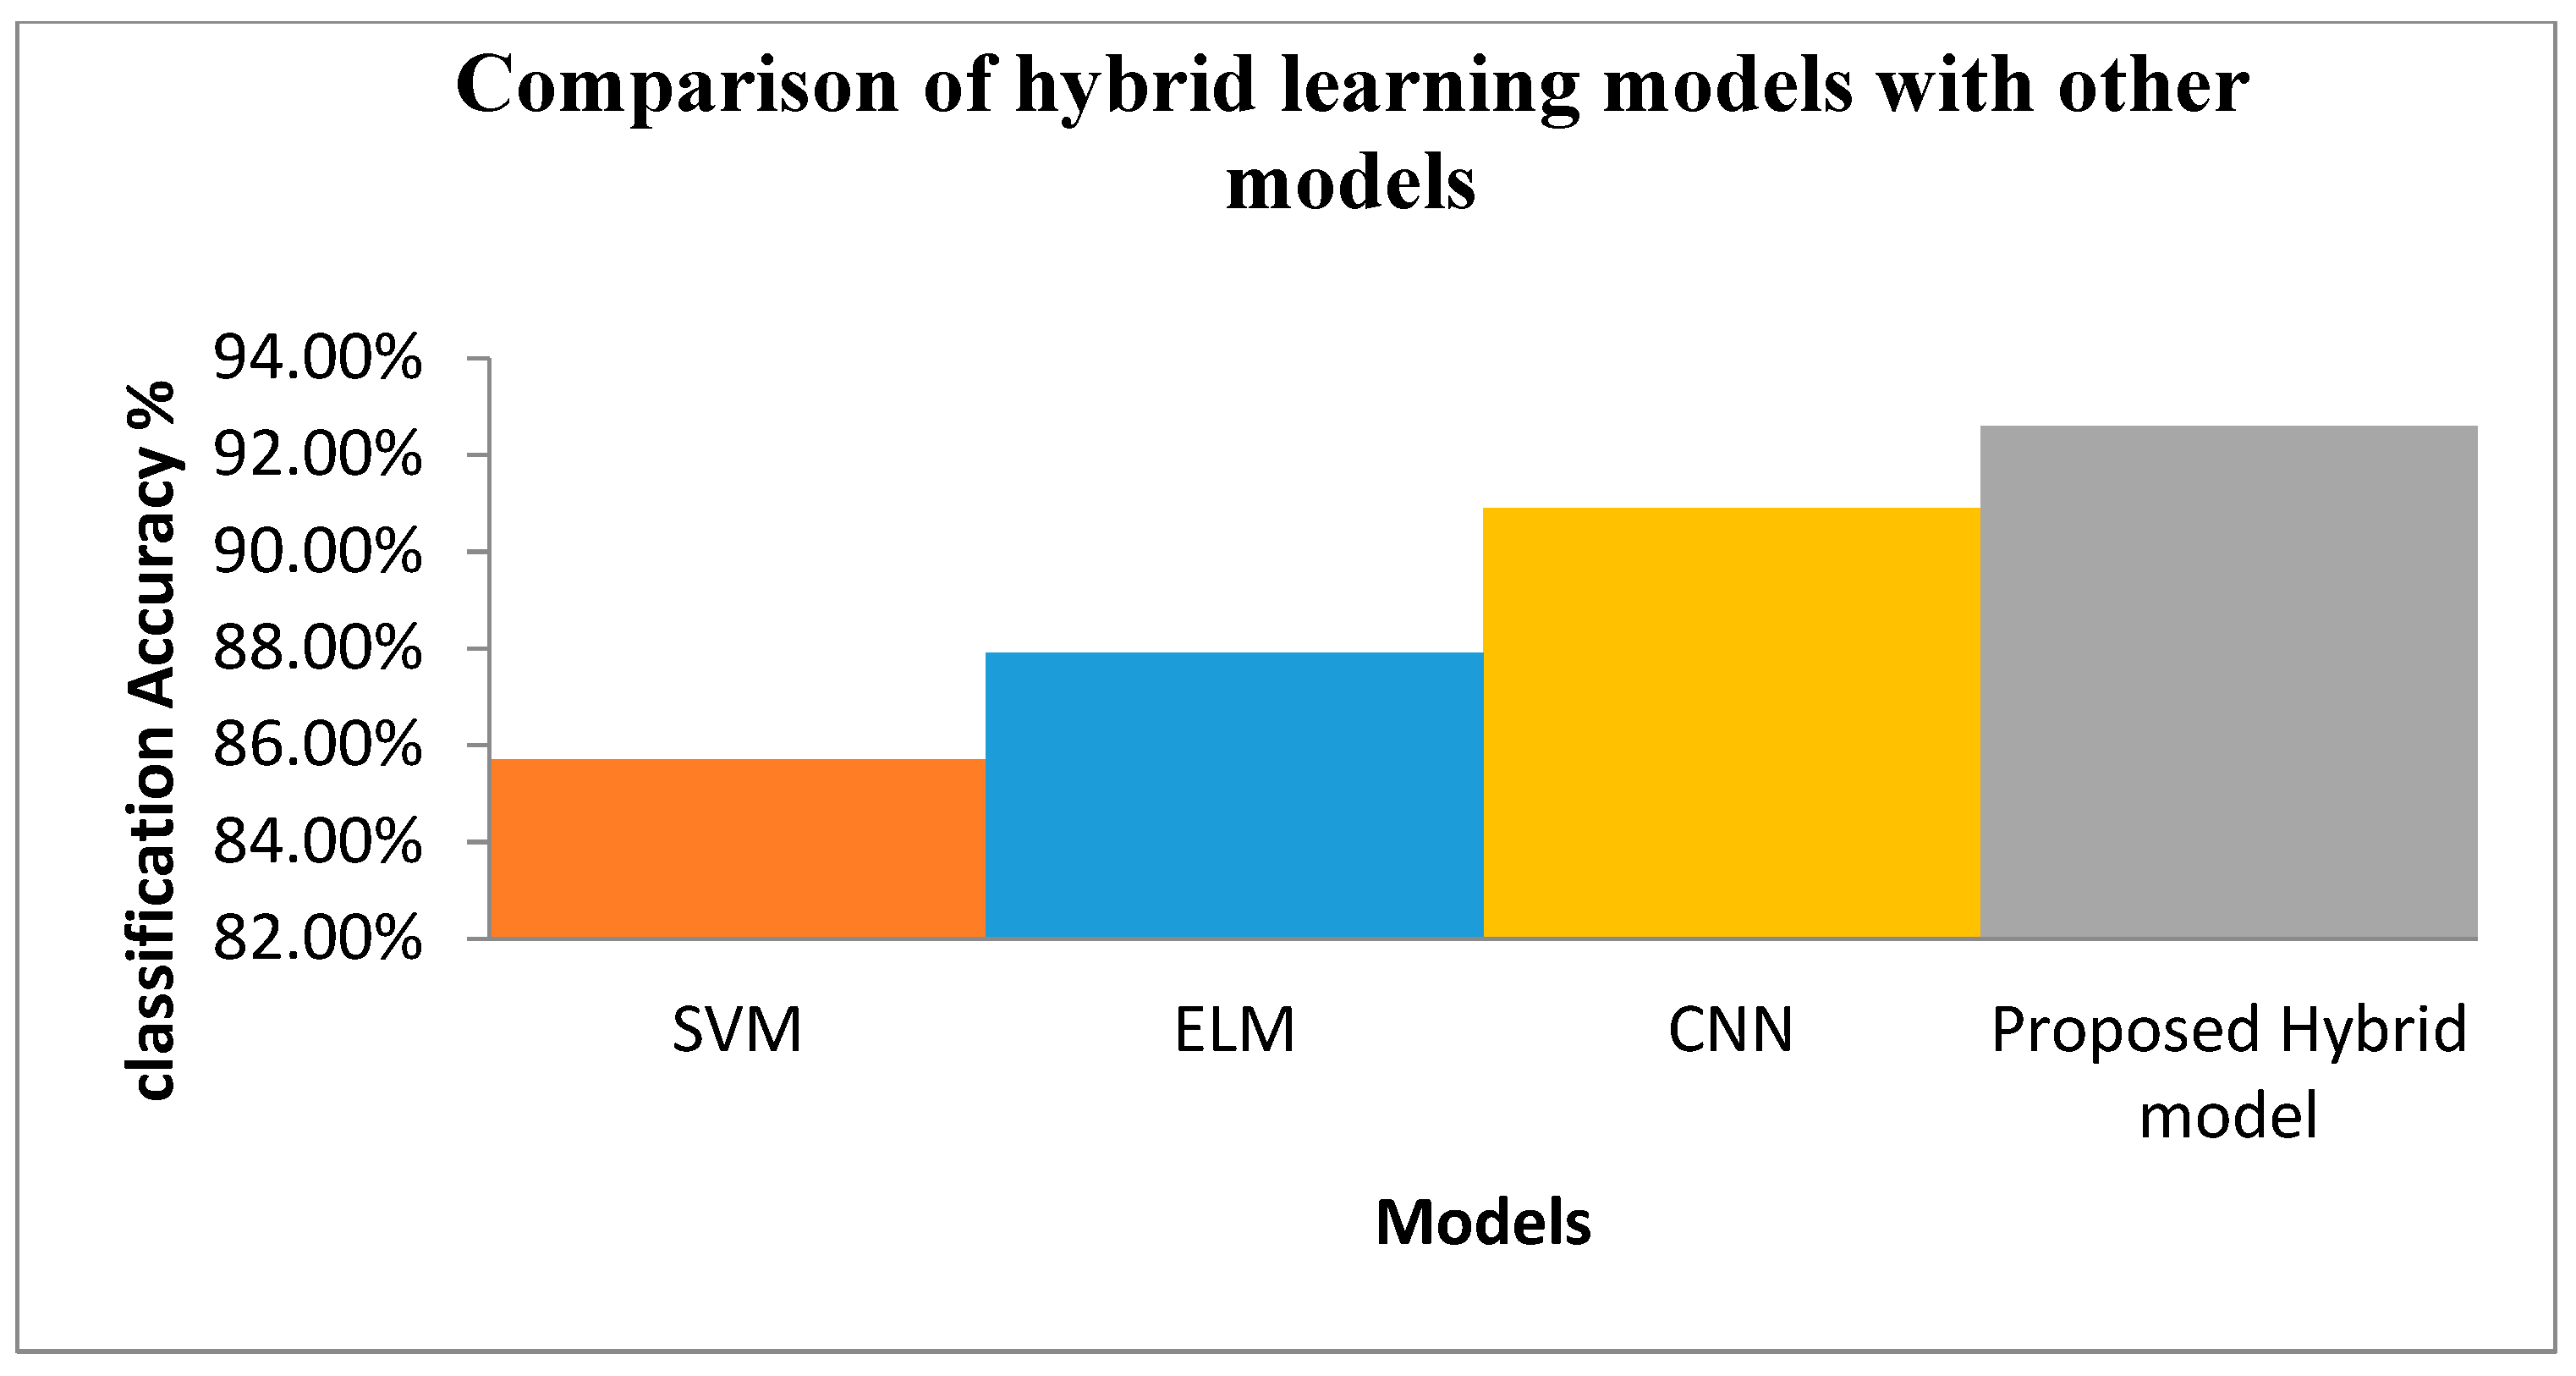
  • Comparison of the hybrid model with support vector machine, extreme learning machine-based classification, and CNN.
Section 2 explains related work. Section 3 elaborates the proposed architecture of the hybrid learning model. Section 4 describes the materials used to assess the proposed model, and the results of the approach. In Section 5, discussion of the performance evaluation and comparison with other methods are presented.

3. Methods

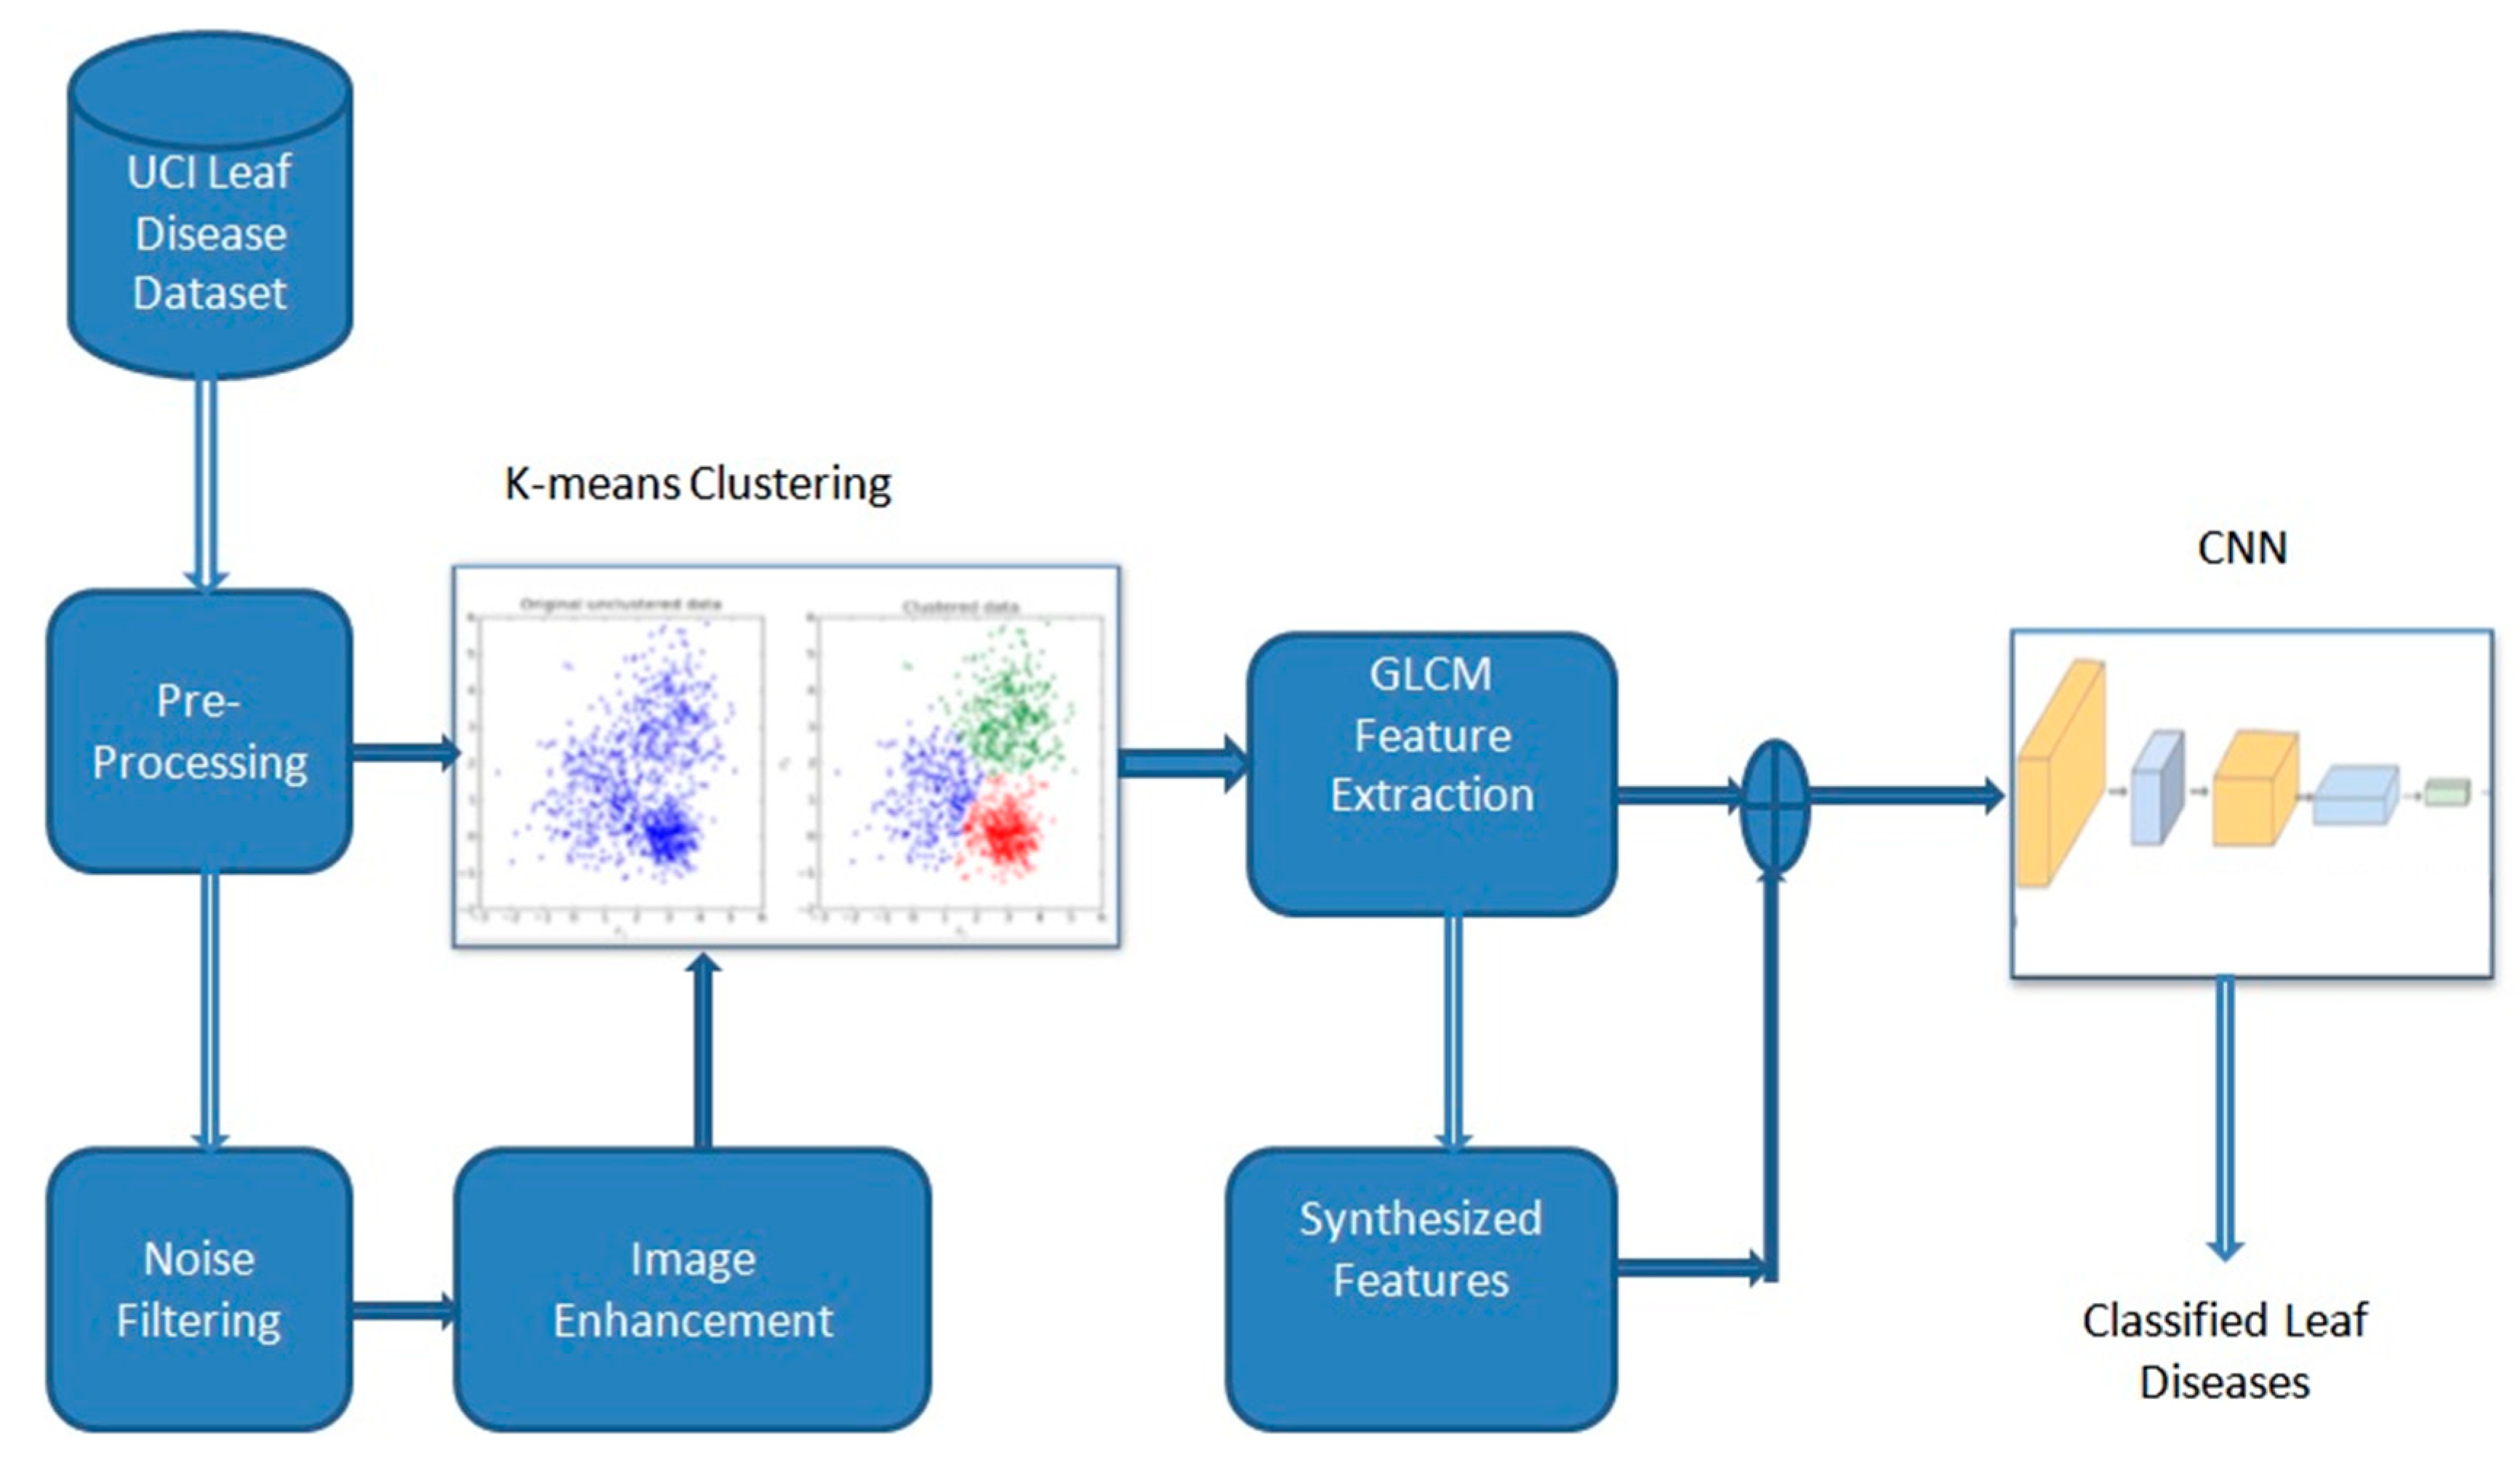
3.1. Hybrid Learning Model for Detecting Leaf Diseases

This work presents a novel hybrid learning model for identifying and categorizing various leaf diseases, as shown in Figure 2. This architecture segregates the affected portion of the leaf by finding the Region Of Interest (ROI) using the k-means clustering algorithm. The texture is a critical feature commonly employed in image classification to help discriminate various classes with analogous spatial characteristics. The textural information offers additional details for classification, which enhances the accuracy [9]. To cater to this requirement, researchers have developed GLCM [10] for textural feature extraction. Intra- and inter-level redundancy among the features is a common concern in image classification. GLCM with different window sizes derives numerous recurrent features. These recurrent features degrade classification accuracy; it necessitates feature selection techniques to choose the most pertinent features for generating efficient learning models [11,12,13]. The conventional and widely employed Principal Component Analysis (PCA) along with Whale Optimization Algorithm (WOA) was proposed by Gadekallu et al. [14] to inspect redundancies in the GLCM feature set and scrutinize only the pertinent features [15,16,17]. Finally, Extreme Learning Machine (ELM), multi-class SVM, and CNN with an Adam optimizer were applied to classify various leaf diseases.
Figure 2. Hybrid learning model for categorizing diseases in leaf.

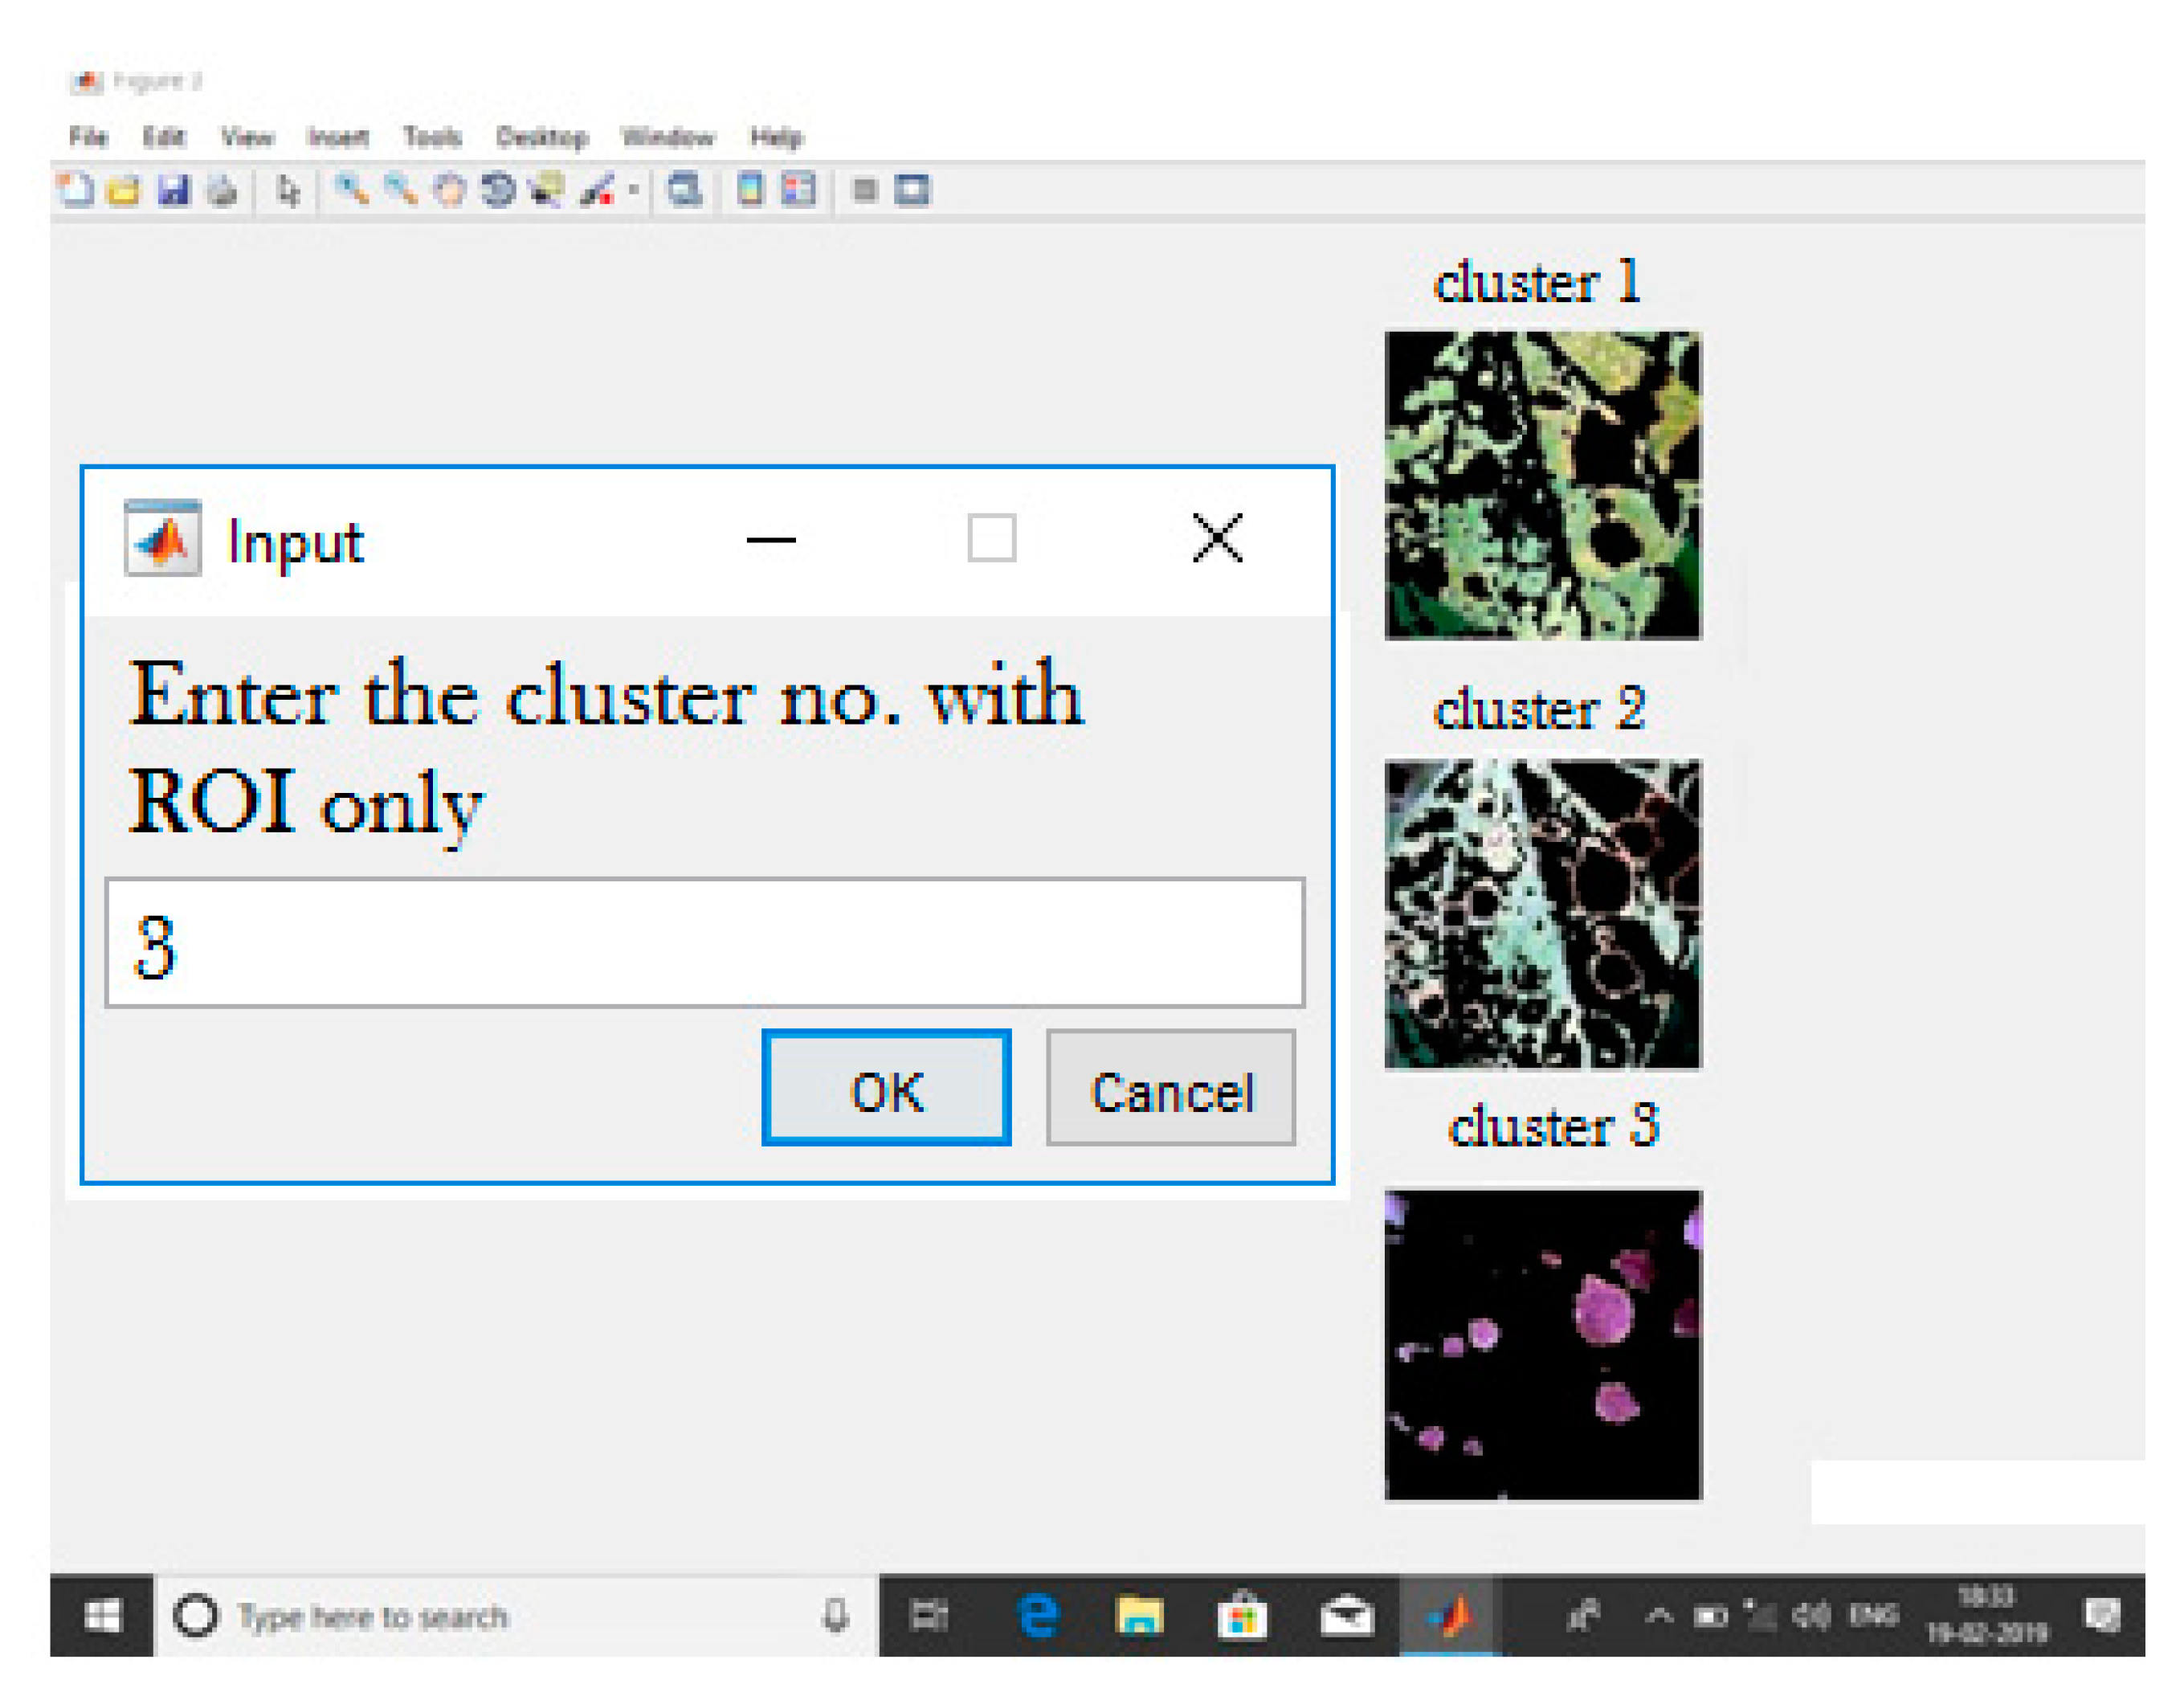
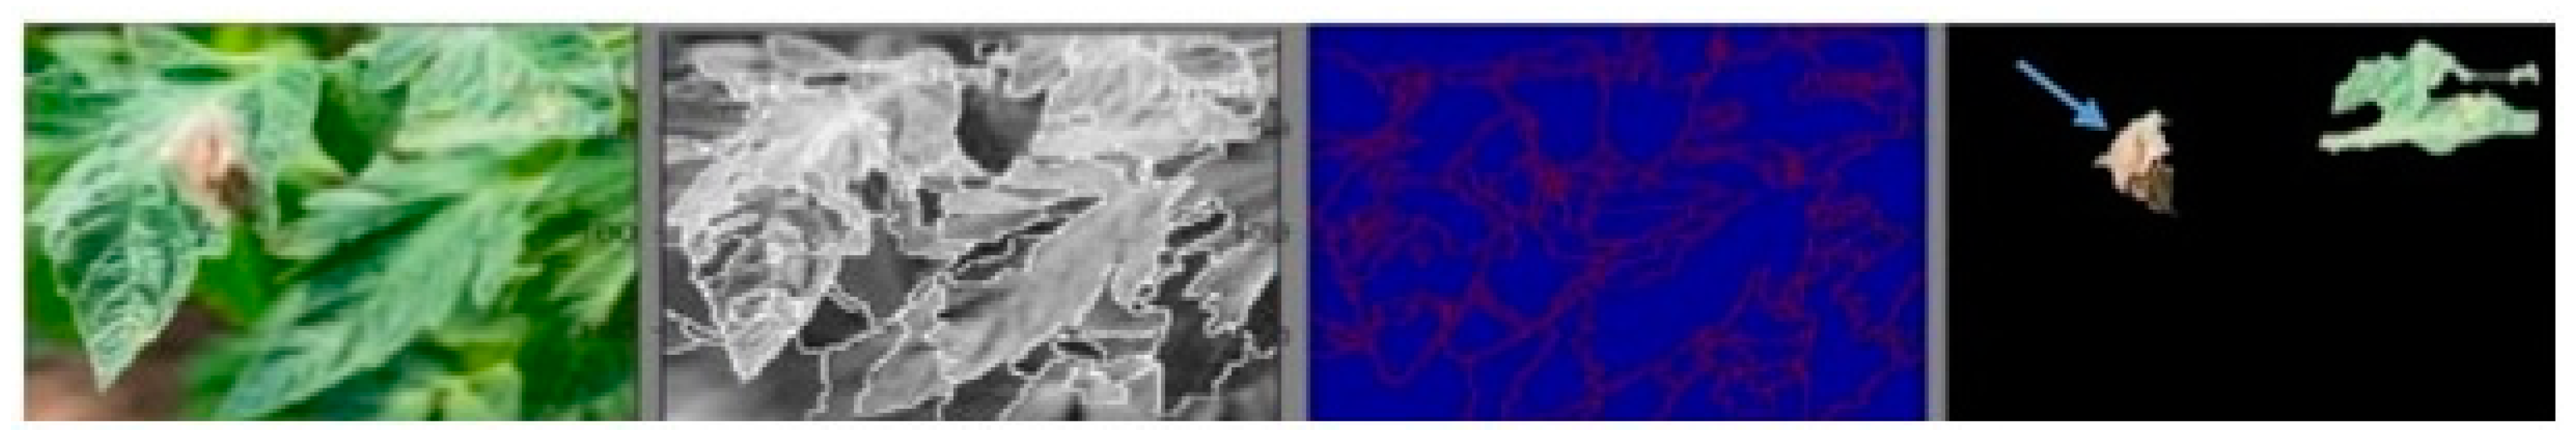
3.2. K-Means Clustering Algorithm for Image Segmentation

The first step in our proposed model was to segregate the disease-affected region and unaffected region in a leaf. Clustering algorithms can be employed to achieve the needed segregation. Many clustering algorithms such as clustering based on density, k-means clustering, fuzzy k-means clustering, hierarchical clustering, and so on are available. As our approach deals with segregating numerous pixels, the k-means clustering algorithm was chosen [18]. K-means clustering was chosen because it enables faster clustering of many variables and constructs tighter clusters.
A pre-processed image was fed into the k-means clustering algorithm, categorizing the leaf into two parts—viz., infected portion and non-infected portion. The k-means clustering method categorizes an image based on the number of feature classes. First, pixels are segmented and then categorized into corresponding feature classes by computing the Euclidean distance values. Based on the calculated feature classes, the image is segmented into various groups containing k types of ROI. When k is 2, it segregates the affected region in one cluster and the unaffected area in another cluster. If k > 2, it can identify the type of disease, and each cluster corresponds to one kind of disease. This segmentation helps to identify the diseased area in a leaf, as shown in Figure 3, and helps to analyze the disease type and severity. Figure 3 shows the formed clusters when k is set to 3.
Figure 3. K-means clustering with k = 3.

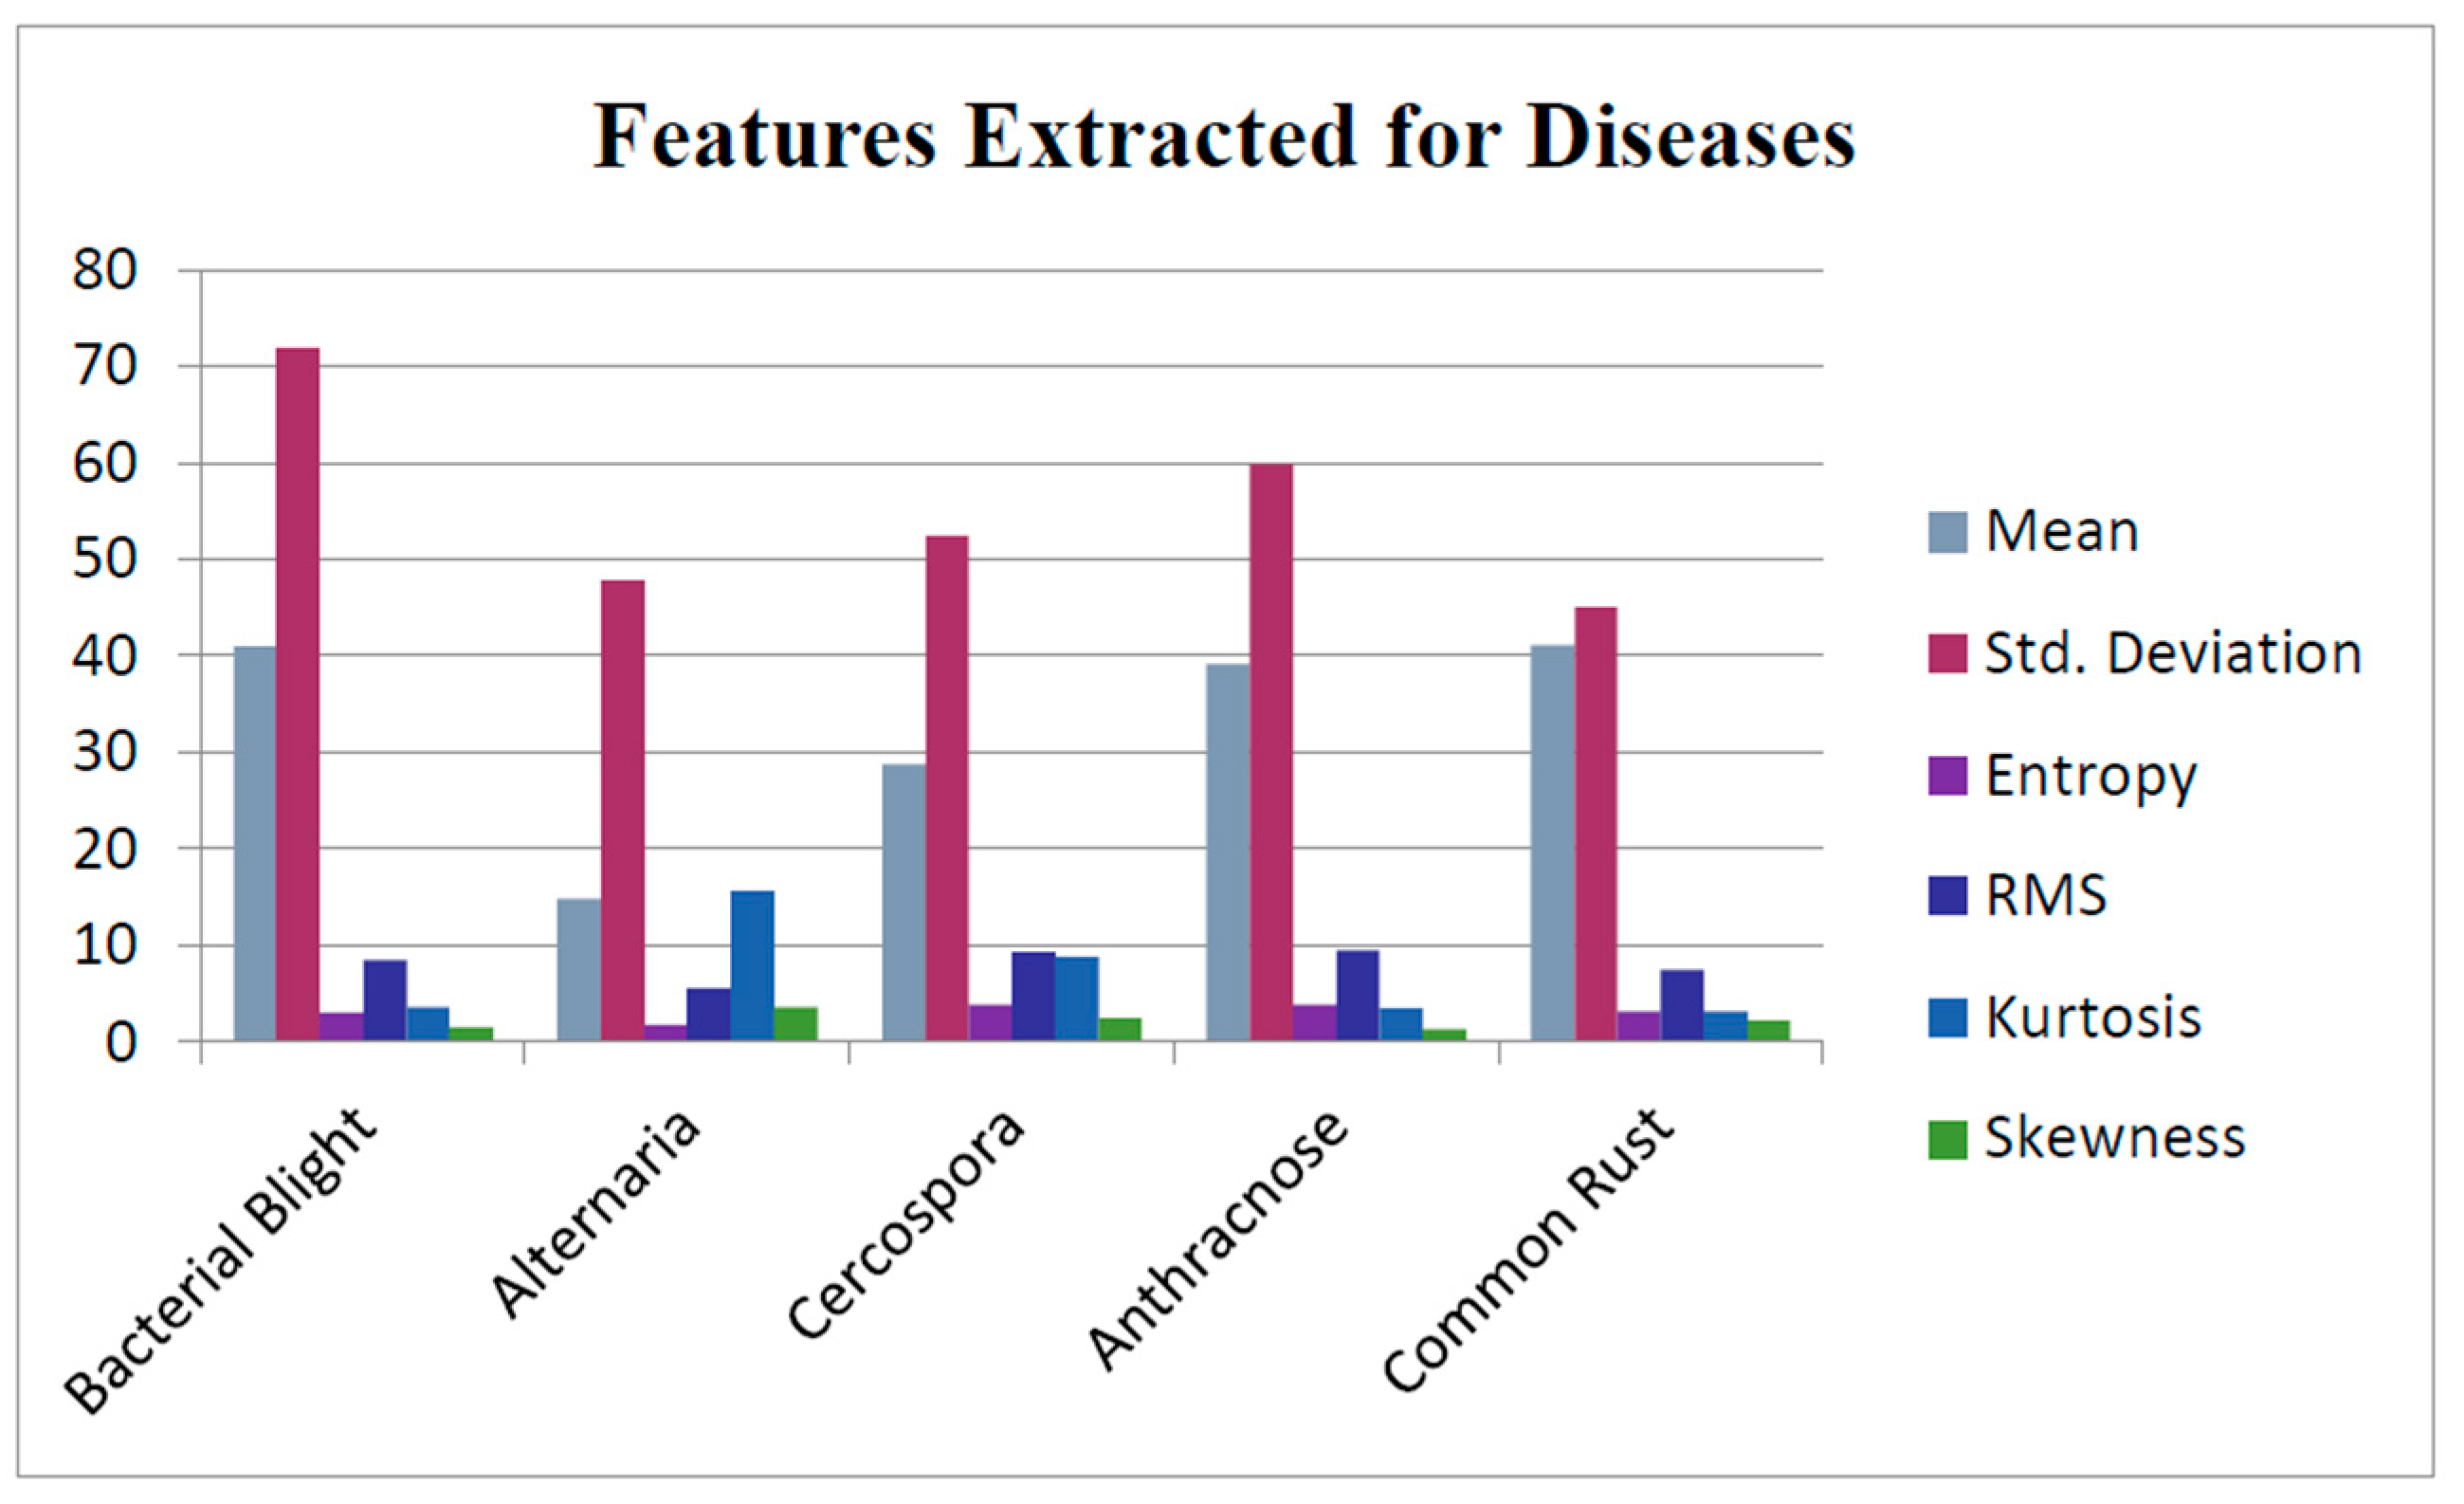
3.3. GLCM Algorithm for Feature Extraction

The features were fetched from the segmented ROI employing the GLCM technique, which uses second-order statistical texture features. For an image I having G gray levels, the GLCM of I is represented in matrix form with G rows and columns. Each element in the matrix P (i, j|x, ∆y) represents the relative frequency in which two pixels with intensities i and j are (∆x, ∆y) apart.Usually, the abovementioned spatial relationship specifies the relationship between the pixel of interest and its neighboring eligible pixels. Nevertheless, there may be other spatial relationships existing between two pixels. An offset array is specified concerning the gray co-matrix function, which generates multiple GLCM. The above-generated offsets express relationships among pixels in varying distance and orientation. For example, the matrix element may also denote the second-order statistical probability values P (i, j|d, ө) for changes between the intensities at a specific distance ‘d’ and at a given orientation ‘ө’. Various features such as contrast, correlation, energy, homogeneity, kurtosis, RMS, mean, variance, standard deviation, and skew are computed from the generated GLCM matrix. Apart from the above-said features that are extracted from the image, one should also consider the moisture level of the leaf as a necessary feature. Typically, the leaves will swell when the amount of water present within the plant exceeds a specific maximum limit.
Similarly, when the amount of water present within the plant is minimal, the leaves will shrink. In these two cases, plants are more prone to disease. Hence, the amount of water present within the plant, i.e., moisture level, is an essential parameter in predicting diseases at the earlier stages. In both scenarios, the boundaries of the leaf characterize the level of moisture, so we used an edge detection algorithm to assess the moisture level in the plant.
Any classification algorithm works well only when it is applied to the essential independent parameters. Therefore, a combination of PCA and WOA was employed in the proposed approach to choose the relevant and optimal features.

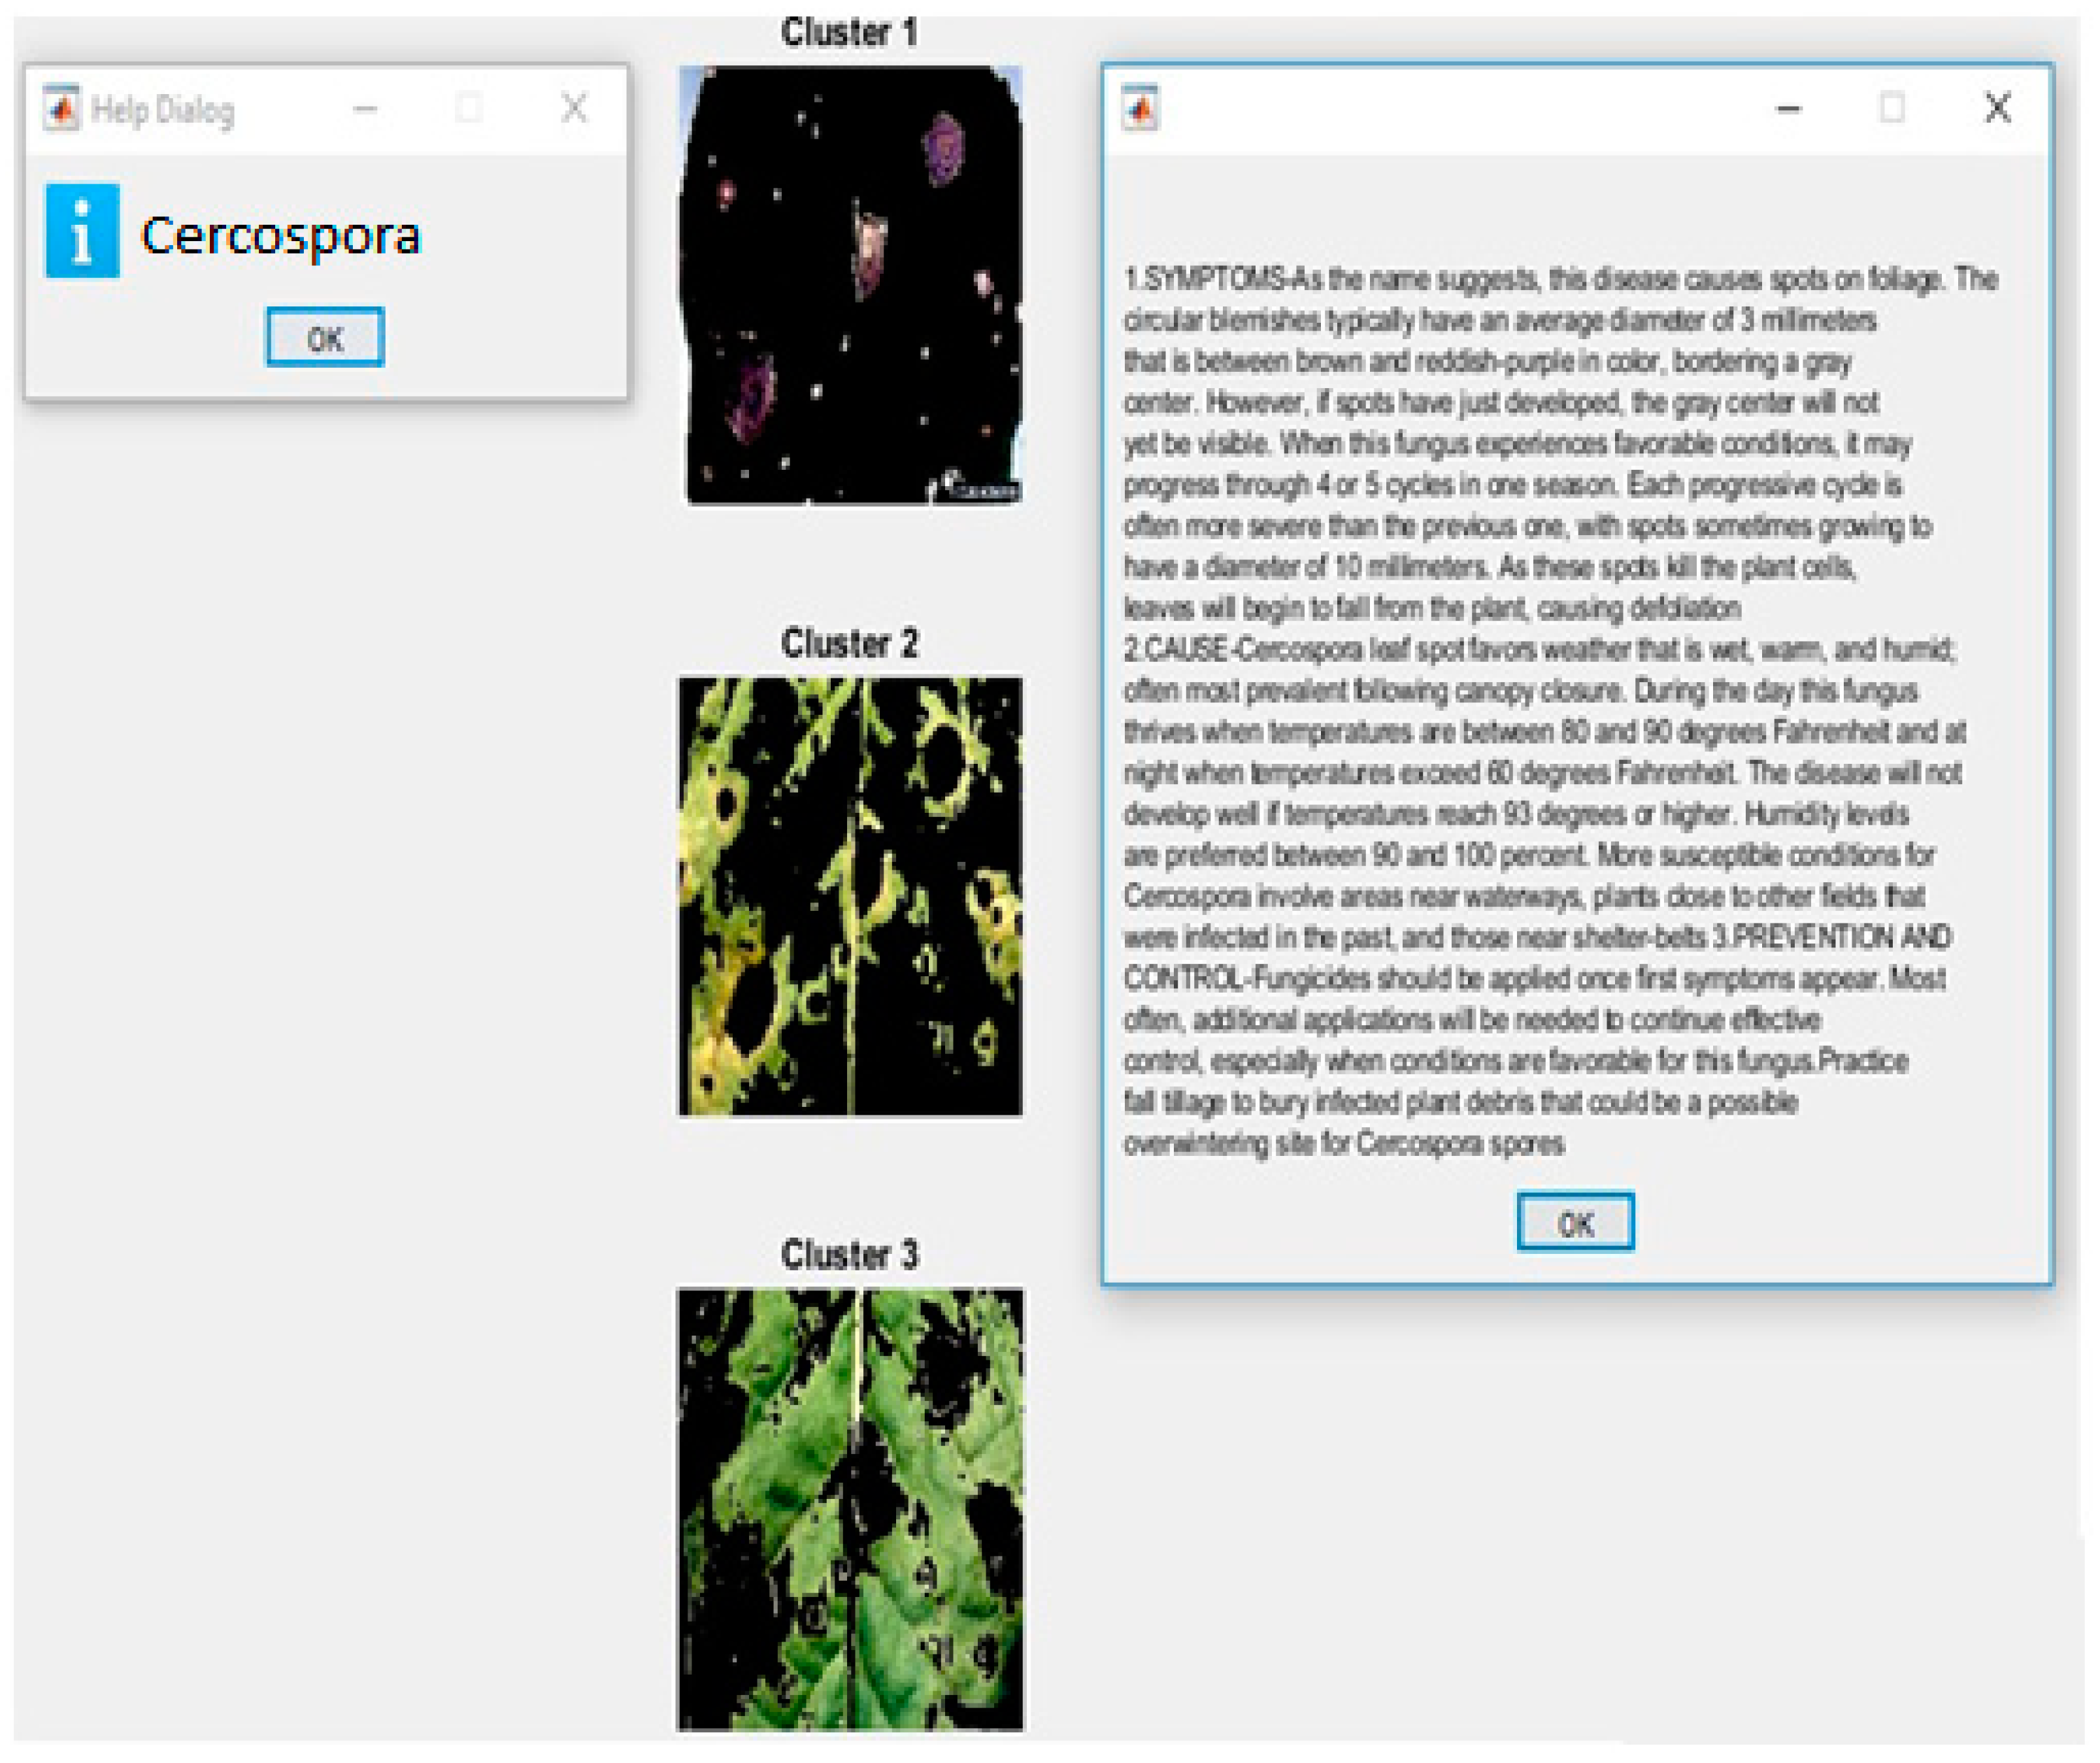
3.4. Classification of Leaf Diseases

The final step was to categorize the disease present in the leaf and assess the severity of the disease. ELM, multi-class SVM and CNN were employed to categorize the disease present in the leaves.

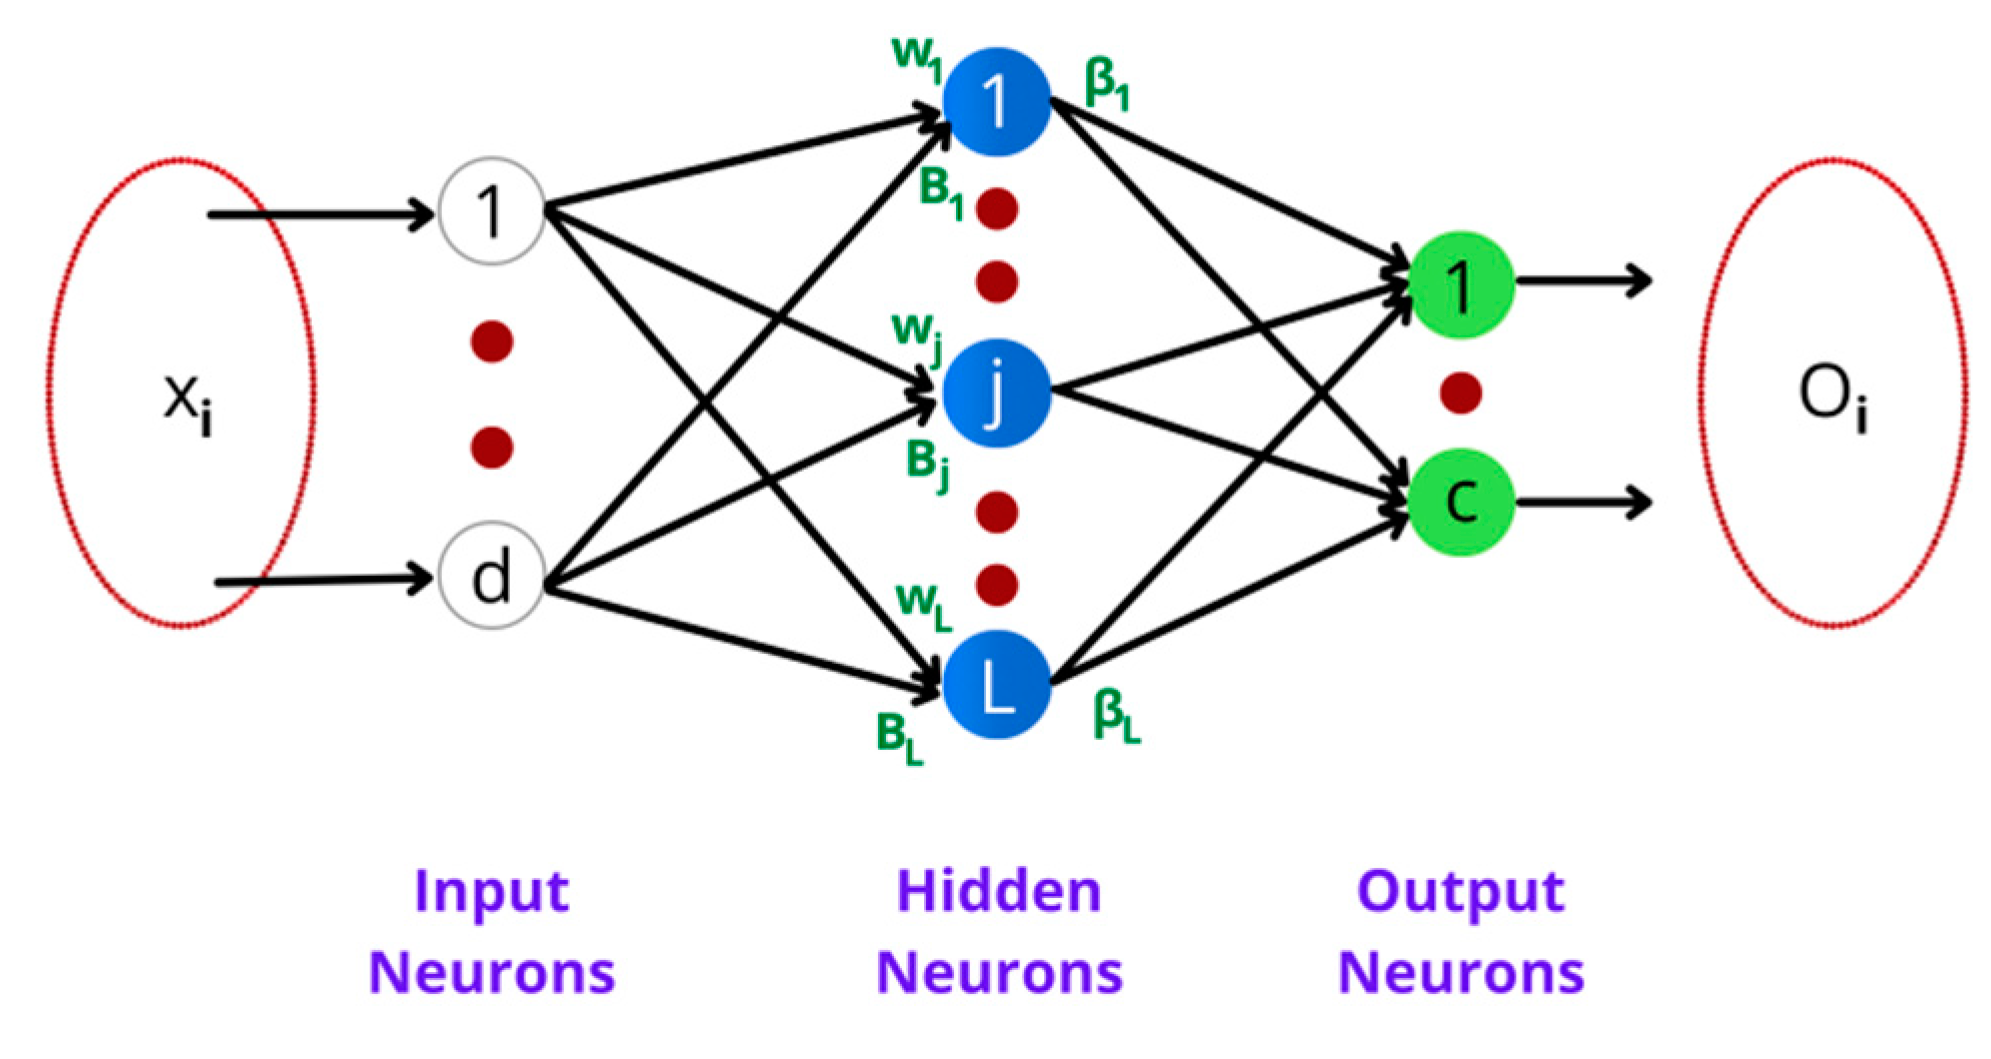
3.4.1. Extreme Learning Machine

ELM is basically a feed forward network where hidden neurons are placed in a hidden central layer, as shown in Figure 4. There are d input vectors that can be classified under c output classes using L hidden neurons. The neurons present in the hidden layer are represented as h(x) = [h1(x), …, hL(x)]. Each hidden neuron performs a nonlinear mapping of features emerging from input neurons to the output neurons using the weight and bias as given in the Equation (1).
j = 1 L β j g ( w j x i + b j ) = t i ,   i = 1 , 2 N .  
where x is the input feature vector, t is the output vector, wj is the amount of contribution of ith input to jth neuron, b is the bias, and β j = [ β 1 , β c ] T . is the weights among the hidden neuron j and the output class c.
Figure 4. Extreme learning machine architecture.

3.4.2. Multi-Class SVM

The second algorithm implemented for classifying the various leaf diseases wasthe multi-class SVM, which is a supervised classification algorithm. At the baseline SVM is a two class classification algorithm where each feature vector is projected onto an n-dimensional space, where the number of dimensions equals the number of features included in the feature vector. Then, a hyperplane is constructed that separates the data points into two classes. N-dimensional hyperplane is suitable only when the data points are distributed in a uniform linear fashion. This necessitates the use of functional kernels in SVM to discriminate the points that is distributed randomly in nonlinear fashion. These functional kernels transform the lower dimensional data points to a higher dimension where the points can be linearly separable. Then, a binary classification process is carried out by constructing a suitable hyperplane that distinguishes the leaf into two classes—viz., normal and diseased. However, our main objective is to identify the type of disease present in the leaf. In this scenario, one-against-all SVM is applied, which has the ability to classify into n classes. This approach iterates through n number of SVM simulations. Each iteration corresponds to a particular class; the SVM model is trained to label that class as correct and the other class as incorrect. The OAA SVM model training is mathematically expressed as given in Equation (2), where x represents the dataset used for training, ( x ) is the functional kernel thattransforms x into a higher dimension, ( w n ) T . denotes the feature vector, and b is a scalar value. The c l a s s   ( x ) . gives the predicted class with higher functional value that is mathematically denoted in Equation (3).
( w 1 ) T   ( x ) + b 1     ( w n ) T ( x ) + b n
c l a s s ( x ) = arg m a x i = 1 n ( ( w n ) T ( x ) + b n )

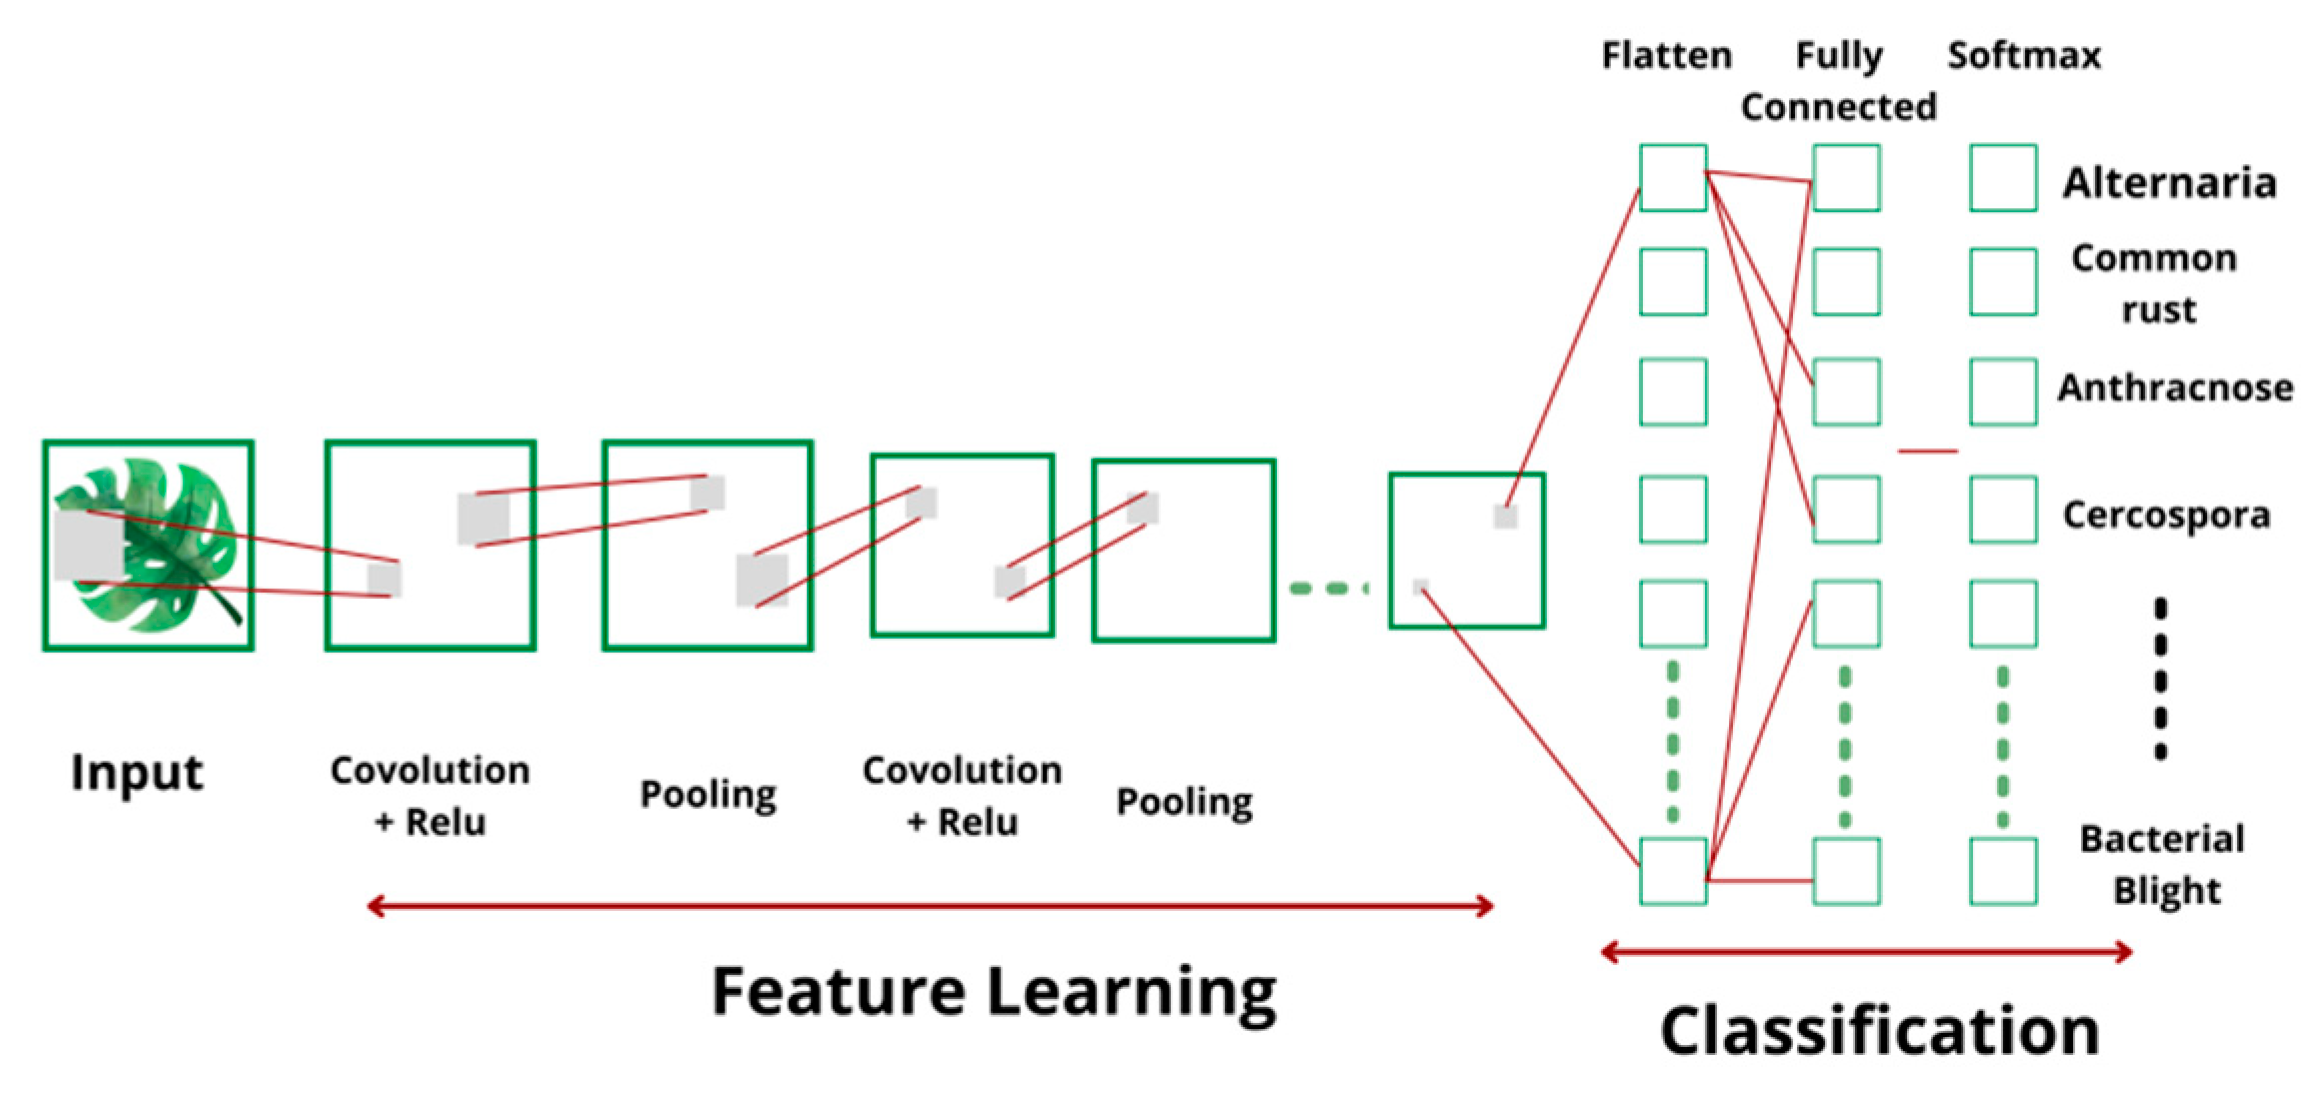
3.4.3. Convolutional Neural Networks

The architecture of CNN [18] used to categorize the disease and predict the severity is shown in the Figure 5. CNN is the most efficient and accurate classifier, with several advantages over other classifiers in terms of memory and training time. In CNN, the convolution layer is the vital part that encompasses a set of filters. These filters work independently and obtain the feature maps using convolution operation. The convolution operation is performed by applying a non-linear function on linear filter and input maps by including a bias and receiving an output feature map. Finally, it is expressed mathematically, as given in Equation (4):
X j I = f ( i I j X i I 1   W i j I + b j I ) .  
where f(.) represents the activation function, I j   represents the set of input maps, ‘l’ denotes the layer number, W i j I denotes the convolutional kernel, and bj represents bias. The most frequently used activation functions are tanh, sigmoid, and rectified linear unit (ReLU). In this work, ReLU was employed as the activation function, along with the Adam optimizer.
Figure 5. Convolutional neural network architecture.

4. Materials and Results

The proposed hybrid learning model was evaluated using the leaf disease dataset adapted from the UCI machine learning repository [19]. Since the features fetched from the available dataset were not enough to train CNN, more features were generated by synthesizing the extracted features.
Initially, the RGB color value of the image provided in the diseased leaf dataset wasconsidered as input. The input image was improved in terms of contrast and size, as shown in Figure 6 and Figure 7. Finally, the k-means clustering algorithm was used to segment the image into three segments—viz., disease-affected ROI, unaffected ROI, and background ROI. Figure 8 and Figure 9 depict how the disease-affected areas were segmented for various disease types.
Figure 6. Sample output ofcontrast enhancement for leaves affected by Alternaria.
Figure 7. Sample output of contrast enhancement for leaves affected by common rust.
Figure 8. Segmentation of the disease-affected ROI for leaves affected by common rust.
Figure 9. Segmentation of the disease-affected ROI for leaves affected by bacterial blight.
Out of the three segments, only the disease-affected ROI was analyzed to categorize the nature of the disease and assess the severity and extent of the diseased part. To accomplish this, features of the disease-affected ROI were fetched by constructing the GLCMs. In this matrix, disease symptoms were maintained by computing the values of the features—namely energy, entropy, mean, variance, standard deviation, skewness contrast, smoothness, correlation, kurtosis, homogeneity, root-mean-square (RMS) error and inverse differential moment (IDM), as shown in Figure 10. The sample GLCM values computed from the segmented image are presented in Table 1. Based on the calculated feature values, these features were matched against the values present in the training dataset. The extracted features were concatenated with the segmented leaf image into a single image matrix which was then fed into CNN to categorize the class of disease by comparing it with the existing disease classes. The model parameters used to train the CNN are depicted in Table 2.
Figure 10. Features extracted for diseases.
Table 1. Feature set for bacterial blight on leaves.
Table 2. CNN model parameters.
The result after applying CNN is shown in Figure 11. It also displays the symptoms, causes, and the methods to control the occurrence of the detected disease cercospora. The severity and extent of the disease we reassessed using the number of pixels present in disease-affected ROI expressed in Equation (5):
T o t a l   %   a f f e c t e d a r e a = #   o f a f f e c t e d l e a f p i x e l s T o t a l   #   o f p i x e l s 100
Figure 11. Sample classification output.

5. Discussion

The leaf disease database available in the UCI machine learning repository comprises of various species of different plant families. These include species with simple symmetric leaves and leaves with complex structures. Figure 12 depicts the scientific names of each plant family and the number of specimens of symmetric leaf images group according to species.
Figure 12. Schema of Plant Leaf Disease Dataset.
The proposed approach was tested with varying number of synthesized data. In the analysis, 70% of the existing images were used for training the algorithm and 30% were used for evaluating the model. Based on the results, the model was retrained by varying the multiple parameters for multiple epochs. Figure 13 depicts the accuracy of classification with different original vs. synthesized samples. Figure 14 illustrates the results of the disease-wise classification for five different diseases—viz., Alternaria, common rust, Anthracnose, Cercospora, and bacterial blight in different combinations of original vs. synthesized samples. To analyze the performance of the proposed approach, SVM classifier, ELM, and CNN were implemented and experimented using the proposed training dataset with 20% of synthesized data, and the results are presented in Figure 15, where it can be observed that in comparison with other algorithms, the proposed model yielded better classification results.
Figure 13. Classification accuracy concerning original features vs. synthesized samples.
Figure 14. Classification results of plant leaf diseases.
Figure 15. Comparison of hybrid learning model with other models.

6. Conclusions and Future Work

A hybrid learning model using k-means clustering algorithm and CNN for classifying various diseases in the leaves was proposed to classify the plant leaf images of different classes of plant. The proposed hybrid model was compared with some existing approaches used in plant leaf disease detection and was found to outperform the other models. In real-life scenarios, it is quite impossible to capture individual leaf images to identify a particular disease. This work can be extended to segregate the affected leaves from field images. Timely detection of plant diseases is an important step in increasing crop yield. In future study, the hybrid model can be improved further by employing transfer learning to inform farmers on a timely basis of the diseases affecting their crops.

Author Contributions

Conceptualization, D.N., L.R.P. and G.G.A.; methodology, D.N.; software, L.R.P.; validation, D.N., L.R.P. and G.G.A.; formal analysis, R.K.; investigation, R.K. and M.A.K.; resources, D.N.; data curation, D.N., L.R.P. and G.G.A.; writing—original draft preparation, D.N., L.R.P. and G.G.A.; writing—review and editing, R.K. and M.H.A.; visualization, A.J.; supervision, M.H.A.; project administration, M.A.K.; funding acquisition, M.H.A. All authors have read and agreed to the published version of the manuscript.

Funding

This research received no external funding.

Institutional Review Board Statement

Not applicable.

Data Availability Statement

Not applicable.

Conflicts of Interest

The authors declare no conflict of interest.

References

  1. Alsharif, M.H.; Kelechi, A.H.; Yahya, K.; Chaudhry, S.A. Machine learning algorithms for smart data analysis in internet of things environment: Taxonomies and research trends. Symmetry 2020, 12, 88. [Google Scholar] [CrossRef] [Green Version]
  2. Mainkar, P.M.; Ghorpade, S.; Adawadkar, M. Plant Leaf Disease Detection and Classification Using Image Processing Techniques. Int. J. Innov. Emerg. Res. Eng. 2015, 2, 139–144. [Google Scholar]
  3. Mitkal, P.; Pawar, P.; Nagane, M.; Bhosale, P.; Padwal, M.; Nagane, P. Leaf Disease Detection and Prevention Using Image processing using Matlab. Int. J. Recent Trends Eng. Res. 2016, 2, 2455–2457. [Google Scholar]
  4. Landge, P.S.; Patil, S.A.; Khot, D.S. Automatic Detection and Classification of Plant Disease through Image Processing. Int. J. Adv. Res. Comput. Sci. Softw. Eng. 2013, 3, 798–801. [Google Scholar]
  5. Jagtap, S.B.; Hambarde, S.M. Agricultural Plant Leaf Disease Detection and Diagnosis Using Image Processing Based on Morphological Feature Extraction. IOSR J. VLSI Signal Process. 2014, 4, 24–30. [Google Scholar] [CrossRef]
  6. Naikwadi, S.; Amoda, N. Advances in Image Processing for Detection of Plant Diseases. Int. J. Appl. Innov. Eng. Manag. 2013, 2, 168–175. [Google Scholar]
  7. Akar, O.; Gungor, O. Integrating multiple texture methods and NDVI to the random forest classification algorithm to detect tea and hazelnut plantation areas in northeast Turkey. Int. J. Remote Sens. 2015, 36, 442–464. [Google Scholar] [CrossRef]
  8. Halder, M.; Sarkar, A.; Bahar, H. Plant Disease Detection by Image Processing: A Literature Review. SDRP J. Food Sci. Technol. 2019, 3, 534–538. [Google Scholar] [CrossRef]
  9. Haralick, R.M.; Shanmugam, K.; Dinstein, I. Textural Features for Image Classification. IEEE Trans. Syst. Man Cybern. 1973, SMC-3, 610–621. [Google Scholar] [CrossRef] [Green Version]
  10. Golhani, K.; Balasundram, S.K.; Vadamalai, G.; Pradhan, B. A review of neural networks in plant disease detection using hyperspectral data. Inf. Process. Agric. 2018, 5, 354–371. [Google Scholar] [CrossRef]
  11. Moghimi, A.; Yang, C.; Marchetto, P. Ensemble Feature Selection for Plant Phenotyping: A Journey from Hyperspectral to Multispectral Imaging. IEEE Access 2018, 6, 56870–56884. [Google Scholar] [CrossRef]
  12. Sharif, M.; Khan, M.A.; Iqbal, Z.; Azam, M.F.; Lali, M.I.U.; Javed, M.Y. Detection and classification of citrus diseases in agriculture based on optimized weighted segmentation and feature selection. Comput. Electron. Agric. 2018, 150, 220–234. [Google Scholar] [CrossRef]
  13. Gadekallu, T.R.; Rajput, D.S.; Reddy, M.P.K.; Lakshmanna, K.; Bhattacharya, S.; Singh, S.; Jolfaei, A.; Alazab, M. A novel PCA–whale optimization-based deep neural network model for classification of tomato plant diseases using GPU. J. Real Time Image Proc. 2020, 18, 1383–1396. [Google Scholar] [CrossRef]
  14. Madiwalar, S.C.; Wyawahare, M.V. Plant disease identification: A comparative study. In Proceedings of the 2017 International Conference on Data Management, Analytics and Innovation (ICDMAI), Pune, India, 24–26 February 2017; pp. 13–18. [Google Scholar] [CrossRef]
  15. Shruthi, U.; Nagaveni, V.; Raghavendra, B.K. A review on machine learning classification techniques for plant disease detection. In Proceedings of the 2019 5th International Conference on Advanced Computing & Communication Systems (ICACCS), Coimbatore, India, 15–16 March 2019; pp. 281–284. [Google Scholar]
  16. Hlaing, C.S.; Zaw, S.M.M. Plant diseases recognition for smart farming using model-based statistical features. In Proceedings of the 2017 IEEE 6th Global Conference on Consumer Electronics (GCCE), Nagoya, Japan, 24–27 October 2017; pp. 1–4. [Google Scholar] [CrossRef]
  17. Sankaran, K.S.; Vasudevan, N.; Nagarajan, V. Plant disease detection and recognition using K means clustering. In Proceedings of the 2020 International Conference on Communication and Signal Processing (ICCSP), Chennai, India, 28–30 July 2020; pp. 1406–1409. [Google Scholar] [CrossRef]
  18. Verma, S.; Chug, A.; Singh, A.P. Application of convolutional neural networks for evaluation of disease severity in tomato plant. J. Discret. Math. Sci. Cryptogr. 2020, 23, 273–282. [Google Scholar] [CrossRef]
  19. Silva, P.F.B.; Marcal, A.; da Silva, R.A. Evaluation of Features for Leaf Discrimination. In Image Analysis and Recognition; ICIAR 2013; Lecture Notes in Computer Science; Springer: Berlin/Heidelberg, Germany, 2013; Volume 7950, pp. 197–204. [Google Scholar] [CrossRef]
Publisher’s Note: MDPI stays neutral with regard to jurisdictional claims in published maps and institutional affiliations.

Article Metrics

Citations

Article Access Statistics

Multiple requests from the same IP address are counted as one view.